Back to Journals » OncoTargets and Therapy » Volume 13
Construction and Analysis of a Long Non-Coding RNA-Associated Competing Endogenous RNA Network Identified Potential Prognostic Biomarkers in Luminal Breast Cancer
Authors Jiang Z, Cheng P, Luo B, Huang J
Received 3 December 2019
Accepted for publication 26 April 2020
Published 18 May 2020 Volume 2020:13 Pages 4271—4282
DOI https://doi.org/10.2147/OTT.S240973
Checked for plagiarism Yes
Review by Single anonymous peer review
Peer reviewer comments 2
Editor who approved publication: Dr Jianmin Xu
Zhou Jiang,1 Pu Cheng,2 Biyuan Luo,3 Jian Huang1
1Department of Breast Surgery, Second Affiliated Hospital, Zhejiang University School of Medicine; Key Laboratory of Tumor Microenvironment and Immune Therapy of Zhejiang Province, Hangzhou, Zhejiang, People’s Republic of China; 2Department of Gynecology, Second Affiliated Hospital, Zhejiang University School of Medicine; Key Laboratory of Tumor Microenvironment and Immune Therapy of Zhejiang Province, Hangzhou, Zhejiang, People’s Republic of China; 3Cancer Center, Xiangya 2nd Hospital, Central South University, Changsha, Hunan, People’s Republic of China
Correspondence: Jian Huang Email [email protected]
Purpose: To construct a competing endogenous RNA (ceRNA) topology network of RNA-seq data and micro RNA-seq (miRNA-seq) data to identify key prognostic long non-coding RNA (lncRNAs) in luminal breast cancer, and validate the results by human luminal breast cancer samples.
Materials and Methods: The RNA-seq data and miRNA-seq data of luminal A breast cancer in the The Cancer Genome Atlas (TCGA) database were downloaded and compared with those in the miRcode database to obtain lncRNA–miRNA relationship pairs. Final target genes were predicted by all three databases (miRDB, miRTarBase, and TargetScan), thereby obtaining the miRNA-messenger RNA (miRNA-mRNA) relationship pairs and a ceRNA topology network was constructed, then mRNA enrichment analysis, ceRNA topological and stability analysis, univariate and multivariate Cox regression analysis were performed. Overall survival (OS) was evaluated and the key prognostic RNAs were identified. The expression difference between normal and tumor, as well as the correlation of high expression in tumor with pathological parameters (Ki-67, Grade, tumor diameter) were validated by human breast cancer specimens.
Results: A ceRNA topology network was constructed and six lncRNAs were finally identified (The higher expression of PART1, IGF2.AS, WT1.AS, OIP5.AS1, and SLC25A5.AS1 was associated with poor prognosis while AL035706.1 was adverse) and the poor prognostic ones were higher expressed in tumor tissue and correlated with a higher Ki-67 (> 10%), tumor grades (II, III) and tumor diameters (> 1.5 cm). Using six lncRNAs, we constructed a prognostic model, which performed well for the classification of prognosis in the module.
Conclusion: We identified and verified six biomarkers (OS-predicting) in luminal breast cancer, which significantly enriched the prediction and potential targets of this subtype.
Keywords: competing endogenous RNA, breast cancer, long non-coding RNA, prognosis, clinical sample
Introduction
Breast cancer (BC) is a major concern, both morbidity and mortality, for women worldwide.1 Four subtypes of breast cancer (BC) defined by the estrogen receptor (ER), progesterone receptor (PR), and human epidermal growth factor receptor 2 (HER-2) exhibit differences in biological behavior. The molecular mechanism behind them remains unclear. The current target-therapies are mostly concentrated on HER-2 overexpressed subtype, such as Trastuzumab and Pertuzumab,2,3 while immunotherapies are aimed at triple-negative breast cancer (TNBC) due to its higher immunogenicity.4,5 Quite a number of prognostic markets and targets were identified.6–8 Unlike the two subtypes, patients with ER- or PR-positive BC, termed luminal subtype, are considered at a lower risk and endocrine therapy has achieved a considerable success. However, the outcome of luminal BC rather varies after treatment9 and drug resistance is urgent to be responded. mTOR inhibitors and CDK4/6 inhibitors showed potential to solve the problem. Their clinical effective suggests that molecular target therapy could also be a wise strategy for luminal BC. Therefore, the identification of prognostic markers, which can be potential targets, is of importance. Recently, genes or proteins were proved to be an oncogene role or promoting metastasis in the luminal subtype,10–13 while little were verified to be related to overall survival (OS). Moreover, most of them were genomic, along with some microRNAs (miRNA), while Long non-coding RNAs (lncRNA) were rarely mentioned.
LncRNA, a type of RNA with limited protein-coding ability, is previously viewed as transcriptional “noise” without biological functions.14 Recently, lncRNAs are increasingly reported to be closely involved in progression and metastasis of various cancers.15–18 In luminal BC, the oncogenic roles of lncRNAs were also unveiled19,20 but rare, especially specific on luminal BC. And crosstalks between lncRNAs and miRNAs were also identified. For example, lncRNA BLACAT1 was found to promote MCF7 (luminal BC cell) proliferation and metastasis by miR-150-5p/CCR2.21 In addition, prognostic roles and relationship with tamoxifen resistance were also mentioned.13,22
Recently, competitive endogenous RNA (ceRNA), as a whole view of transcription, has gradually become a useful tool for identifying prognostic lncRNAs. The ceRNA hypothesis suggests that lncRNAs can competitively bind to miRNAs, thereby preventing their binding to mRNA, and consequently regulating mRNA expression.23 The competitive relationship influences the inhibition of miRNAs to mRNAs, resulting in downstream pathological processes like osteoarthritis, cerebral ischemia, and cancers.24–27 However, the prognosis function of lncRNAs in breast cancer, especially luminal, is less known.
In the study, a ceRNA network was constructed by integrating analysis of several databases and six lncRNAs PART1, IGF2.AS, WT1.AS, OIP5.AS1, SLC25A5.AS1, and AL035706 were identified and verified by human breast cancer specimens. Further, a prognostic model consisted of them was constructed.
Materials and Methods
Download of Data and Pre-Processing
RNA-seq data and mRNA-seq data of BC were obtained from The Cancer Genome Atlas (TCGA) database.28 Samples meet requirements were screened to obtained three matrix files of mRNA, lncRNA, and miRNA expression profiles: 1) female samples; 2) positive for at least one of the Estrogen receptor (ER) or Progesterone receptor (PR) in the cancer samples; 3) both RNA-seq and miRNA-seq data. 4) miRNAs with a ratio of zero values ≤75%.
Relationship with Prediction
The miRcode29 is a database based on the human complete transcriptome of GENCODE annotations to predict miRNA targets, through which we obtained the lncRNA–miRNA relationship files. The miRDB30 is a miRNA target gene prediction database based on high-throughput sequencing experiments. miRTarBase31 is a database of integrated, experimentally validated miRNA targets. TargetScanS32 predicts miRNA target genes by searching for conserved 8 mer and 7 mer positions that match miRNA seed sequences point. The three databases are currently used for miRNA target gene predictions. Through this approach, the miRNA–mRNA relationship pair files were screened.
Relationship Screening
Pearson correlation coefficient was calculated between the lncRNA and miRNA in the lncRNA–miRNA relationships, and the miRNA and mRNA in the miRNA–mRNA relationships. The significant negative correlation (p<0.05) relationship pairs, which served as a pre-selected ceRNA regulatory relationship, were screened.
Building a ceRNA Network
Files that were only in the lncRNA–miRNA or miRNA–mRNA relationship files were excluded and the remained lncRNA–miRNA and miRNA–mRNA files were merged, and visualized by the Cytoscape software.
mRNA Enrichment Analysis in the ceRNA Network
KEGG is a group of databases ranging from genomes, biological pathways, and associated diseases, even drugs and chemical materials.33 Gene ontology analysis (GO) is commonly used for interaction network analysis of genes and their RNA or protein products.34 By KEGG and GO, mRNA enrichment analysis was performed in the ceRNA network.
Topological Analysis and Stability Analysis of the ceRNA Network
The topology properties of the network were analyzed using the NetWorkAnalyzer toolKit 10 in Cytoscape9.35,36 The NetWork Analyzer mainly includes network distribution, number of connections, average aggregation coefficient, etc. In the present study, we calculated the number of connections, the length of the path, and the proximity center of the node.
Prognostic Analysis of ceRNA Modules
The clinical information of the above samples was download from the TCGA database, and then the survival data of each sample were extracted, which combined the previously obtained expression spectrum data to perform a Cox survival analysis on the lncRNA nodes in the network then identify prognostic lncRNAs.
Single-Factor Regression, Multivariate Cox Regression Analysis, and Survival Analysis
Multivariate Cox regression analysis and survival analysis were performed on prognostic lncRNAs by SPSS 19.0, and then a prognostic model was constructed and survival curves were plotted.
Patients and Tissue Samples
Paired tumor specimens and their adjacent non-tumor tissues were derived from 20 luminal A patients who underwent surgical resection at Second Affiliated Hospital, Zhejiang University School of Medicine (Hangzhou, China) between Jan 2019 and May 2019. All patients recruited in the study received no pre-operative chemotherapy or radiotherapy. Specimens were frozen in liquid nitrogen immediately and stored at −80°C. This study was approved by the Ethics Committees of Second Affiliated Hospital, Zhejiang University School of Medicine.
RNA Extraction and RT-qPCR Analysis
Using Trizol Reagent (Invitrogen), total RNA was extracted from tissues. A total of 2 μg RNA was reverse transcribed to cDNA according to the PrimeScript RT reagent Kit (TaKaRa, Dalian, China). Then, qPCR assay was performed by the SYBR Premix Ex Taq™ II kit (TaKaRa), primers, and cDNA templates on the ABI PRISM 7900 Sequence Detection System (Applied Biosystems, Foster City, CA, USA). The 2−ΔΔCt method was used for data quantification. GAPDH was set as the internal control. The sequences of six lncRNAs were as follows
IGF2-AS: Forward primer CCTGCCTAGAGCTCCCTCTT;
Reversed Primer CCATCCTCACCCAGGAACAG.
WT1-AS: Forward primer CTTTCGACTAGCGCCTCTCC;
Reversed primer CTTTCGACTAGCGCCTCTCC.
OIP5-AS1: Forward primer CCTCATGCAGTGCCATCTGA;
Reverse primer TATCCACCTTGGGTTGCAGG.
SLC25A5-AS1: Forward primer AGCGGCATCTGTCATGTTGA;
Reverse primer AAATCGGCCATTTGCTTCGC.
AL035706.1-201: Forward primer GCCAAAGTGCTGGGATTACA;
Reverse primer GCCACGGGAATCAAATAAGA.
PART1: Forward primer AAACGCCTGAGGACTGAGAA
Reverse primer TCTCCTGCTTGCCAAATCTT
Logistic Regression Analysis for Pathological Parameters
Using Ki67 (1 ≤ 10%, 0 = ≤10%), Grade (1 = Ⅲ, 0 = Ⅰ or Ⅱ), diameter (1 ≤ 1.5, 0 = ≤1.5), age (1 ≤ 50, 0 = ≤50), pathological types (1 = invasive, 0 = non-invasive), and the surgical strategy (1 = conservation, 0 = radical) as the dependent variables and the expression of six prognostic lncRNAs as the independent variable to perform binary logistic regression analysis. P < 0.05 is considered as a statistically significant difference. Stata 12.0 was used for statistical analysis.
Results
lncRNA–miRNA Relationship
From TCGA, the RNA-seq data contained 113 normal samples and 1102 cancer samples and the miRNA-seq data contained 104 normal samples and 1096 cancer samples were download. After screening, we got 884 samples, including 102 normal samples and 782 cancer samples. Subsequently, we extracted the expression profiles of mRNA and lncRNA from the matrix files obtained from the RNA-seq data. An expression profile of 14,166 lncRNAs was revealed, and by miRcode, we further identified 7098 pairs of lncRNA–miRNA, including 1449 lncRNAs and 35 miRNAs.
miRNA–mRNA Relationship
An expression profile containing 2253 miRNAs was collected. After excluding miRNAs with a ratio of zero values >75% in all samples, 875 miRNAs remained. Using miRDB, miRTarBase, and TargetScan to predict the target genes of these miRNAs, we obtained 19,616 pairs, including 5322 target genes simultaneously predicted by all three databases and 785 miRNAs.
Relationship Filtering
By screening, we obtained 295 pairs of lncRNA–miRNA and 3204 pairs of miRNA–mRNA. After a future filtering of the non-compliant relationship, we finally identified 240 pairs of lncRNA–miRNA and 115 pairs of mRNA–miRNA. Several of those were shown in Tables 1 and 2.
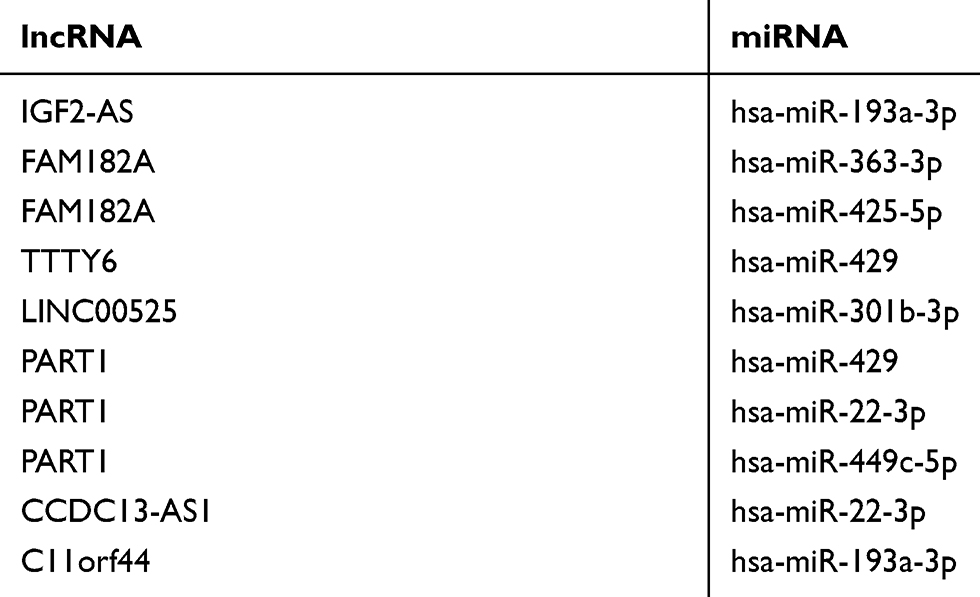 |
Table 1 Several of the lncRNA–miRNA Pairs Obtained from This Analysis |
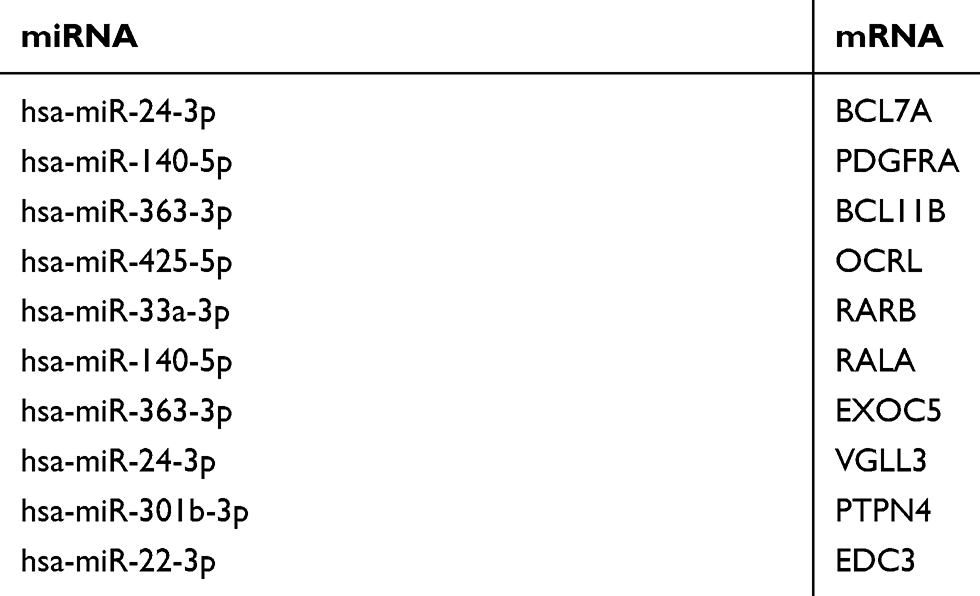 |
Table 2 Several of the miRNA–mRNA Pairs Obtained from This Analysis |
Construction and Visualization of the ceRNA Network
After combining the aforementioned 240 pairs of lncRNA–miRNA and 115 pairs of mRNA–miRNA, we used the Cytoscape software for network visualization to obtain a ceRNA network map. The network map contained 356 edges and 288 nodes, including 160 lncRNAs, 15 miRNAs, and 113 mRNAs (Figure 1).
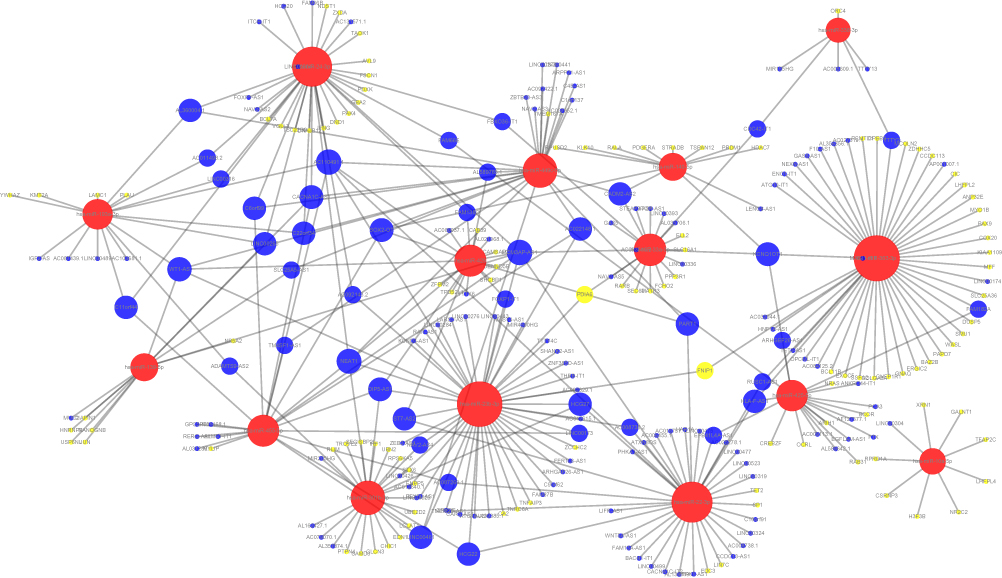 |
Figure 1 Diagram of the ceRNA network. Red point: miRNA; blue point: lncRNA; yellow point: mRNA. The size of the node point represents the degree of the node. Higher degrees indicate larger points. |
Topological Analysis and Stability of the ceRNA Network
Topological analysis showed the distribution of the degree of nodes (Figure 2A). The degree of most nodes was low. Only a small number showed a high degree, suggesting that these nodes acted as a hub for the entire network.
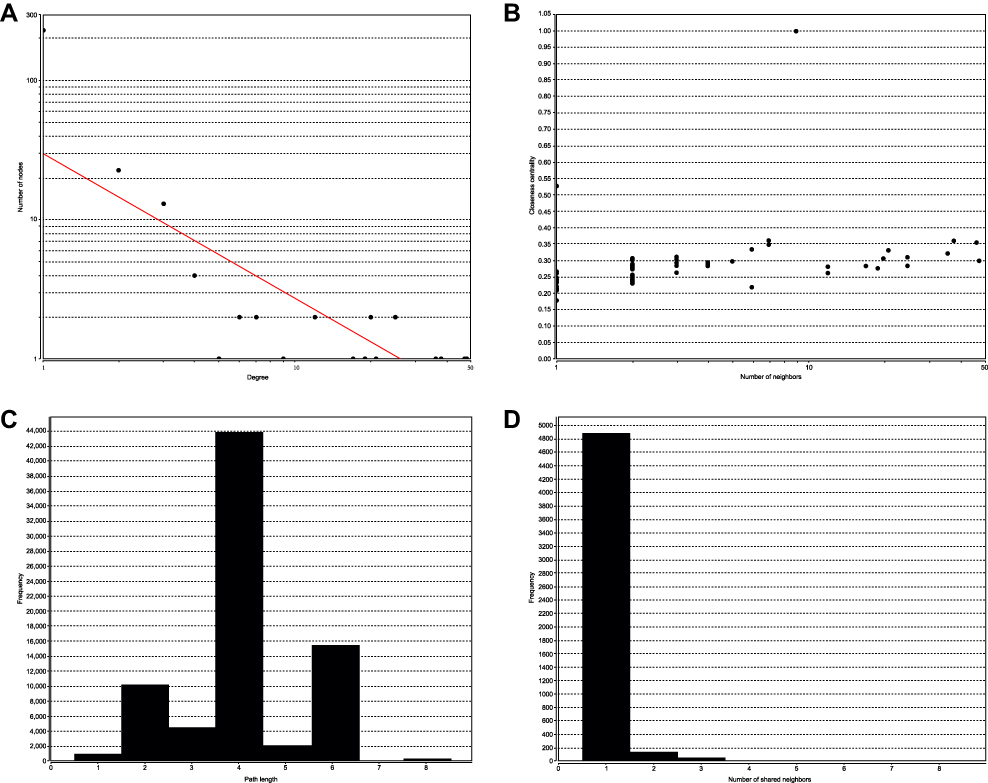 |
Figure 2 Topological analysis and stability analysis of the ceRNA network. (A) Node degree distribution map. (B) Closeness Centrality distribution map. (C) Shortest path distribution map. (D) The density map of node degree distribution. |
The Closeness centrality (CC) of the node could be used to calculate the number of connection steps between nodes. The more concentrated nodes yield higher scores; thus, the CC indicated the shortest path. Figure 2B illustrated that nodes with a relatively low number of connections were relatively concentrated, whereas those with higher connectivity were scattered.
The path reflected the combination of all nodes in the network. Figure 2C showed the shortest path length distribution, suggesting that the path length distribution was concentrated, as the extreme values at both ends were lower. The upper and lower limit was 8 and 1, respectively, indicating that most nodes in the network could be connected through a shorter path.
The density map of node degree distribution is shown in Figure 2D. We found that node density decreased sharply with an increase in node degree, suggesting that most nodes in the network were isolated. In the process of disease, only a few key nodes changed and interacted with adjacent nodes. Subsequently, co-expression occurred, which in turn triggered the downstream biological processes.
Enrichment Analysis
In order to observe the function of the constructed ceRNA network, we selected all the mRNAs included in the network to perform functional enrichment analysis.37
The results of the Gene Ontology (GO) analysis of the ceRNA network showed that most of the enriched biological processes were related to blood agglutination and hormones, suggesting that hormone regulation may be the main processes, by which key RNAs involved in the development of BC (Figure 3A).
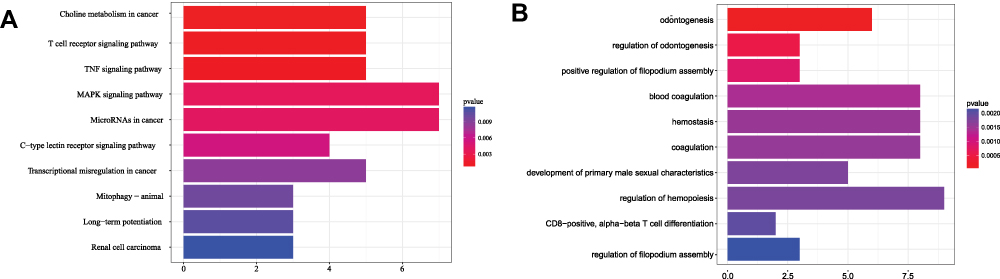 |
Figure 3 Results of the enrichment analysis. (A) GO and (B) KEGG. |
The Kyoto Encyclopedia of Genes and Genomes (KEGG) pathway enrichment analysis revealed that choline metabolism, T-cell receptor signaling, the tumor necrosis factor signaling pathway, and the mitogen-activated protein kinase signaling pathway were related to the key nodes of the ceRNA (Figure 3B).
lncRNA Node Survival Analysis
The 160 lncRNAs included in the network were subjected to Cox survival analysis, and six lncRNAs significantly correlated with OS were identified (P<0.05); PART1, IGF2.AS, WT1.AS, OIP5.AS1, and SLC25A5.AS1 were associated with an adverse OS (HR>1) while AL035706.1 with a good one (HR<1) (Table 3).
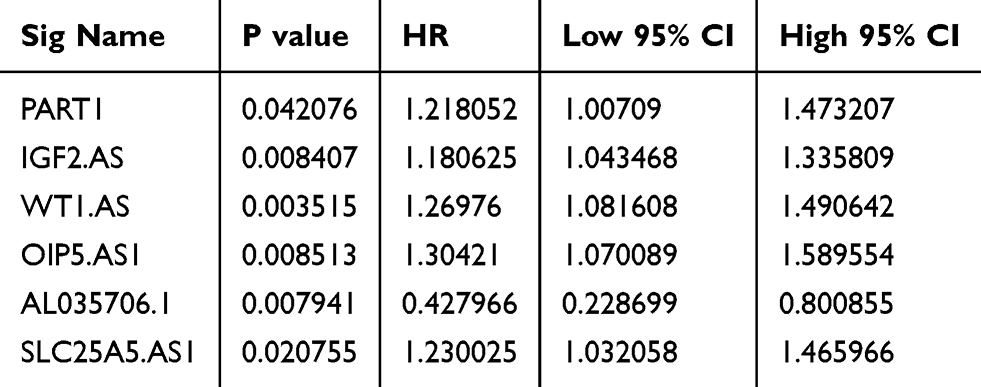 |
Table 3 Prognosis-Related lncRNAs in the ceRNA Network |
Prognosis-Related lncRNA Molecules as Potential Markers
We performed single-factor regression on the six identified lncRNAs, and the forest map was shown in Figure 4. The high expression of five of those was associated with poor prognosis, whereas the low expression level of the remaining one lncRNA was associated with poor prognosis.
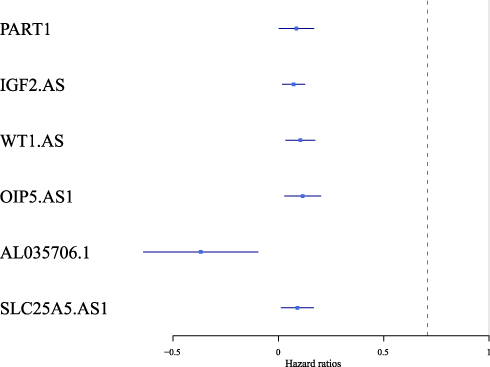 |
Figure 4 Forest map of the six identified prognosis-related lncRNAs. |
Different Expression of Six lncRNAs Between Normal and Tumor Tissue of Breast Cancer Patients
We next verified six lncRNAs expression by clinical samples. Ten pairs of normal and tumor tissue from fresh human breast cancer specimens (ER+) were collected and examined the expression of six lncRNAs. The results showed that among five adverse-OS ones, PART1, IGF2.AS, WT1.AS, and SLC25A5.AS1 significantly higher expressed in tumor than normal, especially for PART1. While OIP5.AS1 expressed no difference between normal and tumor. AL035706.1 was higher expressed in normal, which was consistent with the former results (Figure 5).
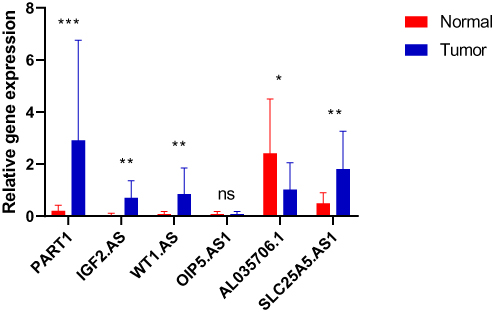 |
Figure 5 The expression of the six identified prognosis-related lncRNAs between normal and tumor tissue of luminal breast cancer specimens collected from our center. N=20; *P<0.05, **P<0.01, ***P<0.001. |
The Expression of Six lncRNAs Correlates with Higher Pathological Parameters
To evaluate whether six lncRNAs’ expression correlated with pathological parameters or not, we chose the Ki-67, tumor grades and tumor diameters of patients to help perform the logistic regression analysis. We found that the expression of PART1 was significantly in accordance with all three parameters, and AL035706.1 was adverse with three parameters but had not reached a significant difference. The higher expression of WT1.AS and SLC25A5.AS1 was associated with an advanced grade and the higher expression of OIP5.AS1 with a higher Ki-67. However, IGF2.AS did not show a relation with the parameters in our samples. To exclude the other clinical parameters’ influence, we also evaluated the age, pathological types, and surgical strategies, and the results were negative (Table 4).
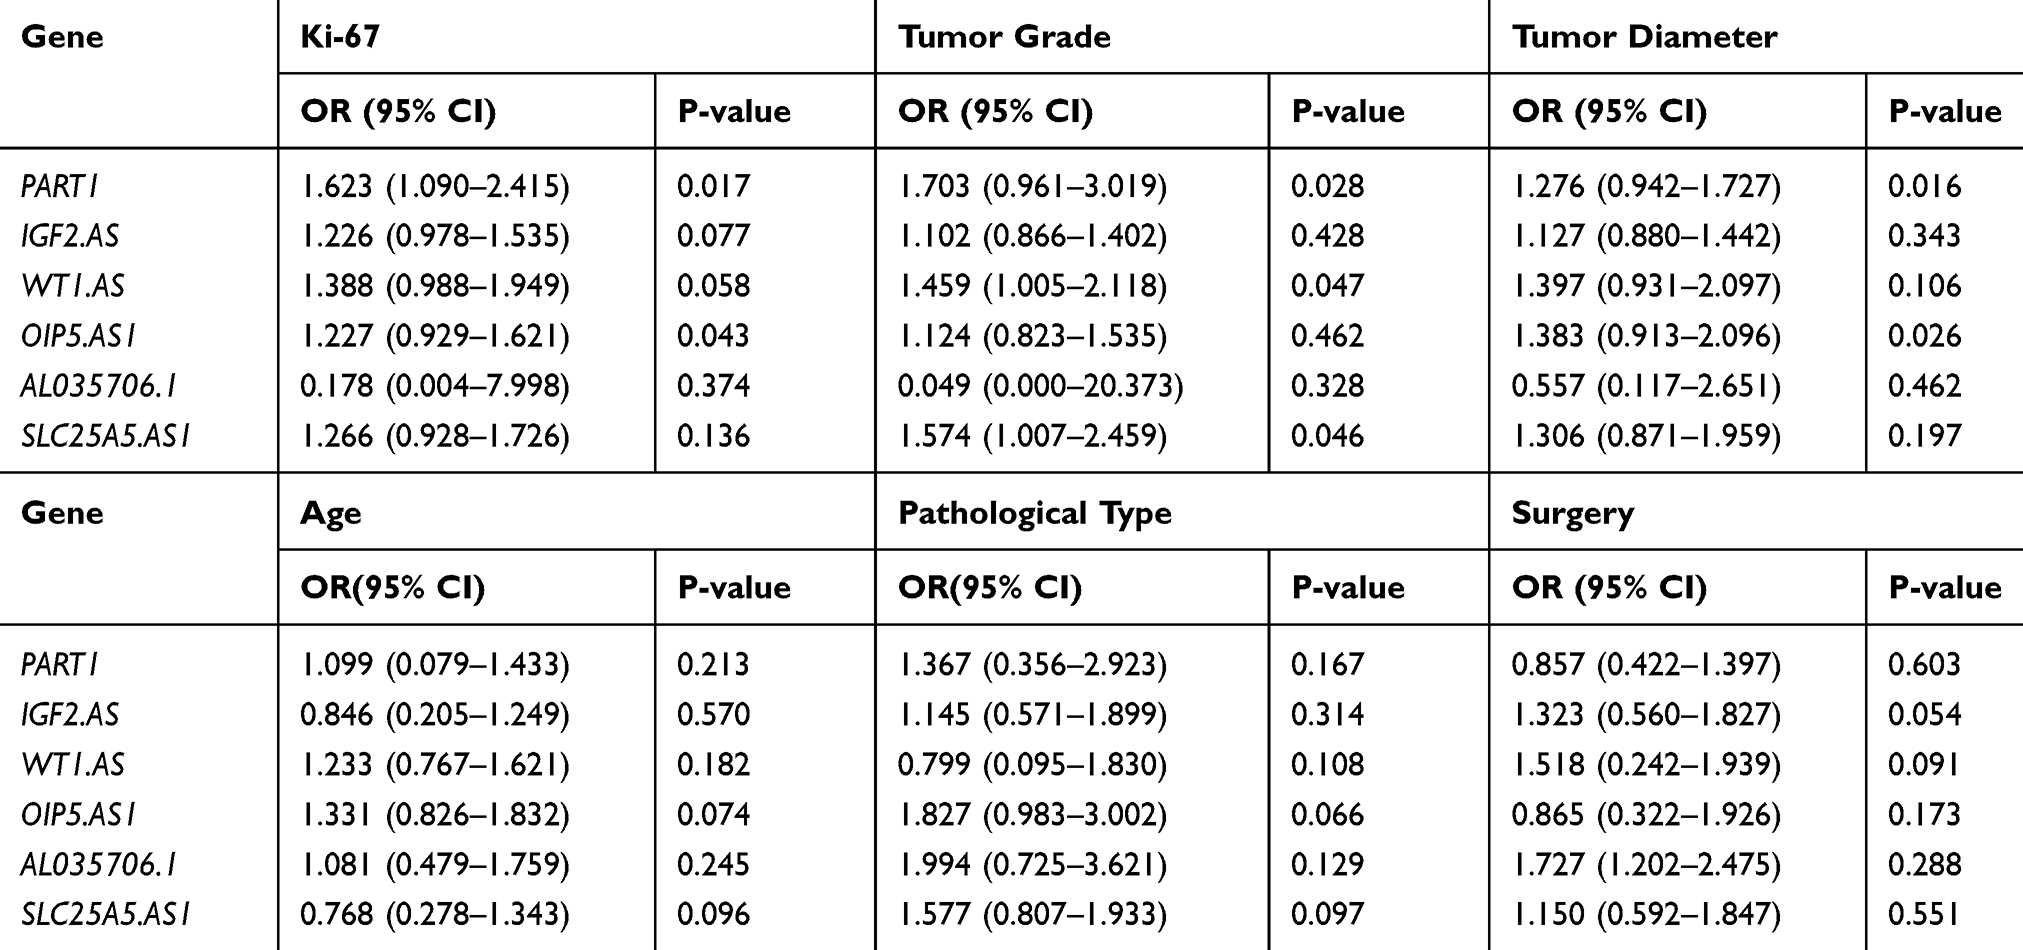 |
Table 4 The Correlation Between Prognosis-Related lncRNAs and Pathological Parameters in Clinical Samples |
Prognostic Model of lncRNA
Further, we used the expression profiles of these six lncRNAs in a multivariate Cox regression analysis to construct a prognostic model: the Risk Score = (0.0906×PART1) + (0.1506×IGF2.AS) + (0.2048×WT1.AS) + (0.2087×OIP5.AS1) − (0.8068×AL035706.1) + (0.2072×SLC25A5.AS1). Subsequently, we calculated the risk coefficient by taking the expression profile of each lncRNA into the model. The samples were classified according to the median risk coefficient. As shown in Figure 6, the high-risk group had significantly more deaths than the low-risk group. Moreover, a higher risk coefficient was linked to a higher expression level for lncRNAsPART1, IGF2.AS, WT1.AS, OIP5.AS1, and SLC25A5.AS1. The opposite was observed for AL035706.1.
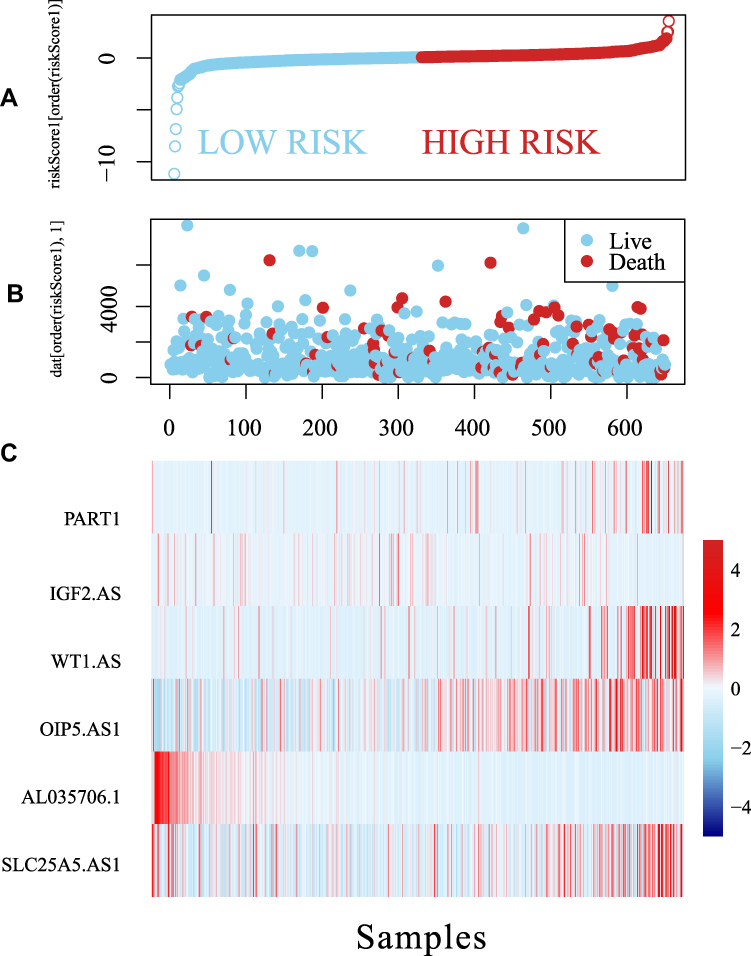 |
Figure 6 The relationship between the expression of the six identified lncRNAs and risk scores. The horizontal axis represents the risk coefficient score of the sample, increasing from left to right. |
As shown in Figure 7A, we performed a survival analysis and plotted Kaplan–Meier curves to determine prognostic differences between the high- and low-risk samples of the model. A significant difference in prognosis was observed between the two groups. In order to verify the heterogeneity and stability of the model, we analyzed the Receiver operating characteristic (ROC) curve of the model, as shown in Figure 7B. The prognostic model exhibited a markedly greater area under the curve, and prognosis was classified as high and low risk according to these six lncRNAs. These findings suggested that the six identified lncRNAs may serve as meaningful prognostic markers.
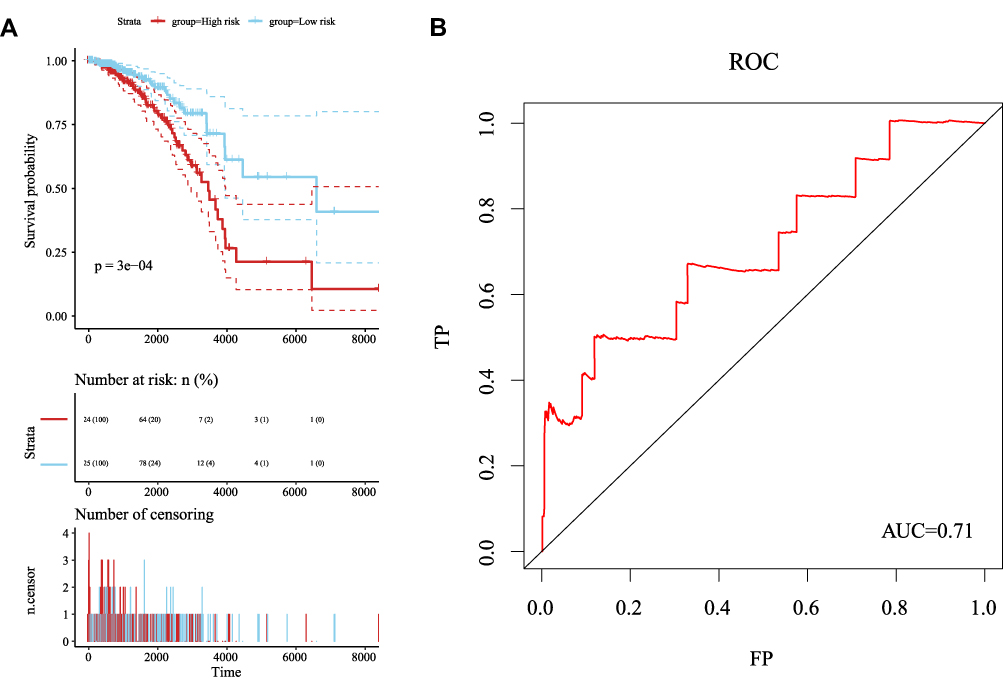 |
Figure 7 (A) Kaplan–Meier curves from the multivariate regression analysis for the prognostic classification of the six lncRNAs. (B) ROC curve from the multivariate regression analysis for the six lncRNAs. |
Discussion
Luminal BC is the most common type of whole BC.9 Owing to advanced screening and endocrine therapy, some success in the treatment of luminal BC has recently been achieved. However, the mortality rate has not declined, partly because of a lack of efficient biomarkers. Considering the existed heterogeneity of luminal BC reflected by its inconsistent clinical outcomes, it is necessary to discover effective biomarkers, especially for luminal BC. Previous researches have shown several dysregulated genes that involved in the progression of BC and possessed great potential to be used as biomarkers. However, these markers focused on TNBC or distant metastasis.6–8,10–13 Recent studies have revealed that lncRNAs played vital roles in the development of cancers.21,22 Further, germline mutations can also predict tumor recurrence in breast cancer patients.38 In the present study, we used ceRNA to detect and validate potential prognostic lncRNAs in the luminal BC.
Firstly, using TCGA database, we obtained the RNA-seq data and miRNA-seq data of BC. These data were compared with the data in the miRcode29 database to get 7089 pair files of the lncRNA–miRNA relationship. Subsequently, we defined the miRNA-targeted genes that were predicted by all three databases (miRDB, miRTarBase and TargetScan) as the final target genes, thereby obtaining 19,616 pair files of the miRNA–mRNA relationship. After screening, 240 pairs of lncRNA–miRNA and 115 pairs of mRNA–miRNA remained. Thus, a ceRNA topology network with 356 edges and 288 nodes, including 160 lncRNAs, 15 miRNAs, and 113 mRNAs was constructed. Through topological analysis, we observed that only a small number exhibited a high degree, suggesting that these act as hubs for the entire network. Most nodes in the network can be connected through shorter path correlation and showed isolation. This result indicates that only a few co-expressed key nodes change and interact with adjacent nodes in the process of BC, which in turn triggered the downstream biological processes. Subsequently, we used the GO and KEGG databases to perform enrichment analyses to elucidate involved biological process and pathways.37 The analyses suggested that hormone regulation, choline metabolism, T-cell receptor signaling, the tumor necrosis factor (TNF), and the mitogen-activated protein kinase (MAPK) signaling pathway were involved in the development of BC. After Cox survival analysis, six lncRNAs, namely PART1, IGF2.AS, WT1.AS, OIP5.AS1, AL035706.1, and SLC25A5.AS1, significantly correlated with the prognosis were finally identified. According to single-factor regression and forest map analysis, the high expression level of PART1, IGF2.AS, WT1.AS, OIP5.AS1, and SLC25A5.AS1 was associated with poor prognosis, while the low expression of AL035706.1 was linked to poor prognosis. Furthermore, we used the expression profiles of these six lncRNAs in a multivariate Cox regression analysis to construct a prognostic model. The survival analysis and Kaplan–Meier curves showed a significant difference in prognosis between the high- and low-risk groups classified by the model, and a markedly greater area under the curve verified the heterogeneity and stability of the model.
More importantly, 20 normal and tumor paired luminal breast cancer specimens were collected to examined six prognostic lncRNAs’ expression and their correlation with clinical pathological parameters. We verified that five poor-prognostic lncRNAs were higher expressed in tumor than normal, and their expression, except for IGF2.AS, was associated with, to a degree, adverse parameters, such as Ki-67, grade, and tumor diameter. The results supported that these lncRNAs had a specification in tumor so that could be candidate prognostic markers. As for the positive-prognostic one, AL035706.1 was higher expressed in the normal tissue and showed a tendency, but not a significance, to oppose adverse parameters. For this, we supposed a larger number of specimens could give a definite conclusion.
We found six potential lncRNAs, namely PART1, IGF2.AS, WT1.AS, OIP5.AS1, AL035706.1, and SLC25A5.AS1. Only the high expression of AL035706.1 predicted a better prognosis, others were all with worse. Consistent with our findings, it was previously reported that PART1 could predict early recurrence in patients with hepatocellular carcinoma after curative resection, and modulate the toll-like receptor (TLR) pathway to influence cell proliferation and apoptosis in prostate cancer cells.39–41 The research showed that IGF2.AS was related to metabolism, and inhibition of IGF2.AS promoted angiogenesis in patients with type 2 diabetes.42 While the other four lncRNAs have not been well investigated thus far and all of their prediction in OS were not mentioned. We proposed that they may be promising new targets for further researches.
Conclusion
In the present study, we comprehensively analyzed several databases to construct a ceRNA network in luminal BC and identify six OS-related lncRNAs, by which a prognosis prediction module was constructed. The six lncRNAs’ higher expression and pathological features were verified by our paired breast cancer specimen. Therefore, we proposed that these six lncRNAs can be useful biomarkers for predicting the prognosis of patients with luminal BC.
Ethics and Consent Statement
This study was performed in accordance with standard guidelines and was approved by the Ethics Committee of the Second Affiliated Hospital, Zhejiang University School of Medicine. All patients provided written informed consent, in accordance with the Declaration of Helsinki.
Acknowledgments
This study was funded by the National Natural Science Foundation of China (Grant no. 81902629, PC)
Disclosure
The authors declare that they have no known competing financial interests or personal relationships that could have appeared to influence the work reported in this paper.
References
1. DeSantis CE, Miller KD, Goding Sauer A, Jemal A, Siegel RL. Cancer statistics for African Americans, 2019. CA Cancer J Clin. 2019;69(3):211–233. doi:10.3322/caac.21555
2. Cameron D, Piccart-Gebhart MJ, Gelber RD, et al. 11 years’ follow-up of trastuzumab after adjuvant chemotherapy in HER2-positive early breast cancer: final analysis of the HERceptin Adjuvant (HERA) trial. Lancet. 2017;389(10075):1195–1205. doi:10.1016/S0140-6736(16)32616-2
3. von Minckwitz G, Procter M, de Azambuja E, et al. Adjuvant pertuzumab and trastuzumab in early HER2-positive breast cancer. N Engl J Med. 2017;377(2):122–131. doi:10.1056/NEJMoa1703643
4. Kim IS, Gao Y, Welte T, et al. Immuno-subtyping of breast cancer reveals distinct myeloid cell profiles and immunotherapy resistance mechanisms. Nat Cell Biol. 2019;21(9):1113–1126. doi:10.1038/s41556-019-0373-7
5. Bareche Y, Buisseret L, Gruosso T, et al. Unraveling triple-negative breast cancer tumor microenvironment heterogeneity: towards an optimized treatment approach. J Natl Cancer Inst. 2019. doi:10.1093/jnci/djz208
6. Tang H, Huang X, Wang J, et al. circKIF4A acts as a prognostic factor and mediator to regulate the progression of triple-negative breast cancer. Mol Cancer. 2019;18(1):23. doi:10.1186/s12943-019-0946-x
7. Braicu C, Raduly L, Morar-Bolba G, et al. Aberrant miRNAs expressed in HER-2 negative breast cancers patient. J Exp Clin Cancer Res. 2018;37(1):257. doi:10.1186/s13046-018-0920-2
8. Yeong J, Lim JCT, Lee B, et al. Prognostic value of CD8 + PD-1+ immune infiltrates and PDCD1 gene expression in triple negative breast cancer. J Immunother Cancer. 2019;7(1):34. doi:10.1186/s40425-019-0499-y
9. Siegel RL, Miller KD, Jemal A. Cancer statistics, 2019. CA Cancer J Clin. 2019;69(1):7–34. doi:10.3322/caac.21551
10. Arbitrio M, Scionti F, Altomare E, et al. Polymorphic variants in NR1I3 and UGT2B7 predict taxane neurotoxicity and have prognostic relevance in breast cancer patients: a case-control study. Clin Pharmacol Ther. 2019;106:422–431. doi:10.1002/cpt.1391
11. Vendrell JA, Solassol J, Gyorffy B, et al. Evaluating ZNF217 mRNA expression levels as a predictor of response to endocrine therapy in ER+ breast cancer. Front Pharmacol. 2018;9:1581. doi:10.3389/fphar.2018.01581
12. Li M, Li A, Zhou S, Lv H, Yang W. SPAG5 upregulation contributes to enhanced c-MYC transcriptional activity via interaction with c-MYC binding protein in triple-negative breast cancer. J Hematol Oncol. 2019;12(1):14. doi:10.1186/s13045-019-0700-2
13. Sun W, Xu X, Jiang Y, et al. Transcriptome analysis of luminal breast cancer reveals a role for LOL in tumor progression and tamoxifen resistance. Int J Cancer. 2019;145(3):842–856. doi:10.1002/ijc.32185
14. Ponting CP, Oliver PL, Reik W. Evolution and functions of long noncoding RNAs. Cell. 2009;136(4):629–641. doi:10.1016/j.cell.2009.02.006
15. Wang X, Wang Y, Li L, et al. A lncRNA coordinates with Ezh2 to inhibit HIF-1alpha transcription and suppress cancer cell adaption to hypoxia. Oncogene. 2019;39:1860–1874.
16. Zhou C, Wang S, Zhou Q, et al. A long non-coding RNA signature to improve prognostic prediction of pancreatic ductal adenocarcinoma. Front Oncol. 2019;9:1160. doi:10.3389/fonc.2019.01160
17. Yang J, Qiu Q, Qian X, et al. Long noncoding RNA LCAT1 functions as a ceRNA to regulate RAC1 function by sponging miR-4715-5p in lung cancer. Mol Cancer. 2019;18(1):171. doi:10.1186/s12943-019-1107-y
18. Li Z, Qin X, Bian W, et al. Exosomal lncRNA ZFAS1 regulates esophageal squamous cell carcinoma cell proliferation, invasion, migration and apoptosis via microRNA-124/STAT3 axis. J Exp Clin Cancer Res. 2019;38(1):477. doi:10.1186/s13046-019-1473-8
19. Tang T, Guo C, Xia T, et al. LncCCAT1 promotes breast cancer stem cell function through activating WNT/beta-catenin signaling. Theranostics. 2019;9(24):7384–7402. doi:10.7150/thno.37892
20. Bao S, Zhao H, Yuan J, et al. Computational identification of mutator-derived lncRNA signatures of genome instability for improving the clinical outcome of cancers: a case study in breast cancer. Brief Bioinform. 2019. doi:10.1093/bib/bbz118
21. Hu X, Liu Y, Du Y, Cheng T, Xia W. Long non-coding RNA BLACAT1 promotes breast cancer cell proliferation and metastasis by miR-150-5p/CCR2. Cell Biosci. 2019;9:14. doi:10.1186/s13578-019-0274-2
22. Porsch M, Ozdemir E, Wisniewski M, et al. Time resolved gene expression analysis during tamoxifen adaption of MCF-7 cells identifies long non-coding RNAs with prognostic impact. RNA Biol. 2019;16:661–674. doi:10.1080/15476286.2019.1581597
23. Tay Y, Rinn J, Pandolfi PP. The multilayered complexity of ceRNA crosstalk and competition. Nature. 2014;505(7483):344–352. doi:10.1038/nature12986
24. Qiao K, Ning S, Wan L, et al. LINC00673 is activated by YY1 and promotes the proliferation of breast cancer cells via the miR-515-5p/MARK4/Hippo signaling pathway. J Exp Clin Cancer Res. 2019;38(1):418. doi:10.1186/s13046-019-1421-7
25. Sang Y, Chen B, Song X, et al. circRNA_0025202 regulates tamoxifen sensitivity and tumor progression via regulating the miR-182-5p/FOXO3a axis in breast cancer. Mol Ther. 2019;27(9):1638–1652. doi:10.1016/j.ymthe.2019.05.011
26. Liu Y, Xue M, Du S, et al. Competitive endogenous RNA is an intrinsic component of EMT regulatory circuits and modulates EMT. Nat Commun. 2019;10(1):1637. doi:10.1038/s41467-019-09649-1
27. Kwan SY, Sheel A, Song CQ, et al. Depletion of TRRAP Induces p53-Independent Senescence in Liver Cancer by Down-Regulating Mitotic Genes. Hepatology. 2019.
28. Tomczak K, Czerwinska P, Wiznerowicz M. The Cancer Genome Atlas (TCGA): an immeasurable source of knowledge. Contemp Oncol (Pozn). 2015;19(1A):A68–77. doi:10.5114/wo.2014.47136
29. Jeggari A, Marks DS, Larsson E. miRcode: a map of putative microRNA target sites in the long non-coding transcriptome. Bioinformatics. 2012;28(15):2062–2063. doi:10.1093/bioinformatics/bts344
30. Wong N, Wang X. miRDB: an online resource for microRNA target prediction and functional annotations. Nucleic Acids Res. 2015;43(Databaseissue):D146–152. doi:10.1093/nar/gku1104
31. Chou CH, Chang NW, Shrestha S, et al. miRTarBase 2016: updates to the experimentally validated miRNA-target interactions database. Nucleic Acids Res. 2016;44(D1):D239–247. doi:10.1093/nar/gkv1258
32. Lewis BP, Burge CB, Bartel DP. Conserved seed pairing, often flanked by adenosines, indicates that thousands of human genes are microRNA targets. Cell. 2005;120(1):15–20. doi:10.1016/j.cell.2004.12.035
33. Pathan M, Keerthikumar S, Chisanga D, et al. A novel community driven software for functional enrichment analysis of extracellular vesicles data. J Extracell Vesicles. 2017;6(1):1321455. doi:10.1080/20013078.2017.1321455
34. Kanehisa M, Goto S, Sato Y, Furumichi M, Tanabe M. KEGG for integration and interpretation of large-scale molecular data sets. Nucleic Acids Res. 2012;40(Databaseissue):D109–114. doi:10.1093/nar/gkr988
35. Shannon P, Markiel A, Ozier O, et al. Cytoscape: a software environment for integrated models of biomolecular interaction networks. Genome Res. 2003;13(11):2498–2504. doi:10.1101/gr.1239303
36. Doncheva NT, Assenov Y, Domingues FS, Albrecht M. Topological analysis and interactive visualization of biological networks and protein structures. Nat Protoc. 2012;7(4):670–685. doi:10.1038/nprot.2012.004
37. Yu G, Wang LG, Han Y, He QY. clusterProfiler: an R package for comparing biological themes among gene clusters. OMICS. 2012;16(5):284–287. doi:10.1089/omi.2011.0118
38. Milanese JS, Tibiche C, Zou J, et al. Germline variants associated with leukocyte genes predict tumor recurrence in breast cancer patients. NPJ Precis Oncol. 2019;3:28. doi:10.1038/s41698-019-0100-7
39. Li S, Chen X, Liu X, et al. Complex integrated analysis of lncRNAs-miRNAs-mRNAs in oral squamous cell carcinoma. Oral Oncol. 2017;73:1–9. doi:10.1016/j.oraloncology.2017.07.026
40. Lv Y, Wei W, Huang Z, et al. Long non-coding RNA expression profile can predict early recurrence in hepatocellular carcinoma after curative resection. Hepatol Res. 2018;48(13):1140–1148. doi:10.1111/hepr.13220
41. Sun M, Geng D, Li S, Chen Z, Zhao W. LncRNA PART1 modulates toll-like receptor pathways to influence cell proliferation and apoptosis in prostate cancer cells. Biol Chem. 2018;399(4):387–395. doi:10.1515/hsz-2017-0255
42. Zhao Z, Liu B, Li B, et al. Inhibition of long noncoding RNA IGF2AS promotes angiogenesis in type 2 diabetes. Biomed Pharmacother. 2017;92:445–450. doi:10.1016/j.biopha.2017.05.039
 © 2020 The Author(s). This work is published and licensed by Dove Medical Press Limited. The
full terms of this license are available at https://www.dovepress.com/terms
and incorporate the Creative Commons Attribution
- Non Commercial (unported, 3.0) License.
By accessing the work you hereby accept the Terms. Non-commercial uses of the work are permitted
without any further permission from Dove Medical Press Limited, provided the work is properly
attributed. For permission for commercial use of this work, please see paragraphs 4.2 and 5 of our Terms.
© 2020 The Author(s). This work is published and licensed by Dove Medical Press Limited. The
full terms of this license are available at https://www.dovepress.com/terms
and incorporate the Creative Commons Attribution
- Non Commercial (unported, 3.0) License.
By accessing the work you hereby accept the Terms. Non-commercial uses of the work are permitted
without any further permission from Dove Medical Press Limited, provided the work is properly
attributed. For permission for commercial use of this work, please see paragraphs 4.2 and 5 of our Terms.