Back to Journals » Journal of Asthma and Allergy » Volume 13
Confounding Patient Factors Affecting the Proper Interpretation of the Periostin Level as a Biomarker in Asthma Development
Authors Hachim MY ![]() , Elemam NM
, Elemam NM ![]() , Ramakrishnan RK
, Ramakrishnan RK ![]() , Hachim IY, Salameh L, Mahboub B, Al Heialy S, Halwani R
, Hachim IY, Salameh L, Mahboub B, Al Heialy S, Halwani R ![]() , Hamoudi R
, Hamoudi R ![]() , Hamid Q
, Hamid Q
Received 12 September 2019
Accepted for publication 9 December 2019
Published 8 January 2020 Volume 2020:13 Pages 23—37
DOI https://doi.org/10.2147/JAA.S230892
Checked for plagiarism Yes
Review by Single anonymous peer review
Peer reviewer comments 3
Editor who approved publication: Dr Amrita Dosanjh
Mahmood Yaseen Hachim,1 Noha Mousaad Elemam,1 Rakhee K Ramakrishnan,1 Ibrahim Yaseen Hachim,1 Laila Salameh,1 Bassam Mahboub,1 Saba Al Heialy,2,3 Rabih Halwani,1 Rifat Hamoudi,1 Qutayba Hamid1,2
1Sharjah Institute for Medical Research, College of Medicine, University of Sharjah, Sharjah, United Arab Emirates; 2Meakins-Christie Laboratories, McGill University, Montreal, QC, Canada; 3College of Medicine, Mohammed Bin Rashid University, Dubai, United Arab Emirates
Correspondence: Rifat Hamoudi
College of Medicine, University of Sharjah, PO Box 27272, Sharjah, United Arab Emirates
Email [email protected]
Introduction: The proper use of serum periostin (POSTN) as a biomarker for asthma is hindered by inconsistent performance in different clinical settings.
Objective: To explore patient’s factors that may affect POSTN expression locally and systematically and its utility as a biomarker for asthma development.
Materials and Methods: Here we used bioinformatics analysis of publicly available transcriptomics data to confirm that POSTN is an asthma specific gene involved in core signaling pathways enriched in the bronchial epithelium during asthma. We then explored a large number of datasets to identify possible confounders that may affect the POSTN gene expression and consequently, its interpretation as a reliable biomarker for asthma. Plasma and saliva levels of POSTN were determined in locally recruited asthmatic patients (mild, moderate and severe) compared to healthy controls to confirm the bioinformatics findings.
Results: Our bioinformatics results confirmed that POSTN was consistently upregulated in the bronchial epithelium in asthma, chronic obstructive pulmonary disease (COPD) and idiopathic pulmonary fibrosis (IPF) bronchial epithelium. In asthma, its mRNA expression was affected by gender, sample anatomical site and type, steroid therapy, and smoking. In our cohort, plasma POSTN was upregulated in severe and non-severe asthmatic patients. Saliva POSTN was significantly higher in non-severe asthmatic patients compared to healthy and severe asthmatic patients (specifically those who are not on Xolair (omalizumab)). Patients’ BMI, inhaled steroid use and Xolair treatment affected POSTN plasma levels.
Conclusion: Up to our knowledge, this is the first study examining the level of POSTN in the saliva of asthmatic patients. Both plasma and saliva POSTN levels can aid in early diagnosis of asthma. Saliva POSTN level was more sensitive than plasma POSTN in differentiating between severe and non-severe asthmatics. Patients’ characteristics like BMI, the use of inhaled steroids, or Xolair treatment should be carefully reviewed before any meaningful interpretation of POSTN level in clinical practice.
Keywords: periostin, biomarkers, transcriptomics
Introduction
Asthma is a heterogeneous disease with diverse etiology resulted from different combinations of environmental, genetic, as well as behavioral risk factors.1 Asthma heterogeneity is attributable to the various underlying mechanisms, pathways, and mediators,2 which can be reflected in the ongoing classification of asthma phenotypes.2 Consequently, there is a continuous effort to refine asthma phenotypes in order to enhance patients’ classification and pave the way for more precise and personalized therapeutic options.3 Among many subtypes of asthma, type 2-driven asthma is stratified into “Th2-high” and “Th2-low” asthma.4 Th2-high asthma has 3 specific gene signatures, namely, periostin (POSTN), chloride channel regulator 1 (CLCA1), and serpin peptidase inhibitor, clade B, member 2 (SERPINB2).5 Among them, POSTN was found to be a more reliable surrogate marker for Th2-high asthma and showed a remarkable performance in predicting the efficacy of anti-IL-13 antibodies (lebrikizumab) for steroid-resistant asthmatic patients.6 It is widely accepted that under the effect of secreted IL-13 by Th2 immune cells, the human bronchial epithelium will upregulate the expression of POSTN.6 When secreted into the extracellular matrix, POSTN promotes local eosinophil infiltration.7 This local increase in POSTN level is reflected as an increase in serum POSTN level in adult and children patients with Th2 asthma.8 The proper use of POSTN as a biomarker is hindered by many limitations as relatively few numbers of proper studies showed conflicting results in different settings.9 Since POSTN is one of the very few biomarkers available to reflect refractory Th2/eosinophilic inflammation; therefore, understanding the factors that may affect its expression is essential for managing the patients and understanding the disease.10
Here we used bioinformatics analysis of publicly available transcriptomics data to confirm that POSTN is an asthma specific gene and participate in different pathways in asthmatic patients’ bronchial epithelium. Then we explored a large number of datasets to identify possible confounders that may affect POSTN gene expression and its use as a potential biomarker. Our approach confirmed that POSTN is consistently differentially expressed in a large number of patients across different datasets using bronchial epithelium transcriptomic data. Our analysis showed the effect of gender, sample type, smoking, BMI, and treatment on the expression of POSTN. In vivo validation using locally recruited, asthmatic patients confirmed the bioinformatics findings. Saliva POSTN was able to differentiate nonsevere asthmatic from healthy controls. Up to our knowledge, this is the first study examining the level of POSTN in the saliva of asthmatic patients.
Patients, Materials, and Methods
Bioinformatical Approach
Datasets Selection to Identify Common Differentially Expressed Genes (DEG) in Bronchial Epithelium of Asthmatic Patients
Publicly available transcriptomic datasets from Gene Expression Omnibus (GEO) (https://www.ncbi.nlm.nih.gov/geo/) of asthmatic patients were used for initial analysis. The inclusion criteria for selecting these datasets were as follows: datasets using human samples only, studies that included matching healthy controls, datasets with defined clinical classifications of participants, and datasets with bronchial epithelium gene expression using microarray. In order to have a platform consistency, only datasets generated using Affymetrix Human Genome U133 Plus 2.0 Array were selected. Three datasets fulfilled these criteria: GSE64913, GSE4302, and GSE13396. In total, 190 samples were included in those studies, where 103 asthmatic patients were compared to 71 healthy controls, as shown in Table 1.
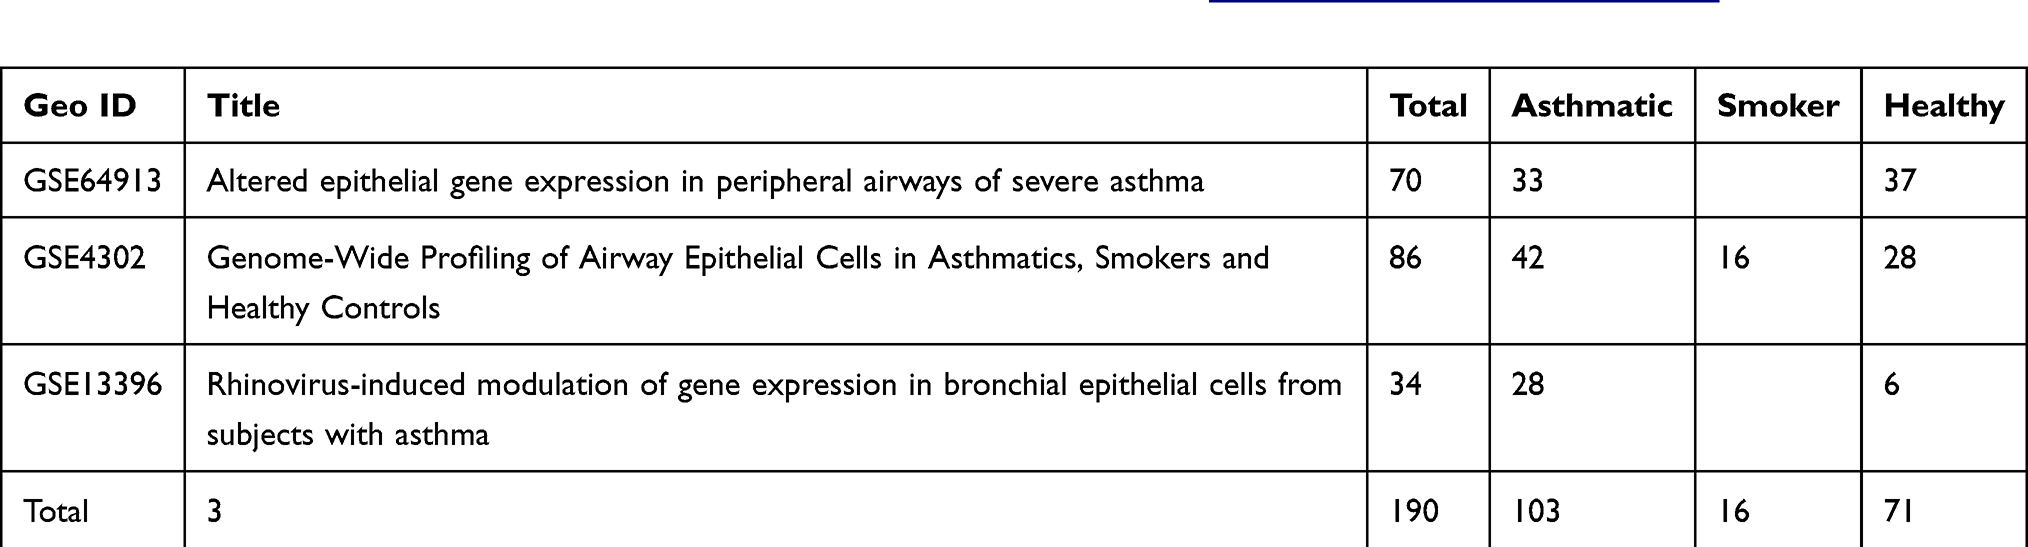 |
Table 1 Details of Datasets Extracted from Gene Expression Omnibus (GEO) (https://www.ncbi.nlm.nih.gov/geo/) and Used for Initial Identification of DEG Between Asthmatic and Healthy Controls |
Selection of Datasets for Validation of the Generated Common DEG and Identification of Confounding Factors Affecting the Interpretation of Potential Biomarkers
Seven datasets of the same microarray platform were extracted representing different types of samples other than bronchial epithelium such as nasal scraping, sputum, and blood. Moreover, these datasets included numerous variables such as smoking, steroid inhaler treatment, acute versus convalescent conditions, rhinovirus infection, and exercise-induced bronchospasm, in order to identify the confounding factors that may affect gene expression. Also, we analyzed gene expression that was performed on the different locations of airways epithelium (nasal, central airway and peripheral), as well as gender-specific variations and compared that with other respiratory diseases that share common features with asthma including chronic obstructive pulmonary disease (COPD) and interstitial pulmonary fibrosis (IPF). As shown in Table 2, the total number of explored samples were 615 (263 asthmatics, 36 COPD, 23 IPF, 60 smokers, and 184 healthy controls)
 |
Table 2 Details of Datasets Extracted from Gene Expression Omnibus (GEO) (https://www.ncbi.nlm.nih.gov/geo/) and Used for Validation of the Generated Common DEG to Identify Confounding Factors Affecting the Gene Expression |
Raw CEL Files Processing, Normalization, and Filtration
In total (n=805) samples were analyzed in two stages, where stage I (n=190) samples were used for identification of common DEG while stage II (n=615) samples were used for the validation. The raw Affymetrix Human Genome U133 Plus 2.0 Array CEL files were extracted, classified into their corresponding clinical group, after which each dataset underwent preprocessing and normalization separately using in house Hamoudi et al11 R script through R statistical software version 3.0.2. The script used affy, gcRMA, MAS5 and RMA packages for normalization. Hamoudi et al found that the best strategy for generating variant probes that are differentially expressed between the groups was using a combination of gcRMA and MAS5 normalization followed by cross-referencing the probes that passed through non-specific filtering based on the coefficient of variation and absolute value thresholding.9 After the removal of the non-variant probes, the resultant filtered ones were the only variant probes. Also, the housekeeping probes and those that are not assigned to a gene were excluded. Finally, probes with maximum value were selected among matching probes then collapsed to their corresponding gene using GSEA software (http://software.broadinstitute.org/gsea).
Gene Set Enrichment Analysis (GSEA) to Generate DEG in Each Set
Filtered raw files for each dataset were uploaded to the GSEA software separately, then absolute GSEA (AbsGSEA) was performed to identify the top genes enriched in the asthmatic patients compared to healthy controls in each dataset. Signal to noise metric was used to generate a rank-ordered gene list based on the enrichment score of each gene in the dataset. The enriched genes were filtered based on cutoff score ≥ 0.25 as upregulated genes in asthma, while those ≤ −0.25 as downregulated genes in asthma. For each dataset, the genes that were upregulated or downregulated in asthmatic patients compared to healthy controls were identified and grouped. Subsequently, DEG in each dataset were intersected with the DEG from the other sets, and common genes were identified.
In silico Validation and Identification of Confounding Factors
Raw data of the individual samples’ mRNA expression for each of the identified genes were extracted from each dataset in order to confirm the findings of stage I and identify the factors that might affect gene expression level. Next, the resulting short-listed genes were validated using other datasets with samples other than bronchial epithelium, such as nasal epithelium, blood and sputum, and in other respiratory diseases (COPD and IPF).
Enriched Ontology Clustering for the Identified Genes
In order to explore if the identified genes are sharing common pathways, Enriched Ontology Clustering for the identified genes was performed using the Metascape (a web-based tool used for comprehensive gene list annotation and analysis resource) alongside GSEA tool.12
Gene-Based Enrichment and Similarity Analysis
In order to perform the correlation of the identified genes as a group to each other, we used eXploring Genomic Relations for enhanced interpretation web tool (http://galahad.well.ox.ac.uk:3040/). This tool can provide enhanced interpretation targeting genomic summary data such as those resulting from genome-wide association studies (GWAS) and expression quantitative trait loci (eQTL) studies via comprehensively utilizing ontology and network information.13 The tool uses the option “Experimental Factor Ontology (EFO)” that provides a systematic description of many experimental variables available in EBI databases and NHGRI GWAS catalog to show biological ontologies, such as UBERON anatomy, ChEBI chemical compounds, and Cell Ontology.14 We used Socialiser for Genes Option to assess the degree of relatedness between any two identified genes in the meaning of annotation profiles by ontology terms.
Cell/Tissue-Specific Expression of the Identified Genes
To determine whether the identified genes are tissue-specific to the lung, we uploaded the identified genes to Enrichr open source and freely available online web-based tool (http://amp.pharm.mssm.edu/Enrichr) to generate various types of visualization summaries of collective functions of gene lists.15 Through Enricher, cell of origin for the given gene list was found by utilizing ARCHS4 resource that makes the majority of published RNA-seq data from humans and mice available at the gene and transcript levels.16
Patients Cohort
Subject Characteristics and Study Design
From January 2017 to May 2019, individuals were recruited consecutively from the Asthma Clinic in Rashid Hospital, Pulmonary Medicine Department. 32 asthmatic patients were included, 19 were non-severe asthmatic patients (mild to moderate), and 13 were severe asthmatic subjects (fulfilling the criteria for asthma as per American Thoracic Society). According to GINA and ERS/ATS Task Force on severe asthma, guidelines define asthma severity as “those who require continuous high-dose treatment, as their asthma is refractory or difficult-to-treat plus a second controller (and/or systemic corticosteroids) to prevent it from becoming uncontrolled or which remains uncontrolled despite this therapy”.17 Those patients were compared to 12 non-asthmatic volunteer subjects who had no recent infection of the respiratory tract and no histories of allergy or asthma. Participants completed the Asthma Control Test self-assessment. The Ethics Committee of Dubai Health Authority and the University of Sharjah approved the study with REC (Research Ethics Committee) approval number DSREC-11/2017_04 and each subject gave written informed consent after a thorough explanation by the treating physician and the researchers. This study was conducted in accordance with the Declaration of Helsinki. The demographic characteristics of the asthmatic patients and control subjects are shown in Table 3. Blood and saliva were collected, as previously described.18
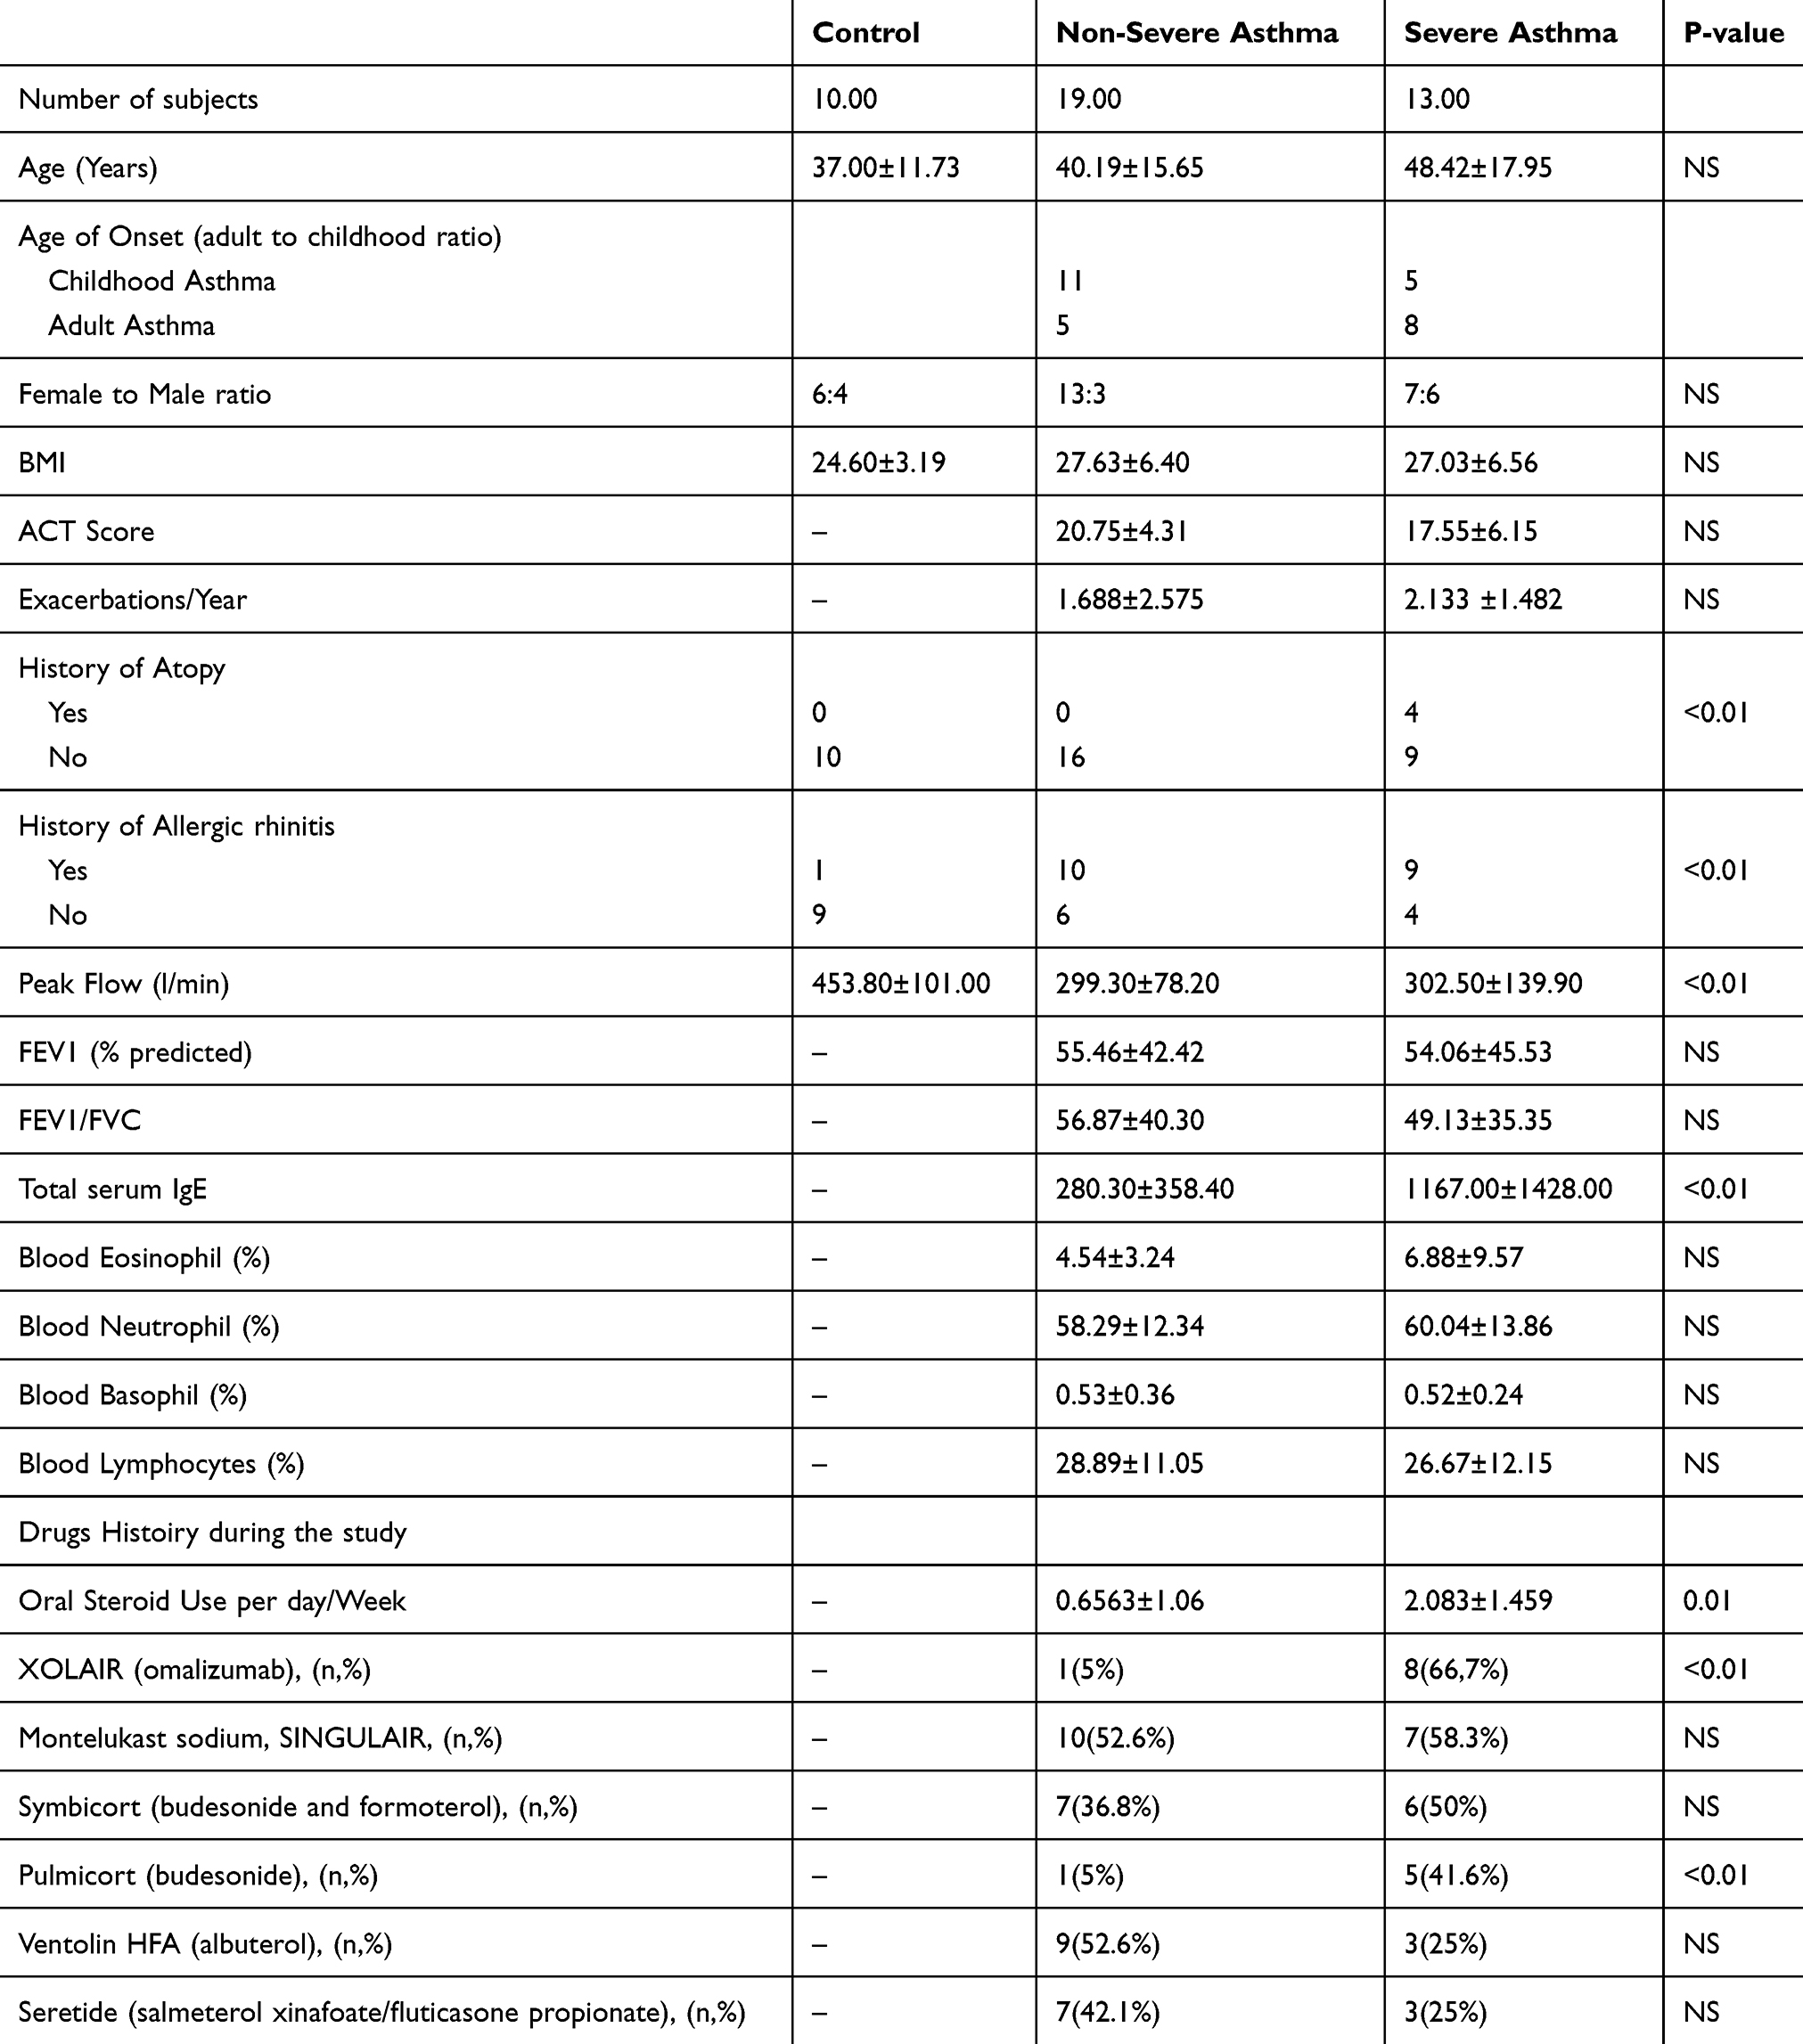 |
Table 3 Characteristics of the Recruited Subjects-Asthmatic Patients and Healthy Controls |
Plasma Collection Protocol
Peripheral blood was collected in ethylene diamine tetra-acid (EDTA) vacutainer tubes (BD Biosciences, USA). Samples were then centrifuged at 2000 rpm for 15 min; retrieved plasma was stored at −80°C until analysis.
Unstimulated Whole Saliva Collection Protocol
Participants were asked to fast for at least 1 hr and not to brush their teeth or smoke for 30 mins, accompanied by gargling and rinsing of the mouth with water 5 mins before proceeding with saliva collection. 1 mL of unstimulated whole saliva via passive drool was collected in a pre-prepared 50 mL tube containing 1 mL of RNAlater (Invitrogen). Collected saliva samples were transported on ice and stored at − 80°C until analysis. Sample measurements were undertaken within 3 months of storage.
Quantification of POSTN in Plasma and Saliva Using ELISA
POSTN was assessed in the plasma and saliva using Human POSTN/OSF-2 DuoSet ELISA Kit (R&D Systems, USA) according to the manufacturer’s instructions. POSTN levels were expressed as pg/mL. All assays were performed in duplicates.
Statistical Methods
One-way ANOVA test was performed using GraphPad Prism version 7.00 for Windows (GraphPad Software, La Jolla California USA), to determine whether there are any statistically significant differences between the mean values of the controls and different asthma groups for the gene expression and protein levels. The same software was used to examine the correlations between the different parameters using linear regression. The student’s t-test was used to look for the difference between two groups under a given experiment or treatment. A p-value <0.05 is taken as statistically significant.
Results
Top Common Genes That are Differentially Expressed in Asthma Compared to Controls
For a better understanding of the genes that are involved in asthma pathogenesis, we initially investigated genes that are differentially expressed in asthmatic patients compared to healthy controls using different datasets. For each dataset, the DEGs were identified and divided into those that are upregulated in asthma (242 genes in GSE4302, 103 genes in GSE64913and 86 genes in GSE13396) and those that are downregulated in asthma compared to healthy (183 genes in GSE4302, 45 genes in GSE64913and 38 genes in GSE13396), as shown in Table 4. A list of all DEGs is provided in Supplementary 1.
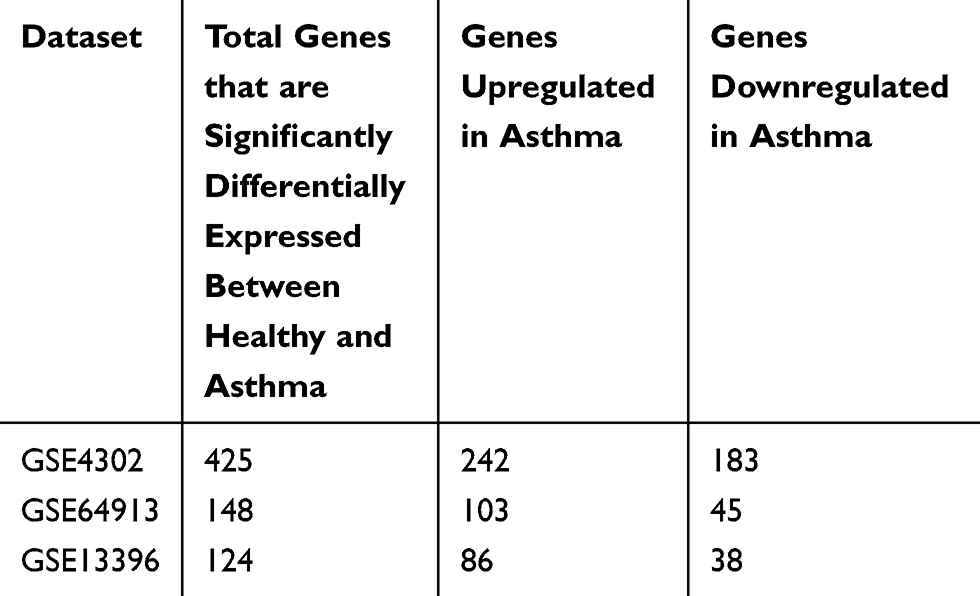 |
Table 4 Total Genes That are Significantly Differentially Expressed Between Healthy and Asthmatic Bronchial Epithelium Categorized into Upregulated and Downregulated Groups |
POSTN and IGF2BP3 are Consistently Enriched in Asthmatic Bronchial Epithelium Samples
DEG of the three datasets were intersected to identify common genes that were differentially expressed between asthma and healthy controls in at least 2 datasets (51 genes) as shown in Figure 1. As illustrated in Figure 1, two genes were found to be enriched in asthmatic bronchial epithelium compared to healthy ones in all of the three training datasets (POSTN and IGF2BP3), while 49 other genes were differentially expressed in 2 of the three datasets (KRT6A, PHACTR3, CXCL14, DNAJC12, FKBP5, SERPINB2, CLCA1, PRR4, PHLDB2, TOP2A, SRPX2, MX2, PKP2, DQX1, GCNT3, ATP10B, CST1, HPGD, CD44, TMEM106C, DPYSL3, KIAA1913, BIRC5, ITPR1, PLUNC, FLJ21511, MUC5B, SCNN1G, SLAMF7, WIF1, TACR1, HLA-DOA, GRP, CDH2, WNT5A, FLJ10781, CCNA1, IL1RL1, SPRR3, KRT13, DMRT2, UPK1B, SNORA68, IFI44, MGC39900, MSRB3, VGLL3, AKAP12, and CDC42SE2).
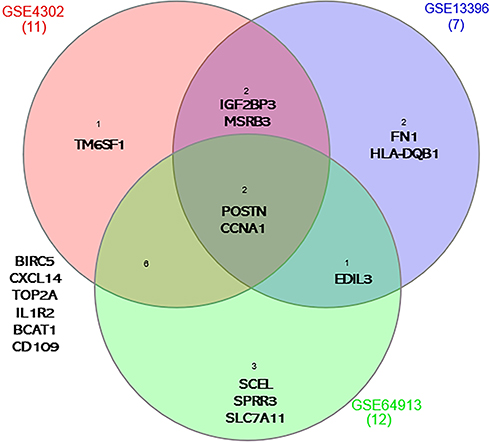 |
Figure 1 Genes that are differentially expressed in asthma compared to healthy controls in the three datasets GSE64913 (12 genes), GSE4302 (11 genes) and GSE13396 (7 genes). POSTN and IGF2BP3 were consistently differentially expressed among the three transcriptomic datasets. |
POSTN Showed a High Degree of Similarity with 14 Out of the 49 Identified DEG
In order to explore the correlation of the identified genes as a group to each other, we used the web tool: eXploring Genomic Relations for enhanced interpretation (http://galahad.well.ox.ac.uk:3020/). Genes with a similarity score of more than 50% were filtered, and the number of related genes in term of annotation were counted for each one of them. POSTN exhibited high similarity scores to 14 genes from the identified DEG, and these are CD44, BIRC5, MUC5B, TOP2A, CDH2, AKAP12, WIF1, WNT5A, CLCA1, GRP, HPGD, SCNN1G, IL1RL1, and IGF2BP3. On the other hand, IGF2BP3 showed high similarity in the annotation to only 5 genes: TOP2A, CD44, CDH2, AKAP12, and BIRC5, as illustrated in Figure 2. This might indicate that POSTN expression can reflect the expression of similar genes that are differentially expressed in asthma and hence can be a candidate biomarker.
 |
Figure 2 Degree of relatedness of a gene to another gene in the meaning of annotation profiles of the identified genes as a group to each other using eXploring Genomic Relations for enhanced interpretation (http://galahad.well.ox.ac.uk:3024/). POSTN showed a high degree of similarity with 14 out of the 49 identified DEG. |
The DEG are Enriched in Pathways Related to Response to Wounding, Bacteria, and Regulation of Cytokine Secretion
In order to determine if the identified DEG; common in at least 2 datasets; participate in common pathways, the list was uploaded to metascape (http://metascape.org) to generate a graphical representation of top enriched pathways.12 As expected, the identified genes were enriched to pathways related to epithelial cells development and physiology (morphogenesis of an epithelial sheet, keratinocyte differentiation, cornification and formation of the cornified envelope) and response to wounding. Interestingly, among the top enriched pathways are immune-related pathways such as response to bacteria, regulation of cytokines and chemokines secretion, and regulation of leukocyte migration, as shown in Figure 3.
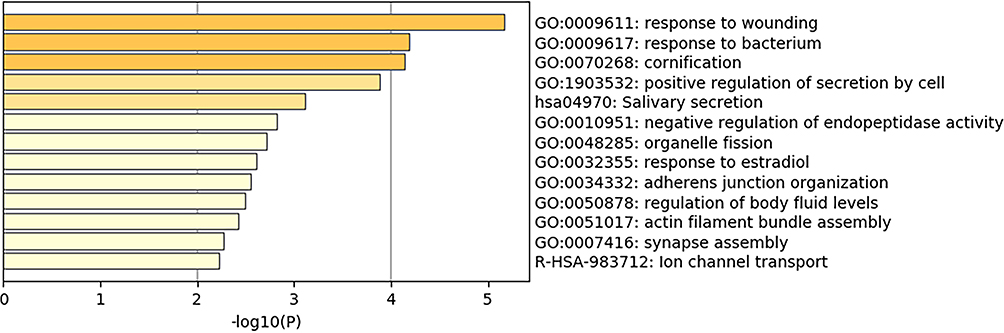 |
Figure 3 Top pathways shared by the DEGs in at least 2 of the 3 selected datasets. The graph was generated using metascape (http://metascape.org). The DEG are enriched in pathways related to response to wounding, bacteria, and regulation of cytokine secretion. |
The Common DEG Between Asthmatic and Healthy Bronchial Epithelium are Tissue-Specific to Skin, Gut, and Respiratory System
To determine whether the identified genes are lung-specific or are expressed by other tissues, we uploaded the identified genes to the freely available online web-based tool Enrichr open source (http://amp.pharm.mssm.edu/Enrichr) to generate various types of visualization summaries of collective functions of gene lists.15 Through Enricher, cell of origin for the given gene list was generated by ARCHS4 resource of published RNA-seq data from humans and mice.16 Our analysis showed that 13–15 of the identified genes are related to lung, skin, and gut. This indicates that tissue sampling other than the respiratory system might reflect expression changes that occur in asthma and can be an alternative for bronchial sampling in the clinical setting.
The DEG are Enriched in Diseases of the Skin, Respiratory and Gut Diseases
In order to determine if the identified DEG common in at least 2 datasets are known markers in any diseases, the gene list was uploaded to eXploring Genomic Relations for enhanced interpretation web tool (http://galahad.well.ox.ac.uk:3040/). Gene-based Enrichment Analysis showed that 10–13 genes in the list are known to be related to phenotypes of intestinal disease, musculoskeletal system disease, connective tissue disease, gastrointestinal system cancer, intestinal cancer, respiratory system disease, large intestine cancer, lower respiratory tract disease, and skin disease. This might indicate that diseases other than the respiratory system might affect gene expression and mimic their potential utilization as useful biomarkers.
Patients Related Factors Like Gender, Smoking or Viral Infection Can Affect the Expression of POSTN
Since POSTN was differentially expressed in the 3 datasets of bronchial epithelium between asthmatic patients and healthy controls, we explored its raw mRNA expression in the remaining 7 validation sets along with the three initial datasets. This was performed to identify any confounding variables that may interfere with the proper diagnostic significance of periostin as a biomarker and hence should be taken into consideration in its interpretation.
POSTN Gene mRNA Expression Was Affected by Sample Type, Gender, Use of Flovent Inhaler, Asthma Phenotype, and Its Upregulation Is Not Asthma-Specific
POSTN expression in male’s bronchial epithelium was higher compared to females in both central or peripheral airways (Figure 4A). This gender effect on POSTN gene expression was only evident in healthy subjects and lost in asthmatic patients (Figure 4B). On the other hand, only females’ asthmatic bronchial epithelium expressed higher POSTN mRNA in central (p=0.03) and peripheral (p=0.02) airways than the healthy controls (Figure 4C).
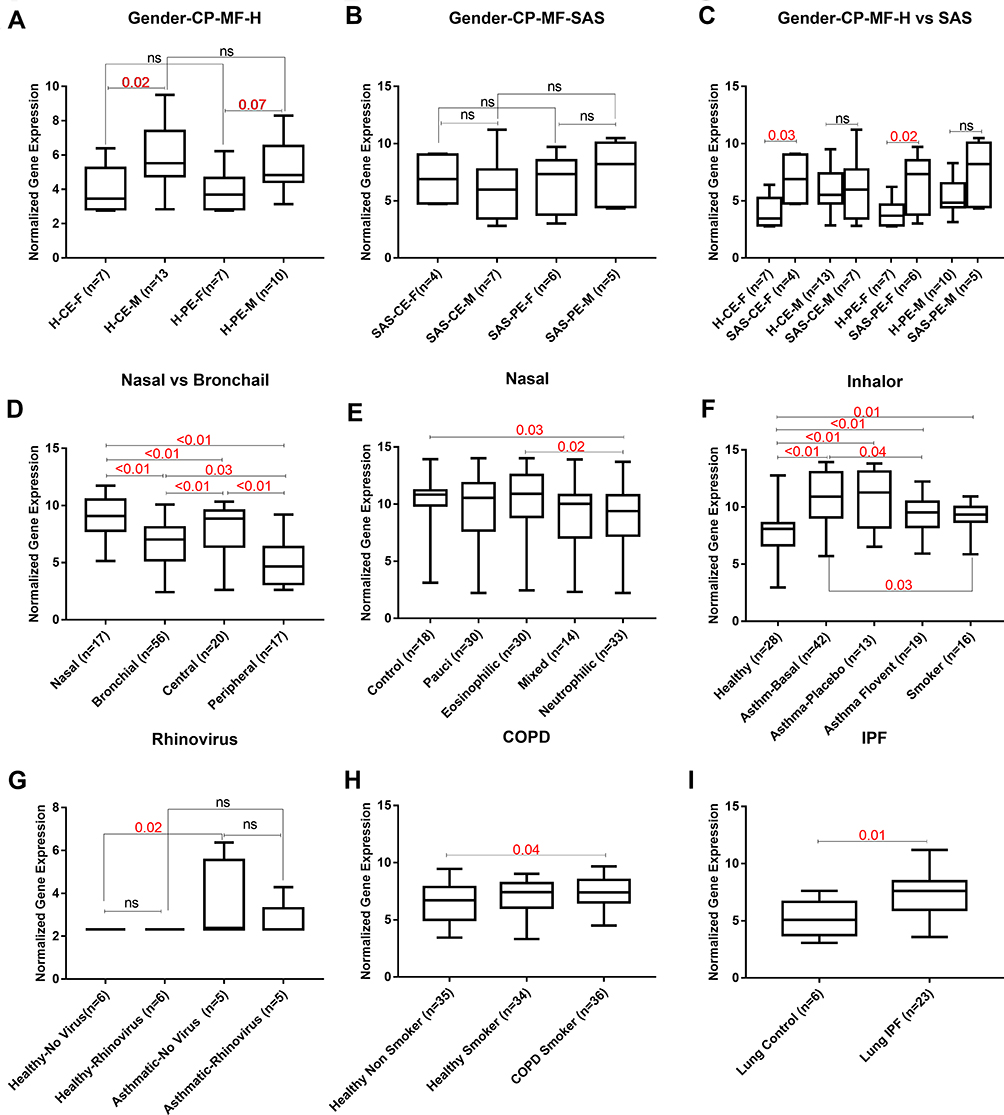 |
Figure 4 Raw mRNA expression of POSTN in the extracted 10 datasets to identify confounding variables that affect POSTN gene mRNA expression in healthy “H” and asthmatic “SAS”. (A, B, C) Gender (female “F” vs male “M”) in central “C” vs peripheral “P” airways epithelium “E” (GSE64913), (D) Nasal vs Bronchial (GSE4302, GSE64913, GSE13396 and GSE41861), (E) Different asthma phenotypes in nasal samples (GSE41862), (F) Flovent inhaler use and smoking (GSE4302), (G) Rhinovirus infection (GSE13396), (H) COPD and smoking (GSE30063) and (I) IPF (GSE21369). The Kruskal–Wallis with corrected Dunn’s post hoc nonparametric test was performed where p<0.05 was considered significant. |
Upper airways nasal epithelium showed higher POSTN expression compared to the lower bronchial epithelium (p<0.01). Additionally, as shown in Figure 4D, the more peripheral the airways are, the less POSTN gene expression (p<0.01). Nevertheless, nasal epithelial expression of POSTN mRNA was affected by the phenotypes of asthma as it exhibited lower expression in neutrophilic phenotype compared to healthy controls (p=0.03) and eosinophilic phenotype (p=0.02) as shown in Figure 4E.
Regarding the effect of therapy, it was interesting that fluticasone propionate “Flovent” inhaler significantly downregulated POSTN mRNA expression compared to patients at the beginning of the treatment (p=0.04) as well as healthy controls (p<0.01). As illustrated in Figure 4G, POSTN expression was not affected by human rhinovirus infection (HRV) to the bronchial epithelium. Furthermore, POSTN was not specific to asthma as it was also upregulated in smokers with COPD (p=0.04, Figure 4H) and IPF lung (p=0.01, Figure 4I) when compared to matching healthy controls. Besides, smoking alone showed a significant effect on POSTN expression as smokers showed higher expression compared to healthy (p=0.01) but lower than asthmatic (p=0.03), as shown in Figure 4F. POSTN gene mRNA expression was upregulated in the asthmatic bronchial epithelium (p<0.01, Figure 4E) but not in asthmatic blood samples compared to healthy(figure not shown).
Plasma and Saliva POSTN Levels are Elevated in Asthma
Our bioinformatics assessment suggested that POSTN can serve as a candidate for a good biomarker if the sample type and the confounding patient’s characteristics are taken into consideration. Intriguingly, the subsequent hypothesis was whether the level of POSTN in saliva or plasma of asthmatic patients can be used to differentiate between levels of asthma severity. Hence, we investigated the levels of POSTN in saliva and plasma using a cohort composed of 32 asthmatic patients and 12 non-asthmatic volunteer subjects. As demonstrated in Figure 5A, asthmatic patients (non-severe and severe) showed a significant elevation in the levels of plasma POSTN compared to the healthy group (p=0.04 & p=0.02 respectively). Moreover, POSTN plasma levels were higher (not significant) in the severe asthmatic patients compared to non-severe asthmatics. On the other hand, saliva POSTN level was significantly higher in non-severe asthmatic patients when compared to severe asthmatics (p=0.02, Figure 5C) or healthy controls (p=0.04).
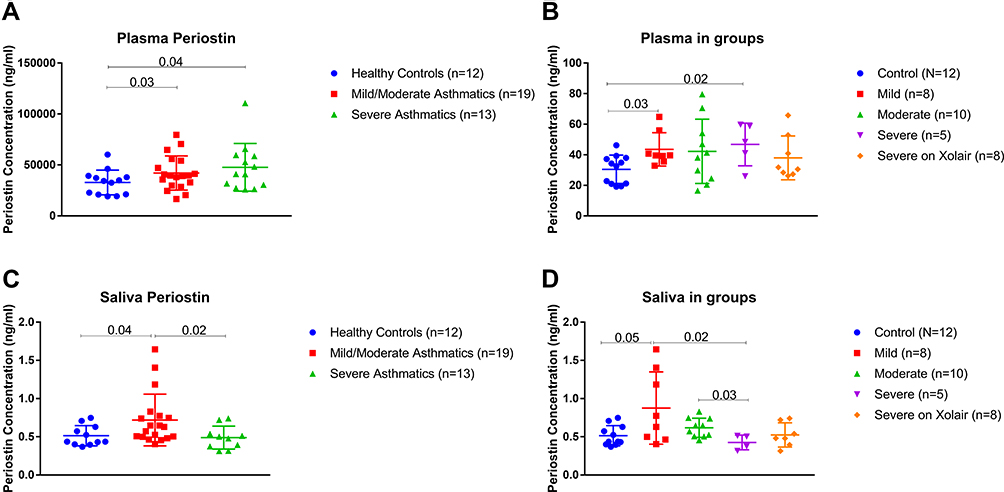 |
Figure 5 ELISA Quantification of Plasma and Saliva POSTN protein level using a locally recruited cohort of asthmatics patients compared to healthy controls. Plasma (A-B) and Saliva (C-D) POSTN protein levels in healthy controls versus nonsevere asthmatics (mild and moderate) and severe asthmatics (on Xolair and without Xolair). The Kruskal–Wallis with uncorrected Dunn’s post hoc nonparametric test was performed where p<0.05 was considered significant. |
Asthma Treatment and BMI Affect the Level of Plasma and Saliva POSTN
Upon further categorizing the patients: non-severe asthmatic subjects were divided into mild and moderate, while the severe asthmatics were divided into those on Xolair (omalizumab) treatment and those who are not using Xolair. As shown in Figure 5B, mild asthmatics have significantly higher plasma POSTN than healthy controls (p=0.03). Moreover, severe asthmatics who are not using Xolair specifically had higher POSTN plasma levels compared to healthy controls (p=0.02). Regarding saliva POSTN, mild and moderate asthmatic patients showed higher saliva POSTN level than severe asthmatic who are not receiving Xolair (p=0.02 and p=0.03, respectively), as shown in Figure 5D.
Among the clinical and laboratory data of patients, only the use of Symbicort correlated positively with the plasma level of POSTN (r=0.39, p=0.02, Figure 6A). Plasma POSTN level was significantly higher in patients who used Symbicort (49.4±15.51 pg/mL) compared to those who did not use it (37±13.84 pg/mL), as shown in Figure 6B. This confirms our initial assumption that POSTN is an asthma specific biomarker and is elevated in response to treatment. Another interesting finding is the effect of BMI on POSTN plasma level. Class I obese (BMI 30.0–34.9) showed higher POSTN plasma level compared to the overweight class (BMI 25.0–29.9, p=0.04), and compared to class II and class III obese (BMI≥35.0, p=0.02) participants, as shown in Figure 6C and D.
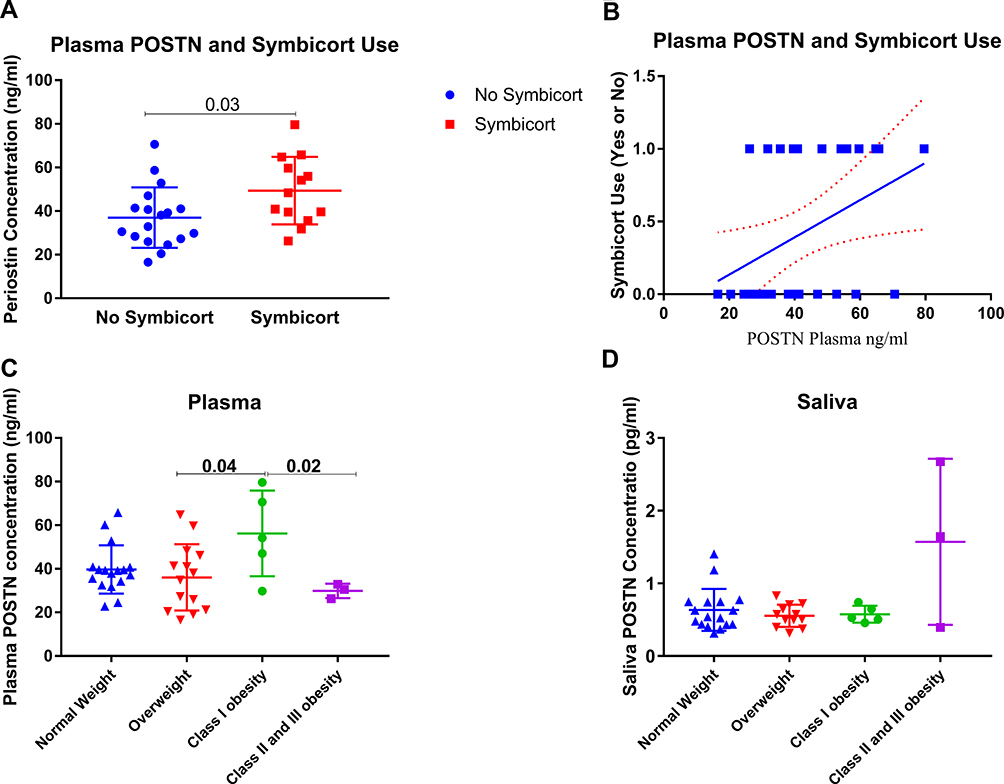 |
Figure 6 ELISA Quantification of Plasma and Saliva POSTN protein level using ELISA in a locally recruited cohort of asthmatics patients compared to healthy controls. (A-B) POSTN level in patients using Symbicort compared to those who are not (C-D) plasma and saliva POSTN level in different categories of participants according to their BMI. The Kruskal–Wallis with uncorrected Dunn’s post hoc nonparametric test was performed where p<0.05 was considered significant. |
These results suggest that both plasma and saliva POSTN levels can be used as early markers for asthmatic patients. Furthermore, patients’ characteristics and treatment history should be carefully reviewed before any meaningful interpretation of POSTN in level in the clinical practice. Moreover, combining the use of saliva and plasma POSTN can aid in early diagnosis of asthma as well as in the prediction of asthma phenotype and distinction between mild and severe asthma categories.
Discussion
There is an imminent need to discover new biomarkers that can discriminate and classify different asthmatic phenotypes, predict the clinical behavior and therapeutic response as well as aid in the identification of new therapeutic targets.8,9 Those markers need to be less invasive and more technically convenient in comparison to the currently available ones.10 Despite that necessity, only a few markers were shown to have potential roles in the clinical practice.11 However, some of these successful biomarkers showed significant limitations in different populations and settings. This can be accredited to the absence of a unified system of patients’ classification and lack of complete understanding of confounding comorbidities, co-existing conditions, sampling time, and type besides the treatment history of asthmatic patients involved in the assessment.12 For example, atopic status, smoking, and use of inhaled corticosteroids (ICS) are known confounders for the interpretation of asthma biomarkers.13
In this study, we used bioinformatics analysis of publicly available transcriptomics data to identify asthma specific genes and pathways that are differentially expressed between healthy controls and asthmatic patients’ bronchial epithelium. Our approach confirmed that POSTN is consistently differentially expressed in a large number of patients across different datasets using bronchial epithelium transcriptomic data. POSTN is part of the asthma specific type 2 cytokine signature as it is a downstream molecule of interleukin (IL)-13, and plays a vital role in its pathogenesis.19 IL-13 induces the production of this matricellular protein from airway epithelial cells and lung fibroblasts in response to injury. IL-13 serum levels can serve as a biomarker for eosinophilic airway inflammation20 and is associated with asthma disease severity.21 The exact molecular mechanisms of POSTN involvement in human asthma has not been fully understood.22 Nevertheless, POSTN was shown to be involved in airway remodeling, subepithelial fibrosis, and mucus production19 by binding to other extracellular matrix (ECM) proteins.23 It was reported that POSTN uses its FAS1 domains to bind to cells and its N and C terminals to bind to those ECM proteins, thus acting as a pro-survival protein in many cellular contexts.24
On the other hand, high amounts of POSTN could interact with TNFα or IL-1α in fibroblasts to stimulate NF-κB that could result in lung fibrosis.25 It is well known that high serum POSTN can be a predictive marker for effective anti-IL-13 antibody treatment in asthmatic patients26 and a prognostic marker for increased risk of asthma exacerbations and progressive decline in lung function.6 However, whether increased POSTN expression has protective or deleterious effects in asthma, is still a matter of debate. It has been previously reported that POSTN deficient mice challenged with inhaled aeroallergen showed an exaggerated serum IgE and bronchial hyperresponsiveness that might be due to the POSTN effect on TGF‐β‐induced T regulatory cell differentiation.25 Moreover, POSTN deficiency was shown to enhance polyps like lesion formation and mast cell infiltration.27
Technical challenges that hinder the use of POSTN include post-translational modifications as well as the existence of multiple differentially spliced isoforms in various proportions in diverse tissues and disease states.28 Proper clinical utility of serum POSTN levels depends on a better understanding of the factors that may affect its level.29 For instance, baseline POSTN levels were high in children and hence might mask any changes due to its local release within the airways leading to inconsistent findings in children.9 Therefore, we explored publicly available datasets to identify possible confounders affecting POSTN gene expression and hence may limit the interpretation of its level in the clinical settings. Our analysis showed that POSTN gene mRNA expression was upregulated in the asthmatic, smoker COPD and IPF bronchial epithelium when compared to matching healthy controls (Figure 4). This goes in line with the fact that bronchial asthma and COPD possess many similarities that sometimes confuse therapists in their diagnosis and management.30 Also, this suggests that high POSTN mRNA expression cannot rule out any other respiratory diseases if taken alone, and its interpretation should be accompanied by other clinical data and laboratory results. Another suspected factor is human rhinovirus infection (HRV), which is known to cause loss of control in asthmatic symptoms thus leading to emergency room visits and augmentation in asthma management.31 Such common respiratory viruses are known to induce local POSTN levels to shift immune responses toward Th2 in children32 especially during a rhinovirus-induced asthma exacerbation.33 In our analysis using adult bronchial epithelium, there was no effect of HRV on POSTN expression. This could indicate that increased POSTN level in asthma does not indicate an acute exacerbation induced by HRV.
One of the interesting results in our analysis is the observed effect of fluticasone propionate (Flovent) inhaler on POSTN expression. Flovent was found to significantly downregulate POSTN mRNA expression in comparison to healthy controls as well as asthmatic patients before initiation of therapy. This supports previous data documenting that serum POSTN levels respond partially to ICS as reflected by a reduction in airway inflammation and wall thickening in asthma.34 Moreover, Flovent was shown to inhibit POSTN production and its activation of Src/AKT/mTOR pathway.35 Therefore, this finding confirmed that POSTN expression can be used to monitor the response or patient compliance with Flovent treatment. On the other hand, the use of Symbicort correlated positively with the plasma level of POSTN (Figure 5). Compared to Flovent, Symbicort is more effective than a high dose of fluticasone propionate in improving lung function of moderate persistent asthma.36 The high level of POSTN observed in the group using Symbicort might indicate that this subcategory is not well-controlled and needed Symbicort to control the symptoms. Another possible explanation could be that POSTN mRNA is affected specifically with the fluticasone present in the Flovent but not with the budesonide in the Symbicort therapy.
It was previously mentioned that the potential of POSTN in predicting a beneficial response to therapies, needs further investigation, and careful interpretation in smoking asthmatics.37 In our analysis, smoking showed a significant effect on upregulating POSTN expression compared to healthy non-smoker individuals (Figure 4). Considering the gender effect on POSTN expression, it was found to be higher in males compared to females in healthy bronchial epithelium. At the same time, asthmatic bronchial epithelium expressed higher POSTN mRNA in comparison to healthy controls only in females (not males). This goes in line with the previous report in the Asian population where POSTN levels were found to be sex-dependent where females had higher POSTN levels.29 However, this finding is contrary to a previous study stating that a patient’s sex should not be taken into account while assessing serum POSTN.38 This is a critical point in the recruitment of controls and asthma patients in order to understand and appreciate the male to female ratio in the studied groups.
Our analysis showed that POSTN has high similarity scores to 14 genes from the identified DEG between severe asthmatics and healthy controls. This similarity might indicate that POSTN can reflect the expression of these genes and hence be a representative biomarker of their underlying interactive pathways. Unsurprisingly, these identified genes were found to be enriched in the pathways related to the development and maintenance of epithelial cells, their response to wounding and immune-related pathways. Regarding their tissue distribution, 13–15 of the identified genes were observed to be related to lung, skin, and gut: highly rich collagen-containing structures that are known to tolerate mechanical stressors. This goes in line with previous literature indicating that POSTN is preferentially expressed in the periosteum as well as other connective tissues that tolerate mechanical stress such as periodontal ligament, heart valves, and tendons.24 Cumulatively, this can suggest that different tissue sampling other than the respiratory system might reflect expression changes that occur in asthma and can be an alternative for bronchial epithelium in the clinical setting.
In order to understand if there is any similarity in POSTN expression between the nasal and upper lung airways, large datasets were explored. Upper airways nasal epithelium showed higher POSTN expression compared to the lower bronchial epithelium. In other words, the more peripheral the airways are, the lower is the POSTN expression. Moreover, neutrophilic asthma phenotype showed lower nasal POSTN expression compared to healthy controls and eosinophilic phenotype. Thus, our findings confirm previous studies where nasal cells expressed higher POSTN than bronchial, highlighting that nasal epithelial cells would be a more suitable surrogate for bronchial cells.39
In this study, we evaluated serum POSTN using a locally recruited patient cohort consisting of 32 asthmatics and 12 healthy controls. Asthmatic patients (non-severe and severe) showed a significantly higher level of plasma POSTN than healthy controls. These findings confirm that POSTN is upregulated in asthma but cannot differentiate between non-severe and severe asthmatics (Figure 5). Regarding non-severe asthmatics, the mild patients showed a significantly higher level of plasma POSTN compared to healthy controls while there was no significant difference between moderate asthmatics and healthy controls. This could be due to the difference in low-dose inhaled corticosteroids (ICSs) intake in each category since mild asthmatics receive low doses of ICSs while moderate ones receive higher doses of ICSs. These data confirm our bioinformatics results and previous reports where ICSs might suppress POSTN-induced asthmatic inflammation by reducing its serum level.40 On the other hand, only severe asthmatics who are not on Omalizumab (Xolair) showed significantly higher levels of plasma POSTN compared to healthy controls but severe asthmatics on Xolair did not show a significant difference compared to healthy controls. Xolair is a humanized anti-IgE monoclonal antibody that was shown to decrease the level of POSTN in patients with severe allergic asthma.41
Additionally, POSTN serum level was suggested as a biomarker for patient selection and predictor of Xolair response in previous studies.42
Another interesting finding in our study is the effect of BMI on POSTN plasma level with no effect on the saliva POSTN level. Class I obese participants showed higher POSTN plasma levels in comparison to overweight and class II-III obese patients, who exhibited the lowest POSTN plasma level. There was a controversial view in the literature where some studies have shown that BMI is in a negative association with serum POSTN in both healthy and asthmatic subjects,43,44 while others showed that there is no significant correlation between BMI and serum POSTN level.45
Due to the direct anatomic relation between the mouth and the upper airways and their similarity in cytokine composition with the lower airways in asthma, salivary analysis of POSTN could offer noninvasive rapid diagnostic aid in asthma control deterioration.46 Based on that, we evaluated the diagnostic value of saliva compared to the routine serum POSTN using the same locally recruited patient cohort. Only the mild asthmatic subcategory of non-severe asthmatics showed a higher level of saliva POSTN. On the contrary, severe asthmatic without Xolair therapy showed lower levels of saliva POSTN in comparison to moderate asthmatics. The decrease in POSTN level observed in severe asthmatics could be possibly explained by the local effect of steroid therapy that is frequently taken by moderate and severe asthmatics. The use of saliva POSTN as an inflammatory marker was previously investigated and promoted in periodontal disease,47,48 where POSTN levels were found to be significantly reduced in its experimental model.49 Up to our knowledge, this is the first study examining the level of POSTN in the saliva of asthmatic patients. Based on our findings, saliva POSTN level can be possibly used in discriminating the mild early stages of asthma from the healthy state. It would also be used as an early simple cost-effective screening tool to identify early asthma diagnoses to prevent complications.
Conclusion
Our results confirmed that POSTN is consistently upregulated in bronchial epithelium of asthmatic compared to healthy ones as well as in other closely related respiratory diseases (COPD and IPF). Its mRNA expression is affected by gender, sample anatomical site and type, steroid therapy, and smoking. Both plasma and saliva POSTN levels were higher in non-severe asthmatics compared to healthy controls and can be used as an early biomarker for asthmatic patients. Saliva POSTN level was more sensitive than plasma POSTN in differentiating between severe and non-severe asthmatics. Finally, patients’ characteristics such as BMI and the use of inhaled steroids/biologicals treatment should be carefully reviewed before any meaningful interpretation of POSTN level in the clinical practice.
Disclosure
RH is funded by the Sharjah Research Academy (Grant code: MED001), University of Sharjah (Grant code: 1901090254) and the Al-Jalila Foundation (Grant code: AJF201741). The authors report no other conflicts of interest in this work.
References
1. Siroux V, Bouzigon E. Asthma heterogeneity: the increasing genetic evidence. Lancet Respir Med. 2019;7(6):469–471. doi:10.1016/S2213-2600(19)30047-5
2. Kim H, Ellis AK, Fischer D, et al. Asthma biomarkers in the age of biologics. Allergy Asthma Clin Immunol. 2017;13:48. doi:10.1186/s13223-017-0219-4
3. Fajt ML, Wenzel SE. Asthma phenotypes and the use of biologic medications in asthma and allergic disease: the next steps toward personalized care. J Allergy Clin Immunol. 2015;135(2):299–310;. doi:10.1016/j.jaci.2014.12.1871
4. Robinson D, Humbert M, Buhl R, et al. Revisiting Type 2-high and Type 2-low airway inflammation in asthma: current knowledge and therapeutic implications. Clin Exp Allergy. 2017;47(2):161–175. doi:10.1111/cea.12880
5. Woodruff PG, Modrek B, Choy DF, et al. T-helper type 2-driven inflammation defines major subphenotypes of asthma. Am J Respir Crit Care Med. 2009;180(5):388–395. doi:10.1164/rccm.200903-0392OC
6. Izuhara K, Ohta S, Ono J. Using periostin as a biomarker in the treatment of asthma. Allergy Asthma Immunol Res. 2016;8(6):491–498. doi:10.4168/aair.2016.8.6.491
7. Yasuda M, Harada N, Harada S, et al. Characterization of tenascin-C as a novel biomarker for asthma: utility of tenascin-C in combination with periostin or immunoglobulin E. Allergy Asthma Clin Immunol. 2018;14(1):72. doi:10.1186/s13223-018-0300-7
8. Sánchez-García S, Habernau Mena A, Quirce S. Biomarkers in inflammometry pediatric asthma: utility in daily clinical practice. Eur Clin Respir j. 2017;4(1):. doi:10.1080/20018525.2017.1356160
9. James A, Hedlin G. Biomarkers for the phenotyping and monitoring of asthma in children. Curr Treat Options Allergy. 2016;3(4):439–452. doi:10.1007/s40521-016-0106-0
10. Matsumoto H. Serum periostin: a novel biomarker for asthma management. Allergol Int. 2014;63(2):153–160. doi:10.2332/allergolint.13-RAI-0678
11. Hamoudi RA, Appert A, Ye H, et al. Differential expression of NF-kappaB target genes in MALT lymphoma with and without chromosome translocation: insights into molecular mechanism. Leukemia. 2010;24(8):1487–1497. doi:10.1038/leu.2010.118
12. Zhou Y, Zhou B, Pache L, et al. Metascape provides a biologist-oriented resource for the analysis of systems-level datasets. Nat Commun. 2019;10(1):1523. doi:10.1038/s41467-019-09234-6
13. Fang H, Knezevic B, Burnham KL, et al. XGR software for enhanced interpretation of genomic summary data, illustrated by application to immunological traits. Genome Med. 2016;8(1):129. doi:10.1186/s13073-016-0384-y
14. Malone J, Holloway E, Adamusiak T, et al. Modeling sample variables with an Experimental Factor Ontology. Bioinformatics. 2010;26(8):1112–1118. doi:10.1093/bioinformatics/btq099
15. Chen EY, Tan CM, Kou Y, et al. Enrichr: interactive and collaborative HTML5 gene list enrichment analysis tool. BMC Bioinformatics. 2013;14:128. doi:10.1186/1471-2105-14-128
16. Lachmann A, Torre D, Keenan AB, et al. Massive mining of publicly available RNA-seq data from human and mouse. Nat Commun. 2018;9(1):1366. doi:10.1038/s41467-018-03751-6
17. Zervas E, Samitas K, Papaioannou AI, et al. An algorithmic approach for the treatment of severe uncontrolled asthma. ERJ Open Res. 2018;4(1):00125–2017. doi:10.1183/23120541.00125-2017
18. Dagur PK, McCoy JP
19. Izuhara K, Conway SJ, Moore BB, et al. Roles of periostin in respiratory disorders. Am J Respir Crit Care Med. 2016;193(9):949–956. doi:10.1164/rccm.201510-2032PP
20. Takahashi K, Meguro K, Kawashima H, et al. Serum periostin levels serve as a biomarker for both eosinophilic airway inflammation and fixed airflow limitation in well-controlled asthmatics. J Asthma. 2019;56(3):236–243. doi:10.1080/02770903.2018.1455855
21. Konstantelou E, Loukides S, Kostikas K, et al. Periostin as a biomarker in patients with asthma: associations with eosinophilia and Th2 response. Eur Respir J. 2015;46(suppl59):PA610.
22. Li W, Gao P, Zhi Y, et al. Periostin: its role in asthma and its potential as a diagnostic or therapeutic target. Respir Res. 2015;16(1):57. doi:10.1186/s12931-015-0218-2
23. Takayama G, Arima K, Kanaji T, et al. Periostin: a novel component of subepithelial fibrosis of bronchial asthma downstream of IL-4 and IL-13 signals. J Allergy Clin Immunol. 2006;118(1):98–104. doi:10.1016/j.jaci.2006.02.046
24. González-González L, Alonso J. Periostin: a matricellular protein with multiple functions in cancer development and progression. Front Oncol. 2018;8. doi:10.3389/fonc.2018.00225
25. Ohta S, Okamoto M, Fujimoto K, et al. The usefulness of monomeric periostin as a biomarker for idiopathic pulmonary fibrosis. PLoS One. 2017;12(3):e0174547. doi:10.1371/journal.pone.0174547
26. Corren J, Lemanske RF, Hanania NA, et al. Lebrikizumab treatment in adults with asthma. N Engl J Med. 2011;365(12):1088–1098. doi:10.1056/NEJMoa1106469
27. Kim SW, Kim JH, Jung MH, et al. Periostin may play a protective role in the development of eosinophilic chronic rhinosinusitis with nasal polyps in a mouse model. Laryngoscope. 2013;123(5):1075–1081. doi:10.1002/lary.v123.5
28. Arron JR, Izuhara K. Asthma biomarkers: what constitutes a ‘gold standard’? Thorax. 2015;70(2):105–107. doi:10.1136/thoraxjnl-2014-206069
29. Tan E, Varughese R, Semprini R, et al. Serum periostin levels in adults of Chinese descent: an observational study. Allergy Asthma Clin Immunol. 2018;14(1):87. doi:10.1186/s13223-018-0312-3
30. Cukic V, Lovre V, Dragisic D, et al. Asthma and Chronic Obstructive Pulmonary Disease (COPD) - differences and similarities. Mater Sociomed. 2012;24(2):100–105. doi:10.5455/msm.
31. Hammond C, Kurten M, Kennedy JL. Rhinovirus and asthma: a storied history of incompatibility. Curr Allergy Asthma Rep. 2015;15(2):. doi:10.1007/s11882-014-0502-0
32. Garcia-Garcia ML, Calvo C, Moreira A, et al. Thymic stromal lymphopoietin, IL-33, and periostin in hospitalized infants with viral bronchiolitis. Medicine (Baltimore). 2017;96(18):e6787. doi:10.1097/MD.0000000000006787
33. Jackson DJ, Makrinioti H, Rana BMJ, et al. IL-33-dependent type 2 inflammation during rhinovirus-induced asthma exacerbations in vivo. Am J Respir Crit Care Med. 2014;190(12):1373–1382. doi:10.1164/rccm.201406-1039OC
34. Hoshino M, Ohtawa J, Akitsu K. Effect of treatment with inhaled corticosteroid on serum periostin levels in asthma. Respirology. 2016;21(2):297–303. doi:10.1111/resp.12687
35. Yang HW, Park J-H, Shin J-M, et al. Glucocorticoids ameliorate periostin-induced tissue remodeling in chronic rhinosinusitis with nasal polyps. Clin Exp Allergy. 2018. doi:10.1111/cea.13267
36. Bateman ED, Bantje TA, Gomes MJ, et al. Combination therapy with single inhaler budesonide/formoterol compared with high dose of fluticasone propionate alone in patients with moderate persistent asthma. Am J Respir Med. 2003;2(3):275–281. doi:10.1007/BF03256655
37. Thomson NC, Chaudhuri R, Spears M, et al. Serum periostin in smokers and never smokers with asthma. Respir Med. 2015;109(6):708–715. doi:10.1016/j.rmed.2015.03.009
38. Caswell-Smith R, Hosking A, Cripps T, et al. Reference ranges for serum periostin in a population without asthma or chronic obstructive pulmonary disease. Clin Exp Allergy. 2016;46(10):1303–1314. doi:10.1111/cea.12763
39. Lopez-Guisa JM, Powers C, File D, et al. Airway epithelial cells from asthmatic children differentially express proremodeling factors. J Allergy Clin Immunol. 2012;129(4):990–997.e6. doi:10.1016/j.jaci.2011.11.035
40. Solanki B, Prakash A, Rehan HS, et al. Effect of inhaled corticosteroids on serum periostin levels in adult patients with mild-moderate asthma. Allergy Asthma Proc. 2019;40(1):32–34. doi:10.2500/aap.2019.40.4179
41. Tajiri T, Matsumoto H, Gon Y, et al. Utility of serum periostin and free IgE levels in evaluating responsiveness to omalizumab in patients with severe asthma. Allergy. 2016;71(10):1472–1479. doi:10.1111/all.2016.71.issue-10
42. Caminati M, Gatti D, Dama A, et al. Serum periostin during omalizumab therapy in asthma: a tool for patient selection and treatment evaluation. Ann Allergy Asthma Immunol. 2017;119(5):460–462. doi:10.1016/j.anai.2017.08.004
43. Kimura H, Konno S, Makita H, et al. Serum periostin is associated with body mass index and allergic rhinitis in healthy and asthmatic subjects. Allergol Int. 2018;67(3):357–363. doi:10.1016/j.alit.2017.11.006
44. Simpson JL, Yang IA, Upham JW, et al. Periostin levels and eosinophilic inflammation in poorly-controlled asthma. BMC Pulm Med. 2016;16(1):67. doi:10.1186/s12890-016-0230-4
45. Mohammed DR, Abdelnaby A, El Zamran E, et al. Role of serum periostin as a biomarker in diagnosis of bronchial asthma. Egypt J Chest Dis Tuberculosis. 2018;67(1):4. doi:10.4103/ejcdt.ejcdt_4_17
46. Wexler PJ, Siqueira WL, Helmerhorst EJ, et al. Saliva Diagnostics in Asthma. Proc Am Thorac Soc. 2009;6(3):334-334.
47.Aral CA, Köseoğlu S, Sağlam M, et al. Gingival Crevicular fluid and salivary periostin levels in non-smoker subjects with chronic and aggressive periodontitis: periostin levels in chronic and aggressive periodontitis. Inflammation. 2016;39(3):986–993. doi:10.1007/s10753-016-0328-0
48. Esfahrood ZR, Vardian ST, Yadegari Z, et al. Periostin levels in saliva of patients with chronic periodontitis. J Indian Soc Periodontol. 2018;22(1):25–27. doi:10.4103/jisp.jisp_239_17
49. Padial-Molina M, Volk SL, Taut AD, et al. Periostin is down-regulated during periodontal inflammation. J Dent Res. 2012;91(11):1078–1084. doi:10.1177/0022034512459655
 © 2020 The Author(s). This work is published and licensed by Dove Medical Press Limited. The
full terms of this license are available at https://www.dovepress.com/terms
and incorporate the Creative Commons Attribution
- Non Commercial (unported, 3.0) License.
By accessing the work you hereby accept the Terms. Non-commercial uses of the work are permitted
without any further permission from Dove Medical Press Limited, provided the work is properly
attributed. For permission for commercial use of this work, please see paragraphs 4.2 and 5 of our Terms.
© 2020 The Author(s). This work is published and licensed by Dove Medical Press Limited. The
full terms of this license are available at https://www.dovepress.com/terms
and incorporate the Creative Commons Attribution
- Non Commercial (unported, 3.0) License.
By accessing the work you hereby accept the Terms. Non-commercial uses of the work are permitted
without any further permission from Dove Medical Press Limited, provided the work is properly
attributed. For permission for commercial use of this work, please see paragraphs 4.2 and 5 of our Terms.