Back to Journals » Clinical Epidemiology » Volume 10
Concordance assessment of self-reported medication use in the Netherlands three-generation Lifelines Cohort Study with the pharmacy database IADB.nl: The PharmLines Initiative
Authors Sediq R ![]() , van der Schans J, Dotinga A, Alingh RA
, van der Schans J, Dotinga A, Alingh RA ![]() , Wilffert B
, Wilffert B ![]() , Bos JHJ
, Bos JHJ ![]() , Schuiling-Veninga CCM
, Schuiling-Veninga CCM ![]() , Hak E
, Hak E ![]()
Received 18 January 2018
Accepted for publication 5 April 2018
Published 16 August 2018 Volume 2018:10 Pages 981—989
DOI https://doi.org/10.2147/CLEP.S163037
Checked for plagiarism Yes
Review by Single anonymous peer review
Peer reviewer comments 3
Editor who approved publication: Professor Vera Ehrenstein
Rahmat Sediq,1 Jurjen van der Schans,1 Aafje Dotinga,2 Rolinde A Alingh,2 Bob Wilffert,1,3 Jens HJ Bos,1 Catharina CM Schuiling-Veninga,1 Eelko Hak1,4
1Department of Pharmaco-Therapy, Epidemiology & Economics, University of Groningen, Groningen Research Institute of Pharmacy, Groningen, the Netherlands; 2Lifelines Cohort Study, Lifelines Databeheer B.V., Groningen, the Netherlands; 3Department of Clinical Pharmacy and Pharmacology, University Medical Center Groningen, Groningen, the Netherlands; 4Department of Epidemiology, University Medical Center Groningen, Groningen, the Netherlands
Background: While self-reported data are commonly used as a source of medication use for pharmaco-epidemiological studies, such information is prone to forms of bias. Several previous studies showed that various factors like age, type of drug and data collection method may influence accuracy. We aimed to assess the concordance of the self-reported medication use that was documented at entry to the Lifelines Cohort Study, a three-generation follow-up study in the Netherlands that started in 2006 and included over 167,000 participants.
Materials and methods: As part of the PharmLines Initiative, we collected medication data from the Lifelines participants encoded according to the Anatomical Therapeutic Chemical (ATC) coding scheme and linked the data via Statistics Netherlands to the widely used and representative pharmacy prescription database of the University of Groningen, IADB.nl. Analyses were conducted at second level of ATC coding for all recorded medications as well as a top list of most used medications at drug-specific fifth level. Cohen’s kappa statistics were used to measure the concordance for all participants according to sex and age.
Results: The level of concordance between the two data sources largely differed according to the therapeutic class. Medication used for the cardiovascular system and diabetes, thyroid therapy, bisphosphonates and anti-thrombotic drugs showed a very good agreement (κ>0.75). Medication as needed or prone to stigmatization bias showed a moderate agreement (κ=0.41–0.60), whereas medications used for short periods of time showed a fair agreement (κ=0.0–0.4). Concordance was similar for males and females, but younger adults tended to have lower concordance rates than older adults.
Conclusion: The self-reported method was valid for capturing prevalent chronic medication use at one moment in time, but invalid for medication used for short periods of time. There is no effect of sex on the agreement, and more studies are needed on the influence of age. Future pharmaco-epidemiological studies should preferably combine the two data sources to achieve the highest accuracy of drug exposure rates.
Keywords: self-reported data, prescription data, pharmacy records, agreement, questionnaire, medication, interview, validity
Introduction
The Lifelines Cohort Study was started in 2006 to study risk factors for disease development in the long-term and to conduct “real-world” pharmaco-epidemiological studies using self-reported data to determine exposure to medications.1,2 However, self-reported data are prone to recall bias, which can result in substantial (non-)differential misclassification of actual drug exposure and hence may lead to an underestimation or overestimation of the true medication use and effects.3–5 Due to their high accuracy, electronic medication records (EMR) are usually seen as the golden standard compared to self-reported medication use.6 By contrast, self-reported data contain information on which medication is actually used by the respondent and may also provide information about usage of over-the-counter (OTC) medication and herbal medicines.7 To date, few studies evaluated the concordance of self-reported medication use compared to EMR, and the results are inconsistent.8–15 These studies reported good agreement between self-reported medication use and electronic records in most instances, but agreement varied significantly by therapeutic group. For example, in some studies a remarkably high agreement between pharmacy records and self-reports was shown for medication used chronically such as cardiovascular drugs, drugs for diabetes, anticoagulation-related drugs and hormonal drug treatments.8–11 By contrast, lower concordance rates were observed for medication taken topically, as needed or for shorter periods.7,12,13 Studies in various settings reported that with increasing age the level of recall decreases, while sex did not appear to influence recall of medication use.14,15
In the PharmLines Initiative, we first conducted a cross-sectional descriptive study to assess the concordance of the self-reported medication use that was documented at entry to the Netherlands Lifelines Cohort Study by comparing such information with the widely researched and representative University Groningen pharmacy prescription database IADB.nl. The IADB.nl was regarded as the “golden standard” for these analyses (see “Materials and methods” section for description). Further, we also aimed to describe the influence of the type of medication, age and sex on the concordance rates.
Materials and methods
Setting and study design
In 2017, the Groningen Research Institute of Pharmacy, Department of Epidemiology and Clinical Pharmacy and Department of Pharmacology of the University Medical Center Groningen and the Lifelines Cohort Study (see https://www.lifelines.nl/researcher/about-lifelines) started the PharmLines Initiative to link data of the Lifelines Cohort Study to the University Groningen prescription database, IADB.nl. The Lifelines Cohort Study was started in the north of the Netherlands between 2006 and 2013 as an academic resource for researchers worldwide. The study design concerns an observational follow-up study with long-term prospective measurements in a large population aiming to explore the interaction between genetic and environmental factors in the development of multifactorial diseases.16 In short, since all inhabitants in the Netherlands are registered with a general practitioner (GP), eligible participants were invited to participate in the Lifelines Cohort Study through their GP. A large number of GPs within the northern three provinces of the Netherlands (Friesland, Groningen and Drenthe) were involved and invited all their patients between the ages of 25 and 50 years, unless the participating GP considered the patient not eligible based on the following criteria: severe psychiatric or physical illness; limited life expectancy (<5 years); or insufficient knowledge of the Dutch language to complete a Dutch questionnaire. Subsequently, individuals who were interested to participate received detailed information by mail about the Lifelines Cohort Study and an informed consent form. After the signed informed consent was received by the Lifelines organization, the participants received a baseline questionnaire and an invitation to a comprehensive health assessment at the Lifelines research site. More than 167,000 people from the three Northern provinces of the Netherlands participated in this three-generation study. During the entry period, participants completed a number of questionnaires, underwent a medical examination and biological samples including DNA were collected and stored. Methods that were employed to obtain information on the medication use were as follows: 1) by asking the participants about their medication use through a questionnaire and 2) by bringing their used medications at the time of the interview. All medications were then recorded by a doctor’s assistant. All prescribed medications were classified according to the Anatomical Therapeutic Chemical (ATC) coding scheme.17
In order to validate this self-reported Lifelines Cohort Study medication database in a cross-sectional study design, we compared it to the pharmacy prescription database of University of Groningen, IADB.nl, which we regarded as the “golden standard”. The IADB.nl database is a growing pharmacy database that in 2013 comprised more than 60 public pharmacies and contained prescription data from approximately 600,000 patients in the northern part of the Netherlands. The coverage is approximately 20% of the inhabitants of the northern provinces. Except for a registration at the participating pharmacy, no specific inclusion or exclusion criteria were applied. In the Netherlands, all patients are registered at a pharmacy independent of their health insurance status. Prevalence of medication use was found to be representative for the national population as a whole.18 Prescription data have been collected for almost 20 years since 1994 and each patient is uniquely tracked in the system. The prescription records comprise information about the medication, for example, the date and quantity of dispensing, dosage of the administrated drug and the ATC code. The data are stored anonymously and all patients are given an anonymous patient code. Demographic information such as date of birth and sex is available. This database provides virtually complete medication records, except for OTC drugs and medication dispensed during hospitalization.18
PharmLines Initiative: linkage and study population
In the PharmLines Initiative, both databases from the Lifelines Cohort Study and IADB.nl were linked by Statistics Netherlands (CBS), which acted as Third Trusted Party at the patient level using deterministic linkage on the basis of unique identifiable information. The IADB.nl is a longitudinal database that creates new patient records if information about a patient is changed. For instance, if a patient moves to another address, the new postal code together with all the patient information is stored in a new record. All these patient records were uploaded to the CBS for linkage. The linkage of IADB with the longitudinal database of the CBS was done in four steps. The first linkage was carried out on the full 6 characters of the postal code in combination with sex and date of birth. In the second linkage, records of patients with the same IADB number as the already linked patients were added to the linked patients. The total linkage of these two steps gave a 48.3% linkage. The third linkage was done on the 4 digits of the postal code in combination with sex and date of birth. Again, only unique combinations of the CBS person number and the IADB.nl number were selected. In the fourth linkage, records of patients with the same IADB.nl number as the already linked patients were added to the linked patients. The total linkage of these two last steps gave a 42.8% linkage. Total linkage of all uploaded records was 90.1%. Once the linkage was completed, all unique patient identifiers were removed by CBS. Each participant was then given an unique identifier code in order to be able to compare the medication use at a patient level for each included ATC code. The analysis was done in a password secured electronic environment provided by the CBS.
The study population was restricted to all adults (≥18 years) for whom baseline information was recorded in the Lifelines Cohort Study database as well as in the IADB.nl database. The date on which the participants were enrolled in the IADB.nl database was at least 6 months before the Lifelines baseline measurement of each participant. Such restriction ensures that different time windows can be chosen for the IADB.nl data, whilst the study population will remain unchanged.
Study parameters and data analysis
The linked information relevant to this study consisted of anonymized identifier codes, ATC codes, dispensing dates, date of entry in the IADB database, sex and age at the time of the first visit at entry to the cohort. The very first interview with the Lifelines Cohort Study participant was considered the baseline measurement and only the data of the baseline measurements (entry period) were used in the comparison of the two databases.
All drugs grouped at a second level of ATC coding were examined in the study. Besides the second level ATC codes, some specific drugs at the chemical level were included in the study. A top list of the several most commonly used drugs in the Netherlands including omeprazole, psylla seeds, macrogol, calcium, hydrochlorothiazide, metoprolol, enalapril, simvastatin, ketoconazole, triamcinolone, clobetasol, levothyroxine, oxazepam, temazepam, paroxetine, fluticasone, mometasone, salbutamol, salmeterol/fluticasone, desloratadine, artificial tears, carbasalate ca., diclofenac and ibuprofen was also examined.
The program SQL Server was used to compare the records of drugs for each participant. The acquired data was then categorized in true positives, true negatives, false positives (FPs) and false negatives (FNs). These values were given in cross-tables, which were used to calculate the concordance. Each of the four cells in these cross-tables were required to have at least 5 participants. If the number of participants was lower than 5 in one or more cells, the drug group or specific drug was disregarded.
In order to address the possible underlying cause of a low agreement, the FNs and FPs were examined. Over-reporting represents the number of FPs. This means that a number of participants reported the use of a certain drug group, while at the same time the prescription was not registered in the pharmacy records. On the other hand, under-reporting represents the number of FNs. This means that the participants did not report the use of a certain drug group, while at the same time the prescription was registered in the pharmacy records. If a drug group or specific drug showed a poor agreement and at the same time a high over-reporting, it could indicate that the database with the self-reported data is better capable in recording the use of this specific drug (or drug group).
Subgroup analysis
The participants were also stratified on age and sex in order to investigate the influence of these factors on the concordance rates. This was only applied for a selection of most commonly used medications at lowest fifth level ATC codes (chemical substance specific coding).
To determine if participants reported medication that they had not yet started to use in the period around the interview, but started to use earlier or immediately after the interview, we defined various overlapping time windows. The effect of the overlapping time window was examined and therefore a sensitivity analysis was performed for 6 different time windows. To determine the effect of different time windows on the outcome of the comparison of the databases, time windows of 30 days, 90 days, 105 days, 120 days and 180 days before the baseline measurement were used. In addition to the previous time windows, a time window of 90 days prior and 2 weeks after the baseline measurement was chosen (referred to as 14–90 days).
Statistical methods
Medication data fields from both the Lifelines Cohort Study database and IADB.nl were blank if there was no medication recorded and present if there was an ATC code recorded. Therefore, we could not establish missingness and assumed absence of medications if the record was blank. The Cohen’s kappa statistic was used to measure the concordance rate, and the pharmacy prescription data was considered as the golden standard. The 95% CI for Cohen’s kappa was calculated using the standard error.19 The Cohen’s kappa values were interpreted according to the guidelines proposed by Altman et al: poor (<0.20), fair (0.20–0.40), moderate (0.41–0.60), good (0.61–0.80), very good (0.81–1.00).20 Since statistical comparisons of kappa measures have some limitations, we decided to interpret the 95% CIs of the Cohen’s kappa values. If these did not overlap for the respective comparison groups, the comparison was considered to indicate a significant difference. Statistical analyses were conducted with IBM SPSS software, version 25, 2017.
Results
After the linkage of the two databases, the total overlap consisted of 45,000 adult Lifelines participants. For the current comparison applying the abovementioned strict eligibility criteria, 16,367 Lifelines participants who fulfilled the eligibility criteria could be examined. Of the 16,367 persons, 64% were females and the mean age of the included population was 44 years.
At the second level of ATC coding, the concordance between the two data sources varied from poor to very good for the various drug groups (see Table 1). The lowest concordance was found between the two data sets for gynecological anti-infectives (kappa [k]= 0.09; 95% CI: 0.04–0.15), whereas the best concordance was found for levothyroxine (H03AA01) (k= 0.84; 95% CI: 0.81–0.86, Table 2). Overall, drugs intended for chronic use showed a good to very good agreement between the two data sources including antidiabetic drugs, medication for the cardiovascular system, anti-thrombotic drugs, psychoanaleptics, medication for obstructive airway diseases, thyroid therapy, bisphosphonates and anti-gout agents. Surprisingly, some drug groups that may also be used chronically also showed a moderate concordance like for immunosuppressants, antineoplastics and cardiac therapeutics, though acute short-term use (<3 months) may be prevalent among the participants.
 | Table 1 Overview of all second level ATC codes including their respective kappa values and 95% CI Note: The number of people who over-reported or under-reported the medication usage is also displayed in order to gain insight into the cause of the respective high/low kappa value. The displayed data are based on a time window of 90 days. The numbers in bold mean that the medications showed good and very good agreement (0.61 and more). Abbreviation: ATC, Anatomical Therapeutic Chemical. |
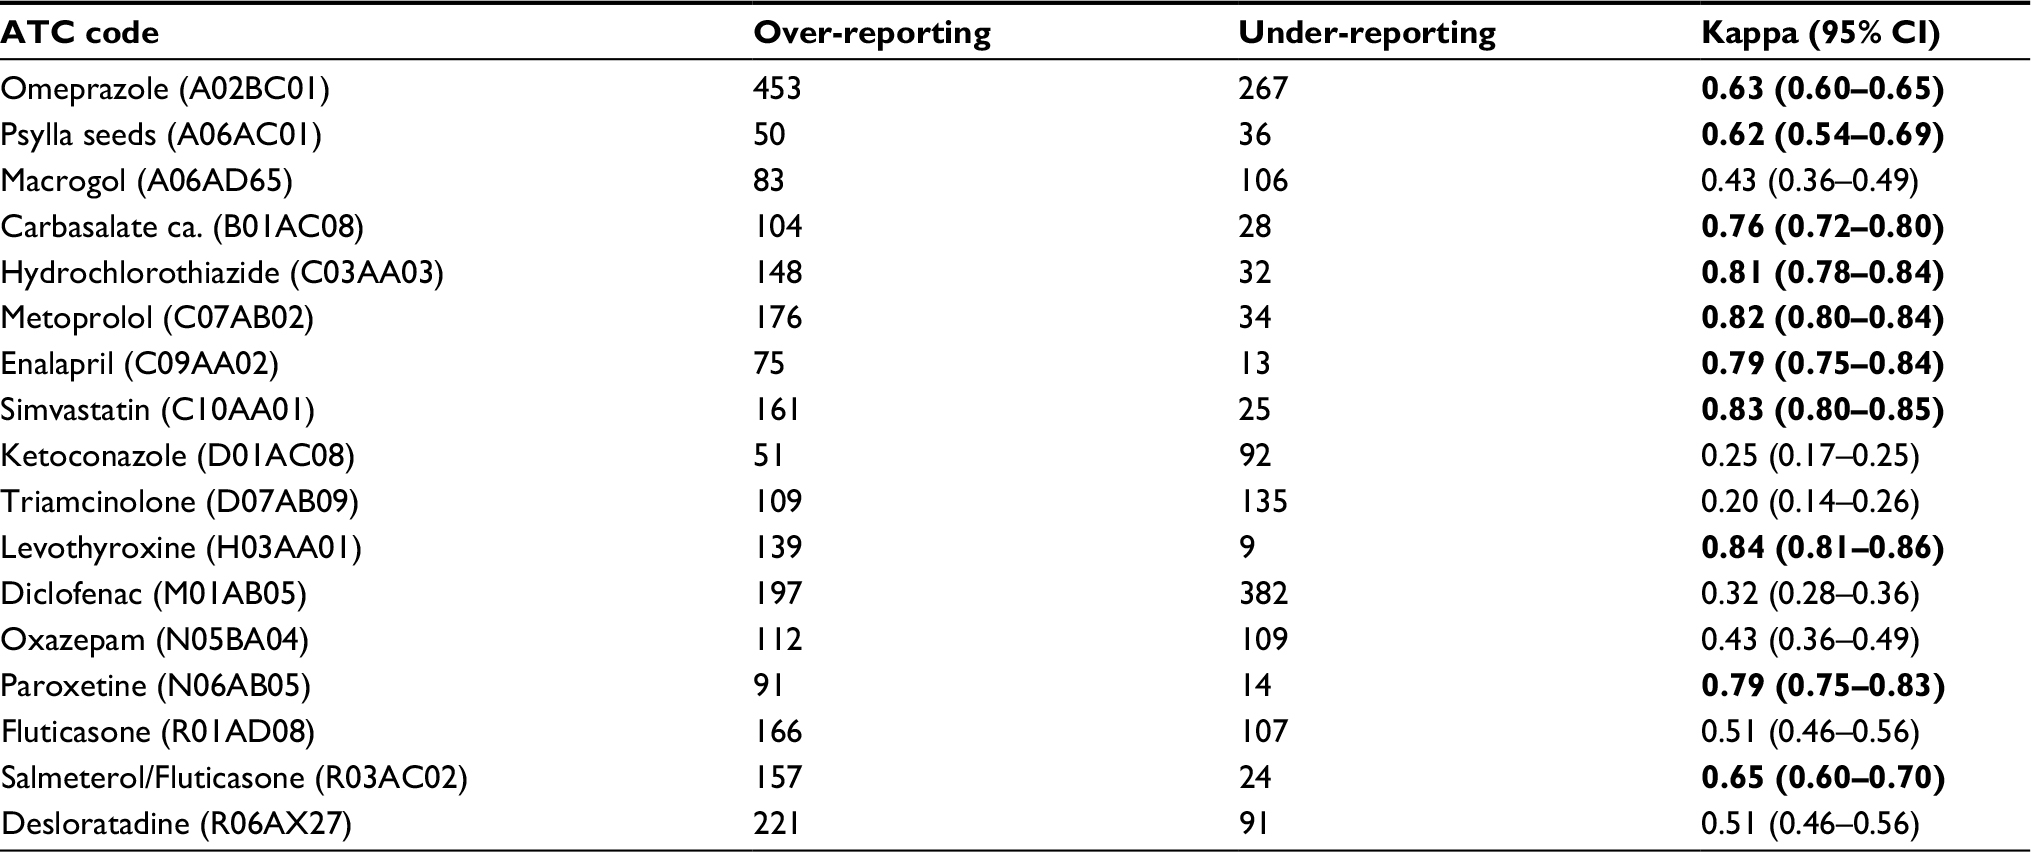 | Table 2 Overview of all included fifth level ATC codes including their respective kappa values and 95% CI Note: The number of people who over-reported or under-reported the medication usage is also displayed in order to gain insight into the cause of the respective high/low kappa value. The displayed data are based on a time window of 90 days. The numbers in bold mean that the medications showed good and very good agreement (0.61 and more). Abbreviation: ATC, Anatomical Therapeutic Chemical. |
Moderate agreement (k= 0.41–0.60) was mainly found for medications that were used most commonly for short-term use medication. This was found for anti-anemics, antihistamines, analgesics and nasal preparations. Medication used for short periods of time or topical application, for example, anti-acne drugs, antimycotics, antibacterials, triamcinolone, antifungals and antibiotics, showed a poor to fair agreement (k= 0–0.40).
Remarkably, all included cardiovascular ATC groups showed an agreement of k= 0.61 or higher, except the cardiac therapy (C01) and vasoprotective (C05), which showed an agreement of k =0.60 and k= 0.21, respectively.
In Figure 1, the results of the different time windows used for the IADB database are shown. For each second level ATC code, the time window of 30 days resulted in a significant lower agreement between the two data sources. The other time windows did not show a significant difference. A detailed overview of the results according to the different time windows at all second level ATC codes can be found in Appendices 1–6.
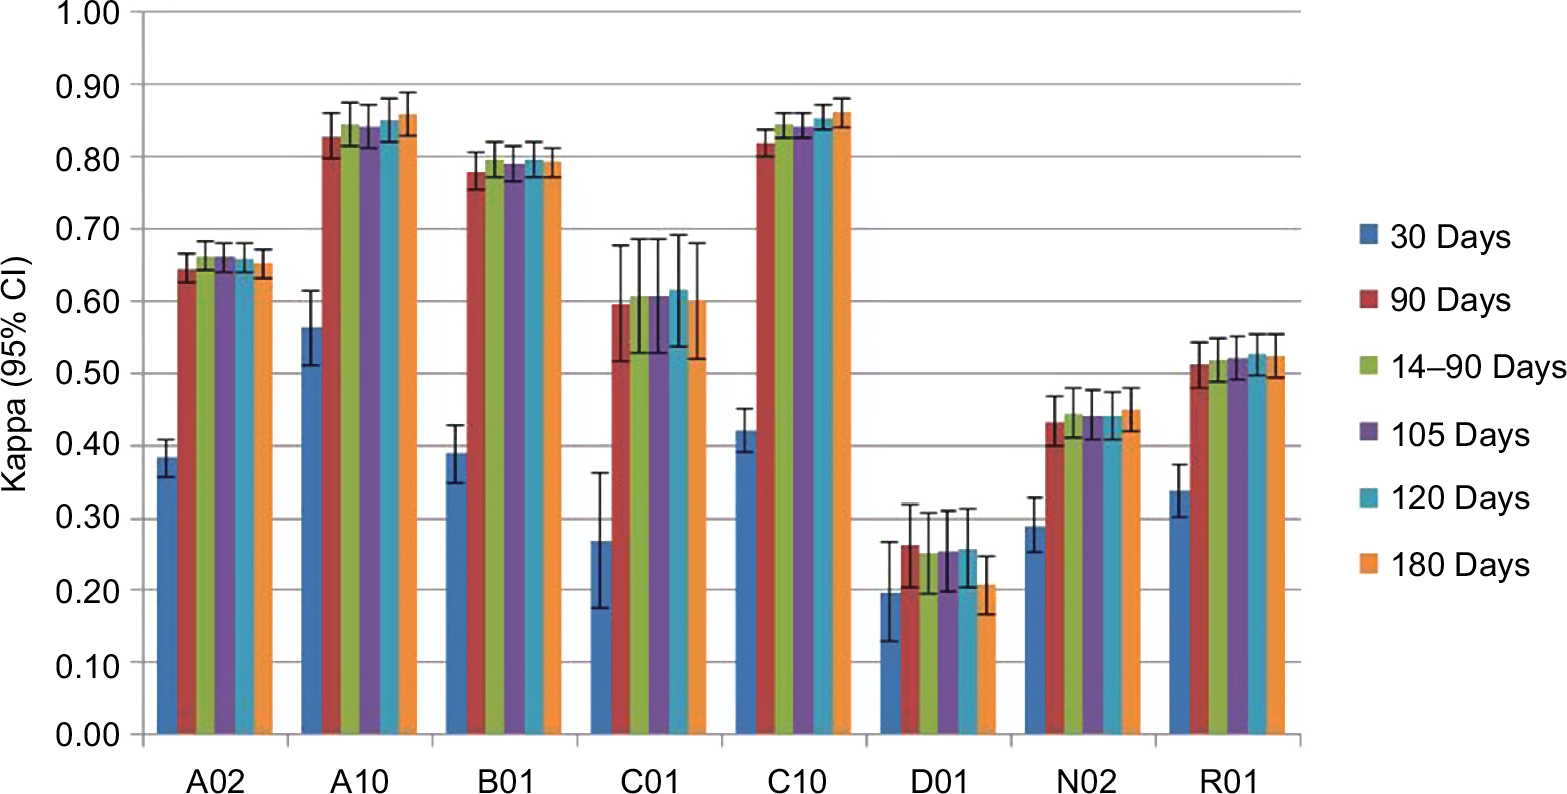 | Figure 1 Kappa values for the different time windows (30 days, 90 days, 14–90 days, 105 days, 120 days and 180 days) with the corresponding 95% CI for each second level ATC code. Abbreviation: ATC, Anatomical Therapeutic Chemical. |
In Figure 2, the effect of age on the concordance between the two data sources is displayed. The concordance rates tend to increase with increasing age, but in most cases the 95% CIs show an overlap. The only significant difference in kappa values was found for the age groups 18–35 and 65+ years, and such differences could only be observed for levothyroxine, carbasalate calcium, diclofenac and omeprazole. Medication used topically showed no significant differences. Detailed results of the effect of the participants’ age on all concordance rates medication can be found in Appendices 9–12.
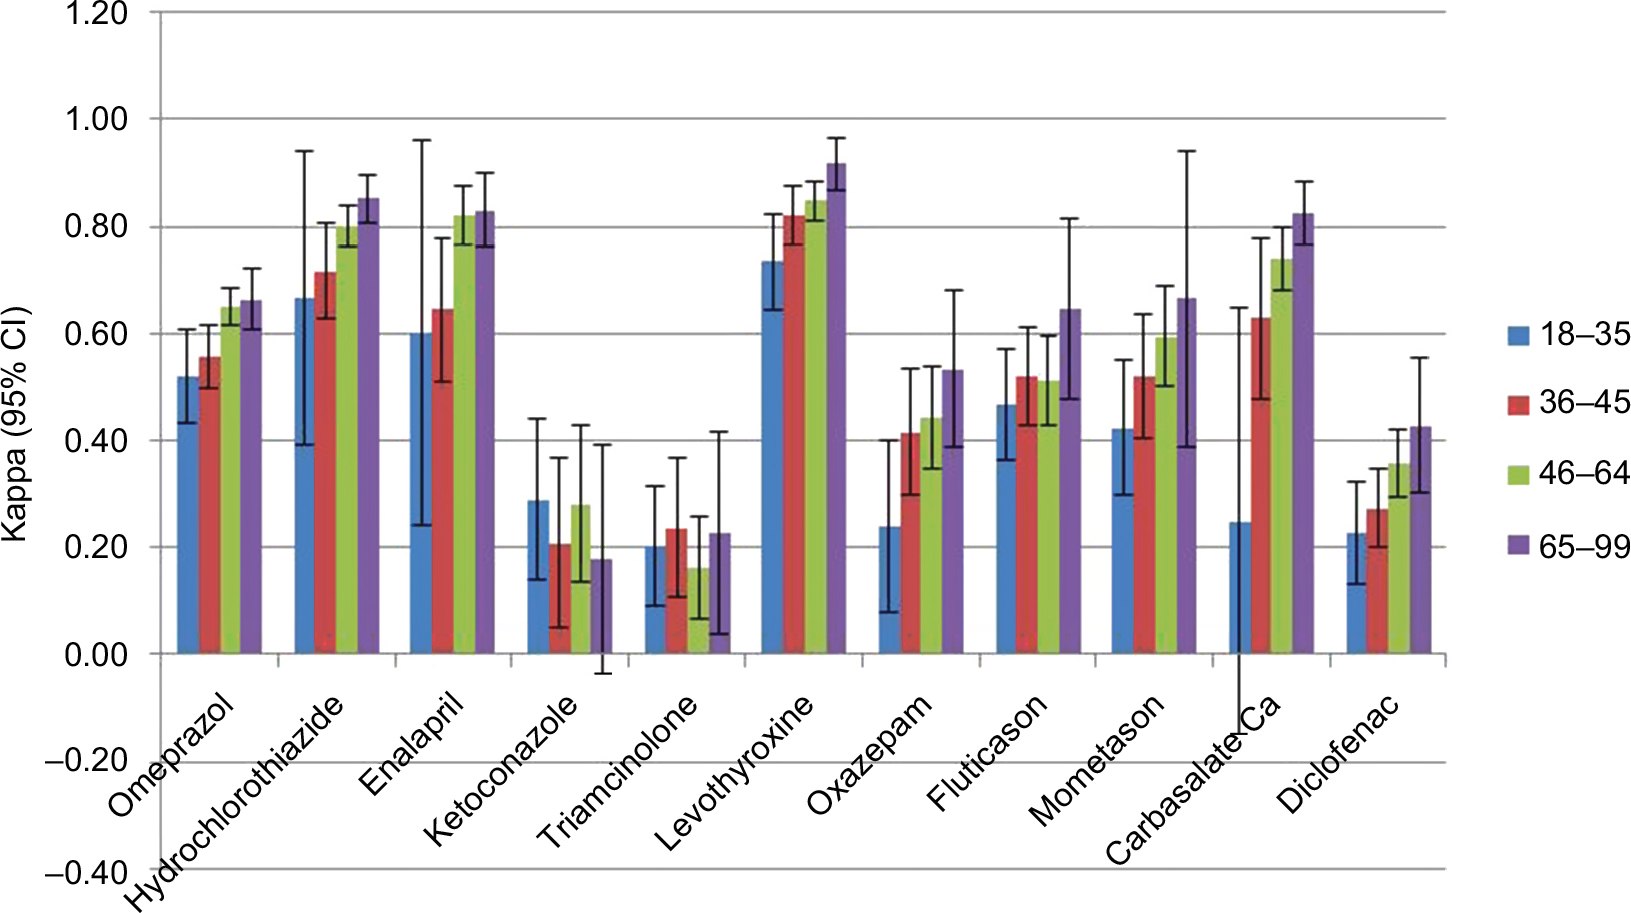 | Figure 2 Kappa values and the corresponding 95% CI are displayed for a selection of medications. Notes: The participants are arranged in four age groups; 18–35, 36–45, 46–64 and 65+ years. For 9 classes of medication, data were less than 5 per cell to calculate kappa (see Materials and methods). |
Figure 3 displays results for a top list of most frequently used medication in the population. Kappa values of different medication classes showed an overlap in concordance rates between males and females, which is indicative for no significant differences. Detailed results of the effect of the participants’ sex on the concordance rates of all studied types of medication can be found in Appendices 7 and 8.
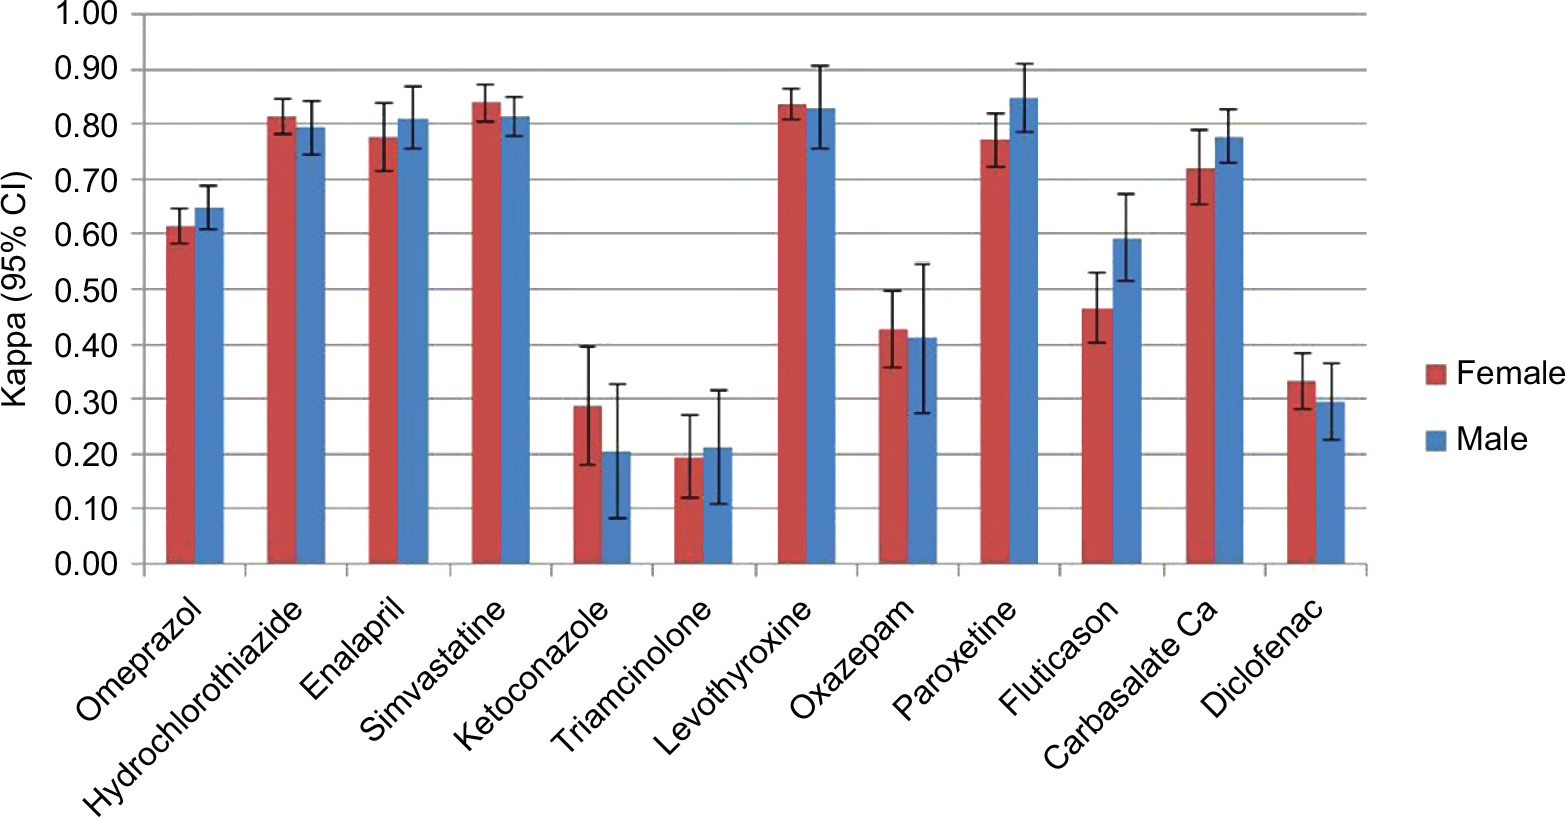 | Figure 3 Kappa values stratified on sex. Note: The influence of sex on the agreement between data sources for a selection of medication is made clear. The error bars display the 95% CI. For 8 classes of medication, data were less than 5 per cell to calculate Kappa (see Materials and methods). |
Discussion
This concerns a descriptive study with the primary aim to describe concordance rates between self-reported and prescription medication data for an unselected population participating in the Lifelines Cohort Study, and to explore new relationships in the data. Overall, we have found that the concordance rates between the two data sources differ according to the therapeutic class and age. Medication used for example for the cardiovascular system and diabetes, thyroid therapy, anti-thrombotic drugs and medication for obstructive airway diseases showed a good to very good concordance (k>0.60). This indicates that, at entry to the cohort, drugs intended for chronic use are reliably self-reported by patients, a finding which is in line with earlier studies.8–11
In contrast to our expectations, some chronically used medications, like antineoplastics and immunosuppressants, showed only a moderate kappa value. Since these medications are used for serious conditions and are typically used chronically, a high concordance between the two databases was expected.21 One possible explanation for the moderate kappa values is that antineoplastics and immunosuppressants are commonly started and dispensed in hospitals, and the use of such medication is possibly not accurately registered in the IADB.nl database. This is also supported by the fact that these medications are largely over-reported. Therefore, self-reported data are required next to EMRs to more accurately obtain information on exposure rates to such medications.
Medications intended for use on an as-needed basis overall showed a moderate (k=0.41–0.60) concordance, whereas medications used for short periods of time overall showed a poor to fair concordance (k=0–0.40). These medications are taken less often or on an irregular basis and therefore might be under-reported by the participants.7,13
Dermatologicals showed an overall poor to fair (k=0–0.40) concordance. The reason for the low concordance can be attributed mostly to under-reporting of the medication use. This could be due to the reason that patients do not regard dermatologicals as medication and therefore under-reported the use of such medication.8
On the other hand, over-reporting was observed for drugs like sex hormones, analgesics, antihistamines and drugs for acid-related disorders. Such drugs are also OTC medications. Therefore, a large portion of their use is not recorded in the pharmacy database indicating that self-reported data may be a better way to capture the use of such medications. Unexpectedly, most of the cardiovascular drugs were also over-reported to some extent. We can only speculate on the reasons and more research is needed to find the cause for this finding.
It is remarkable that vasoprotectives and gynecological anti-infectives showed a poor concordance. These medical drugs are used for conditions like rectal fissures, hemorrhoids and genital infections. We may only speculate that patients do not like to disclose information about such conditions. Stigmatization bias could therefore be the reason for the low concordance between the two data sources. The fact that these medications are significantly under-reported supports this theory.
We studied the influence of time windows, sex and age on the concordance rates. Methodologically, time windows are important in concordance studies to draw valid conclusions. In the Netherlands, chronically used medications are prescribed every 3 months. Therefore, the time window of 30 days resulted in a significantly lower concordance for chronically used medication. However, for medication used for short periods of time such as antifungals and antimycotics, the results for the time window of 30 days did not significantly differ from the other time windows. In fact, the 30-day time window resulted in a higher concordance for medications like antibacterials and antiprotozoals. The remaining time windows did not differ significantly from each other. The current use of a medication is determined by the amount of medication that is prescribed at a certain time point. A time window that is too large is not suitable to represent the current medication use of a participant and most studies done so far used a time window of 90 days. Therefore, it is advisable to use the time window of 90 days for future research. In line with earlier studies, no effect of sex on the concordance was found. However, in contrast to earlier findings, an increase in age seems to result in an increase in agreement.14,15 Even though an increase in age seems to go hand in hand with an increase in concordance, the 95% CIs overlap in most cases. The included study population consists of a relative young population with a mean age of 44 years and this could be the reason of the difference in the effect of age on the recall of medication. Older people generally use more medication and have lower cognitive abilities than younger people, and thus the concordance between the two databases could be significantly lower for an older population. A larger population size may lead to smaller CIs and may help create a better understanding of the influence that the participants’ age has on the medication recall.
There are some limitations to our study. Though this was one of the largest studies to date on the concordance of self-reported data on medication use, the number of participants using certain medication classes was still low. Some ATC codes could not be included as there were not enough data. As the size of the IADB.nl database will increase over time, the overlap of the two databases will also grow. This makes it possible to include more participants in future studies. Further, we could not establish missingness and assumed absence of medications if the record was blank. If anything, this would lead to potential random misclassification. Finally, in a previous study it was shown that the adult Lifelines cohort population is representative of the Dutch adult population. However, medication use is very culture-dependent and the results may not be applicable directly to countries with other health care systems.22
To conclude, the concordance between the self-report database and the prescription database varied per therapeutic group. The self-reported method as applied by the Lifelines Cohort Study is valid for capturing most medications that are intended for chronic use and OTC medications. However, it is less suitable for recording medications used on an as-needed basis, medications used for short periods of time and/or topical medications. Stigmatization bias could have a large influence on the self-report of certain medication classes like vasoprotectives and gynecological anti-infectives. Sex does not influence the concordance, and an increase in age tended to result in a slightly better recall. However, more studies on the effects of age on the concordance are needed. Future pharmaco-epidemiological studies should preferably combine the two data sources to achieve the highest accuracy of drug exposure rates.
Acknowledgments
Lifelines has been funded by a number of public sources, notably the Dutch Government, The Netherlands Organization of Scientific Research NWO (grant 175.010.2007.006), the Northern Netherlands Collaboration of Provinces (SNN), the European fund for regional development, Dutch Ministry of Economic Affairs, Pieken in de Delta, Provinces of Groningen and Drenthe, University of Groningen and University Medical Center Groningen, the Netherlands. The IADB.nl and the current study within the PharmLines Initiative are funded by the University of Groningen, Groningen Research Institute of Pharmacy. The authors wish to acknowledge the services of the Lifelines Cohort Study and all the study participants, and the participating IADB.nl pharmacies for kindly providing their data for research.
Author contributions
All authors contributed toward data analysis, drafting and revising the paper and agree to be accountable for all aspects of the work.
Disclosure
The authors report no conflicts of interest in this work.
References
Balder JW, de Vries JK, Nolte IM, Lansberg PJ, Kuivenhoven JA, Kamphuisen PW. Lipid and lipoprotein reference values from 133,450 Dutch Lifelines participants: age- and gender-specific baseline lipid values and percentiles. J Clin Lipidol. 2017;11(4):1055–1064. | ||
Nass KJ, van den Berg EH, Faber KN, Schreuder TCMA, Blokzijl H, Dullaart RPF. High prevalence of apolipoprotein B dyslipoproteinemias in non-alcoholic fatty liver disease: the lifelines cohort study. Metabolism. 2017;72:37–46. | ||
West SL, Strom BL, Poole C, Kimmel SE. Validity of pharmacoepidemiology drug and diagnosis data. In: Strom BL, editor. Pharmacoepidemiology. Chichester: John Wiley & Sons Ltd; 2000:661–705. | ||
Groves RM, Fowler FJ, Couper MP, et al. Survey Methodology. Hoboken: John Wiley & Sons; 2004. | ||
Jurek AM, Greenland S, Maldonado G, Church TR. Proper interpretation of non-differential misclassification effects: expectations vs observations. Int J Epidemiol. 2005;34:680–687. | ||
Schneeweiss S, Avorn J. A review of the use of health care utilization databases for epidemiological research on therapeutics. J Clin Epidemiol. 2005;58(4):323–337. | ||
Nielsen MW, Søndergaard B, Kjøller M, Hansen EH. Agreement between self-reported data on medicine use and prescription records vary according to method of analysis and therapeutic group. J Clin Epidemiol. 2008;61(9):919–924. | ||
Richardson K, Kenny RA, Peklar J, Bennett K. Agreement between patient interview data on prescription medication use and pharmacy records in those aged older than 50 years varied by therapeutic group and reporting of indicated health conditions. J Clin Epidemiol. 2013;66(11):1308–1316. | ||
So L, Morgan SG, Quan H. Does concordance between survey responses and administrative records differ by ethnicity for prescription medication? J Popul Ther Clin Pharmacol. 2012;19(2):e248–e258. | ||
Wu C, Lai M, Shur-Fen Gau S, Wang S, Tsai H. Concordance between patient self-reports and claims data on clinical diagnoses, medication use, and health system utilization in Taiwan. PLoS One. 2014;9(12):e112257. | ||
Haapea M, Miettunen J, Lindeman S, Joukamaa M, Koponen H. Agreement between self-reported and pharmacy data on medication use in the Northern Finland 1966 Birth Cohort. Int J Methods Psychiatr Res. 2010;19(2):88–96. | ||
Monster TB, Janssen WM, de Jong PE, de Jong-van den Berg LT; PREVEND Study Group Prevention of REnal and Vascular ENT Stage Disease. Pharmacy data in epidemiological studies: An easy to obtain and reliable tool. Pharmacoepidemiol Drug Saf. 2002;11(5):379–384. | ||
Gama H, Correia S, Lunet N. Questionnaire design and the recall of pharmacological treatments: a systematic review. Pharmacoepidemiol Drug Saf. 2009;18(3):175–187. | ||
Van den Brandt PA, Petri H, Dorant E, Goldbohm RA, van de Crommert S. Comparison of questionnaire information and pharmacy data on drug use. Pharmaceutisch Weekblad. 1991;13(2):91–96. | ||
West SL, Savitz DA, Koch G, Strom BL, Guess HA, Hartzema A. Recall accuracy for prescription medications: self-report compared with database information. Am J Epidemiol. 1995;142:1103–1112. | ||
Scholtens S, Smidt N, Swertz MA, et al. Cohort profile: LifeLines, a three-generation cohort study and biobank. Int J Epidemiol. 2015;44(4):1172–1180. | ||
WHO. ATC/DDD Index 2018. Available from: https://www.whocc.no/atc_ddd_index/. Accessed September 13, 2017. | ||
Visser ST, Schuiling-Veninga CCM, Bos HJ, et al. The population-based prescription database IADB.nl: its development, usefulness in outcomes research and challenges. Expert Rev Pharmacoecon Outcomes Res. 2013;13(3):285–292. | ||
Reichenheim ME. Confidence intervals for the kappa statistic. Stata J. 2004;4(4):421–428. | ||
Altman DG. Practical Statistics for Medical Research. London: Chapman & Hall; 1991 | ||
Caskie GI, Willis SL, Warner Schaie K, Zanjani FA. Congruence of medication information from a brown bag data collection and pharmacy records: findings from the Seattle longitudinal study. Exp Aging Res. 2006;32(1):79–103. | ||
Klijs B, Scholtens S, Mandemakers JJ, Snieder H, Stolk RP, Smidt N. Representativeness of the LifeLines Cohort Study. PLoS One. 2015;10(9):1–12. |
 © 2018 The Author(s). This work is published and licensed by Dove Medical Press Limited. The
full terms of this license are available at https://www.dovepress.com/terms
and incorporate the Creative Commons Attribution
- Non Commercial (unported, 3.0) License.
By accessing the work you hereby accept the Terms. Non-commercial uses of the work are permitted
without any further permission from Dove Medical Press Limited, provided the work is properly
attributed. For permission for commercial use of this work, please see paragraphs 4.2 and 5 of our Terms.
© 2018 The Author(s). This work is published and licensed by Dove Medical Press Limited. The
full terms of this license are available at https://www.dovepress.com/terms
and incorporate the Creative Commons Attribution
- Non Commercial (unported, 3.0) License.
By accessing the work you hereby accept the Terms. Non-commercial uses of the work are permitted
without any further permission from Dove Medical Press Limited, provided the work is properly
attributed. For permission for commercial use of this work, please see paragraphs 4.2 and 5 of our Terms.