Back to Archived Journals » Advances and Applications in Bioinformatics and Chemistry » Volume 11
Computational analysis of ligand-receptor interactions in wild-type and mutant erythropoietin complexes
Received 14 June 2018
Accepted for publication 30 August 2018
Published 15 October 2018 Volume 2018:11 Pages 1—8
DOI https://doi.org/10.2147/AABC.S177206
Checked for plagiarism Yes
Review by Single anonymous peer review
Peer reviewer comments 3
Editor who approved publication: Dr Juan Fernandez-Recio
Nicholas J Pekas, Samuel S Newton
Division of Basic Biomedical Sciences, Sanford School of Medicine, University of South Dakota, Vermillion, SD 57069, USA
Background: Erythropoietin (EPO), a pleiotropic cytokine, binds to its receptor (EPOR) in bone marrow, activating a signaling cascade that results in red blood cell proliferation. A recently discovered naturally occurring EPO mutation (R150Q) at active site 1 (AS1) of the protein was shown to attenuate its canonical downstream signaling, eliminating its hematopoietic effects and causing a fatal anemia. The purpose of this work was to analyze the EPO–EPOR complex computationally to provide a structural explanation for this signaling change.
Materials and methods: Computational structural biology analyses and molecular dynamics simulations were used to determine key interaction differences between the R150Q mutant and the wild-type form of EPO. Both were compared to another variant mutated at the same position, R150E, which also lacks hematopoietic activity.
Results: The ligand–receptor interactions of the R150Q and R150E mutants showed significant variations in how they interacted with EPOR at AS1 of the EPO–EPOR complex. Both lost specific reported salt bridges previously associated with full complex activation.
Conclusion: This work describes how the ligand–receptor interactions at AS1 of the EPO–EPOR complex respond to mutations at the 150th position. The interactions at AS1 were used to propose a potential mechanism by which the binding of EPO to the extracellular domain of EPOR influences its cytosolic domain and the resulting signaling cascade.
Keywords: molecular dynamics, signaling cascade, binding affinity, hematopoiesis
Plain language summary
The hormone erythropoietin acts as the body’s natural control mechanism for adjusting red blood cell count in response to stressors, which it accomplishes using several signaling cascades. However, some of these cascades have beneficial clinical effects that are independent of its hematopoietic activity. Although erythropoietin is widely used in the clinic as treatment for anemia, its hematological effects can preclude successful use for CNS applications. The recent discovery of a naturally occurring non-hematopoietic variant of the hormone, which can still activate at least part of the cascade, allows for the possible development of drugs that can activate parts of a receptor, rather than the binary system of “receptor on, receptor off”. The work we present here analyzes the interactions between this naturally occurring mutant and its receptor, and compares them to those of the naturally occurring hormone–receptor complex. By furthering our understanding of the mechanism behind this partial activation, it could enable the development of erythropoietin analogs designed to selectively activate particular signaling cascades via the same receptor, greatly increasing the scope of an already popular and approved clinical treatment.
Introduction
The circulating protein hormone erythropoietin (EPO) maintains a basal rate of hematopoiesis to replace aging red blood cells with newly differentiated reticulocytes by binding to its receptor (EPOR) on erythroid precursors in the bone marrow.1,2 Structurally, EPO is a 166-amino acid protein comprising four connected α-helices stabilized by disulfide bonds, while EPOR is a member of the type-1 cytokine receptor family, a transmembrane receptor that responds to cytokines that contain four α-helical chains.1–3 EPOR has been shown to exist as a homodimer on the cell surface and changes its conformation upon binding to EPO in order to trigger multiple signaling cascades, including the canonical Janus kinase (JAK)2 – signal transducer and activator of transcription (STAT) signaling cascade.3,4 The EPO–EPOR complex has two active sites: active site 1 (AS1), with a high receptor affinity (Kd=1 nm), and active site 2 (AS2), with a low affinity (Kd=1 µm).5
Recombinant EPO has, to date, been used to treat millions of individuals for different types of anemia since its approval by the Food and Drug Administration in 1989.2 More recently, EPO has been shown to have additional cardioprotective and neurotrophic effects in humans and animal models, potentially increasing its already impressive therapeutic scope.6 Current studies aim to take advantage of these trophic effects for future pharmaceutical applications, but for many of these the hematopoietic effect of EPO is detrimental.2,7
Recently, work by Kim et al characterized a previously unknown naturally occurring homogeneous mutation (R150→Q) in human EPO that not only eliminated its hematopoietic effects but also selectively attenuated its downstream JAK2 signaling, resulting in a fatal anemia.8 The mutation caused a 25%–35% decrease in the phosphorylation of STAT1 and STAT3, but had no effect on the maximal activation of STAT5.8 Kim et al believed this to be due to reduced activation of the JAK2 kinase, but no structural explanation for the signaling differences was provided.8 Since the mutation occurs at a reported AS1 residue (R150) of EPO, a combination of molecular dynamics simulations and protein modeling centered on this site was used to develop a more thorough understanding of how this mutation (R150→Q150) affected protein-receptor binding and activation from a structural perspective.
Materials and methods
Structure preparation
The protein data bank file 1EER (activated EPO–EPOR complex as determined by X-ray crystallography with a resolution of 1.9 Å) was used as the basis for all simulations.9 Asparagine residue substitutions in the EPO sequence at positions 24, 38, and 83 were carried out in PyMOL to create the wild-type (WT).9 The R150Q and R150E forms of EPO were made using substitution mutagenesis in PyMOL on the EPO–WT file.10
Molecular dynamics and calculations
All simulations (number of trajectories T=3 for each EPO variant) were carried out in Molecular Operating Environment (MOE) 2016 using the AMBER10 force field.11,12 Proteins and protein complexes were simulated for 2,200 ps (100 ps for equilibration, 2,100 ps of simulation runtime at a pH of 7.00 and 298K) in explicit H2O using the 3D-RISM model in a nonperiodic cell.13 Syed et al reported that all atoms more than 20 Å from the 10 AS1 residues of EPO were held fixed, and all water molecules greater than 4.5 Å from the EPO–EPOR complex were deleted before simulation to isolate the area of interest and decrease simulation runtime.9 Sampling time was set at 0.5 ps, with a time step of 0.002 ps. Explicit water was rigid (no H–O bond length changes), and the structure was refined to an RMS gradient of 0.1 kcal/mol/Å. Energy minimization via the “Quickprep” tool in MOE was used both pre-solvation and post-solvation to ensure that minimum energy conformations were obtained before beginning the simulations.
Estimation of the free energy of binding (ΔGBinding) for AS1 of the EPO–EPOR complex was performed in the MOE 2016 software using the molecular mechanics/generalized Born volume integration (GBVI) model.14 The free energy of binding was calculated via the MOE scoring function displayed in Equation 1.1 below.15
Equation 1.1:
|
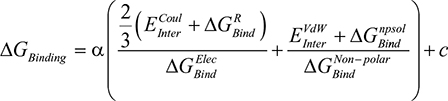
Both  (the columbic contribution to binding) and
  (the van der Waals contribution) were calculated using an 8–10 Å cutoff distance within the AMBER10 force field using an internal dielectric constant of 1 and an external dielectric constant of 80. Reaction field energies were calculated using GBVI, with the change in the reaction field upon binding used to calculate the contribution from electrostatic solvation (
 ). The change in non-polar solvation (
 ) is approximated as a function of weighted surface area (solvent accessible) scaled with a proportionality factor as outlined in Equation 1.2.
Equation 1.2: |

The average root-mean-square deviation (RMSD) data for each variant of EPO, along with the temperature and systemic potential energy fluctuation of the system, are visible in Figure 1A–C. As can be seen in Figure 1A, the protein reaches a stable equilibrium before the 350 ps mark, denoted in the figure by a black arrow. Similarly, in Figure 1B and C, the temperature and potential energy fluctuations reach a minimum before the 350 ps mark (also shown by black arrows), further supporting that the system has reached equilibrium. A snapshot of the simulations for each EPO–EPOR variant at their lowest systemic potential energy (after the simulations reached equilibrium) was used for the calculation, with EPO designated the “ligand” and the monomer of EPOR containing AS1 designated the “receptor”. A full tabulation of the temperature, potential energy, and RMSD data can be found in the Table S1.
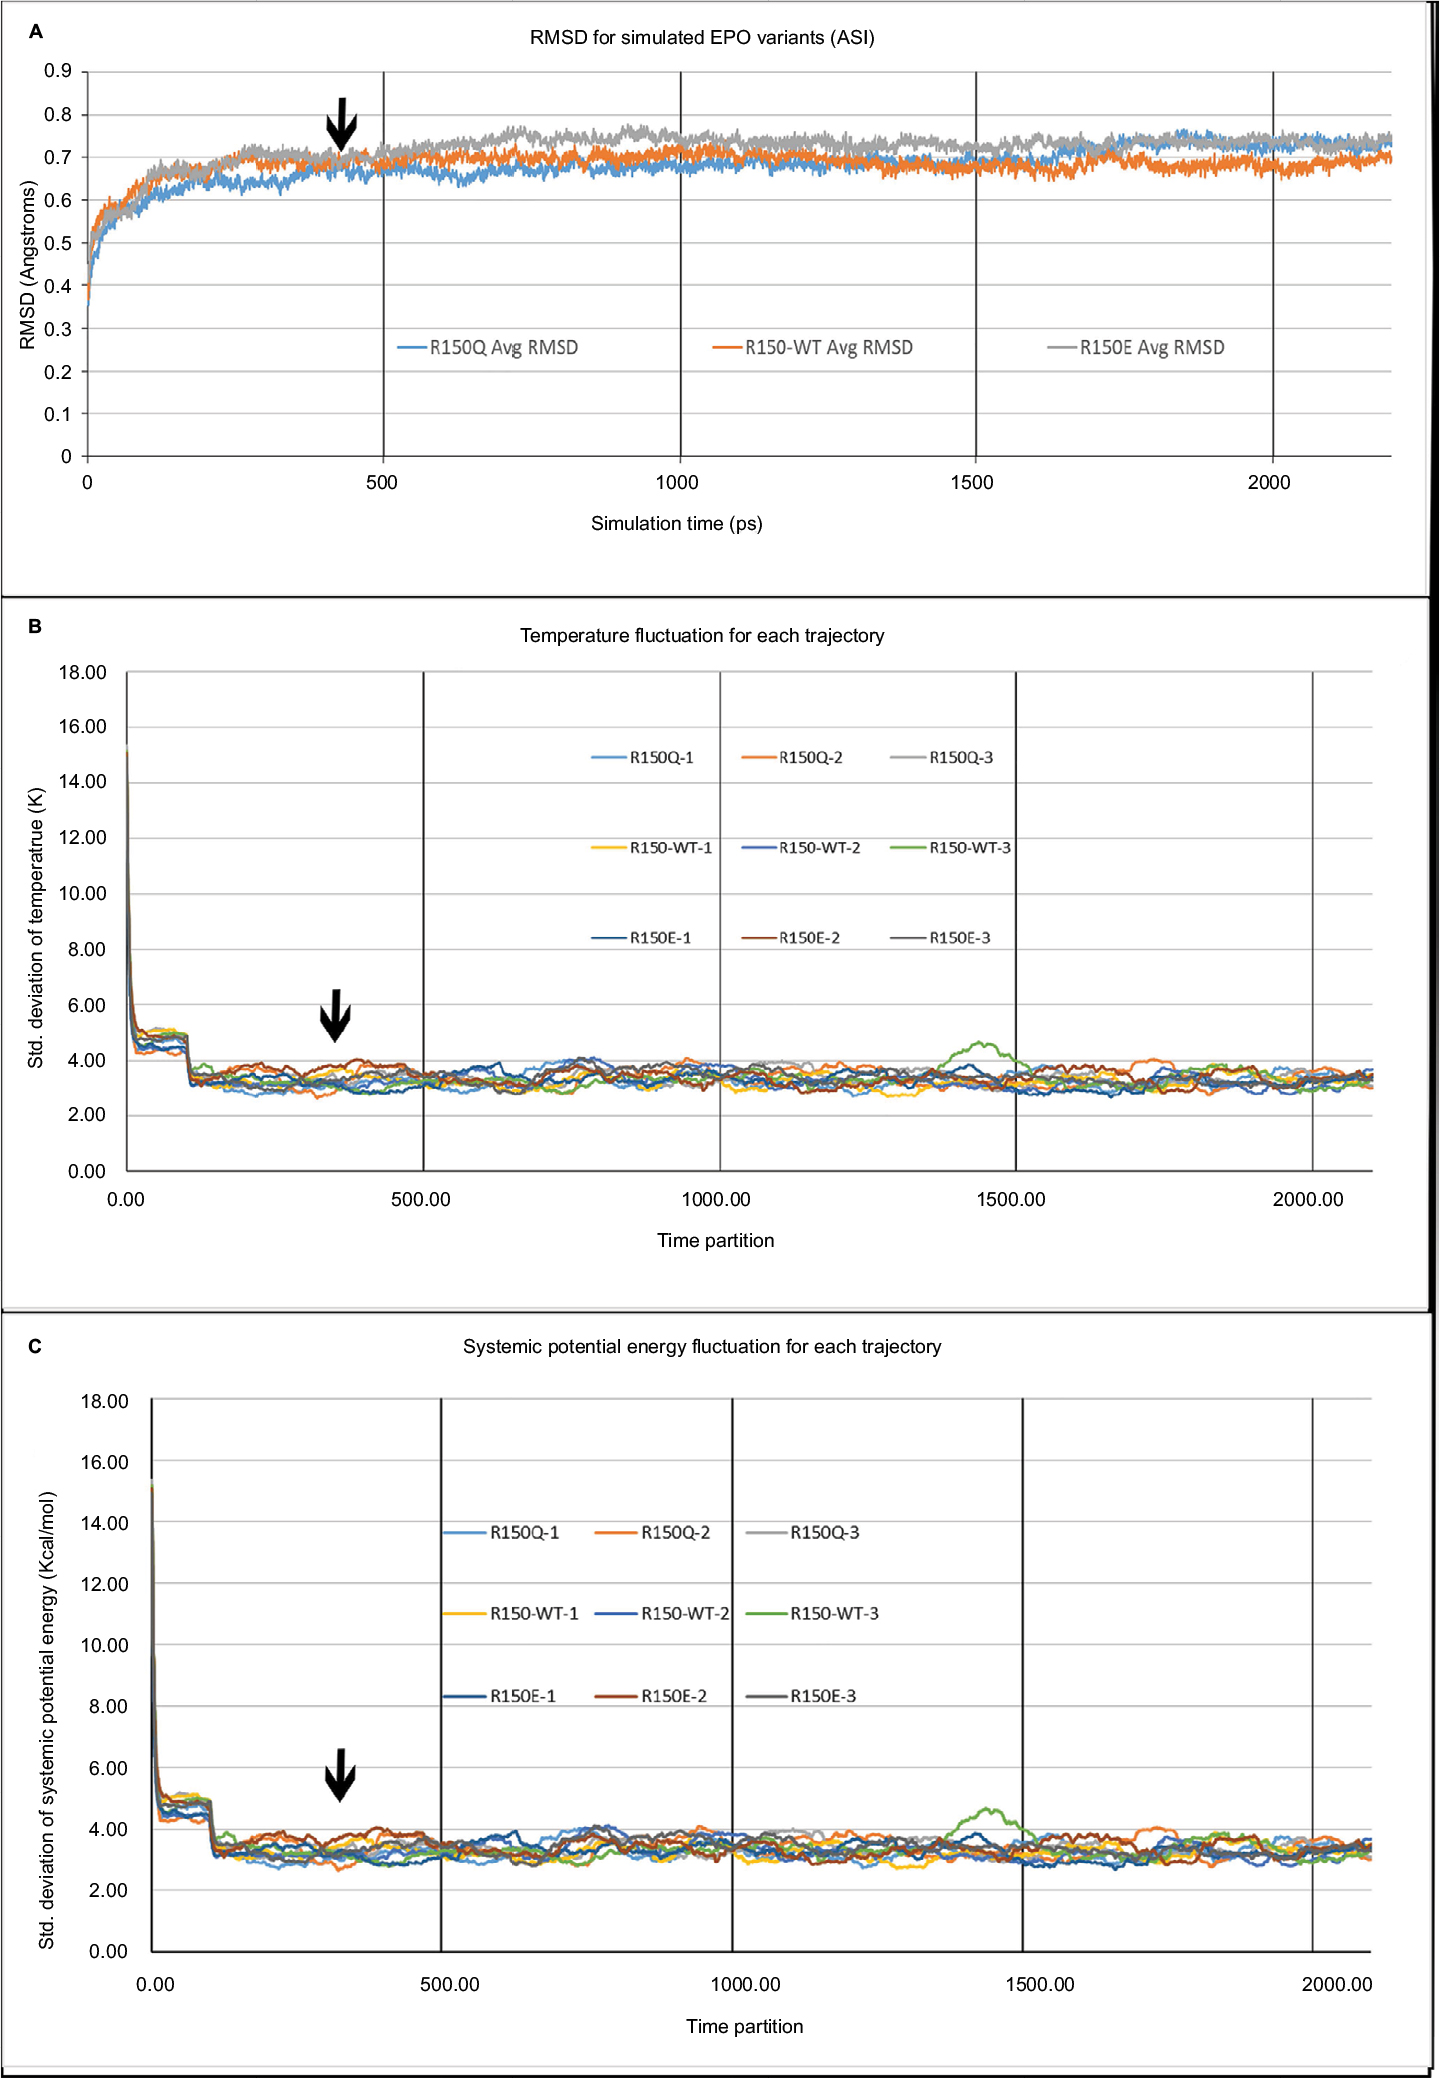 | Figure 1 Simulation temperature, potential energy, and RMSD. Notes: Figure 1A displays the average RMSD values (Å) for each of the EPO variants over simulation time (ps). A black arrow points to time t=350 ps, the point at which the proteins reached a state of equilibrium. Figure 1B displays the SD of the temperature for every 100 ps of simulation (such that at time partition=1, the SD of the temperature from time 1−101 ps is plotted). A black arrow denotes the 350−450 ps time partition. Figure 1C shows the SD of the systemic potential energy using the same specifications as Figure 1B. Abbreviations: RMSD, root-mean-square deviation; EPO, erythropoietin. |
Statistical analysis
All reported atomic distances are displayed as mean ± SEM. Differences between the three simulation groups (EPO–WT, R150Q, R150E) were evaluated for statistical significance using one-way ANOVA, followed by the Tukey’s test where appropriate. A P-value <0.05 was considered significant.
Results
To prevent confusion, the full structure and nomenclature of the EPO–EPOR complex domain is shown in Figure 2.
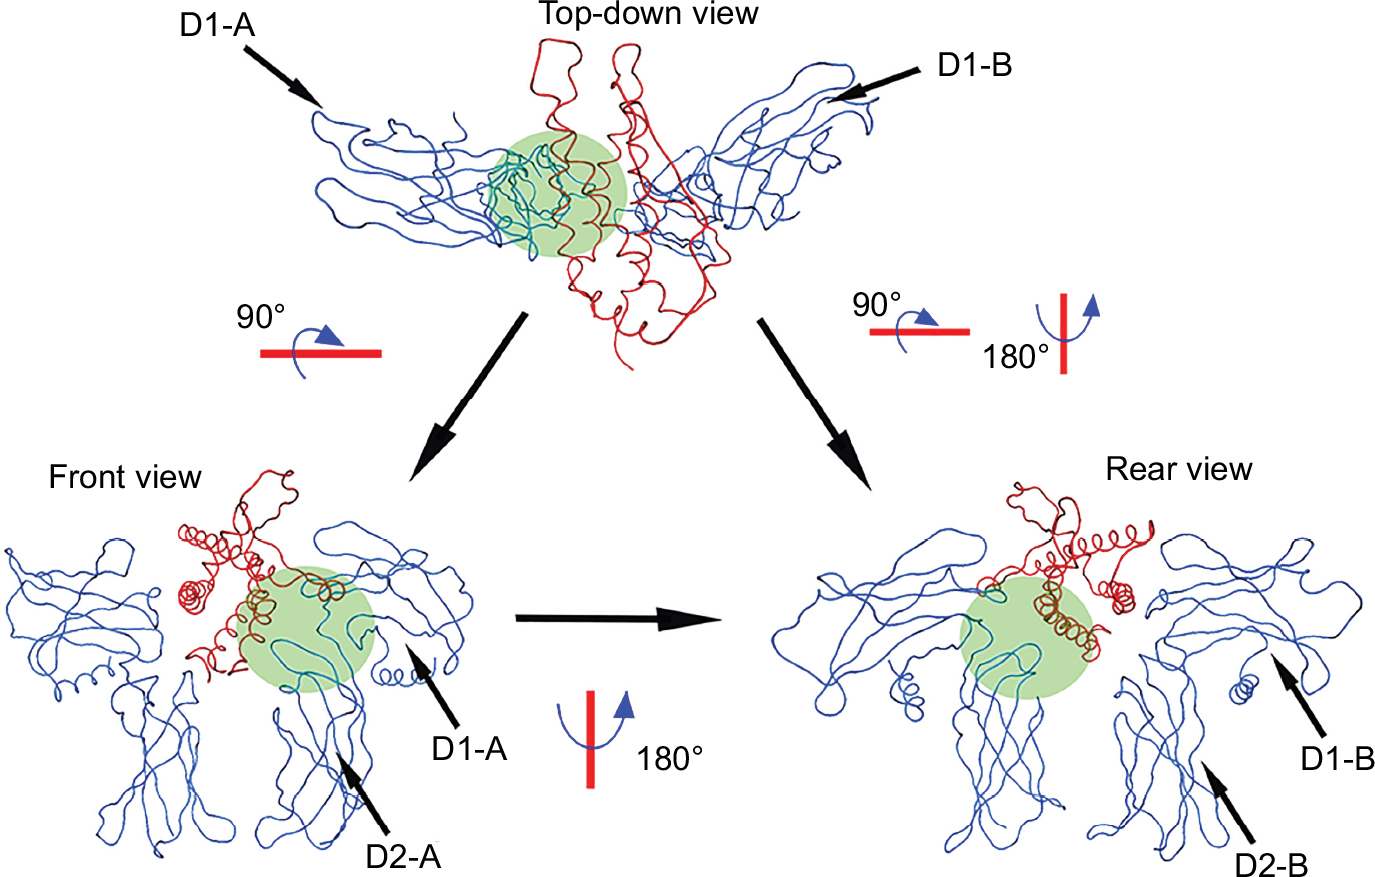 | Figure 2 EPO–EPOR complex orientation and domain nomenclature. Notes: EPO–EPOR complex shown in three different orientations with accompanying rotational references. The pocket of AS1 is shaded in green. The side containing the carboxyl and amino termini of EPO is considered the “Front” side of the complex. D1 refers to the extracellular domain parallel to the cell membrane, while D2 refers to the perpendicular domain. The designations of “A” and “B” for the domains are to differentiate whether the receptor is interacting with EPO at AS1 or AS2, with “A” referring to the domains of the receptor interacting at AS1. Abbreviations: EPO, erythropoietin; EPOR, erythropoietin receptor; AS1, active site 1. |
According to Syed et al, the hematopoietic activity of the R150Q mutant was a fivefold decrease from EPO–WT, while the R150E mutant showed a 50-fold decrease.9 While it would normally be possible that the R150E/R150Q mutants may not bind to the receptor as strongly as the WT, it was shown by Kim et al that the binding kinetics of the R150Q variant of EPO is similar to that of the WT form.8 This was confirmed in our computational studies; the calculated free energy of binding ΔGB and dissociation constant Kd for each variant of EPO at AS1, as seen in Table 1, were shown to be statistically equal by one-way ANOVA. Therefore, the lack of hematopoiesis seen in the R150Q mutation likely stems from a change in the receptor cytosolic domain (CSD) conformation. Although direct CSD examination is not possible, its movement is closely coupled to that of the extracellular domain (ECD), implying that an analysis of ECD interactions can provide clues about the CSD conformation.
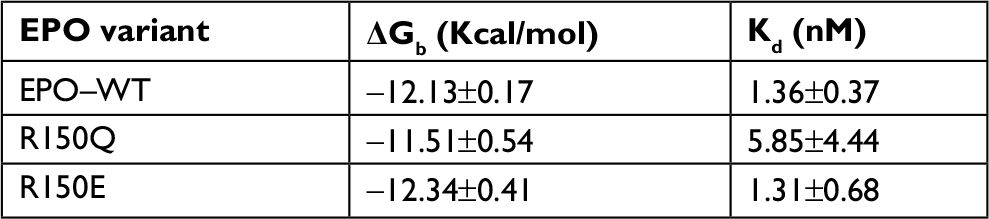 | Table 1 ΔGb and Kd of AS1 for simulated EPO variants Abbreviations: AS1, active site 1; EPO, erythropoietin; EPO–WT, erythropoietin wild-type; R150Q, mutant erythropoietin with the arginine at position 150 mutated to glutamine; R150E, mutant erythropoietin with the arginine at position 150 mutated to glutamic acid. |
To determine which AS1 residues were potentially responsible for the change in bioactivity (ie, critical residues), each one was analyzed with respect to two criteria. First, a critical residue must experience a conformational shift after mutation of EPO–WT at the 150th position, and the interaction types (ie, which receptor residue/atom the critical residue interacts with) or distances must be significantly different between the variants (ie, EPO–WT ≠ R150Q ≠ R150E). In Figure 3, the atomic distance measurements for the K20 and R/Q/E150 residues are displayed, compared to their literature values. The other residues of AS1 failed to meet either of the conditions, and the full accounting of their atomic distances can be found in an additional file (Table S2).9
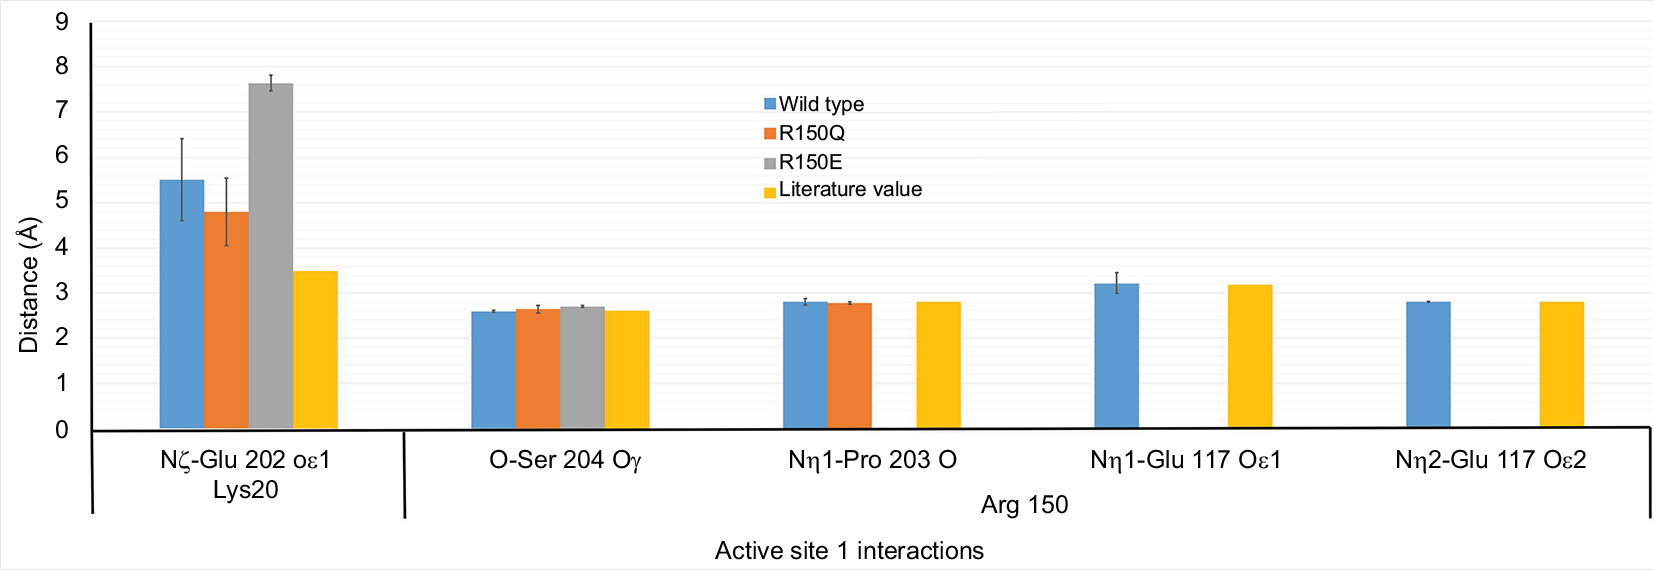 | Figure 3 K20 and R/Q/E150 residue active site 1 interactions. This graph displays the distances between the atoms of the active site 1 residues K20 and R/Q/E150 and the receptor atoms with which they have previously reported interactions. The blue bar displays distances for the EPO–WT simulations, the orange bar shows distances for the R150Q variant, and the yellow bar shows distances for the R150E variant. The gray bar shows the literature values for these atomic distances as previously reported by Syed et al.9 Abbreviations: EPO–WT, erythropoietin wild-type; R150Q, mutant erythropoietin with the arginine at position 150 mutated to glutamine; R150E, mutant erythropoietin with the arginine at position 150 mutated to glutamic acid. |
Although the K20 position showed some variation in distance for its reported receptor interaction, the lack of a significant difference between the EPO–WT and R150Q forms excluded it from further analysis. This is further shown in the root mean square fluctuation (RMSF) data for these residues (Figure 4), in which, though the K20 position shows greater fluctuation, it is not significantly different between the mutant variants of EPO. In comparison, the 150th position shows a significant increase in fluctuation from EPO–WT→R150Q→R150E. A complete table of the average RMSF data for each of the 10 AS1 residues can be found in Table S3.
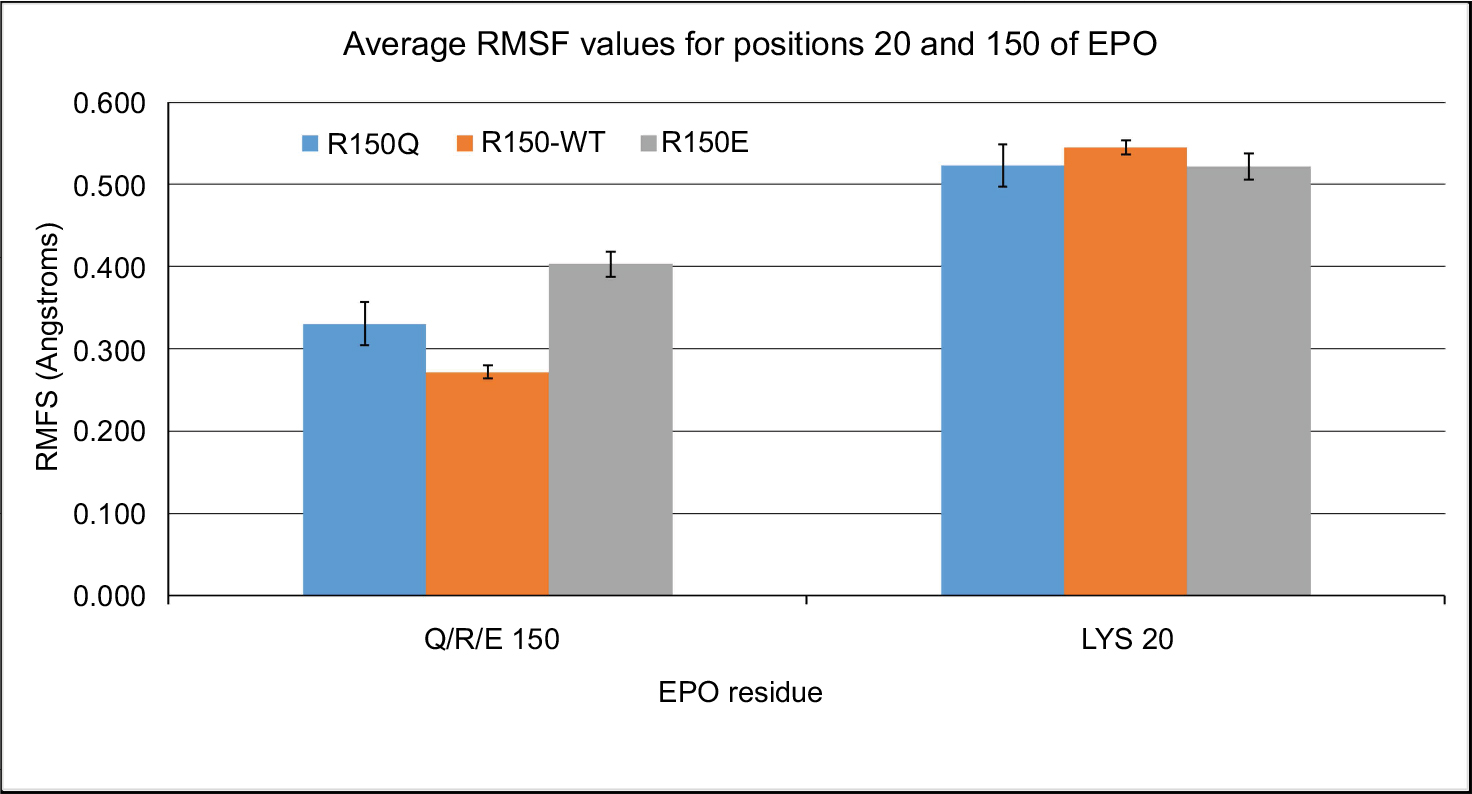 | Figure 4 Average RMSF values for positions 20 and 150 of EPO variants. Notes: The average RMSF values for R150Q, EPO–WT, and R150E are shown for the two residues Lys 20 and Gln/Arg/Glu 150. Though Lys 20 shows a higher fluctuation, the difference in fluctuation between the three variants of EPO is non-significant. The 150th position, however, shows a significant increase in RMSF as one moves from EPO–WT→R150Q→R150E. Abbreviations: RMSF, root mean square fluctuation; R150Q, mutant erythropoietin with the arginine at position 150 mutated to glutamine; EPO–WT, erythropoietin wild-type; R150E, mutant erythropoietin with the arginine at position 150 mutated to glutamic acid. |
As position 150 had the most significant changes in ligand–receptor interaction (in terms of the number of salt bridges differing from literature values of EPO–WT) for R150Q and R150E, it can be inferred that those differences are the most likely cause of the bioactivity changes. For the 150th position, all three variants of EPO showed unchanged interactions between the side chain alpha oxygen and S204 Oγ of the receptor; however, the R150Q form loses one interaction with EPOR residue E117, and R150E loses the interactions with EPOR residues P203 and E117. These results are summarized in Figure 5. With the exception of the interaction with EPOR residue S204, EPO–WT at position 150 forms all salt bridges previously reported in the literature (resulting in full activation of the receptor), R150Q forms all but one (resulting in the five-fold decrease), and R150E forms none (resulting in the 50-fold decrease).
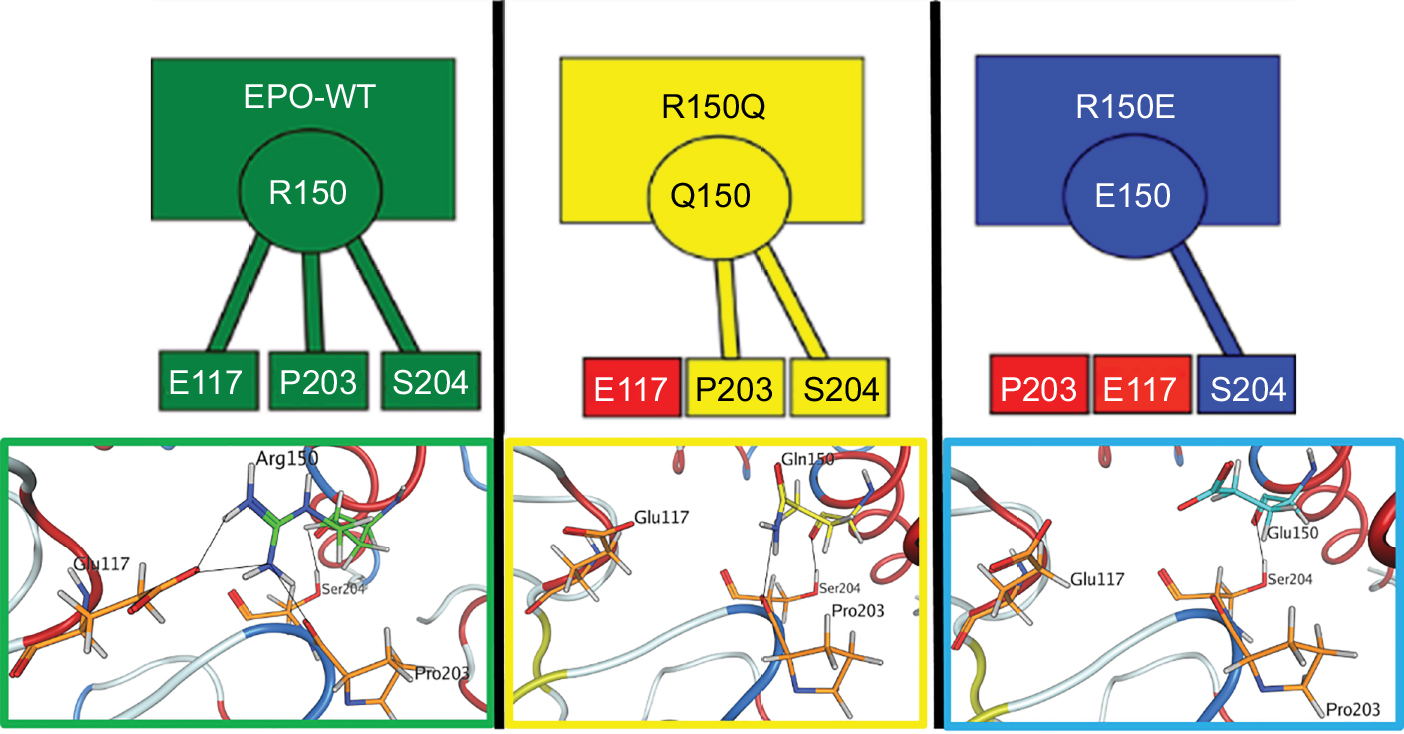 | Figure 5 Illustration of intermolecular salt bridges formed by the R/Q/E150 residue. Notes: Green is EPO–WT, yellow is R150Q, and blue is R150E. If a box containing a receptor residue (E117, P203, or S204) is colored in red, it implies no salt-bridge formation (ie, atomic distance >4.0 Å) between that residue and position 150 of that EPO variant. EPO–WT shows salt bridge formation with all reported receptor residues: E117, P203, and S204. The R150Q variant shows interaction with P203 and S204, but no interaction with E117. R150E has an interaction with only S204 on the receptor. Abbreviations: EPO–WT, erythropoietin wild-type; R150Q, mutant erythropoietin with the arginine at position 150 mutated to glutamine; R150E, mutant erythropoietin with the arginine at position 150 mutated to glutamic acid. |
Discussion
As was previously reported, the unbound form of EPOR exists as a dimer without the ability to facilitate activation of the JAK2 pathway.4,16,17 A crystallographic study has shown that the orientation of the unbound ECDs do not permit close association of the CSDs, which is necessary for JAK2 transphosphorylation.17 Livnah et al proposed a “scissor like” mechanism for the EPO-EPOR complex in which the binding of EPO to the receptor causes the ECDs to separate in order to bring the CSDs into proximity for transphosphorylation.17 Further studies refined this idea, describing how a 120° angle between the two ECDs parallel to the cell membrane was associated with full receptor activation, while a 15° change in either direction from that angle was enough to render JAK2 activation ineffective.5,9 It has been further shown by Livnah et al, via the analysis of EPO mimetic peptides EMP1 and EMP33 on EPOR, that ECD orientation has a direct effect on cytoplasmic signaling.18 This close association between ECD and CSD conformation can be attributed to the highly rigid α-helical structure of the transmembrane domain of EPOR, which translates conformational changes between the ECDs and the CSDs.19,20
The observed receptor interaction changes for R150Q and R150E, when coupled with current knowledge of the activated signaling cascades, can be extrapolated into a potential structural model of receptor activation. In the case of EPO–WT, AS1 residues can be considered to produce two key forces on the receptor: one which brings the CSDs of EPOR into close contact for JAK2 phosphorylation and one which rotates the ECDs such that they attain the maximally active 120° angle with respect to each other. As such, the stepwise loss of interaction with the receptor as one moves from EPO–WT→R150Q→R150E would necessitate a similar loss in applied force on the receptor. These results along with the previously reported downstream STAT 1a, 3, and 5 concentrations associated with the R150Q mutant provide further insight as to the intracellular activation of the EPO–EPOR signaling cascade.8 STAT1a and STAT3 are both maximally activated by the same phosphorylated tyrosine residue, Y432, while STAT5 can be maximally activated by binding to either Y401 or Y343.21,22 It was reported that the R150Q mutant showed no change in the maximal concentrations of phosphorylated STAT5 (p5), but showed decreased concentrations of phosphorylated STAT1 (p1) and STAT3 (p3) compared to EPO–WT.8
Since it is known that the CSDs of the EPOR homodimer must be brought together in order to facilitate JAK2 binding and phosphorylation, there exists two “faces” of the CSD that would be in near contact with each other. If there are critical tyrosine residues necessary for the activation of one or more STAT proteins on those faces, then, stearic hindrance would prevent binding to those tyrosines even if they were previously phosphorylated by JAK2. Therefore, when bound with EPO–WT, it must first bring the two CSD’s into close contact and then provide the required rotational motion on the receptor needed to maintain the exposure of critical tyrosine residues to the cytosol. This becomes important, because the partial loss of ligand–receptor interaction at the 150th position of the R150Q mutant showed a decrease in p1 and p3 concentrations, but not p5. This would imply that R150Q still successfully brings the CSDs into close contact, but does not rotate to the appropriate angle, causing Y432 to be partially hidden from the cytosol. The unchanged concentration of p5 in this instance would indicate that either Y401 or Y343 existed on a face that is exposed to the cytosol regardless of rotational state. This simultaneous rotational and translational motion model has similarity to the one that Pang and Zhou proposed as a general purpose model for type 1 cytokine receptors.23 In the case of the R150E mutant, there are two possible explanations for the 50-fold decrease in bioactivity. There is likely either a decrease in receptor affinity (though computational results showed a ΔGB of AS1 similar to EPO–WT) or the more severe lack of ligand–receptor interaction at position 150 compared to EPO–WT causes the complete sequestering of Y432 (preventing activation of STAT1 and STAT3). The potential mechanisms for all three EPO variants are illustrated in Figure 6.
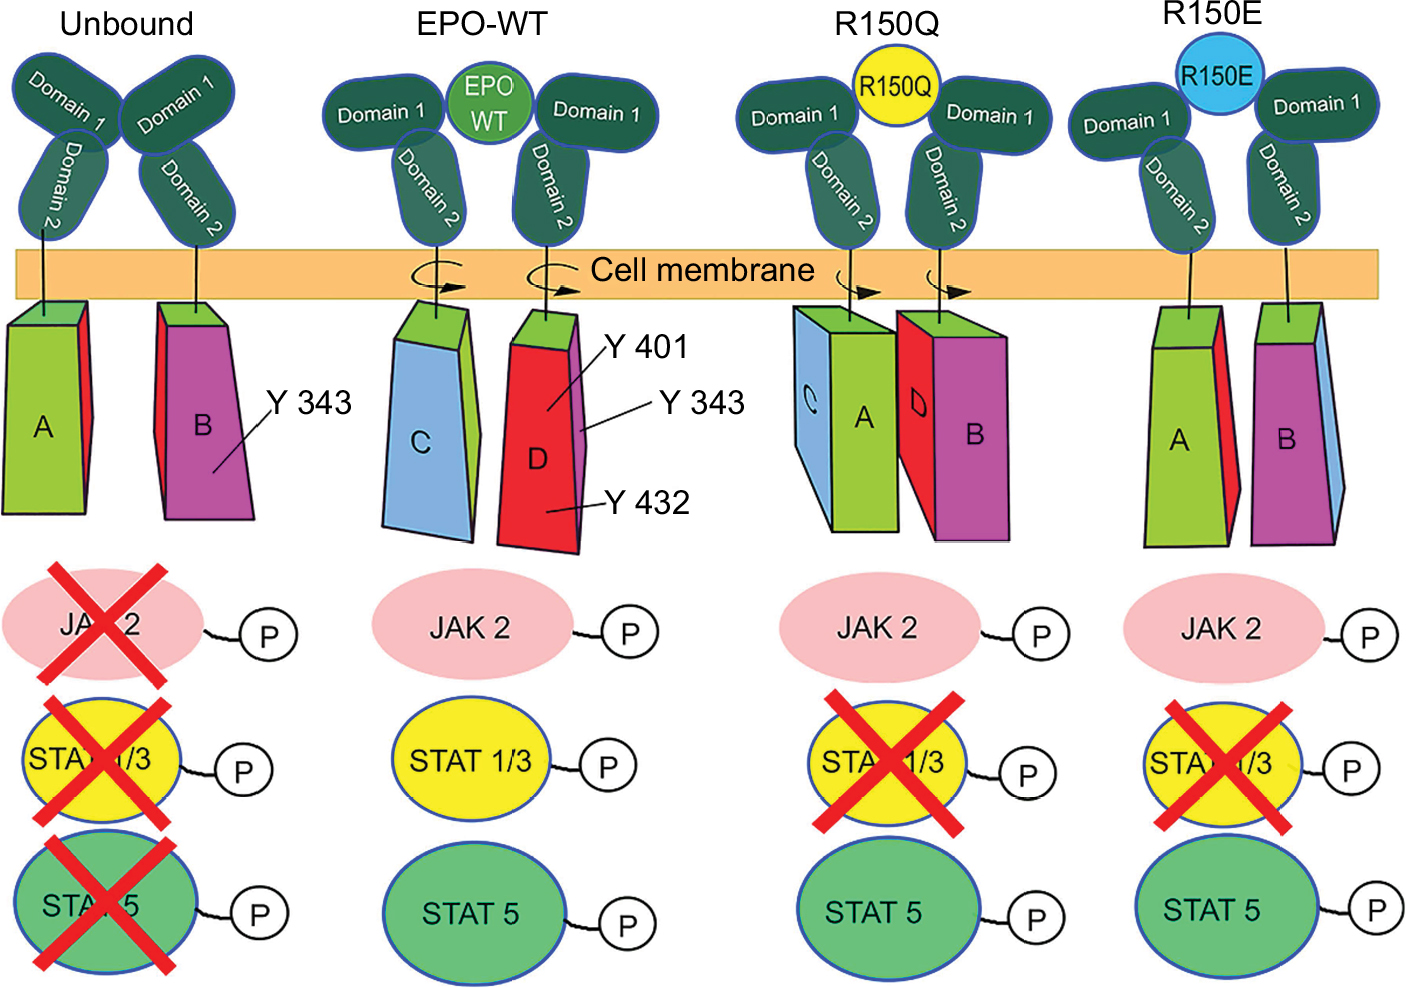 | Figure 6 Proposed model of EPO–EPOR cytosolic signaling cascade activation. Notes: Suggested mechanism of action for all three EPO variants. The cytosolic domain is shown with four “faces”, A, B, C, and D. In this model, the tyrosine residues that individually can cause complete activation of STAT5, Y343 and Y401 are on faces B and D, respectively. Y432 on face D is the residue that binds to STAT1 and STAT3 after phosphorylation by JAK2. In the unbound form, the lack of “scissor-like” motion prevents the cytosolic domains from approaching each other to facilitate JAK2 binding and therefore does not begin the downstream signaling cascade. In the EPO–WT complex, the cytosolic domains are both brought together and rotated such that face D of both domains are exposed to JAK2 phosphorylation, causing complete activation of the signaling cascade. In the R150Q complex, the cytosolic domains are brought together for JAK2 to bind, but a lack of rotational motion caused by loss of the Q150–E117 interaction prevents the full exposure of Y432 to the cytosol, causing a decrease in STAT1/STAT3 activation. Due to the STAT protein’s large size (which is roughly the size of the cytosolic domain of the receptor), even if JAK2 could phosphorylate Y432, there would be too much stearic hindrance to allow proper STAT1/3 binding to face D. However, Y343 remains exposed, allowing for maximal STAT5 activation. The R150E form has two potential mechanisms, with only one shown in the figure. The first possibility could be a change in binding kinetics preventing proper formation of the EPO–EPOR complex, which in turn would prevent JAK2 binding. Alternatively, even further lack of ligand–receptor interaction at the 150th position compared to EPO–WT could completely sequester the Y432 residue required for STAT activation. Abbreviations: EPO, erythropoietin; EPOR, erythropoietin receptor; STAT, signal transducer and activator of transcription; JAK2, Janus kinase 2. |
Conclusion
After full analysis of the molecular dynamics simulations of WT EPO, the R150Q naturally occurring mutant and the R150E variant, R/Q/E150 residues, were determined to be potentially important to the full activation of the hematopoietic activity of the complex. The residue at position 150 of the WT form had interactions with the receptor that were previously reported in the literature, while the R150Q and R150E variants lost some or all of those interactions (excepting the interaction with S204). These differences were considered to be the root cause of the different bioactivities of these variants (fully active for the EPO–WT, five-fold reduction for the R150Q, and 50-fold reduction for the R150E). By comparing these results to the known requirements for receptor activation, as well as to the reported concentrations of STAT proteins for EPO–WT and R150Q, it was possible to propose a possible mechanism for the activation of specific downstream signaling cascades.
A potential future direction for this work would be to examine these variant EPO forms’ effects on the other common signaling cascades activated by the EPO–EPOR complex.
Acknowledgments
We would like to acknowledge the South Dakota Board of Regents and the University Of South Dakota Sanford School Of Medicine. This work was supported by NIMH RO1 106,640. The funding body took no part in the design of the study, data collection, or analysis.
Disclosure
The authors report no conflicts of interest in this work.
References
Bunn HF. Erythropoietin. Cold Spring Harb Perspect Med. 2013;3(3): a011619. | ||
Hamed S, Bennett CL, Demiot C, Ullmann Y, Teot L, Desmoulière A. Erythropoietin, a novel repurposed drug: an innovative treatment for wound healing in patients with diabetes mellitus. Wound Repair Regen. 2014;22(1):23–33. | ||
Zhang YL, Radhakrishnan ML, Lu X, Gross AW, Tidor B, Lodish HF. Symmetric signaling by an asymmetric 1 erythropoietin: 2 erythropoietin receptor complex. Mol Cell. 2009;33(2):266–274. | ||
Richmond TD, Chohan M, Barber DL. Turning cells red: signal transduction mediated by erythropoietin. Trends Cell Biol. 2005;15(3):146–155. | ||
Wilson IA, Jolliffe LK. The structure, organization, activation and plasticity of the erythropoietin receptor. Curr Opin Struct Biol. 1999;9(6):696–704. | ||
Maiese K, Li F, Chong ZZ. New avenues of exploration for erythropoietin. JAMA. 2005;293(1):90–95. | ||
Sirén AL, Fasshauer T, Bartels C, Ehrenreich H. Therapeutic potential of erythropoietin and its structural or functional variants in the nervous system. Neurotherapeutics. 2009;6(1):108–127. | ||
Kim AR, Ulirsch JC, Wilmes S, et al. Functional Selectivity in Cytokine Signaling Revealed Through a Pathogenic EPO Mutation. Cell. 2017;168(6):1053–1064.e15. | ||
Syed RS, Reid SW, Li C, et al. Efficiency of signalling through cytokine receptors depends critically on receptor orientation. Nature. 1998;395(6701):511–516. | ||
Schrodinger, LLC. The PyMOL Molecular Graphics System, Version 1.8. In:2015. | ||
Case DA, Darden TA, Cheatham TE, et al. AMBER 10. San Francisco: University of California; 2008. | ||
Molecular Operating Environment (MOE), 2013.08; Chemical Computing Group ULC, 1010 Sherbrooke St. West, Suite #910, Montreal, QC, Canada, H3A 2R7, 2018. | ||
Beglov D, Roux B. An Integral Equation To Describe the Solvation of Polar Molecules in Liquid Water. J Phys Chem B. 1997;101(39):7821–7826. | ||
Labute P. The Generalized Born/Volume Integral (GB/VI) Implicit Solvent Model: Estimation of the Free Energy of Hydration Using London Dispersion Instead of Atomic Surface Area. J Comput Chem. 2008; 29:1693–1698. | ||
Corbeil CR, Williams CI, Labute P. Variability in docking success rates due to dataset preparation. J Comput Aided Mol Des. 2012;26(6):775–786. | ||
Remy I, Wilson IA, Michnick SW. Erythropoietin receptor activation by a ligand-induced conformation change. Science. 1999;283(5404):990–993. | ||
Livnah O, Stura EA, Middleton SA, Johnson DL, Jolliffe LK, Wilson IA. Crystallographic evidence for preformed dimers of erythropoietin receptor before ligand activation. Science. 1999;283(5404):987–990. | ||
Livnah O, Johnson DL, Stura EA, et al. An antagonist peptide-EPO receptor complex suggests that receptor dimerization is not sufficient for activation. Nat Struct Biol. 1998;5(11):993–1004. | ||
Constantinescu SN, Huang LJ, Nam H, Lodish HF. The erythropoietin receptor cytosolic juxtamembrane domain contains an essential, precisely oriented, hydrophobic motif. Mol Cell. 2001;7(2):377–385. | ||
Li Q, Wong YL, Yueqi Lee M, Li Y, Kang C. Solution structure of the transmembrane domain of the mouse erythropoietin receptor in detergent micelles. Sci Rep. 2015;5(1):13586. | ||
Klingmüller U, Bergelson S, Hsiao JG, Lodish HF. Multiple tyrosine residues in the cytosolic domain of the erythropoietin receptor promote activation of STAT5. Proc Natl Acad Sci U S A. 1996;93(16):8324–8328. | ||
Kirito K, Nakajima K, Watanabe T, et al. Identification of the human erythropoietin receptor region required for Stat1 and Stat3 activation. Blood. 2002;99(1):102–110. | ||
Pang X, Zhou HX. A common model for cytokine receptor activation: combined scissor-like rotation and self-rotation of receptor dimer induced by class I cytokine. PLoS Comput Biol. 2012;8(3):e1002427. |
 © 2018 The Author(s). This work is published and licensed by Dove Medical Press Limited. The
full terms of this license are available at https://www.dovepress.com/terms
and incorporate the Creative Commons Attribution
- Non Commercial (unported, 3.0) License.
By accessing the work you hereby accept the Terms. Non-commercial uses of the work are permitted
without any further permission from Dove Medical Press Limited, provided the work is properly
attributed. For permission for commercial use of this work, please see paragraphs 4.2 and 5 of our Terms.
© 2018 The Author(s). This work is published and licensed by Dove Medical Press Limited. The
full terms of this license are available at https://www.dovepress.com/terms
and incorporate the Creative Commons Attribution
- Non Commercial (unported, 3.0) License.
By accessing the work you hereby accept the Terms. Non-commercial uses of the work are permitted
without any further permission from Dove Medical Press Limited, provided the work is properly
attributed. For permission for commercial use of this work, please see paragraphs 4.2 and 5 of our Terms.