Back to Journals » Diabetes, Metabolic Syndrome and Obesity » Volume 16
Comprehensive Study of Untargeted Metabolomics and 16S rRNA Reveals the Mechanism of Fecal Microbiota Transplantation in Improving a Mouse Model of T2D
Authors Yang W, Xia Z, Zhu Y ![]() , Tang H, Xu H, Hu X, Lin C, Jiang T, He P
, Tang H, Xu H, Hu X, Lin C, Jiang T, He P ![]() , Shen J
, Shen J ![]()
Received 26 January 2023
Accepted for publication 2 May 2023
Published 11 May 2023 Volume 2023:16 Pages 1367—1381
DOI https://doi.org/10.2147/DMSO.S404352
Checked for plagiarism Yes
Review by Single anonymous peer review
Peer reviewer comments 3
Editor who approved publication: Professor Gian Paolo Fadini
Wensu Yang,1,2 Zhaoxin Xia,1,2 Yi Zhu,1,2 Hao Tang,1,2 Huaming Xu,1,2 Xinyi Hu,1,2 Chunhui Lin,1,2 Tong Jiang,1,2 Pei He,1,2 Jilu Shen1,2
1The First Affiliated Hospital of Anhui Medical University, Hefei, Anhui, 23001, People’s Republic of China; 2Anhui Public Health Clinical Center Hefei, Anhui, 230012, People’s Republic of China
Correspondence: Jilu Shen, Tel +86-15155152963, Email [email protected]
Background: Fecal microbiota transplantation (FMT) has emerged as a new therapy targeting gastrointestinal microbiota for the treatment of a growing number of diseases in recent years. Previous studies have suggested that FMT may be a potential therapy for type 2 diabetes (T2D), but the underlying mechanism remains unclear. Therefore, in the present study, we aimed to investigate the role of FMT in T2D and its underlying mechanisms.
Methods: To induce T2D, mice were fed a high-fat diet and injected with low-dose streptozotocin (STZ) for four weeks. The mice were then randomly divided into four groups: control group (n = 7), T2D group (n = 7), metformin (MET)-treated group (n = 7), and FMT group (n = 7). The MET group was orally administered 0.2 g/kg MET, the FMT group was orally administered 0.3 mL of bacterial solution, and the other two groups were orally administered the same volume of saline for four weeks. Serum and fecal samples were collected for non-targeted metabolomics, biochemical indicators, and 16S rRNA sequencing, respectively.
Results: Our results demonstrated that FMT had a curative effect on T2D by ameliorating hyperlipidemia and hyperglycemia. Using 16S rRNA sequencing and serum untargeted metabolomic analysis, we found that FMT could restore the disorders of gastrointestinal microbiota in T2D mice. Moreover, corticosterone, progesterone, L-urobilin, and other molecules were identified as biomarkers after FMT treatment. Our bioinformatics analysis suggested that steroid hormone biosynthesis, arginine, proline metabolism, and unsaturated fatty acid biosynthesis could be potential regulatory mechanisms of FMT.
Conclusion: In summary, our study provides comprehensive evidence for the role of FMT in the treatment of T2D. FMT has the potential to become a promising strategy for the treatment of metabolic disorders, T2D, and diabetes-related complications.
Keywords: type 2 diabetes, fecal microbiota transplantation, gastrointestinal microbiota, untargeted metabolomics, 16S rRNA, corticosterone
Background
The prevalence of type 2 diabetes (T2D) is rapidly increasing worldwide, with an estimated global prevalence of approximately 552 million by 2030.1 Long-term hyperglycemia in T2D patients can lead to vascular endothelial damage, which includes microvascular disease such as diabetic retinopathy and nephropathy, neuropathy, and macrovascular disease including peripheral vascular disease and cardiovascular and cerebrovascular disease).2 The incidence of chronic complications of T2D is on the rise, and it is characterized by insidious onset, high incidence, low patient awareness, low diagnosis, and treatment rates, and significant harm.3 Genetic factors, hyperlipidemia, high-energy diets, and a sedentary lifestyle are the primary causes of T2D.4,5 Of these, diet is one of the important factors affecting gastrointestinal microbiota. A previous study found that diet accounts for 57% of the mutations of the gastrointestinal microbiota, while gene mutation accounts for only 12%.6 Gastrointestinal dysbiosis is one of the factors causing the rapid progression of insulin resistance in T2D7 by changing the host gut barrier function and metabolic signaling pathways.4
The gastrointestinal tract is not only responsible for digestion and absorption but also serves as the largest immunologic organ, which plays a vital role in maintaining normal immune defense. It is populated by approximately 1×10¹⁴ microorganisms,1,8 including bacteria, fungi, viruses, etc., collectively referred to as the gastrointestinal microbiota. The gastrointestinal microbiota contains 105 dominant species,9 primarily belonging to five phyla: Firmicutes, Bacteroidetes, Actinomyces, Proteobacteria, and Verrucomicrobia.10 The gastrointestinal microbiota provides diverse metabolic energy and plays a crucial role in regulating host health, particularly in energy metabolism, immune homeostasis, and xenobiotic metabolism.11 Both animal and human studies have revealed that there are differences in the gastrointestinal microbial composition between healthy individuals and T2D patients.4,5 T2D patients have a higher Firmicutes/Bacteroides ratio compared to healthy individuals.6 Gastrointestinal microbes from healthy populations could improve insulin sensitivity and reduce fasting blood glucose (FBG) levels in T2D patients. The enrichment of Bifidobacterium, Lactobacillus, and Actinobacteria in the gastrointestinal tract of healthy individuals is beneficial for improving metabolic disorders. Gastrointestinal microbial dysbiosis is closely related to the occurrence and development of various diseases. Specifically, in T2D patients, abnormal composition and function of the gastrointestinal microbial can result in metabolic disorders, including the desensitizing effects of insulin on adipose tissue, skeletal muscle, and liver metabolism.12
At present, although there are numerous treatments available for T2D, there are still plagued by problems such as insufficient efficacy and adverse reactions. For example, the application of sulfonylureas or insulin is highly associated with an increased risk of cardiovascular disease, hypoglycemia, and diabetic ketoacidosis.13 As a new therapeutic approach, fecal microbiota transplantation (FMT) has been used in recent years to target various diseases. FMT can improve disease conditions by altering the gastrointestinal microbial diversity and community structure to alter metabolites.
In this study, we aimed to analyze the effects of FMT on metabolic regulation and gastrointestinal microbiota changes in T2D mice. Using 16S rRNA sequencing and untargeted metabolomics analysis, we developed a classification model that can facilitate the diagnosis of T2D and the discovery of T2D-related biomarkers.
Materials and Methods
Animal Model and Ethical Approval
Forty male-specific pathogen-free (SPF) grade C57BL/6J mice were purchased from Changzhou Cavens Laboratory Animal Co., Ltd. and acclimatized for one week. The mice were kept in a controlled environment with a temperature of 21 °C, humidity of 60%, and a 12 h light/dark cycle.
The mice were randomly divided into two groups: the normal control (NC) group, consisting of 10 mice fed with regular food, and the T2D model group, consisting of 30 mice. For the T2D model group, the mice were fed a high-fat diet for six weeks, fasted for 12 hours (with free access to water), and then injected intraperitoneally with 100 mg/kg Streptozotocin (STZ) (pH=4.3). After the injection, the mice were fed a high-fat diet for another two weeks. Fasting blood was collected by tail cutting. A successful T2D model was validated by FBG > 11.1 mmol/L and accompanied by increased food and water intake, frequent urination, and weight loss.
Preparation of Bacterial Liquid
Non-obese mice with blood glucose levels below 7.1 mmol/l, good mental state, glossy hair, and soft stool were selected as donors and NC group. To collect feces, the anus of the mice was stimulated using cotton swabs. The collected stool was placed in 1.5mL EP tubes. 400mg of feces were dissolved in 4 mL of distilled water and centrifuged at 1000 rpm for 5 min to remove the fecal residue. The resulting supernatant was diluted with 4 mL of distilled water and centrifuged at 4500 rpm for 5 min to remove any remaining precipitate After repeating this washing step three times, the solution was mixed well and stored at −80° until use.
The successfully established T2D mice were randomly divided into the T2D group, T2D + FMT group, and T2D + metformin (MET) group. Mice fed with regular food were used as the control group. The mice in the FMT group were orally administered 0.3 mL of fresh fecal suspension. The MET group was orally administrated 0.2 g/kg MET dissolved in 0.3 mL distilled water. The control group and T2D group were orally administered the same volume of distilled water. Oral administration was performed once daily for 4 weeks.
(5) During oral administration, the condition of the mice in each group was observed, and their body weight and FBG were recorded weekly. After 4 weeks of oral administration, cotton swabs were used to stimulate the anus of the mice to promote defecation, and 4–5 pellets of the stool were collected in a 1.5mL EP tube and stored at −80° until use. Animals were sacrificed by anesthesia with 4% chloral hydrate, and blood was collected from the eyeballs, followed by centrifugation at 3500 rpm for 5 min. The separated serum was stored at −80° until use. All experimental protocols were pre-approved by the Animal Ethics Committee of Anhui Medical University (approval No: PJ-YX2021-021; Anhui, China), and Animal experiments were performed in compliance with national guidelines and regulations.
Biochemical and Immunological Detection
- High-density lipoprotein cholesterol (HDL-C), low-density lipoprotein cholesterol (LDL-C), total cholesterol (TC), and triglyceride (TG) were detected using an automatic biochemical analyzer (SIEMENS XPT1).
- Inflammatory cytokines.
Inflammatory cytokines were detected using the LEGENDplex™ Mouse Inflammation Panel kit (BioLegend, San Diego, USA) according to the manufacturer’s protocol. The serum was diluted twice, and 25 µL of the diluted serum was mixed with 25 µL of magnetic beads. The mixture was shaken at 800 rpm for 2 h at room temperature, followed by centrifugation at 1050 rpm (250 g) for 5 min. The supernatant was immediately discarded after centrifugation, and 200 µL of wash buffer was added to each tube. The samples were mixed by shaking at 800 rpm for 1 min and then centrifuged again to remove the supernatant. Next, 25 µL of antibody solution was added, and the mixture was shaken at 800 rpm for 1 h. Subsequently, 25 µL of SA-PE was added to each tube, and the tubes were shaken at 800 rpm for 30 min and centrifuged. The supernatant was collected, and 150 µL of wash buffer was added before analysis using a flow cytometer (Mindray, BriCyte E6, Shen Zhen, China).
Enzyme-Linked Immunosorbent Assay (ELISA)
Serum insulin and glucagon-like peptide-1 (GLP-1) were measured using mouse ELISA kits (Nanjing Jiancheng Co., Ltd., Nanjing, China) according to the manufacturer’s instructions.
16S rRNA Sequencing and Untargeted Metabolic Analysis
16S rRNA sequencing and untargeted metabolic analysis were carried out by Shenzhen Wekemo Biotechnology Co. Ltd.
Biological Information Analyses
16S rRNA Sequencing
To ensure the accuracy of OTU (Operational Taxonomic Units) clustering and subsequent analysis, the original sequencing data were processed and filtered to obtain valid data. Species abundance profiles of OTU and other species’ taxonomic levels were calculated based on OTU clustering/denoising and species taxonomic analysis. The OTU abundance and diversity index were analyzed based on the normalized OTU species abundance profiles. The community structure at each taxonomic level was statistically analyzed for species annotation. In addition, to the above analysis, cluster analysis and statistical comparison analysis based on OTU and species composition can be performed to study the differences in species composition among the samples. The correlation of environmental and clinical factors was analyzed to predict significantly associated species communities and their functions.
Untargeted Metabolic Analysis
The metabolic analysis workflow was based on the MetaboAnalystR package, and the data analysis process involved the following steps:
- Quality control and batch correction of the data
- Data standardization
- Calculation of metabolite content (column chart, heat map)
- Unsupervised dimensionality reduction analysis (Principal Component Analysis, PCA)
- Screening of characteristic metabolites (biomarker) (Partial Least Squares Discriminant Analysis, PLSDA), Orthogonal Partial Least Squares Discriminant Analysis, OPLSDA), univariate analysis, volcano plot, machine learning)
- Correlation analysis
- Pathway analysis of characteristic metabolites (enrichment analysis, topology analysis, pathway map).
Statistical Analysis
All data were presented as SD ± SEM and analyzed using SPSS 23.0. For normally distributed data, differences among groups were analyzed by one-way analysis of variance (ANOVA). For non-normally distributed data, a Kruskal–Wallis analysis was performed. Correlation analysis was performed using Spearman correlation coefficient. P < 0.05 was considered statistically significant.
Results
The Effect of FMT on Fasting Blood Glucose in Mice
In the animal study, we selected MET, a conventional hypoglycemic drug, as the positive control. The FBG of the T2D group increased significantly compared to the NC group, indicating the successful establishment of the T2D model. The FBG in the FMT group decreased compared to the T2D group, but the difference was not statistically significant (P > 0.05) (Table 1).
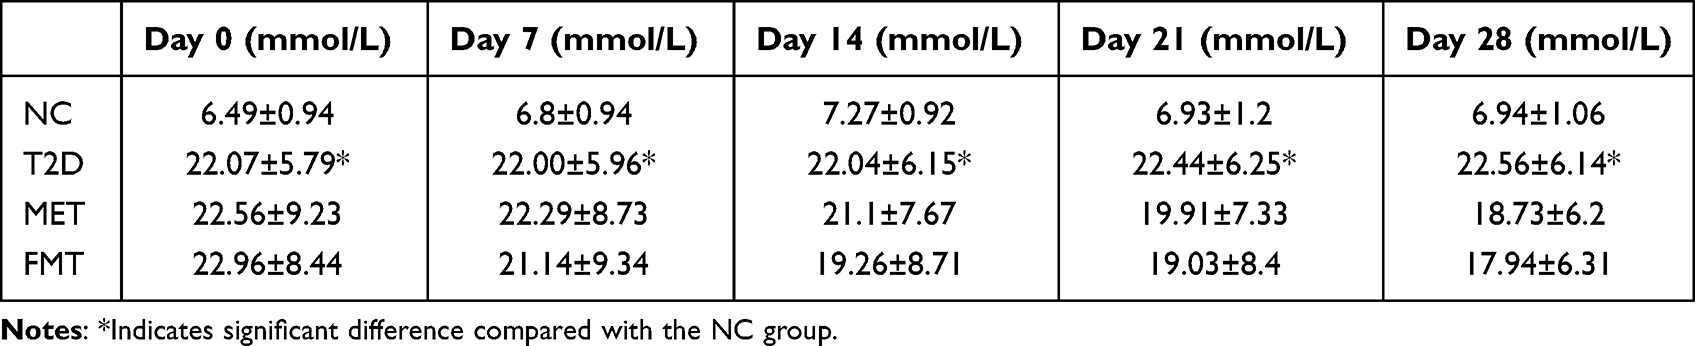 |
Table 1 FMT and Metformin Improve FBG in T2D Mice to Some Extent |
Inflammatory Cytokines in Glucose and Lipid Metabolism
As shown in Table 2, the TC content in the T2D group, MET group, and FMT group was significantly increased compared to the NC group. After FMT treatment, HDL in the FMT group significantly decreased, and LDL in the MET group significantly decreased compared to the control group. Additionally, the levels of LDL in the FMT group were significantly decreased compared to those in the T2D group, indicating that FMT could significantly improve lipid metabolic disorders in T2D mice. The differences in TG, IL-1α, IFN-γ, IL-12, insulin, TNF-α, and GLP-1 among the groups were not statistically significant (P>0.05).
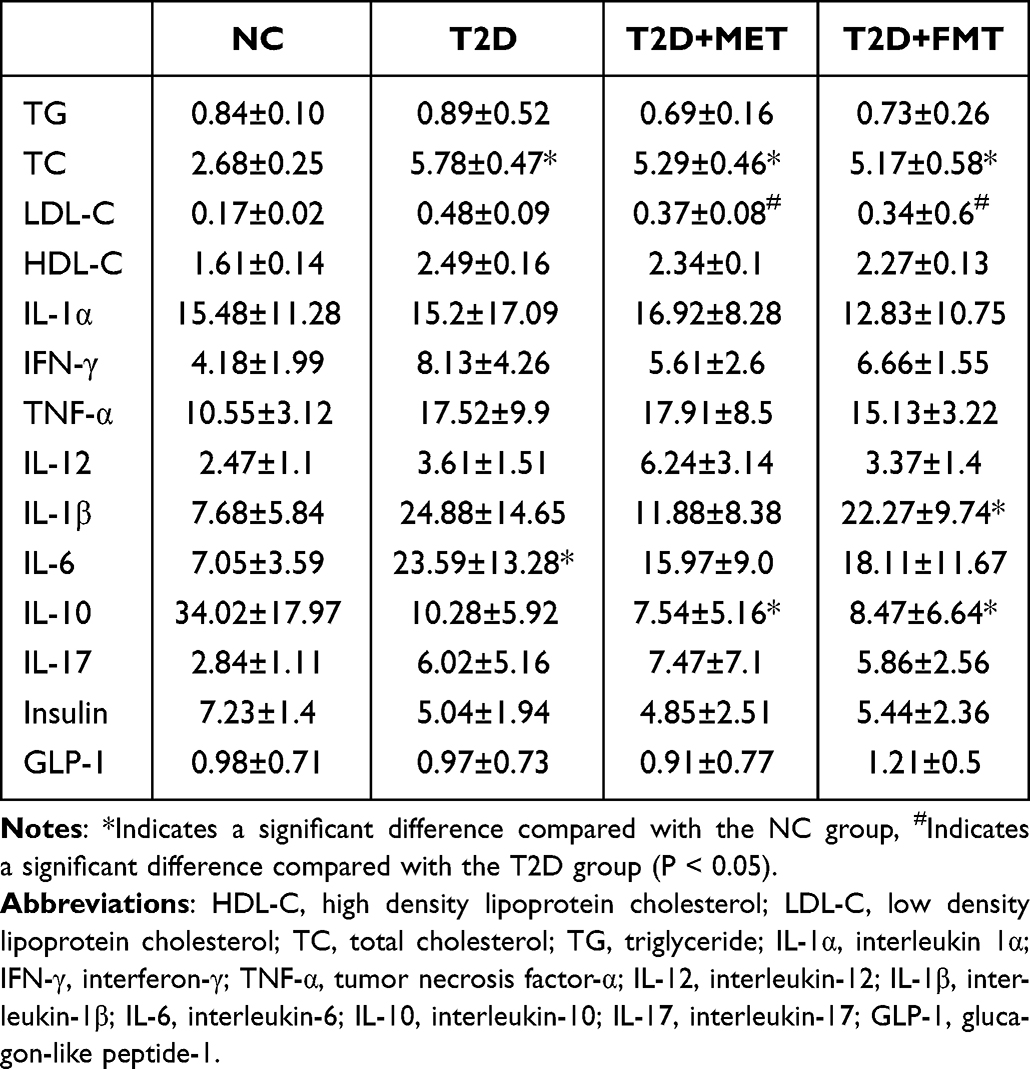 |
Table 2 The Content of Metabolic and Inflammatory Markers |
16S rRNA
To investigate the effect of FMT on the gastrointestinal microbiota of T2D mice, we performed 16 rDNA sequencing and analyzed changes in the gastrointestinal microbiota. We assessed the differences in the community structure of the gastrointestinal microbiota using principal coordinate analysis (PCoA) based on weighted UniFrac distances. As shown in Figure 1, the community structure of the gastrointestinal microbiota in the NC group significantly differed from the other three groups, indicating significant changes in the community structure of the gastrointestinal microbiota in T2D mice after induction with a high-fat diet and STZ. Additionally, we observed a significant difference in the community structure between the T2D group and FMT groups (P<0.05), suggesting that FMT significantly altered the community structure of the gastrointestinal microbiota in T2D mice.
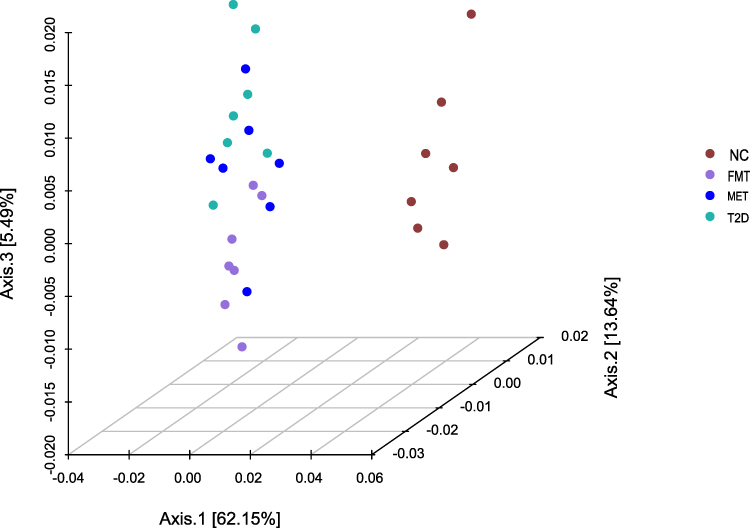 |
Figure 1 The 3D map of weighted UniFrac distance determined by principal coordinate analysis (PCoA). The closer the distance of the samples in the figure, the more similar the species composition of the samples. |
We clustered the data into OTUs (Operational Taxonomic Units) based on 97% similarity. The Venn diagram in Figure 2a shows that 457 OTUs were identified across all groups. The number of unique OTUs in the NC group, T2D group, MET group, and FMT group was 1089, 696, 981, and 742, respectively. In addition, 563 OTUs were identified in both the NC group and T2D groups (Figure 2b), 657 OTUs were commonly identified in the T2D group and FMT groups (Figure 2c), and 645 OTUs were present in both the T2D and tMET groups (Figure 2d). These findings indicate that T2D mice have less diverse gastrointestinal microbiota than NC mice and that interventions can increase the diversity of gastrointestinal microbiota in T2D mice.
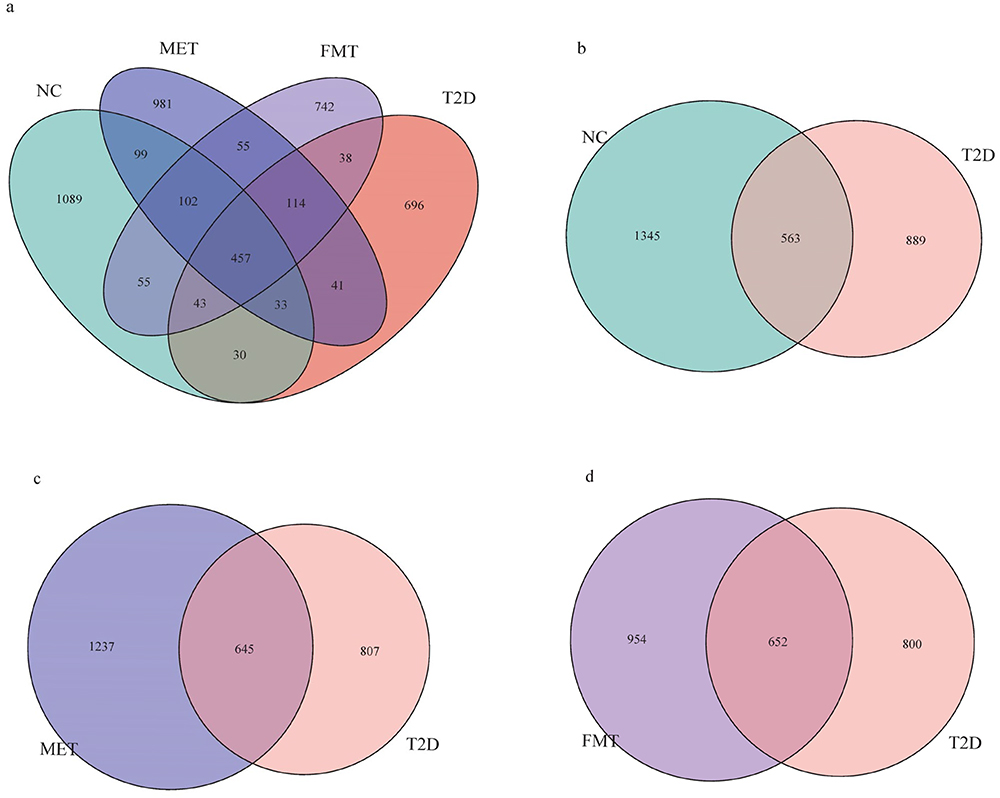 |
Figure 2 Venn diagram. The number of OTUs shared or unique among different groups. (a) Four groups of NC, T2D, MET and FMT are shown. (b) The NC and T2D groups. 2.(c) The MET and T2D groups. (d) The FMT and T2D groups. |
We investigated the composition characteristics of the gastrointestinal microbiota at the phylum level (Figure 3). We found that the microbial community structure was primarily composed of Firmicutes, Bacteroidetes, Proteobacteria, and Deferriobacteria. Compared with the NC group, the abundance of Bacteroidetes decreased in the T2D group, while the abundance of Firmicutes, Proteobacteria, and Deferrobacterium increased. In the FMT group, Bacteroidetes and Proteobacteria increased, while Firmicutes and Deferrobacterium decreased compared to the T2D group. The MET group showed an increase in Firmicutes and Proteobacteria, while Deferriobacteria and Bacteroidetes decreased compared to the T2D group.
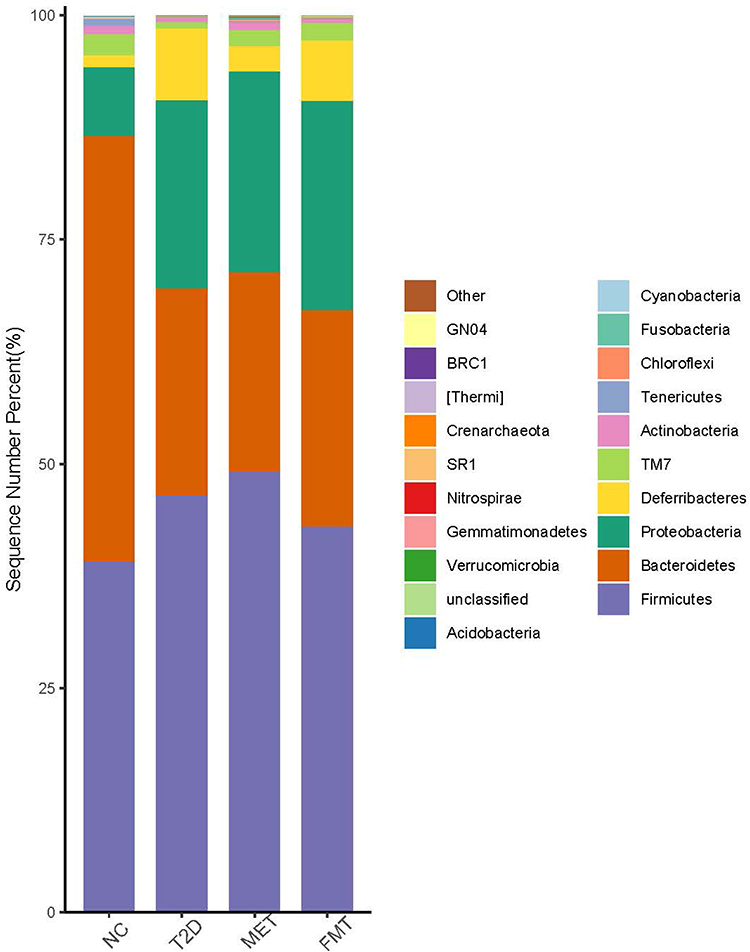 |
Figure 3 Column chart of relative distribution of each group at phylum level. The x-axis shows the group name, the y-axis (Sequence Number Percent) represents the ratio of the number of sequences annotated to the phylum to the total number of the annotated data. The color order of the histogram corresponds to the color order of the legend on the right. Un-annotated sequences at the phylum level are presented as unclassified. |
At the genus level (Figure 4), we found that following FMT and MET treatment Lachnospiraceae_Clostridium, Adlercreutzia, Helicobacter, Streptococcus, Lactococcus, Enterococcus, Erysipelotrichaceae_Clostridium, Aerococcus, Escherichia, Moraxella, Campylobacter, Capnocytophaga, Rothia, Granulicatella, Parvimonas, Odoribacter, and Anaerotruncus were down-regulated compared to the T2D group, while Oscillospira and Bacteroides were up-regulated. The decrease in the abundance of these genera was closer to that of the NC group, indicating that MET and FMT treatments can restore the community structure of gastrointestinal microbiota in T2D mice.
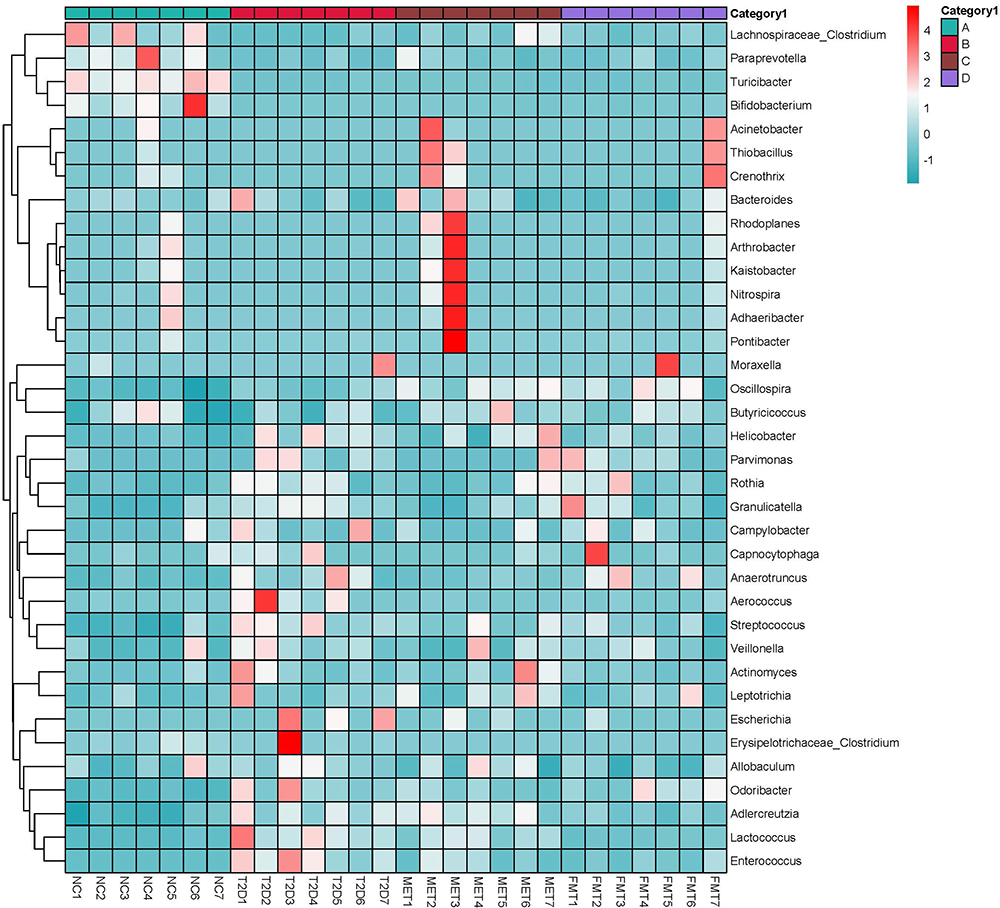 |
Figure 4 A heatmap showing genus-species abundance. The sample names are listed horizontally, the genus-level classification annotations are listed vertically. The clustering shown on the left represents the similarity of the species abundance distribution among the samples. The heatmap in the middle shows log10 converted absolute abundance. |
LEfSe analysis (LDA score [log10] > 2) indicated that the NC group consisted of Lactobacillaceae, Parabacteroides, Turicibacter, Prevotella, Coprococcus, Clostridium, Paraprevotella, etc. The dominant bacteria in the stool samples from the T2D group were Deferribacteres, Deferribacter, Myxospira, Lactococcus, Leuconostoc, Clostridium, Streptococcus, and Enterococcus. The dominant species in the FMT group were Verrucobacterium, Odoribacteraceae, Rikenellaceae, Ruminococcus, Desulfovibrio, Dorea, Rikenella, and Anaerotruncus. The dominant bacteria in the MET group were Dehalobacterium, Dehalobacteriaceaeo, Coriobacterialesc, Coriobacteriia, Coriobacteriaceae, Adlercreutzia, Ruminococcus, Oscillospira, and Clostridialesc (Figure 5).
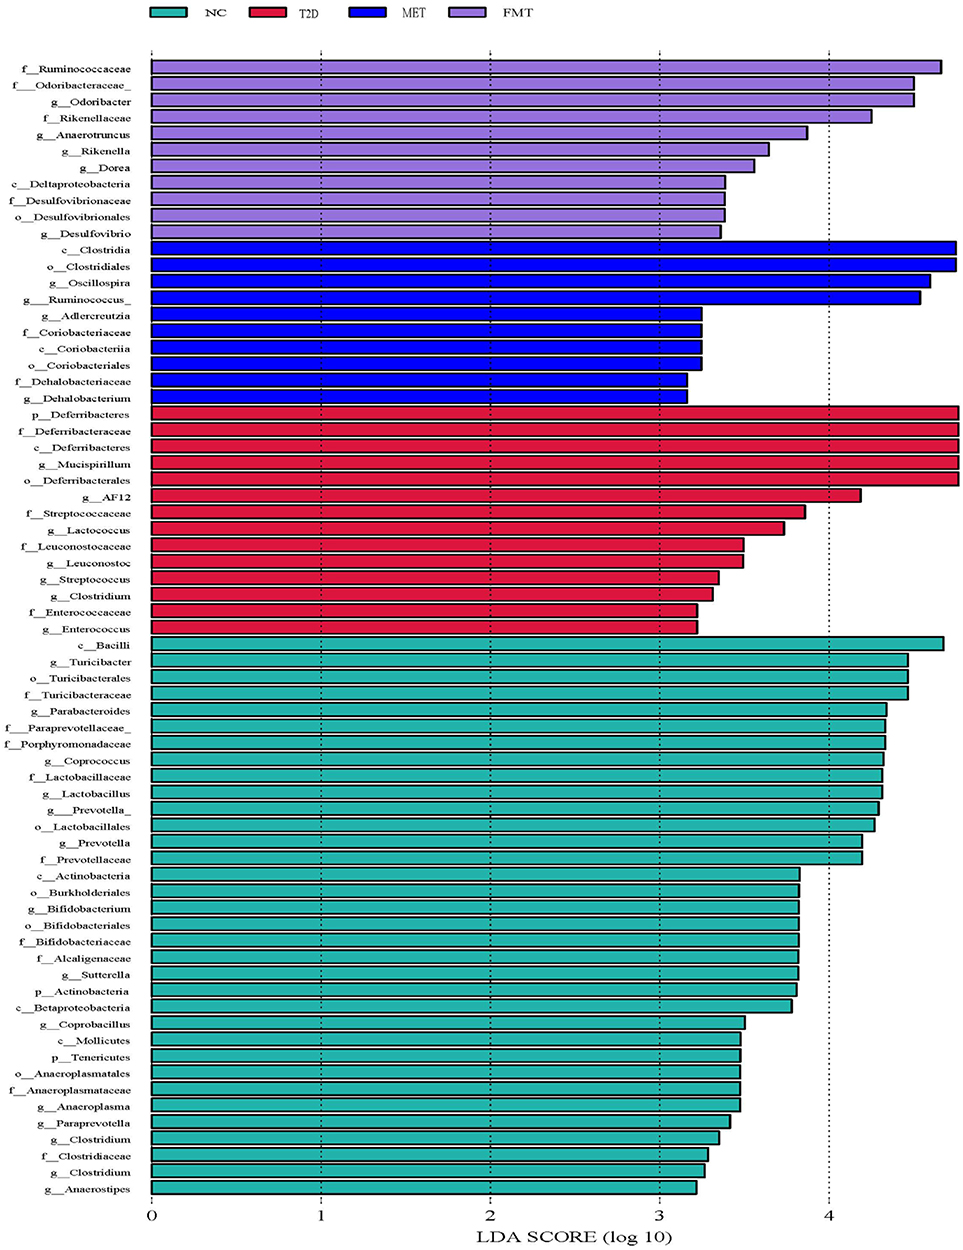 |
Figure 5 LEfSe analysis LDA histogram. Each horizontal column represents one species. The length of the column corresponds to the LDA value. The higher the LDA value, the greater the difference in this species among different groups. The characteristic microorganisms of different groups with high abundance are color coded. |
Untargeted Metabolomic Analysis
Untargeted metabolomics was used to identify potential alterations in key metabolites and metabolic pathways in serum samples. PCA and OPLS-DA were used to evaluate the differences between the control group, model group, and intervention group, and to assess the impact of FMT on metabolic patterns. A total of 354 metabolites were identified in the serum samples, which were mainly involved in the metabolism of steroid hormone biosynthesis, amino acids, and organic acids.
PCA analysis (Figure 6a) revealed that the NC group differed significantly from the other three groups, indicating that the metabolic profile can effectively distinguish between difference the disease group and normal mice. Meanwhile, the metabolic profiles of the T2D, MET, and FMT groups partially overlapped. Figure 6b shows that the metabolites differed significantly between the T2D group and the FMT group, suggesting that FMT can effectively improve the metabolic disorder of T2D mice.
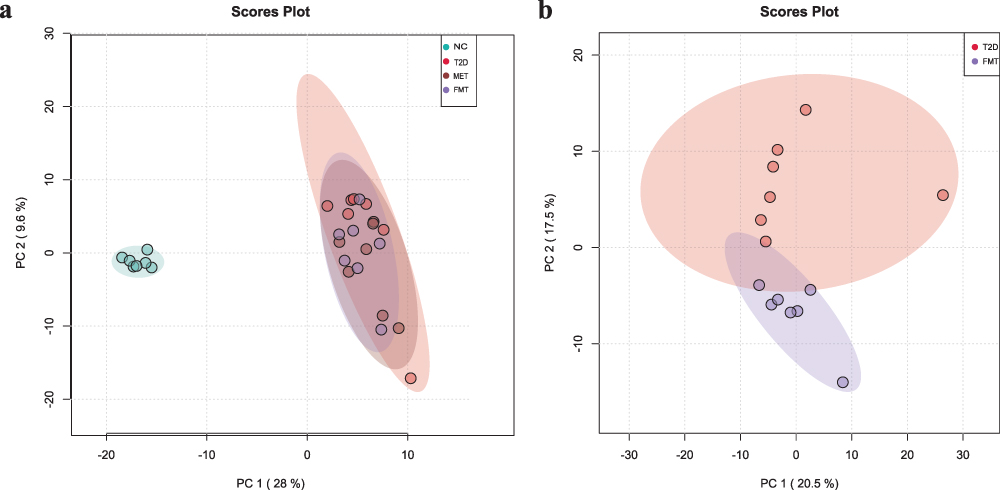 |
Figure 6 Principal component analysis (PCA) of the metabolomic data. Each point represents an individual sample. PCA1 and PCA2 represent the first and second principal components, respectively. The numbers in parentheses represent the contribution rates of the principal components. (a) Four groups of NC, T2D, MET and FMT are shown. (b) Two groups T2D and FMT are shown. |
Since the study mainly focused on how FMT treatment altered the metabolism of T2D mice, we compared the changes in metabolites between the NC group and the T2D group, and between the T2D group and the FMT group. Compared to the NC group, 29 metabolites were up-regulated and 24 metabolites were down-regulated in the T2D group (Figure 7a). The expression of Taurodeoxycholic Acid, Dehydrocholic Acid, Stercobilin, and sodium cholate increased, while the expression of Riboflavin, and GLy-Tyr decreased. In comparison to the T2D group, four metabolites were up-regulated in the FMT group, including Progesterone, Deoxycorticosterone, Neosaxitoxin, and one down-regulated, Stercobilin (Figure 7b).
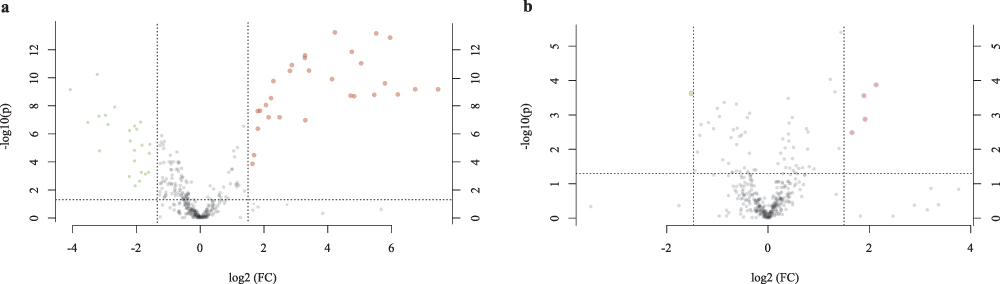 |
Figure 7 Volcano plot of the fold change. (a) The metabolites on both sides of the area showed significant differences between groups (fold change > 1.5 and p < 0.05). Each data point represent a metabolite. Red dots indicate higher number of metabolites in the T2D group, green dots indicate higher number of metabolites in the NC group, and gray dots indicate no difference between groups. (b) The T2D group and FMT group. |
PLS-DA was used to identify potential biomarkers in the FMT group. Twenty-one important metabolites were selected to show the difference between the T2D group and the FMT group) (VIP > 1, P < 0.05), such as Corticosterone, Progesterone, L-Urobilin, Neosaxitoxin, L-Kynurenine, Tetrahydrocorticosterone, Ursodeoxycholic acid, Tetrahydrocorticosterone, etc. (Supplementary File 1), which were mainly related to steroid hormones, amino acids, and organic acids. All potential biomarkers were included in the pathway analysis, and 10 major metabolic pathways were identified (Figure 8). The major enrichment pathways included steroid hormone biosynthesis, arginine and proline metabolism, tryptophan metabolism, valine, leucine, and isoleucine biosynthesis, vitamin B6 metabolism, arginine biosynthesis, histidine metabolism, glutathione metabolism, glycine, serine, and threonine metabolism, and aminoacyl-tRNA biosynthesis.
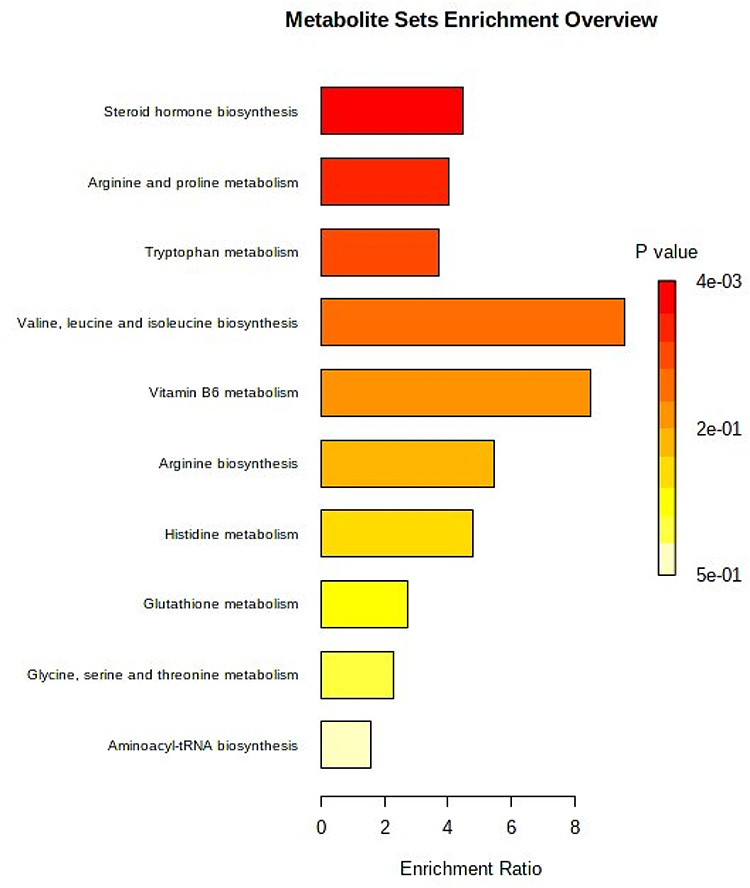 |
Figure 8 ORA enrichment analysis. The metabolic pathways with significant enrichment of the altered metabolites. The x-axis shows the enrichment ratio. The p value is color coded by the brightness as shown on the legend. |
The Gastrointestinal Microbiota of T2D Mice is Associated with Clinical Metabolic Markers
To determine the relationships between blood biochemical markers and the gastrointestinal microbiota, we performed Spearman correlation coefficient tests. Our results (Figure 9) indicated that Bifidobacterium, Parabacteroides, and Prevotella were negatively correlated with HDL, LDL, and GLU, but positively correlated with the anti-inflammatory factor IL-10. Conversely, Enterococcus, Ruminococcus, and Streptococcus were positively correlated with HDL, LDL, and GLU, but negatively correlated with IL-10. Streptococcus and Odoribacter were positively correlated with pro-inflammatory factors IL-1β and IL-6, while Sutterella, Turicibacter, and Prevotella were negatively correlated with IL-1β and IL-6.
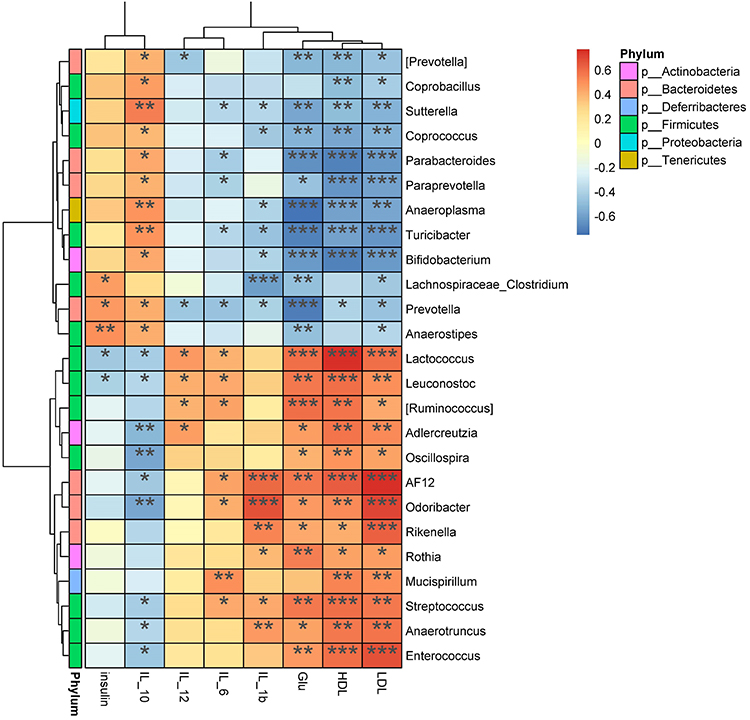 |
Figure 9 Correlation heatmap. Environmental factors are presented on the x-axis, and species of the microbiota are listed on the Y-axis. R-values (rank correlation) and P-values were obtained by calculation. The R values are color coded as shown in the legend on the right. The color bar on the left indicates the phylum to which the species belongs. *P < 0.05; **P<0.01; ***P < 0.001. |
Discussion
In recent years, fecal microbiota transplantation (FMT) has been increasingly used as a new therapeutic method targeting the gastrointestinal microbiota for the treatment of various diseases. In this study, we established a T2D model by combining a high-fat diet with an STZ injection. A high-fat diet induces changes in the gut microbiome that lead to the activation of pro-inflammatory pathways, while obesity due to overnutrition exacerbates inflammation. As a result, the levels of inflammatory factors such as IL-6 and IL-1β were increased in each group after a high-fat diet compared to the NC group. However, after FMT treatment, we observed a downward trend in these levels compared with the T2D group. Furthermore, FMT treatment was found to reduce FBG in diabetic mice. Dyslipidemia is one of the characteristics of T2D patients, and it increases the risk of cardiovascular disease.14 After FMT treatment, the LDL level in T2D mice was significantly decreased, indicating that FMT treatment can reduce the risk of T2D with complicated cardiovascular disease.
16S rRNA sequencing was performed to study the effect of FMT treatment on the gastrointestinal microbiota of T2D mice. FMT treatment altered the microbial composition, which was evidenced by the microbial community imbalances in T2D mice compared to the NC group. At the phylum level, the abundance of Bacteroidetes increased after FMT and MET treatments compared with the T2D group. At the genus level, the FMT group and MET group down-regulated harmful bacteria such as Lachnospiraceae_Clostridium, Helicobacter, and Erysipelotrichaceae_Clostridium compared to the T2D group. Lachnospiraceae_Clostridium is associated with elevated blood sugar and decreased insulin sensitivity;13 Helicobacter is associated with gastric cancer;15 Erysipelotrichaceae_Clostridium is associated with certain diseases such as kidney stones.16 On the other hand, the abundance of beneficial bacteria such as Oscillospira and Bacteroides was up-regulated. Among them, Oscillospira is a butyrate-producing bacteria,17 and Bacteroides are intestinal probiotics.18 After FMT treatment, harmful bacteria could be reduced, and the abundance of beneficial bacteria could be increased, indicating that both MET and FMT treatments in T2D mice can improve the community structure of gastrointestinal microbiota. According to the LEfSe results, we found that the dominant bacteria in the FMT group were Odoribacteraceae and Ruminococcus, while the dominant bacteria in the MET group were Ruminococcus, Oscillospira, and Clostridialesc, all of which were butyrate-producing bacteria.17,19 Gastrointestinal microbes ferment dietary fiber and resistant starch to produce short-chain fatty acids (SCFAs).20 SCFAs include acetate, propionate, and butyrate, of which butyrate has potential hypoglycemic effects.21 However, untreated T2D mice lacked butyrate-producing bacterial species. In our study, FMT therapy improved T2D symptoms, possibly due to the improvement of the intestinal microenvironment, local intestinal metabolism, local immune response, and intestinal mucosal barrier. This is due to the large number of beneficial microbiota fixed after whole fecal microbiota transplantation. However, the underlying mechanisms are not fully understood.
The pathogenesis of T2D is known to be related to metabolic disorders. In recent years, metabolomics has emerged as an effective method for diagnosing and monitoring disease progression or therapeutic intervention. In our study, 21 potential metabolic biomarkers FMT-related were identified. To investigate the underlying mechanism of FMT, we analyzed the altered metabolites using the KEGG database for metabolic pathways. We found that the major metabolic pathway associated with FMT treatment was steroid hormone biosynthesis. The biomarker involved in steroid hormone biosynthesis that caught our attention was corticosterone. In humans and most mammals, cortisol is the predominant glucocorticoid, whereas, in rodents, corticosterone is the predominant glucocorticoid.22 Notably, corticosterone levels were significantly elevated in the FMT group compared with the T2D group. Previous studies have suggested that cortisol or cortisol levels were persistently elevated in T2D patients and animal models.23 For example, in 509 subjects in Mysore, India, fasting serum cortisol and fasting blood glucose concentrations were positively correlated with insulin resistance.24 Sarita Devi et al also observed elevated fasting plasma cortisol levels in T2D and T2D nephropathy groups.25 Elevated corticosterone levels have also been shown to disrupt glucose metabolism, impairing the support and maintenance of the rat hippocampus.26 The elevated corticosterone and steroid hormone activation in this study may be due to the high plasma cholesterol level, which is metabolically converted into steroid hormones. Future studies will focus on evaluating the utility of corticosterone as a T2D biomarker. In addition, we also found other key pathways in the plasma, including arginine and proline metabolism, vitamin B6 metabolism, riboflavin metabolism, unsaturated fatty acid biosynthesis, etc.
Numerous studies have demonstrated that the metabolic profile of T2D subjects is significantly influenced by their gastrointestinal microbiota.27 In our study, we found that several characteristic metabolic markers and gastrointestinal microbiota were highly correlated with the beneficial outcomes of FMT. Specifically, we discovered that 25 bacterial species were significantly associated with 8 metabolic markers. Numerous studies have reported the beneficial effects of using probiotics to modulate gastrointestinal microbiota for the treatment of metabolic diseases. For example, in HFD- and STZ-induced diabetic mice, Bifidobacterium longum DD98 and selenium-enriched Bifidobacterium longum DD98 were shown to reduce FBG and HbA1c levels, as well as improve glucose tolerance.28 In our study, we observed a negative correlation between FBG levels and Bifidobacterium content. Additionally, Prevotella was found to be associated with the improvement of dietary fiber-induced glucose tolerance,29 which is consistent with our findings that Prevotella and FBG content were negatively correlated. These findings suggest that the modulation of gastrointestinal microbiota is closely related to the improvement of T2D.
In this study, we examined the effects of FMT and MET treatments on blood glucose levels in diabetic mice. Our results indicate that neither treatment significantly altered blood glucose levels. Two potential explanations for these findings are insufficient treatment duration and suboptimal drug doses. In future studies, the effects of longer treatment durations and higher drug dosages will be investigated.
Conclusions
Our findings suggest that FMT can modulate gastrointestinal microbiota and host metabolites, potentially improving dyslipidemia. Our comprehensive serum metabolomic and microbiome analysis provides insight into the therapeutic mechanisms of FMT. Specifically, FMT treatment improved multiple metabolic pathways and gastrointestinal microbiota, supporting its potential as an alternative strategy for treating T2D and its associated complications. The observed changes in metabolic pathways and gastrointestinal microbiota following FMT treatment may be a key mechanism underlying its therapeutic effects. However, our study has limitations, and further research is needed to establish the direct relationship between gastrointestinal microbiota and host metabolism.
Abbreviations
FMT, Fecal microbiota transplantation; T2D, Type 2 diabetes; STZ; Streptozotocin; FBG; Fasting blood glucose; SPF, Specific pathogen Free; HDL-C, High-density lipoprotein cholesterol; LDL-C, Low-density lipoprotein cholesterol; TC, Total cholesterol; TG, Triglyceride; IL-1α, Interleukin 1α; IFN-γ, Interferon-γ; TNF-α, Tumor necrosis factor-α; IL-12, Interleukin-12; IL-1β, Interleukin-1β; IL-6, Interleukin-6; IL-10, Interleukin-10; IL-17, Interleukin-17; GLP-1, Glucagon-like peptide-1; ELISA, Enzyme-linked immunosorbent assay, OUT, Operational Taxonomic Units; PCA, Principal Component Analysis; PLSDA, Partial Least Squares Discriminant Analysis; OPLSDA, Orthogonal Partial Least Squares Discriminant Analysis; PCoA, Principal Coordinate Analysis; LDA, Redundancy Analysis.
Data Sharing Statement
The datasets used during the current study are available from corresponding author.
Ethics Approval
All experimental procedures were approved by the Animal Ethics Committee of Anhui Medical University (approval No: PJ-YX2021-021; Anhui, China).
Acknowledgments
We thank The Fourth Affiliated Hospital of Anhui Medical University and Shenzhen Wekemo Biotechnology Co. Ltd. for their support.
Funding
This research is supported by 2020 Anhui Provincial University Cooperative Research and Public Health Collaborative Innovation Project of Anhui Provincial Department of Education (Grant No. GXXT-2020-016), 2021 Anhui Provincial Health and Health Commission Key Scientific Research Project (Grant No. AHWJ2021a011), 2021 Anhui Provincial Medical and Health Key Specialty Construction Project (Approval No: serial number 95), 2021 Anhui Provincial Key Project of Natural Science Research in Colleges and Universities (Approval No: KJ2021ZD0032).
Disclosure
The authors declare that they have no conflicts of interest to report.
References
1. Zhang Y, Gu Y, Ren H, et al. Gut microbiome-related effects of berberine and probiotics on type 2 diabetes (the PREMOTE study). Nat Commun. 2020;11(1):5015. doi:10.1038/s41467-020-18414-8
2. Morrish NJ, Wang SL, Stevens LK, Fuller JH, Keen H. Mortality and causes of death in the WHO multinational study of vascular disease in diabetes. Diabetologia. 2001;44(Suppl 2):S14–S21. doi:10.1007/PL00002934
3. Burson R, Moran KJ. Reviewing the 2017 American diabetes association standards of medical care. Home Healthc Now. 2017;35(6):339–340. doi:10.1097/NHH.0000000000000547
4. Sharma S, Tripathi P. Gut microbiome and type 2 diabetes: where we are and where to go? J Nutr Biochem. 2019;63(p):101–108. doi:10.1016/j.jnutbio.2018.10.003
5. Hosseinkhani F, Heinken A, Thiele I, Lindenburg PW, Harms AC, Hankemeier T. The contribution of gut bacterial metabolites in the human immune signaling pathway of non-communicable diseases. Gut Microbes. 2021;13(1):1–22. doi:10.1080/19490976.2021.1882927
6. Zhernakova A, Kurilshikov A, Bonder MJ, et al. Population-based metagenomics analysis reveals markers for gut microbiome composition and diversity. Science. 2016;352(6285):565–569. doi:10.1126/science.aad3369
7. Ang QY, Alexander M, Newman JC, et al. Ketogenic diets alter the gut microbiome resulting in decreased intestinal Th17 cells. Cell. 2020;181(6):1263–1275 e16. doi:10.1016/j.cell.2020.04.027
8. Chen L, Wang D, Garmaeva S, et al. The long-term genetic stability and individual specificity of the human gut microbiome. Cell. 2021;184(9):2302–2315 e12. doi:10.1016/j.cell.2021.03.024
9. Belcheva A, Irrazabal T, Robertson SJ, et al. Gut microbial metabolism drives transformation of MSH2-deficient colon epithelial cells. Cell. 2014;158(2):288–299. doi:10.1016/j.cell.2014.04.051
10. Zabell A, Tang WH. Targeting the Microbiome in Heart Failure. Curr Treat Options Cardiovasc Med. 2017;19(4):27. doi:10.1007/s11936-017-0528-4
11. Chng KR, Ghosh TS, Tan YH, et al. Metagenome-wide association analysis identifies microbial determinants of post-antibiotic ecological recovery in the gut. Nat Ecol Evol. 2020;4(9):1256–1267. doi:10.1038/s41559-020-1236-0
12. Gurung M, Li Z, You H, et al. Role of gut microbiota in type 2 diabetes pathophysiology. EBioMedicine. 2020;51:102590. doi:10.1016/j.ebiom.2019.11.051
13. Li R, Huang X, Liang X, Su M, Lai KP, Chen J. Integrated omics analysis reveals the alteration of gut microbe-metabolites in obese adults. Brief Bioinform. 2021;22(3):15.
14. Yan Z, Wu H, Zhou H, et al. Integrated metabolomics and gut microbiome to the effects and mechanisms of naoxintong capsule on type 2 diabetes in rats. Sci Rep. 2020;10(1):10829. doi:10.1038/s41598-020-67362-2
15. Stewart OA, Wu F, Chen Y. The role of gastric microbiota in gastric cancer. Gut Microbes. 2020;11(5):1220–1230. doi:10.1080/19490976.2020.1762520
16. Tang R, Jiang Y, Tan A, et al. 16S rRNA gene sequencing reveals altered composition of gut microbiota in individuals with kidney stones. Urolithiasis. 2018;46(6):503–514. doi:10.1007/s00240-018-1037-y
17. Forslund K, Hildebrand F, Nielsen T, et al. Disentangling type 2 diabetes and metformin treatment signatures in the human gut microbiota. Nature. 2015;528(7581):262–266. doi:10.1038/nature15766
18. Fabersani E, Portune K, Campillo I, et al. Bacteroides uniformis CECT 7771 alleviates inflammation within the gut-adipose tissue axis involving TLR5 signaling in obese mice. Sci Rep. 2021;11(1):11788. doi:10.1038/s41598-021-90888-y
19. Liu S, Li E, Sun Z, et al. Altered gut microbiota and short chain fatty acids in Chinese children with autism spectrum disorder. Sci Rep. 2019;9(1):287. doi:10.1038/s41598-018-36430-z
20. Lu Y, Fan C, Li P, Lu Y, Chang X, Qi K. Short Chain fatty acids prevent high-fat-diet-induced obesity in mice by regulating G protein-coupled receptors and gut microbiota. Sci Rep. 2016;6:37589. doi:10.1038/srep37589
21. Makki K, Deehan EC, Walter J, Backhed F. The impact of dietary fiber on gut microbiota in host health and disease. Cell Host Microbe. 2018;23(6):705–715. doi:10.1016/j.chom.2018.05.012
22. Droste SK, de Groote L, Atkinson HC, Lightman SL, Reul JM, Linthorst AC. Corticosterone levels in the brain show a distinct ultradian rhythm but a delayed response to forced swim stress. Endocrinology. 2008;149(7):3244–3253. doi:10.1210/en.2008-0103
23. Elahi-Moghaddam Z, Behnam-Rassouli M, Mahdavi-Shahri N, Hajinejad-Boshroue R, Khajouee E. Comparative study on the effects of type 1 and type 2 diabetes on structural changes and hormonal output of the adrenal cortex in male Wistar rats. J Diabetes Metab Disord. 2013;12(1):9. doi:10.1186/2251-6581-12-9
24. Ward AM, Fall CH, Stein CE, et al. Cortisol and the metabolic syndrome in South Asians. Clin Endocrinol. 2003;58(4):500–505. doi:10.1046/j.1365-2265.2003.01750.x
25. Devi S, Nongkhlaw B, Limesh M, et al. Acyl ethanolamides in diabetes and diabetic nephropathy: novel targets from untargeted plasma metabolomic profiles of South Asian Indian men. Sci Rep. 2019;9(1):18117. doi:10.1038/s41598-019-54584-2
26. Payne RS, Schurr A. Corticosterone disrupts glucose-, but not lactate-supported hippocampal PS-LTP. Neurosci Lett. 2007;424(2):111–115. doi:10.1016/j.neulet.2007.07.006
27. Pedersen HK, Gudmundsdottir V, Nielsen HB, et al. Human gut microbes impact host serum metabolome and insulin sensitivity. Nature. 2016;535(7612):376–381. doi:10.1038/nature18646
28. Zhu H, Lu C, Gao F, et al. Selenium-enriched Bifidobacterium longum DD98 attenuates irinotecan-induced intestinal and hepatic toxicity in vitro and in vivo. Biomed Pharmacother. 2021;143:112192. doi:10.1016/j.biopha.2021.112192
29. Kovatcheva-Datchary P, Nilsson A, Akrami R, et al. Dietary fiber-induced improvement in glucose metabolism is associated with increased abundance of prevotella. Cell Metab. 2015;22(6):971–982. doi:10.1016/j.cmet.2015.10.001
 © 2023 The Author(s). This work is published and licensed by Dove Medical Press Limited. The
full terms of this license are available at https://www.dovepress.com/terms
and incorporate the Creative Commons Attribution
- Non Commercial (unported, 3.0) License.
By accessing the work you hereby accept the Terms. Non-commercial uses of the work are permitted
without any further permission from Dove Medical Press Limited, provided the work is properly
attributed. For permission for commercial use of this work, please see paragraphs 4.2 and 5 of our Terms.
© 2023 The Author(s). This work is published and licensed by Dove Medical Press Limited. The
full terms of this license are available at https://www.dovepress.com/terms
and incorporate the Creative Commons Attribution
- Non Commercial (unported, 3.0) License.
By accessing the work you hereby accept the Terms. Non-commercial uses of the work are permitted
without any further permission from Dove Medical Press Limited, provided the work is properly
attributed. For permission for commercial use of this work, please see paragraphs 4.2 and 5 of our Terms.