Back to Journals » Journal of Inflammation Research » Volume 13
Comprehensive Evaluation of Lipopolysaccharide-Induced Changes in Rats Based on Metabolomics
Authors Geng C, Guo Y, Wang C, Cui C, Han W, Liao D ![]() , Jiang P
, Jiang P
Received 3 June 2020
Accepted for publication 1 August 2020
Published 24 August 2020 Volume 2020:13 Pages 477—486
DOI https://doi.org/10.2147/JIR.S266012
Checked for plagiarism Yes
Review by Single anonymous peer review
Peer reviewer comments 3
Editor who approved publication: Professor Ning Quan
Chunmei Geng,1 Yujin Guo,1 Changshui Wang,2 Changmeng Cui,3 Wenxiu Han,1 Dehua Liao,4 Pei Jiang1
1Department of Pharmacy, Jining First People’s Hospital, Jining Medical University, Jining 272000, People’s Republic of China; 2Department of Clinical Translational Medicine, Jining Life Science Center, Jining 272000, People’s Republic of China; 3Department of Neurosurgery, Affiliated Hospital of Jining Medical University, Jining Medical University, Jining 272000, People’s Republic of China; 4Department of Pharmacy, Hunan Cancer Hospital, Central South University, Changsha 410011, People’s Republic of China
Correspondence: Pei Jiang
Department of Pharmacy, Jining First People’s Hospital, Jining Medical University, Jining 272000, People’s Republic of China
Tel/Fax +86 537 2106208
Email [email protected]
Purpose: Substantial evidence indicates that lipopolysaccharide (LPS) exposure can lead to systemic inflammatory response syndrome (SIRS) and multiple organ failure. Previous metabolomic studies have mainly focused on LPS-induced depression or hepatic and renal effects. However, no comprehensive metabolomics-based analysis of the serum, liver, kidney, hippocampus, and heart following exposure to LPS has been undertaken to date.
Material and Methods: Male Sprague–Dawley rats were randomly allocated to a control and a LPS-treated group (n=8). LPS for 2 weeks (0.5 mg/kg every other day) was given via intraperitoneal injection. Gas chromatography–mass spectrometry (GC–MS) was used for metabolite determination, while multivariate statistical analysis was performed to identify differentially expressed metabolites between the two groups.
Results: Our study revealed that 24, 13, 12, 7, and 12 metabolites were differentially expressed between the LPS treatment group and the control group in the serum, liver, kidney, hippocampus, and heart, respectively. We further identified that these metabolic changes were mainly involved with aminoacyl-tRNA biosynthesis; glutathione metabolism; glyoxylate and dicarboxylate metabolism; glycine, serine, and threonine metabolism; arginine biosynthesis; bile acid biosynthesis; and glycerolipid metabolism.
Conclusion: We have systematically elucidated the metabolic changes underlying LPS-induced SIRS, thereby providing insight into the mechanisms associated with these alterations.
Keywords: systemic inflammatory response syndrome, metabolites, gas chromatography–mass spectrometry, multivariate statistical analysis
Introduction
Lipopolysaccharide (LPS) is a major component of the outer membrane of Gram-negative bacteria and consists of core oligosaccharide regions, conserved lipid A, and a long-chain polysaccharide O antigen.1 Increasing evidence has indicated that LPS can elicit uncontrolled cytokine production, leading to hemodynamic instability, cardiovascular collapse, and acute liver, kidney, and lung injury.2–4 Moreover, evidence from both basic and clinical research supports that LPS-induced inflammatory cytokine dysregulation may be linked to the pathophysiology of depression.5,6 LPS can induce systemic inflammatory response syndrome (SIRS), which triggers sepsis and leads to multiple organ failure, and is associated with high rates of morbidity and mortality.7,8 Therefore, comprehensive metabolomics-based evaluation of LPS-induced SIRS and multiple organ failure is necessary.
Metabolomics represents the global assessment of metabolites in biological samples and can be a powerful tool for biomarker discovery.9–13 Several analytical techniques are used in metabolomic studies, such as nuclear magnetic resonance (NMR) spectroscopy, ultra-high-performance liquid chromatography combined with quadrupole time-of-flight mass spectrometry (UPLC–Q/TOF–MS), and gas chromatography–mass spectrometry (GC–MS). When combined with multivariate statistics, these analytical techniques facilitate the screening and identification of potential metabolites. Studies relating to LPS-induced inflammatory responses have mainly focused on depression5,6,14 and single biological matrices (serum, liver, kidney, hippocampus, or heart). However, the metabolic changes might be diverse in different tissues, and no comprehensive metabolomics-based analysis of LPS-induced changes has been undertaken to date.
To the best of our knowledge, this is the first comprehensive metabolomic analysis of how LPS-induced SIRS can influence metabolic alterations in key target tissues. In the present study, we used GC–MS coupled with univariate and multivariate analyses to elucidate the LPS-induced changes in metabolites occurring in the serum, liver, kidney, hippocampus, and heart of LPS-treated rats. Our results may aid in the understanding of the pathogenesis of LPS-induced SIRS.
Materials and Methods
Animals
Male Sprague–Dawley rats (180–240 g) were randomly allocated to control and LPS treatment groups (n=8). Rats in the LPS treatment group were given 0.5 mg/kg LPS every other day via intraperitoneal injection for two weeks with a total of seven injections. Animals in the untreated control group were given the same volume of normal saline. The dose of LPS was chosen based on earlier reports.5,15 This study was approved by the Ethics Committee of Jining First People’s Hospital (protocol number 20170016) and performed in accordance with the National Institutes of Health guide for the care and use of laboratory animals.
Reagents
LPS (Escherichia coli serotype0111:B4), heptadecanoic acid (purity ≥98%), an internal standard (IS), and N,O-bis(trimethylsilyl)trifluoroacetamide with 1% trimethylchlorosilane (BSTFA+1% TMCS; v/v) were purchased from Sigma–Aldrich (Saint Louis, MO, USA). O-Methylhydroxylamine hydrochloride (98.0% purity) was obtained from J&K Scientific Ltd (Beijing, China). Pyridine was obtained from Shanghai Macklin Biochemical (Shanghai, China). Chromatographic-grade methanol was purchased from Thermo Fisher Scientific (Waltham, MA, USA). Water was purchased from Hangzhou Wahaha Company (Hangzhou, China).
Sample Collection
Rats were euthanized with 1% sodium pentobarbital (50 mg/kg). Blood was collected and centrifuged (4500 × g, 5 min) to obtain the serum. All the rats were dissected on an ice-cold surface to obtain liver, kidney, hippocampal, and heart samples. After washing with phosphate-buffered saline (PBS, pH=7.2), all samples were frozen at −80 °C until use.
Sample Preparation
Serum samples (100 μL) were mixed with 350 μL of methanol containing 100 μg/mL IS and centrifuged (20,913 × g, 4 °C, 10 min). The supernatants were transferred to 2-mL tubes and dried at 37 °C under a gentle flow of nitrogen gas. The extracts were subsequently mixed with 80 μL of O-methylhydroxylamine hydrochloride (15 mg/mL in pyridine) and incubated for 90 min at 70 °C. Then, 100 μL of BSTFA+1% TMCS was added, followed by incubation for 1 h at 70 °C. The solution was then vortexed, centrifuged (20,913 × g, 4 °C, 2 min), and filtered through a 0.22-μm pore membrane filter before GC–MS analysis.
Tissue samples (50 mg; liver, kidney, hippocampus, and heart) were homogenized with 1 mL of methanol containing 1 mg/mL IS and transferred to 2-mL tubes and centrifuged (20,913 × g, 4 °C, 10 min). The remainder of the preparation procedure was the same as that used for the serum samples.
Quality control (QC) samples were defined as the mixture of control group and the LPS treatment group samples.
GC–MS
GC–MS analysis was performed on a 7890B GC system using a 7000C mass spectrometer. An HP-5MS fused-silica capillary column was used to separate samples. A 1-μL aliquot of the derivatized solution was run in split mode (50:1). The transfer line, injection, and ion source temperatures were 250 °C, 280 °C, and 230 °C, respectively. The GC temperature program began at 60 °C for 4 min, increased to 300 °C at 8 °C/min, and finally held for at 300 °C for 5 min. Electron impact ionization (−70 eV) was used, with an acquisition rate of 20 spectra/s in the MS setting. MS detection was performed by electrospray ionization (ESI) in full-scan mode and the range of mass/charge (m/z) values was 50–800.
Statistical Analysis
SIMCA-P 14.0 (Umetrics, Umea, Sweden) was used for statistical analysis. Unsupervised principal component analysis (PCA), supervised partial least squares discriminant analysis (PLS–DA), and orthogonal projections to latent structures discriminant analysis (OPLS–DA) were conducted to further discriminate between the control group and LPS-treated group. The model was further validated by permutation testing (200 permutations). SPSS 17.0 (SPSS Inc, Chicago, IL, USA) was used to conduct two-tailed Student’s t-tests. Variable importance in projection (VIP) values >1.0 and calculated p-values <0.05 were considered significant. MetaboAnalyst 4.0 (http://www.metaboanalyst.ca) and the Kyoto Encyclopedia of Genes and Genomes (KEGG; http://www.kegg.jp) were used for pathway analysis, and Raw p<0.5, impact >0 were defined as significant. Venn diagram analysis was performed using the free OmicShare online platform (http://www.omicshare.com/tools).
Results
GC–MS Chromatography of Serum and Tissue Samples
Chromatograms of the quality control (QC) serum and tissue samples (liver, kidney, hippocampus, and heart) all presented strong signals for analysis. Representative GC–MS total ion chromatograms (TICs) of serum, liver tissue, kidney tissue, hippocampal tissue, and heart tissue are presented in Figure 1.
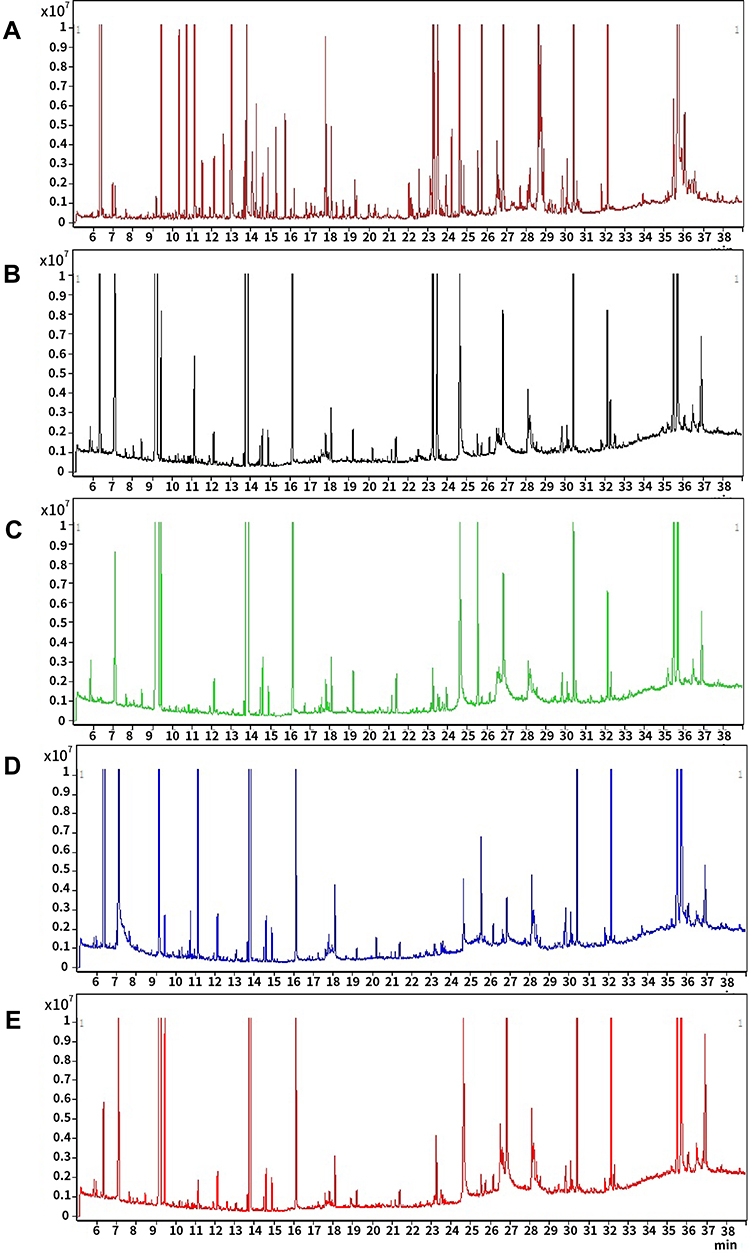 |
Figure 1 Representative gas chromatography–mass spectrometry (GC–MS) total ion chromatograms (TICs) of quality control (QC) serum (A), liver tissue (B), kidney tissue (C), hippocampal tissue (D), and heart tissue (E). |
Multivariate Statistical Analysis of the Metabolomic Data
Our statistical analysis showed efficient modeling that clearly separated the LPS treatment group and control group (serum: R2X=0.593, R2Y=0.981,Q2=0.958; liver tissue: R2X=0.95, R2Y=0.8,Q2=0.43; kidney tissue: R2X=0.976, R2Y=0.967,Q2=0.842; hippocampal tissue: R2X=0.996, R2Y=0.998,Q2=0.941; and heart tissue: R2X=0.992, R2Y=0.997,Q2=0.975). For each parameter, a value close to 1.0 represents a stable model with predictive reliability. Statistical validation using permutation tests to evaluate the significance of the OPLS–DA models revealed no evidence of over-fitting, as the blue regression lines of theQ2-points intersected the vertical axis (on the left) below zero, as highlighted in Figure 2.
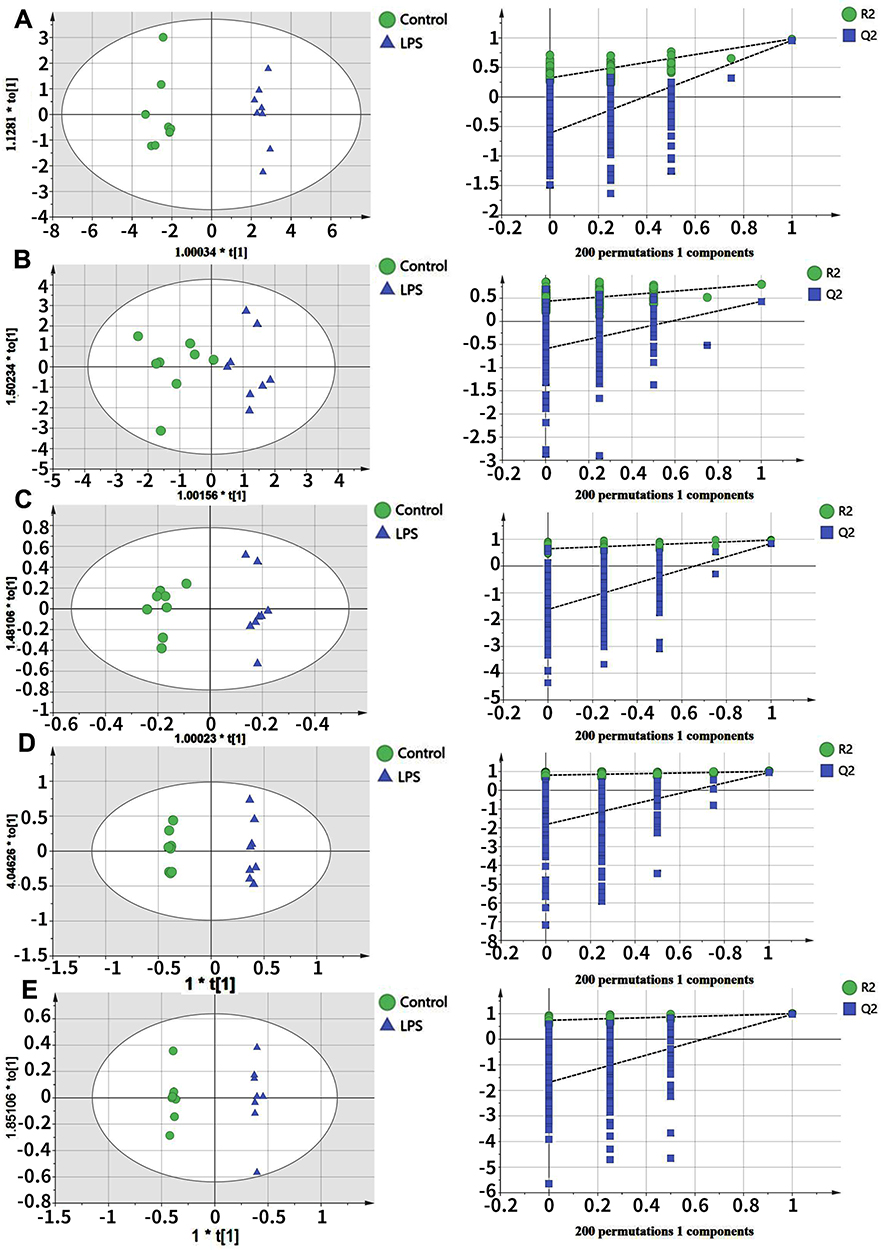 |
Figure 2 Orthogonal projections to the latent structures (OPLS) scores and 200 permutation tests for the OPLS–DA (discriminant analysis) models: serum (A), liver tissue (B), kidney tissue (C), hippocampal tissue (D), and heart tissue (E). |
Identification of Potential Biomarkers
Compared with healthy controls, the OPLS–DA data, along with VIP (VIP >1), and p-values arising from the t-tests (p<0.05), indicated that the LPS group showed significantly altered serum levels of 1-monopalmitin, 3-methyl-1-pentanol, 9-hexadecenoic acid, D-glucose, D-lactic acid, glycine, halostachine, L-5-oxoproline, L-alanine, L-glutamic acid, L-isoleucine, L-leucine, L-methionine, L-proline, L-serine, L-threonine, L-tryptophan, L-tyrosine, L-valine, mannobiose, oleamide, palmitic acid, stearic acid, and urea. In the liver, meanwhile, LPS exposure led to altered levels of 1-monopalmitin, 9-hexadecenoic acid, acetamide, cholesterol, D-glucose, D-lactic acid, MG(0:0/18:0/0:0), L-alanine, L-threonine, mannobiose, palmitic acid, stearic acid, and urea. In the kidney, LPS treatment induced alterations in the levels of cholesterol, D-glucose, D-lactic acid, glycerol, glycine, L-alanine L-threonine, myo-inositol, palmitic acid, stearic acid, and urea. In the heart, there was a marked change in the concentrations of 1-monopalmitin, 3-methyl-1-pentanol, cholesterol, D-lactic acid, glycerol, MG(0:0/18:0/0:0), L-alanine, L-valine, palmitic acid, phenol, propanoic acid, and stearic acid. Finally, in the hippocampus, LPS treatment led to changes in the levels of 1-monopalmitin, cholesterol, D-lactic acid, L-valine, myo-inositol, palmitic acid, and stearic acid. These metabolic changes are presented in Table 1, while the relative distribution of each biomarker in each tissue is further highlighted in Figure 3.
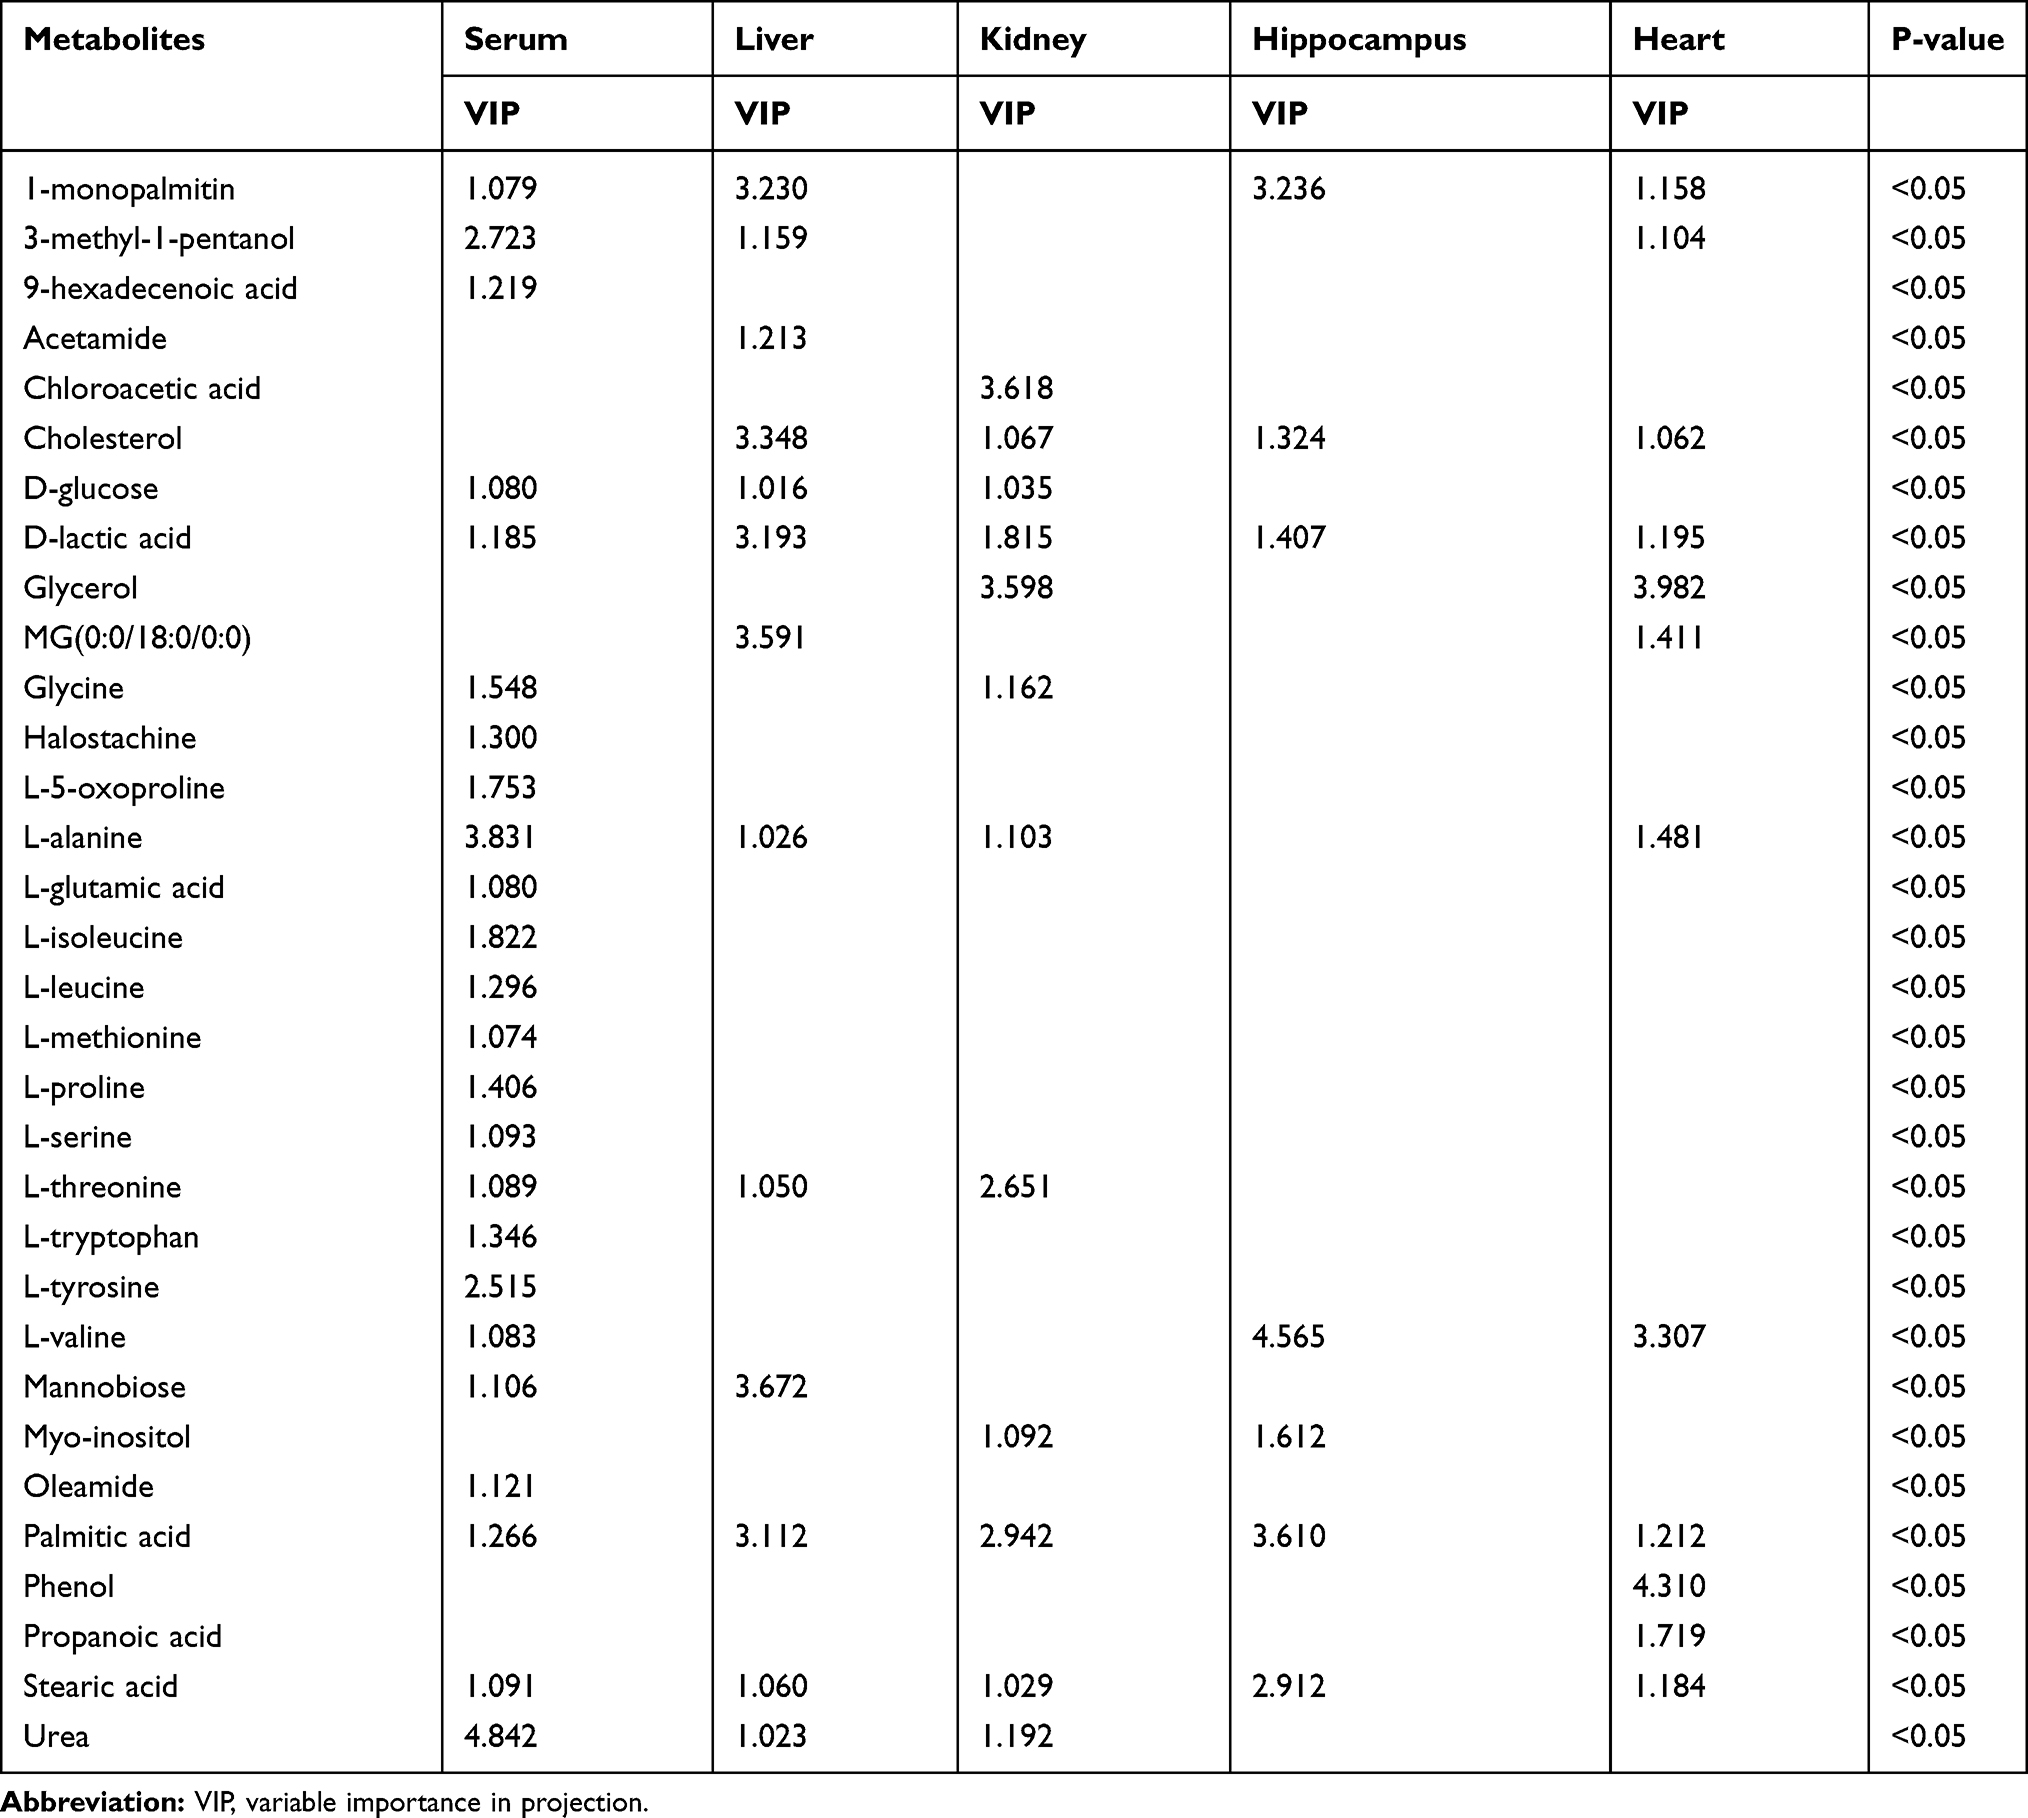 |
Table 1 List of Altered Metabolites in Serum, Liver, Kidney, Hippocampus, and Heart Following Lipopolysaccharide Treatment |
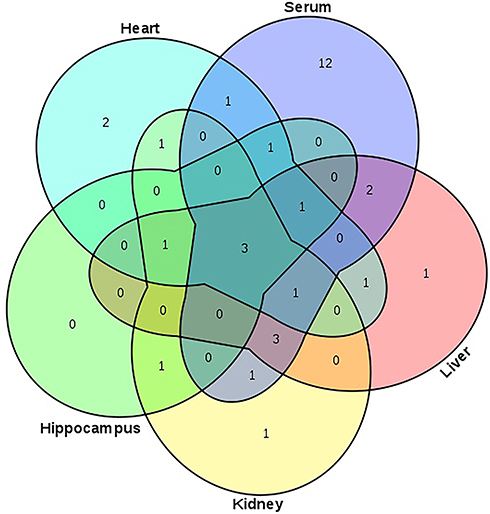 |
Figure 3 Venn diagram presenting the distribution of metabolites in serum, liver, kidney, hippocampus, and heart between the control and LPS groups. Note: The numbers in the Figure represent the same metabolites among different matrices (serum, liver, kidney, hippocampus, or heart). |
Analyses of Metabolic Pathways
Several pathways were identified as showing significant changes following LPS treatment (for which Raw p<0.5, Impact >0) (Table 2). In serum, the pathways were as follows: aminoacyl-tRNA biosynthesis; glutathione metabolism; glyoxylate and dicarboxylate metabolism; glycine, serine, and threonine metabolism; and arginine biosynthesis. Bile acid biosynthesis displayed significant changes in the liver, kidney, heart, and hippocampal tissues. In addition, significant changes in glycerolipid metabolism were also identified in the heart and kidney. The pathway analysis is summarized in Table 2 and highlighted in Figure 4. In addition, each pathway flowchart can be found in Kyoto Encyclopedia of Genes and Genomes (KEGG; http://www.kegg.jp).
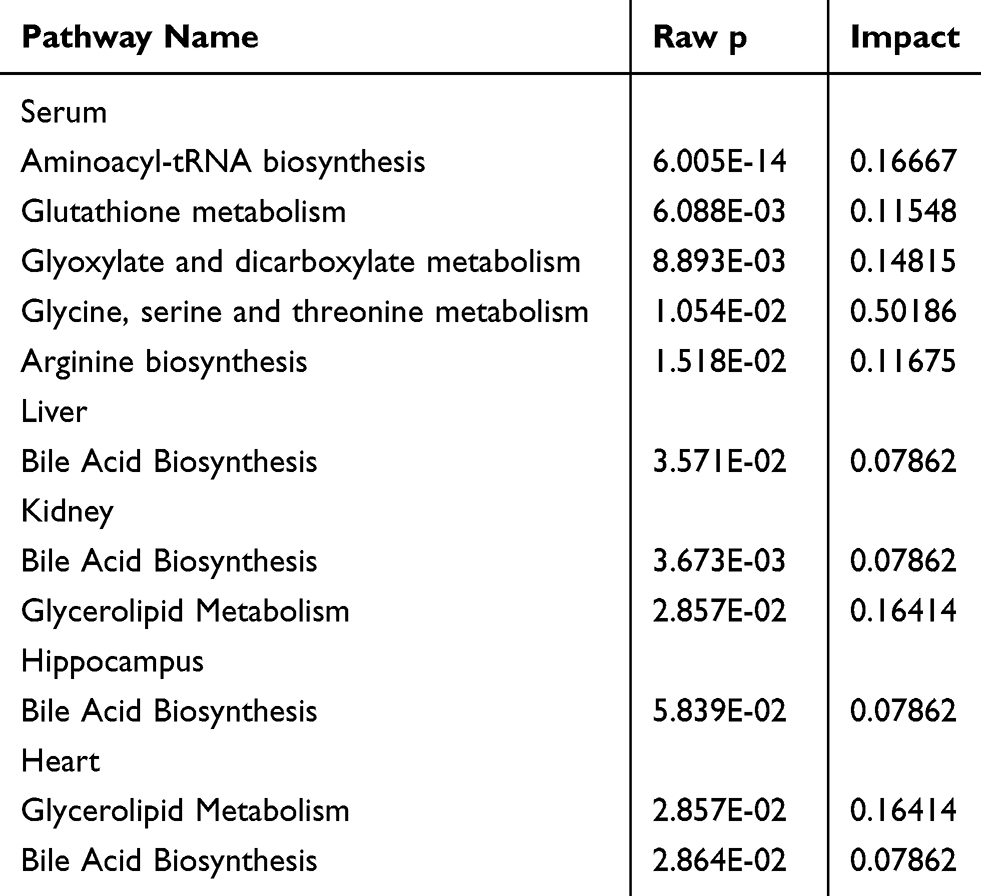 |
Table 2 Pathway Analysis Performed Using MetaboAnalyst 4.0 Software |
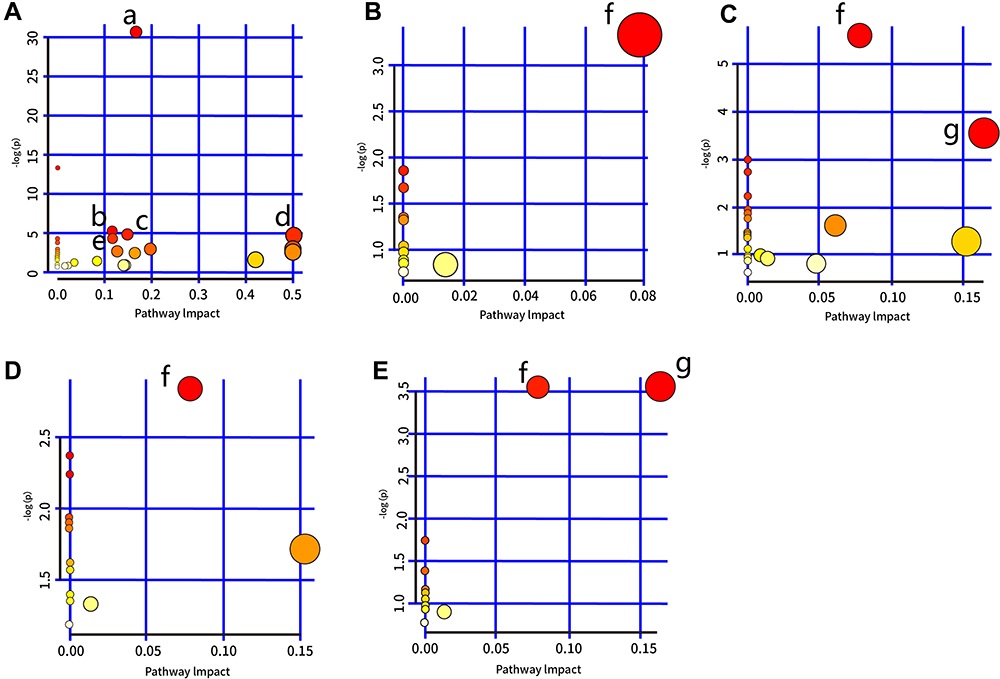 |
Figure 4 Summary of pathway analysis performed using MetaboAnalyst 4.0. (A) Serum: a) aminoacyl-tRNA biosynthesis; b) glutathione metabolism; c) glyoxylate and dicarboxylate metabolism; d) glycine, serine, and threonine metabolism; e) arginine biosynthesis. (B) Liver tissue: f) bile acid biosynthesis. (C) Kidney tissue: f) bile acid biosynthesis and g) glycerolipid metabolism. (D) Hippocampus: f) bile acid biosynthesis. (E) Heart tissue: f) bile acid biosynthesis and g) glycerolipid metabolism. |
Discussion
LPS is an efficient and strong inducer of proinflammatory cytokines such as tumor necrosis factor (TNF), interleukin 1 beta (IL-1β), IL-6, and C-reactive protein (CRP).16 Increasing evidence supports that the pathophysiological demonstrations of LPS exposure can include depression and sepsis, acute liver, kidney, and heart injury, as well as other inflammatory response.17–20 Although the mechanisms underlying LPS-induced inflammatory responses have been widely investigated, such as, inflammatory cytokine disturbances,21 inflammatory cytokine disturbances7 and genetic variability in toll-like receptor 4 (TLR4)-mediated LPS responses,22,23 an extensive metabolomic characterization of the response to LPS is still lacking.
To the best of our knowledge, this is the first metabolomics study to describe the systemic metabolic alterations occurring in several key target tissues (serum, liver, kidney, hippocampus, and heart) following LPS treatment. Our study revealed that 24, 13, 12, 7, and 12 metabolites were differentially expressed between the LPS treatment group and the control group in the serum, liver, kidney, heart, and hippocampus, respectively. Meanwhile, a Venn diagram was drawn to demonstrate the distribution of each biomarker in each tissue. Additionally, pathway mapping was performed using MetaboAnalyst based on KEGG. We found that these metabolic changes were mainly associated with aminoacyl-tRNA biosynthesis; glutathione metabolism; glyoxylate and dicarboxylate metabolism; glycine, serine, and threonine metabolism; arginine biosynthesis; bile acid biosynthesis; and glycerolipid metabolism. Importantly, the results of the combined metabolic and pathway analysis may provide significant new insights into the pathophysiological mechanisms underlying LPS-induced inflammatory responses.
The roles of amino acids as important substrates and regulators in numerous metabolic pathways and have been widely investigated.24–26 In this study, the metabolites that showed statistically significant changes between the LPS treatment group and the control group included glycine, L-5-oxoproline, L-alanine, L-glutamic acid, L-isoleucine, L-leucine, L-methionine, L-proline, L-serine, L-threonine, L-tryptophan, L-tyrosine, and L-valine (Figure 4), and were mainly involved in glycine metabolism, serine and threonine metabolism, and arginine biosynthesis. Glycine, a simple amino acid, is associated with the production of DNA, phospholipids, collagen, and energy release, and has been demonstrated to reduce mortality and liver or kidney injury in LPS-induced models.27 The decreased levels of glycine in the serum and kidney of LPS-treated rats compared with those of the control group, as measured by GC–MS, may indicate that LPS exposure provoked a severe systemic impairment. L-glutamic acid, also known as glutamate, is an important molecule in cellular metabolism and a precursor of glutathione (GSH), an important natural antioxidant.28 In our study, the serum level of L-glutamic acid was decreased in LPS-treated rats, which was consistent with the results of our previous study.5 These results suggested that the changes in L-glutamic acid levels may have been due to an impaired antioxidant response in the LPS treatment group. L-leucine, L-isoleucine, and L-valine are branched-chain amino acids (BCAAs) with important roles in stress, inflammation, energy generation, and muscle metabolism.29,30 Alterations in L-leucine, L-isoleucine, and L-valine levels have been confirmed in first-episode psychosis and depression.31 The current study also suggested that aberrant changes in L-leucine, L-isoleucine, and L-valine levels are linked to LPS-induced inflammation. Collectively, the altered amino acid levels observed in the serum, liver, kidney, heart, and hippocampal tissues of the LPS-treated rats may help elucidate the pathogenesis of LPS-induced inflammation.
Lipid metabolism is known to play an important role in inflammation and immune responses.32,33 This may explain why, in our study, the levels of 9-hexadecenoic acid, cholesterol, glycerol, MG(0:0/18:0/0:0), oleamide, palmitic acid, and stearic acid were significantly altered in the LPS treatment group compared with the control group, as measured by GC–MS, and were associated with bile acid biosynthesis and glycerolipid metabolism. Several studies have shown that neuroinflammation in brain disorders is often associated with elevated myo-inositol levels;34–37 here, we found that myo-inositol levels were increased in kidney and hippocampal tissue derived from the LPS-treated rats.
Increased levels of free fatty acids will eventually shift energy metabolism from D-glucose to lipids via the beta-oxidation of fatty acids with the help of acetamide. The altered levels of acetamide, propanoic acid, and chloroacetic acid found in our study are indicative of glyoxylate and dicarboxylate metabolism. These findings may contribute greatly to the treatment of LPS-induced SIRS.
Further studies are needed to further define the inflammatory mechanisms associated with LPS exposure, as our work had several limitations. We used only a single metabolomics approach based on GC–MS, and multi-omics or other technologies (eg, LC–MS) are required to confirm our findings. Additionally, how LPS affects other organs, such as the lung and spleen, must be elucidated for a complete understanding of the mechanisms involved in LPS-induced SIRS.
Conclusion
In our study, GC–MS-based profiling was applied to comprehensively evaluate the metabolic alterations occurring in LPS-induced SIRS in key target tissues (serum, liver, kidney, hippocampus, and heart). We presented a systematic view of the metabolic changes that occur between in LPS-treated rats compared with control animals, and showed that these alterations were associated with amino acids, lipids, and energy metabolism. Collectively, our data systematically provide new insights into LPS-induced SIRS for the first time, and may assist in better understanding the inflammatory mechanisms associated with LPS exposure. The etiology of LPS-induced SIRS is multifactorial and complex, and additional metabolic-based experiments involving humans, animals, and cells are needed for a complete understanding of LPS-induced SIRS.
Data Sharing Statement
The datasets used and analyzed during the current study are available from the corresponding author on reasonable request.
Disclosure
All authors declare no conflicts of interest in the work.
References
1. Guha M, Mackman N. LPS induction of gene expression in human monocytes. Cell Signal. 2001;13(2):85–94. doi:10.1016/S0898-6568(00)00149-2
2. Qin L, Wu X, Block ML, Liu Y, Crews FT. Systemic LPS causes chronic neuroinflammation and progressive neurodegeneration. Glia. 2007;55(5):453–462. doi:10.1002/glia.20467
3. Baranova IN, Souza AC, Bocharov AV, et al. Human SR-BI and SR-BII potentiate lipopolysaccharide-induced inflammation and acute liver and kidney injury in mice. J Immunol. 2016;196(7):3135–3147. doi:10.4049/jimmunol.1501709
4. Tian G, Li C, Zhai Y, et al. GC-MS based metabolomic profiling of lung tissue couple with network pharmacology revealed the possible protection mechanism of Pudilan Xiaoyan Oral Liquid in LPS-induced lung injury of mice. Biomed Pharmacother. 2020;124:109833. doi:10.1016/j.biopha.2020.109833
5. Geng C, Guo Y, Qiao Y, et al. UPLC-Q-TOF-MS profiling of the hippocampus reveals metabolite biomarkers for the impact of Dl-3-n-butylphthalide on the lipopolysaccharide-induced rat model of depression. Neuropsychiatr Dis Treat. 2019;15:1939–1950.
6. Hritcu L, Gorgan LD. Intranigral lipopolysaccharide induced anxiety and depression by altered BDNF mRNA expression in rat hippocampus. Prog Neuropsychopharmacol Biol Psychiatry. 2014;51:126–132. doi:10.1016/j.pnpbp.2014.01.016
7. Anderson ST, Commins S, Moynagh PN, Coogan AN. Lipopolysaccharide-induced sepsis induces long-lasting affective changes in the mouse. Brain Behav Immun. 2015;43:98–109. doi:10.1016/j.bbi.2014.07.007
8. Frolkis I, Klein Y, Locker C, et al. Vipera aspis venom reduces lethality and down-regulates tumor necrosis factor-α in a rat model of LPS-induced sepsis. Cytokine. 2010;49(3):319–324. doi:10.1016/j.cyto.2009.11.019
9. Singh S, Chatterji T, Sen M, et al. Serum procalcitonin levels in combination with (1)H NMR spectroscopy: A rapid indicator for differentiation of urosepsis. Clin Chim Acta. 2016;453:205–214. doi:10.1016/j.cca.2015.12.021
10. Stringer KA, McKay RT, Karnovsky A, Quémerais B, Lacy P. Metabolomics and its application to acute lung diseases. Front Immunol. 2016;7:44. doi:10.3389/fimmu.2016.00044
11. Stringer KA, Serkova NJ, Karnovsky A, Guire K, Paine R
12. Zhao LK, Zhao YB, Yu PC, Zhang PX. Metabolomics approach based on ultra-performance liquid chromatography coupled to mass spectrometry with chemometrics methods for high-throughput analysis of metabolite biomarkers to explore the abnormal metabolic pathways associated with myocardial dysfunction. Biomed Chromatogr. 2020;34(8):e4847.
13. Nicholson JK, Lindon JC. Systems biology: metabonomics. Nature. 2008;455(7216):1054–1056. doi:10.1038/4551054a
14. Wu Y, Fu Y, Rao C, et al. Metabolomic analysis reveals metabolic disturbances in the prefrontal cortex of the lipopolysaccharide-induced mouse model of depression. Behav Brain Res. 2016;308:115–127. doi:10.1016/j.bbr.2016.04.032
15. Piirsalu M, Taalberg E, Lillevali K, Tian L, Zilmer M, Vasar E. Treatment with lipopolysaccharide induces distinct changes in metabolite profile and body weight in 129Sv and Bl6 mouse strains. Front Pharmacol. 2020;11:371. doi:10.3389/fphar.2020.00371
16. Kessler SM, Laggai S, Barghash A, et al. IMP2/p62 induces genomic instability and an aggressive hepatocellular carcinoma phenotype. Cell Death Dis. 2015;6(10):e1894. doi:10.1038/cddis.2015.241
17. Agostini A, Yuchun D, Li B, Kendall DA, Pardon MC. Sex-specific hippocampal metabolic signatures at the onset of systemic inflammation with lipopolysaccharide in the APPswe/PS1dE9 mouse model of Alzheimer’s disease. Brain Behav Immun. 2020;83:87–111. doi:10.1016/j.bbi.2019.09.019
18. Cui F, Zhu P, Ji J, et al. Gas chromatography-mass spectrometry metabolomic study of lipopolysaccharides toxicity on rat basophilic leukemia cells. Chem Biol Interact. 2018;281:81–88. doi:10.1016/j.cbi.2017.12.008
19. Khajevand-Khazaei MR, Azimi S, Sedighnejad L, et al. S-allyl cysteine protects against lipopolysaccharide-induced acute kidney injury in the C57BL/6 mouse strain: involvement of oxidative stress and inflammation. Int Immunopharmacol. 2019;69:19–26. doi:10.1016/j.intimp.2019.01.026
20. Ping F, Guo Y, Cao Y, et al. Metabolomics analysis of the renal cortex in rats with acute kidney injury induced by sepsis. Front Mol Biosci. 2019;6:152. doi:10.3389/fmolb.2019.00152
21. Dowlati Y, Herrmann N, Swardfager W, et al. A meta-analysis of cytokines in major depression. Biol Psychiatry. 2010;67(5):446–457. doi:10.1016/j.biopsych.2009.09.033
22. Zhang J, Yang J, Xu X, et al. The influence of genetic polymorphisms in TLR4 and TIRAP, and their expression levels in peripheral blood, on susceptibility to sepsis. Exp Ther Med. 2016;11(1):131–139. doi:10.3892/etm.2015.2884
23. Noreen M, Shah MA, Mall SM, et al. TLR4 polymorphisms and disease susceptibility. Inflamm Res. 2012;61(3):177–188. doi:10.1007/s00011-011-0427-1
24. Tsukano K, Suzuki K. Plasma amino acid abnormalities in calves with diarrhea. J Vet Med Sci. 2019;81(4):517–521. doi:10.1292/jvms.18-0645
25. de Koning TJ. Amino acid synthesis deficiencies. J Inherit Metab Dis. 2017;40(4):609–620. doi:10.1007/s10545-017-0063-1
26. Roth E, Druml W. Plasma amino acid imbalance: dangerous in chronic diseases? Curr Opin Clini Nutr Metab Care. 2011;14(1):67–74. doi:10.1097/MCO.0b013e328341368c
27. Huang N, Wang Y, Zhan G, et al. Contribution of skeletal muscular glycine to rapid antidepressant effects of ketamine in an inflammation-induced mouse model of depression. Psychopharmacology. 2019;236(12):3513–3523. doi:10.1007/s00213-019-05319-8
28. Petroff OAC. GABA and glutamate in the human brain. Neuroscientist. 2003;8(6):562–573. doi:10.1177/1073858402238515
29. Sperringer JE, Addington A, Hutson SM. Branched-chain amino acids and brain metabolism. Neurochem Res. 2017;42(6):1697–1709. doi:10.1007/s11064-017-2261-5
30. White PJ, Newgard CB. Branched-chain amino acids in disease. Science. 2019;363(6427):582–583. doi:10.1126/science.aav0558
31. Leppik L, Kriisa K, Koido K, et al. Profiling of amino acids and their derivatives biogenic amines before and after antipsychotic treatment in first-episode psychosis. Front. Psychiatry. 2018;2018(9):155. doi:10.3389/fpsyt.2018.00155
32. Glass CK, Olefsky JM. Inflammation and lipid signaling in the etiology of insulin resistance. Cell Metab. 2012;15(5):635–645. doi:10.1016/j.cmet.2012.04.001
33. Buckley CD, Gilroy DW, Serhan CN. Proresolving lipid mediators and mechanisms in the resolution of acute inflammation. Immunity. 2014;40(3):315–327. doi:10.1016/j.immuni.2014.02.009
34. Li M, Li C, Yu H, et al. Lentivirus-mediated interleukin-1beta (IL-1beta) knock-down in the hippocampus alleviates lipopolysaccharide (LPS)-induced memory deficits and anxiety- and depression-like behaviors in mice. J Neuroinflammation. 2017;14(1):190. doi:10.1186/s12974-017-0964-9
35. Orio L, Alen F, Pavon FJ, Serrano A, Garcia-Bueno B. Oleoylethanolamide, neuroinflammation, and alcohol abuse. Front Mol Neurosci. 2018;11:490. doi:10.3389/fnmol.2018.00490
36. Glass CK, Saijo K, Winner B, Marchetto MC, Gage FH. Mechanisms underlying inflammation in neurodegeneration. Cell. 2010;140(6):918–934. doi:10.1016/j.cell.2010.02.016
37. Wu WB, Huang WC. Therapeutic strategies against inflammation-related diseases: molecular mechanisms and clinical applications. Biomed Res Int. 2015;2015:382730. doi:10.1155/2015/382730
 © 2020 The Author(s). This work is published and licensed by Dove Medical Press Limited. The
full terms of this license are available at https://www.dovepress.com/terms
and incorporate the Creative Commons Attribution
- Non Commercial (unported, 3.0) License.
By accessing the work you hereby accept the Terms. Non-commercial uses of the work are permitted
without any further permission from Dove Medical Press Limited, provided the work is properly
attributed. For permission for commercial use of this work, please see paragraphs 4.2 and 5 of our Terms.
© 2020 The Author(s). This work is published and licensed by Dove Medical Press Limited. The
full terms of this license are available at https://www.dovepress.com/terms
and incorporate the Creative Commons Attribution
- Non Commercial (unported, 3.0) License.
By accessing the work you hereby accept the Terms. Non-commercial uses of the work are permitted
without any further permission from Dove Medical Press Limited, provided the work is properly
attributed. For permission for commercial use of this work, please see paragraphs 4.2 and 5 of our Terms.