Back to Journals » Cancer Management and Research » Volume 12
Comprehensive Characterization of Stage IIIA Non-Small Cell Lung Carcinoma
Authors Singh N, Mishra A ![]() , Sahu DK, Jain M
, Sahu DK, Jain M ![]() , Shyam H
, Shyam H ![]() , Tripathi RK, Shankar P, Kumar A
, Tripathi RK, Shankar P, Kumar A ![]() , Alam N, Jaiswal R, Kumar S
, Alam N, Jaiswal R, Kumar S
Received 4 September 2020
Accepted for publication 16 October 2020
Published 20 November 2020 Volume 2020:12 Pages 11973—11988
DOI https://doi.org/10.2147/CMAR.S279974
Checked for plagiarism Yes
Review by Single anonymous peer review
Peer reviewer comments 2
Editor who approved publication: Dr Eileen O'Reilly
Neetu Singh,1,* Archana Mishra,2,* Dinesh Kumar Sahu,1,* Mayank Jain,1,* Hari Shyam,1,* Ratnesh Kumar Tripathi,1 Pratap Shankar,1 Anil Kumar,1 Nawazish Alam,1 Riddhi Jaiswal,3 Shailendra Kumar2
1Department of Centre for Advanced Research, King George’s Medical University, Lucknow, 226003, India; 2Department of Surgery, King George’s Medical University, Lucknow 226003, India; 3Department of Pathology, King George’s Medical University, Lucknow 226003, India
*These authors contributed equally to this work
Correspondence: Neetu Singh
Department of Centre for Advanced Research, King George’s Medical University, Lucknow 226003, India
Tel +91-9984801444
Fax +91-522-2257439
Email [email protected]
Shailendra Kumar
Department of Surgery, King George’s Medical University, Lucknow 226 003, India
Tel +91-8707001450
Fax +91-522-2257439
Email [email protected]
Introduction: Heterogeneity of non-small cell lung carcinoma (NSCLC) among patients is currently not well studied. Pathologic markers and staging systems have not been a precise predictor of the prognosis of an individual patient. Hence, we hypothesize to develop a transcript-based signature to categorize stage IIIA-NSCLC in lung adenocarcinoma (LUAD) and lung squamous cell carcinoma (LUSC), plus identify markers that could indicate the prognosis of the disease.
Methods: Human Transcriptome Array 2.0 (HTA) and NanoString nCounter® platform were used for high-throughput gene-expression profiling. Initially, we profiled stage IIIA-NSCLC through HTA and validated through NanoString. Additionally, two metastatic markers SPP1 and CDH2 were validated in 47 NSCLC stage IIIA samples through real-time PCR.
Results: We observed distinct gene clusters in LUAD and LUSC with down-regulation of six genes and up-regulation of 57 genes through HTA. Ninety-six transcripts were randomly selected after analyzing HTA data and validated on the NanoString platform. We found 40 differentially expressed transcripts that categorized NSCLC into LUAD and LUSC. SPP1 is significantly overexpressed (4.311± 1.27 fold in LUAD and 13.41± 3.82 fold in LUSC compared to control), and the CDH2 transcript was significantly overexpressed (11.53 ± 4.027-fold compared to control) only in LUSC.
Discussion: These markers enable us to categorize stage IIIA NSCLC into LUAD and LUSC plus these markers may be helpful to understand the pathophysiology of NSCLC. However, more data required to make these findings useful in general clinical practice.
Keywords: non-small cell lung cancer, lung adenocarcinoma, lung squamous cell carcinoma, human transcriptome array, NanoString
Introduction
Lung cancer is one of the leading cause of cancer-related death worldwide and Non-small cell lung cancer (NSCLC), a subtype of lung cancer accounts for nearly 80–85% of all cases of lung cancer.1 Surgical removal of the tumor is the current standard treatment strategy for stage IIIA NSCLC and observed that 30–75% of cases will be developed recurrence thus have poor prognosis.2 Additionally, 75–85% of non-small cell lung cancer (NSCLC) show primary lung malignancy, and 25% show the brain as one of the major sites of relapse.3
Although the pathologic staging system has been the standard for determining NSCLC prognosis. However, the current classification system is still not a precise predictor of the prognosis of an individual patient. Because patients with a similar pathological feature of NSCLC have differed in response to treatment, cancer recurrence, metastasis, or death after surgical resection. So, it is a need to identify the patients who are unlikely to respond to specific chemotherapy or at high risk of recurrence, etc., are the rationale for measuring specific molecular markers.
Thus, various studies have been done recently that focused on identifying molecular markers that influence the response to treatment, recurrence, and factors that can predict a benefit from adjuvant chemotherapy in poor prognosis. Recently, NSCLC has been molecularly divided into various subtypes and identifying marker genes for each subtype, which may help in the accurate classification that can help in the optimal treatment of NSCLC.4,5 Rosell et al provided a gene-expression-based signature that predicts metastasis at Stage IIIA NSCLC.6 More specifically, Grinberg-Rashi et al in 2009 reported three genes, which had a significant positive-predictive value for brain metastasis (CDH2, KIFC1, and FALZ).7
Now, if these markers show up early at Stage IIIA-NSCLC which does not invade other adjacent organs will be more informative for the clinician and can help in better management of the patient. So, the lack of consistent prognostic molecular markers for Stage IIIA-NSCLC led to attempts to identify gene-expression signatures through high-throughput gene-expression platforms that might be stronger than individual genes. Hence, we hypothesized to explore the differential expression of transcripts in Stage IIIA NSCLC Lung adenocarcinoma (LUAD) and Lung squamous cell carcinoma (LUSC), which may help to delineate phenotypic complexity and identify signature transcripts for LUAD and LUSC as well as markers which could assess the level of tumorigenesis/predict the tumor-cell invasion to different sites. Further, we correlate the identified signature transcript with the mutational status. Additionally, the identified differential-signature transcripts were also validated in the blood of the same patient to predict whether these signature transcripts express at the level of blood.
Materials and Methods
Patients Details and Sample Collection
Sequential patients seen at the Department of Thoracic and General Surgery, King George’s Medical University, Lucknow, India were evaluated for this study. The study has been approved by the Institutional Ethics Committee of King George’s Medical University, Lucknow, India, and patients informed written consent was collected before enrolment. Tumors were histopathologically categorized and only confirmed stage-IIIA NSCLC patient was included in this study. A total of 47 Stage IIIA-NSCLC patients and 30 benign/fibrotic cases were enrolled in this study (Supplementary Table 1). The staging was done by thorax CT scans of patients and categorized by histopathology for stage-IIIA NSCLC. As patients other than malignant disease undergo surgical therapy for a wide range of pathologies. Among them, the most common are post tubercular fibrocavitory lesions and congenital anomalies were considered for control of this study. The post-surgical tissue samples were collected in RNA later (Invitrogen, Massachusetts, USA) for RNA, and in an empty vial for DNA isolation. Peripheral blood was also collected from the same patients in sodium citrate vial immediately after resection and stored at −80 °C until extraction.
Total RNA Extraction
Total RNA was isolated from both tissue and blood using Trizol method as reported earlier8 and then RNA were treated with DNase (NEB, Ipswich, MA) for the removal of DNA contamination. RNA samples showing the clear separation of the 28S and 18S bands in a 1% denaturing gel and A260/A280 absorption ratios greater than 1.8 were further analyzed. The concentration of RNA was measured using the Qubit® RNA HS Assay Kit according to the manufacturer’s protocol (Invitrogen).9
Genomic DNA Extraction
Genomic DNA will be isolated from collected tissue samples using the Qiagen mini-DNA isolation Kit and stored at −20°C until further analysis. Quality and quantity of isolated genomic DNA will be performed through the Quawell spectrophotometer (Quawell Technology Inc., San Jose), agarose gel electrophoresis, and Qubit® DNA Assay Kit according to the manufacturer’s protocol (Invitrogen).
Human Transcriptome Array 2.0 Hybridization
We performed microarray assay on 10 NSCLC stage IIIA and 5 control samples to establish gene-expression profiles using GeneChip® Human Transcriptome Array 2.0 (HTA 2.0, Affymetrix, Santa Clara).10 We measured the RNA concentrations with the Qubit 3.0 Fluorometer (Invitrogen, USA). We processed 500ng RNA samples with the WT PLUS Reagent kit, followed by hybridization on the HTA 2.0 microarray chips. Finally, an array chips scan by GeneChip Scanner-7G (Affymetrix, CA, USA) and CEL files were generated. As per the Affymetrix instruction manual, we subjected the HTA 2.0 chip’s raw data to the quality control examination. Subsequently, quality checked CEL files were converted into.rma-gene-ful.chp and.rma-alt-splice-dabg.chp files through Affymetrix Expression Console™ Software (version 1.3). The data were further analyzed using the Transcriptome Analysis Console v3.0. After running ANOVA, a multi-testing correction was performed using the Benjamini-Hochberg step-up false discovery rate (FDR)-controlling procedure for all expressed genes and expressed probe selection regions (PSRs) and junctions (ie, expressed in at least one condition). By default, the alpha level was set as 0·05 in the FDR field.11 Expression Analysis Settings (Gene-Level Fold Change < −2 or > 2; Gene-Level P-value < 0·05; Splicing Index < −2 or > 2; Exon-Level P-value < 0·05; Anova Method: eBayes; A Probeset (Gene/Exon) is considered expressed if ≥50% samples have DABG values below DABG Threshold-DABG < 0·05; Event Algorithm Method: Both; Event Pointer P-value < 0·1; Event Score > 0·2)). All microarray data were submitted to NCBI GEO. The GEO submission number is GSE138682.
nCounter-Based Gene-Expression Validation
Probes were designed for 96 randomly selected transcripts from mRNA of Homo sapiens identified through differential transcripts of HTA Array2.0 and five housekeeping genes (ACTB, GAPDH, RPL19, TBP, TUBB) (Supplementary Table 2). A total of 26 stage IIIA-NSCLC tissue, blood, and four control RNA samples were used for NanoString analysis. NanoString gene-expression analysis was performed as previously done.10 In brief, hybridization of 100 ng of total RNA with customized reporter code set (for gene-transcript expression or gene fusion-transcript) and capture probe set was performed in a NanoString Prep Station (NanoString Technologies), and the mRNA molecules counted with the NanoString nCounter (NanoString Technologies). The nSolver™ Analysis Software 3.0 (NanoString Technologies) was used to perform data handling, including automated background subtraction, spike-in-control normalization, and reference gene normalization. Raw data were uploaded to nSolver-NanoString software and processed with default quality control settings, and ratios for the comparison of tumor samples and associated p-values were generated by the nSolver software. A heat map and scatterplot were generated in nSolver using normalized gene-expression values for 96 genes that were significantly different (p > 0·05).
Gene Expression Through Quantitative Real-Time PCR
For real-time PCR, 47 Stage IIIA-NSCLC (20 LUAD/27 LUSC) and 30 control RNA samples were analyzed. RNA isolation was done as reported earlier.12 The Ct value of investigated gene transcripts (SPP1, CDH2, and RIMS2) was measured on 7500 fast Dx Real-Time PCR instruments (Applied Bioscience inc.). Every gene was tested in triplicate for all RNA samples in a single run. β-actin was used as a reference to normalize the Ct value of the target.13 After normalization, the relative expression of each transcript was calculated using the Ct values of control tissue through the REST 2009 software (Qiagen).
Mutation Genotyping by Mass Array System
Mutation detection was performed in 18 LUAD and 20 LUSC stage IIIA NSCLC samples using the OncoFOCUS panel V1.0 (Includes various known hotspot mutations of EGFR, KRAS, NRAS, and BRAF) on the MassARRAY® System and Typer 4 software (Agena Bioscience, San Diego, CA, USA), which employs matrix-assisted laser desorption/ionization time-of-flight mass spectrometry for amplicon detection. Briefly, PCR reactions for 45 cycles were set-up containing Taq DNA polymerase (Agena Bioscience), genomic DNA (20 ng), PCR primers, and dNTP. Following the PCR reaction, SAP addition, and iPLEX Pro extension reaction, the samples were desalted by resin treatment for 15 min, spotted onto SpectroCHIP® Arrays (Agena Bioscience, San Diego, CA), analyzed by MassARRAY® System, and ultimately interpreted on SpectroTYPER v4.0 software (Agena Bioscience, San Diego, CA).
Results
Sample Classification
Out of 47 stage IIIA NSCLC patients (15 smoker and 32 non-smoker), 33 were male with mean age 51.15±7.1 (mean±SEM) and 14 were female with mean age 50.5±10.62 (mean±SEM). All the samples were analyzed for Histopathology and Immunohistochemistry. Those samples that were positive for Thyroid transcription factor-1 (TTF-1 nuclear) napsin-A (Naps cytoplasmic) were considered as lung adenocarcinoma (LUAD) whereas negative for TTF-1, Naps, and positive for P-40 (nuclear) as squamous cell carcinoma (LUSC) (Supplementary Figure 1A–I). Out of 47 stage IIIA NSCLC, we found 20 LUAD and 27 LUSC that were selected for further analysis (Supplementary Table 1).
Gene-Expression Profiling Based on Human Transcriptome Array Platform
For gene-expression profiling, six LUAD, four LUSC, and five control samples have been selected for Affymetrix GeneChip® Human Transcriptome Array 2.0 (HTA). HTA covers the entire transcriptome and accurately detects all known transcript isoforms produced by a gene. Sample-wise distinct clusters of control, LUAD, and LUSC were identified as represented in Figure 1A and B.
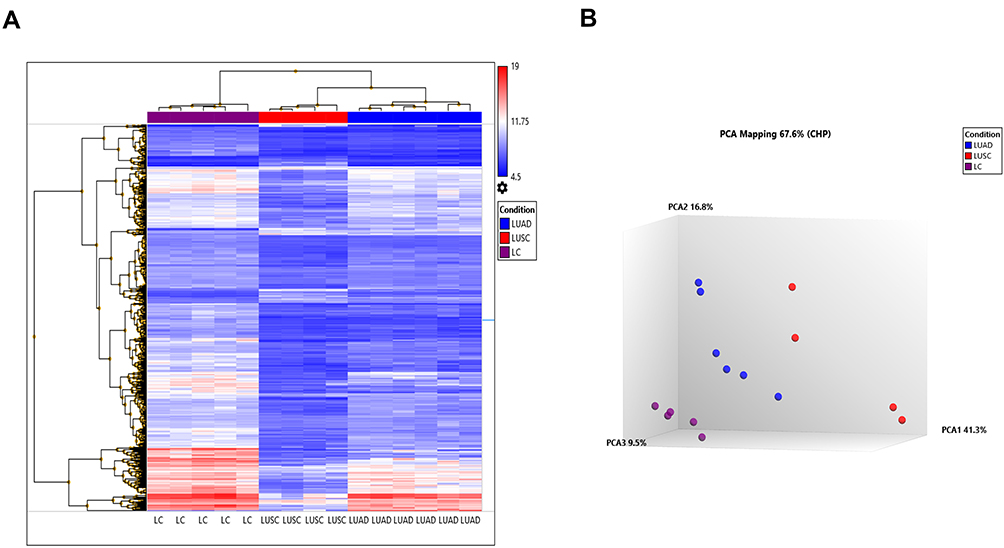 |
Figure 1 Gene-expression profiling of 10 NSCLC and five control samples on HTA 2.0 platform (A). Heat map created based on the expression patterns of each gene across tumor and control samples captured by HTA array and data were further analyzed using the Transcriptome Analysis Console v3.0. The samples were clustered into three subgroups from the normal counterparts by hierarchical clustering with the following expression analysis setting (log2 fold; Condition F-test p=<0.001; and condition FDR p=<0.001). (B) PCA plot between Cluster III (LC), Cluster II (LUAD), and Cluster I (LUSC). |
Differential Expression of Transcripts in LUAD, LUSC Compared to Control
While comparing LUAD and LUSC with control, differential expression of transcripts at a fold change of 10; P-val=<0·001 and FDR P-val=<0·001. Differential expression of transcript in LUAD showed the up-regulation of two coding transcripts (SPP1, CCNA2), and down-regulation of 73 coding transcripts (Supplementary Table 3). The differentially expressed transcripts between LUAD vs control were involved in 30 different pathways as depicted in (Table 1). Whereas, in LUSC, 12 coding transcripts (SYT14; KCNB2; SCG3; RIMS2; STXBP5L; ATAD2; CCNA2; PCLO; EPHA7; KIF11; TTK; GDAP1) were upregulated and 263 coding transcripts were downregulated (Supplementary Table 4). The differentially expressed transcripts between LUSC vs Control were involved in 35 different significant pathways (Table 2).
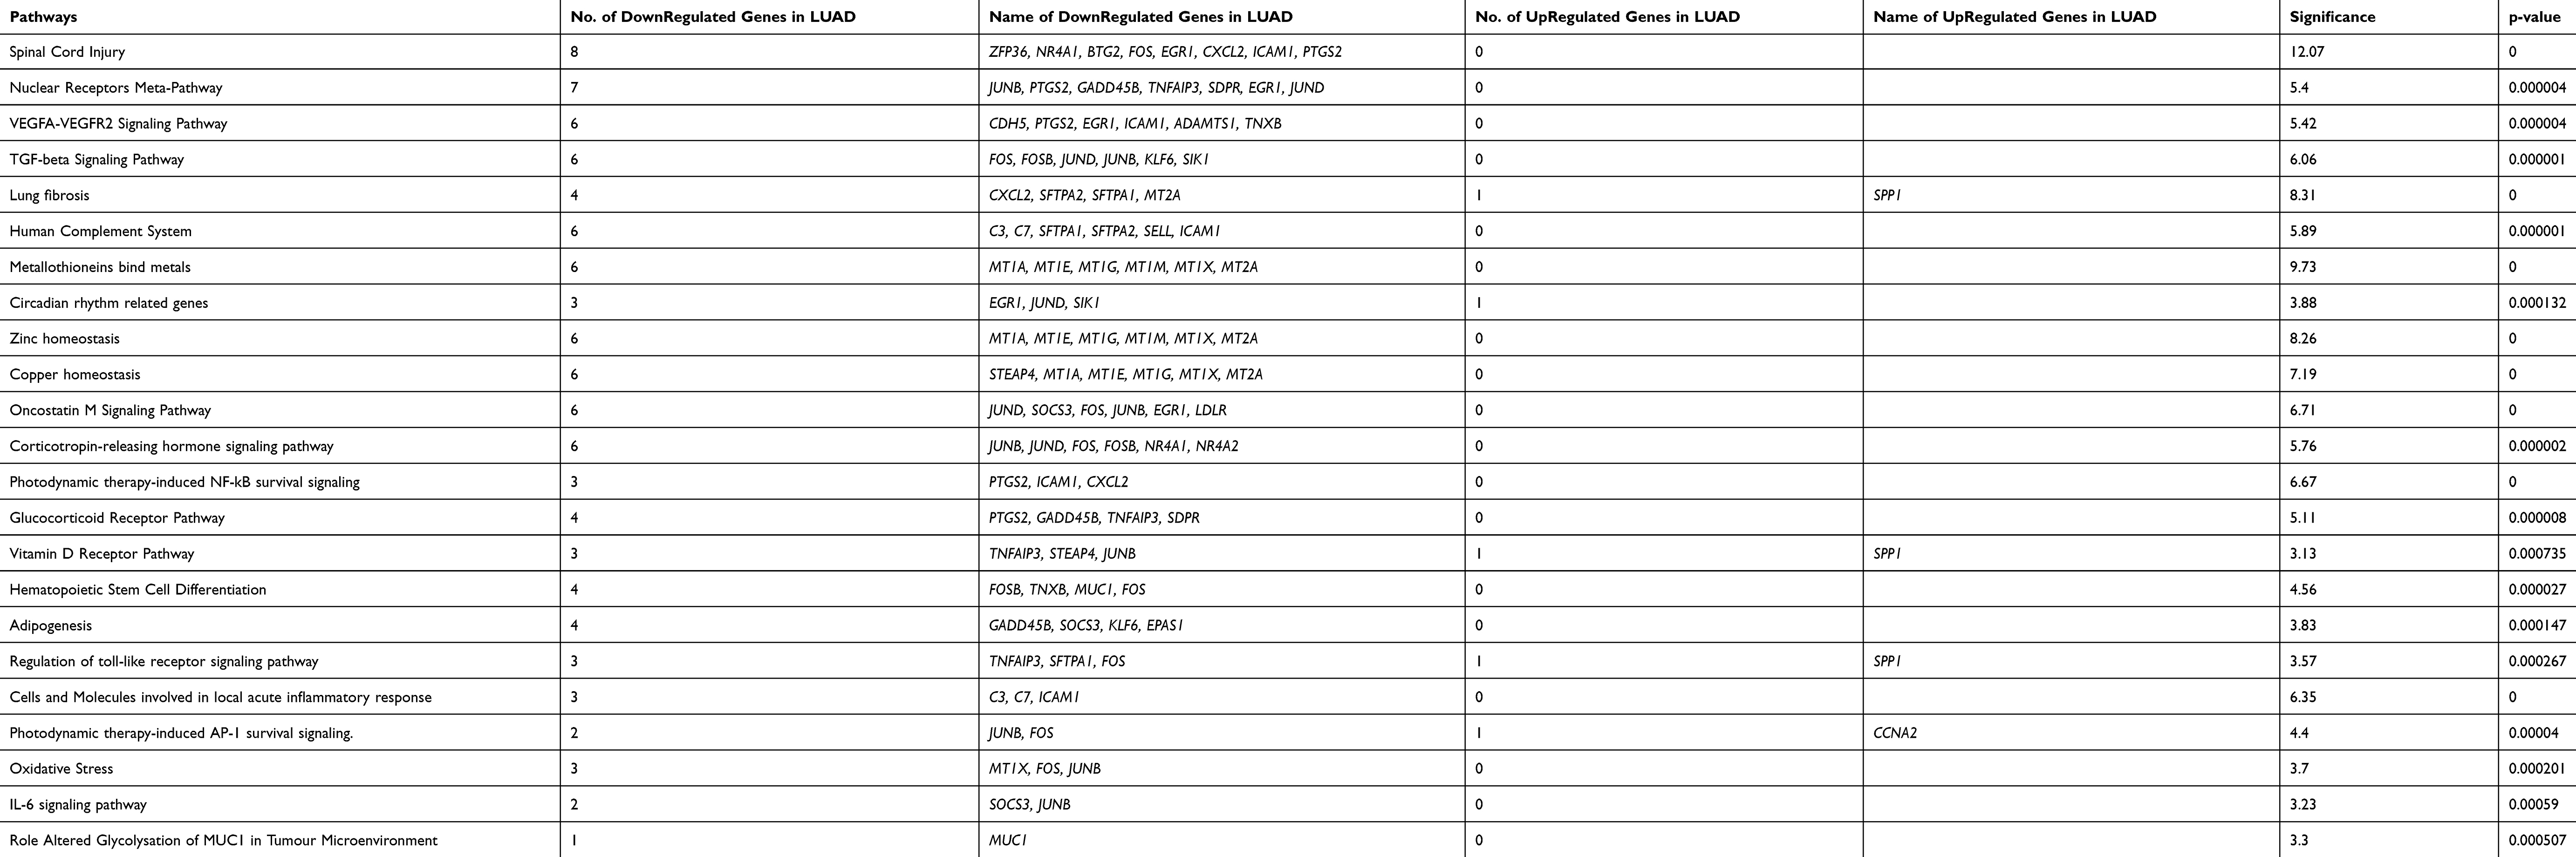 |
Table 1 Pathways Involved Due to Differentially Regulated Transcripts Between Control versus LUAD at a Significance Value of P=<0.001 |
 | 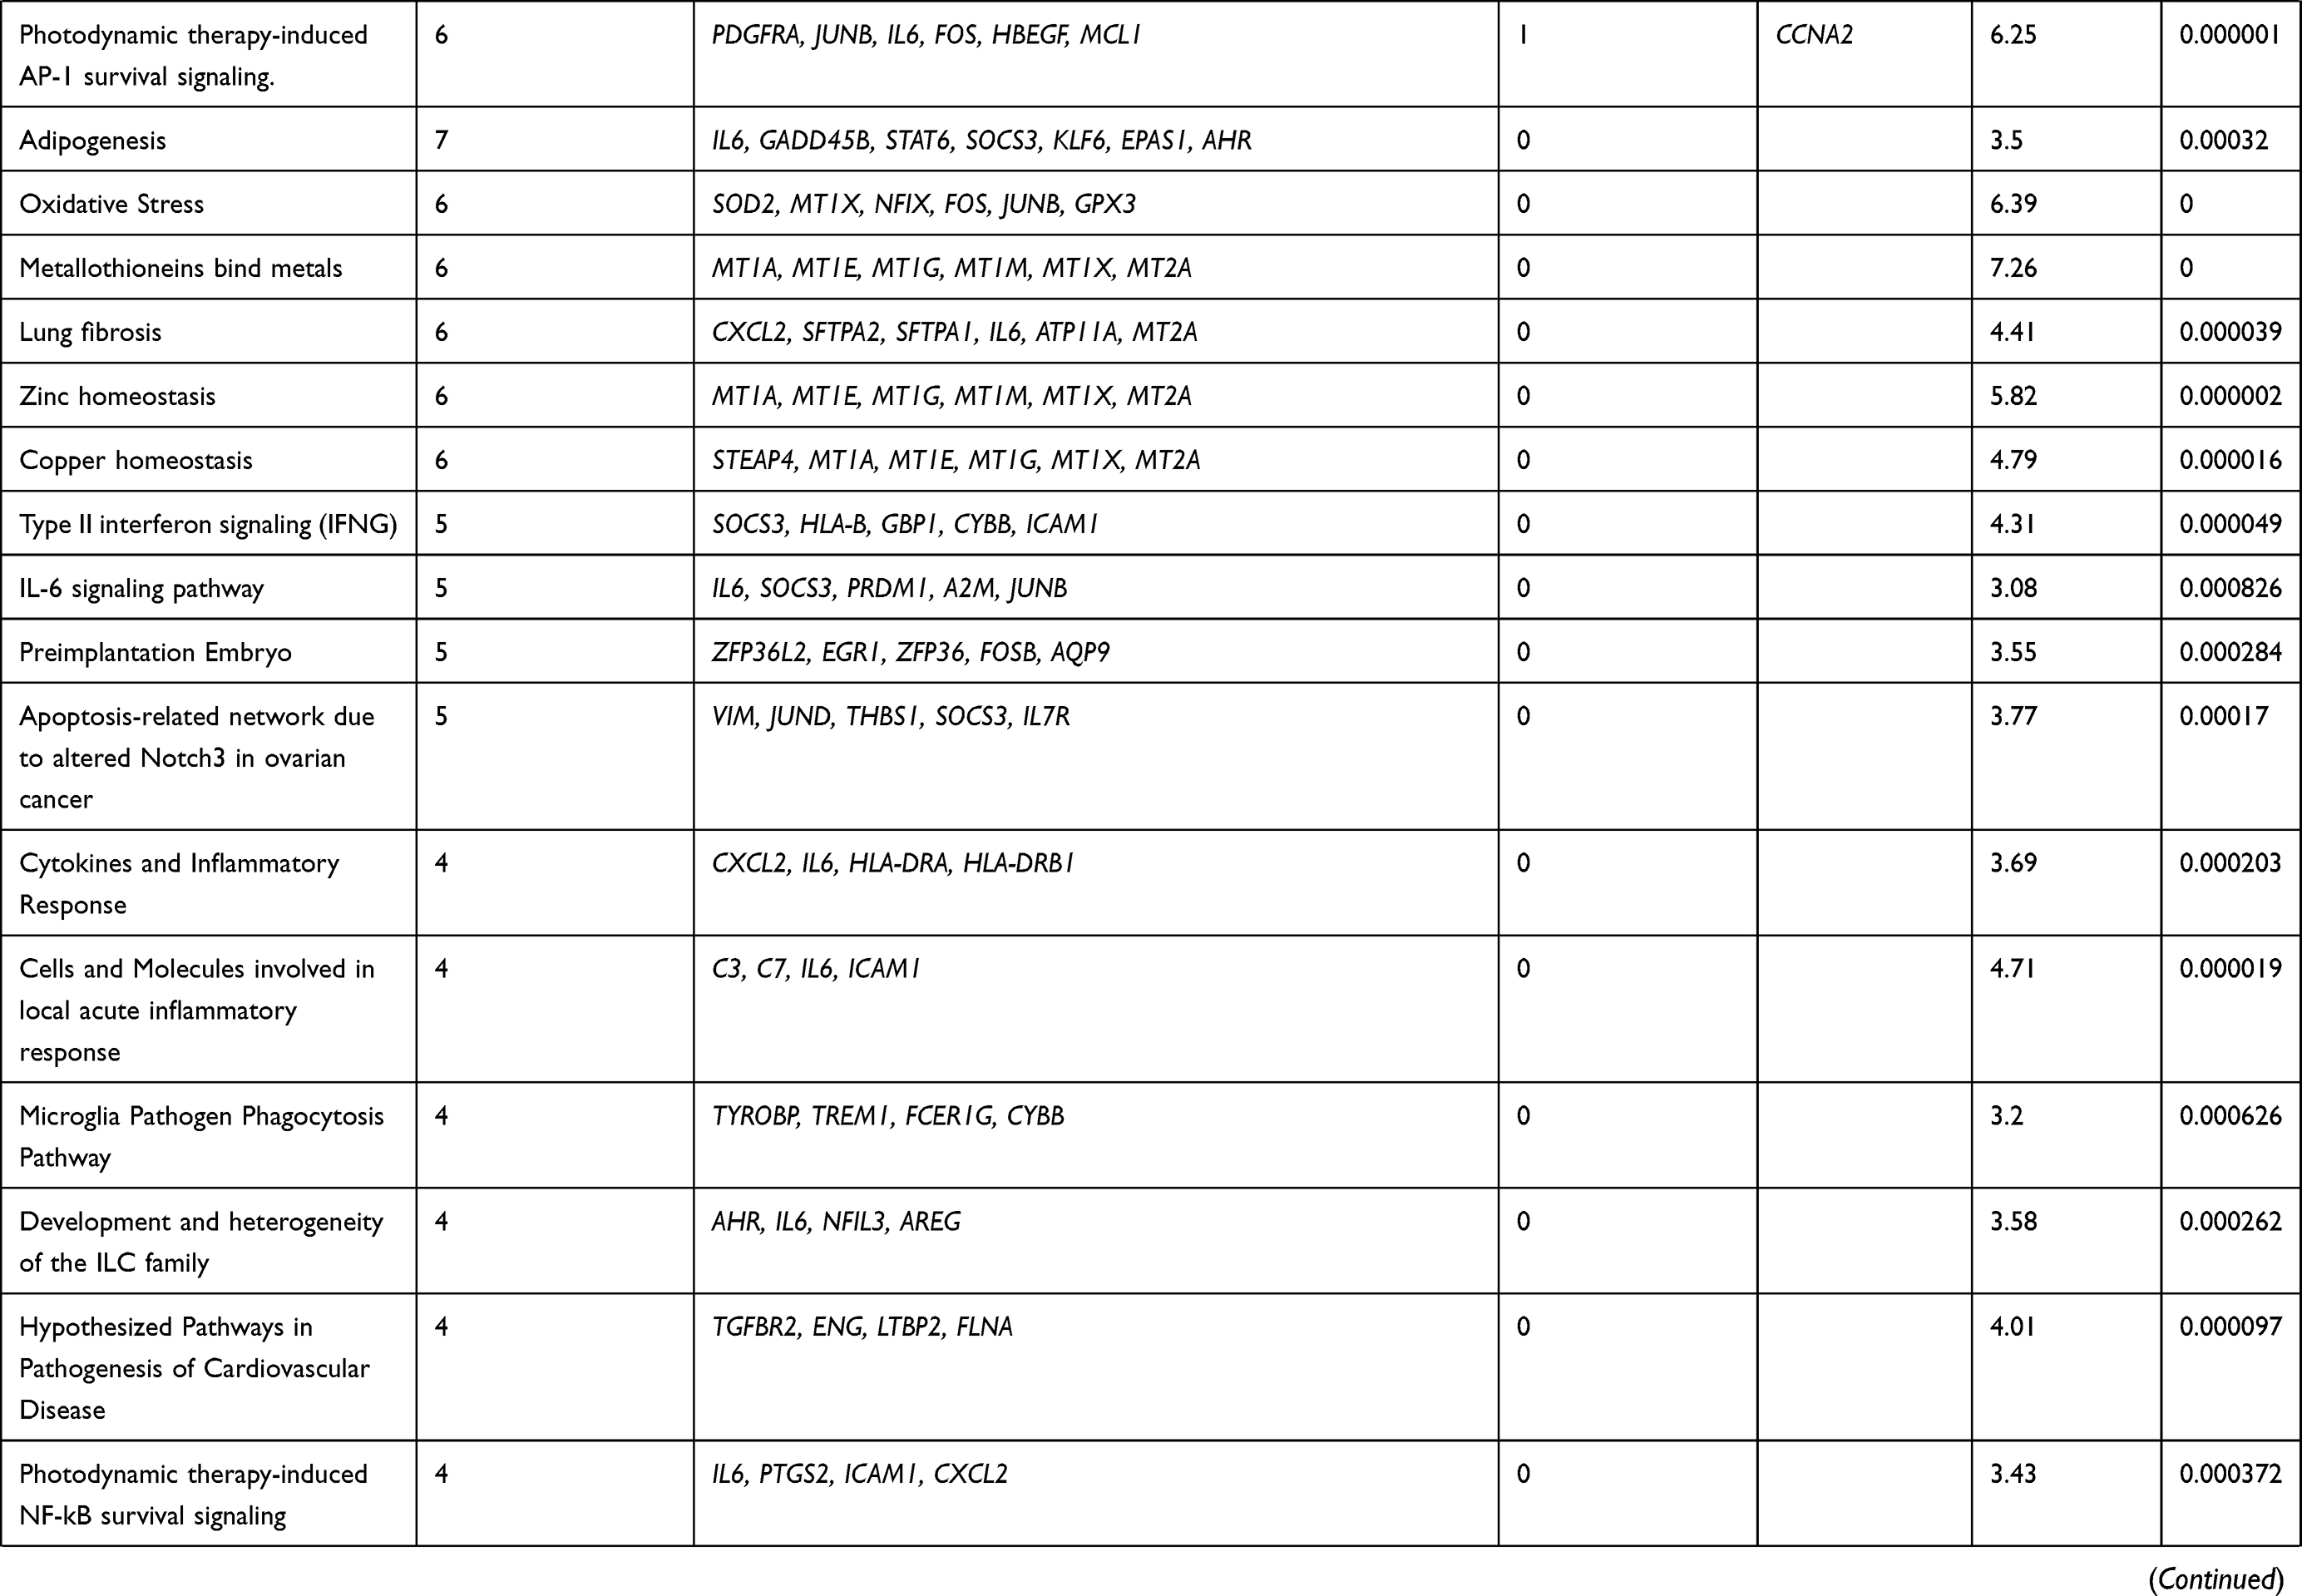 | 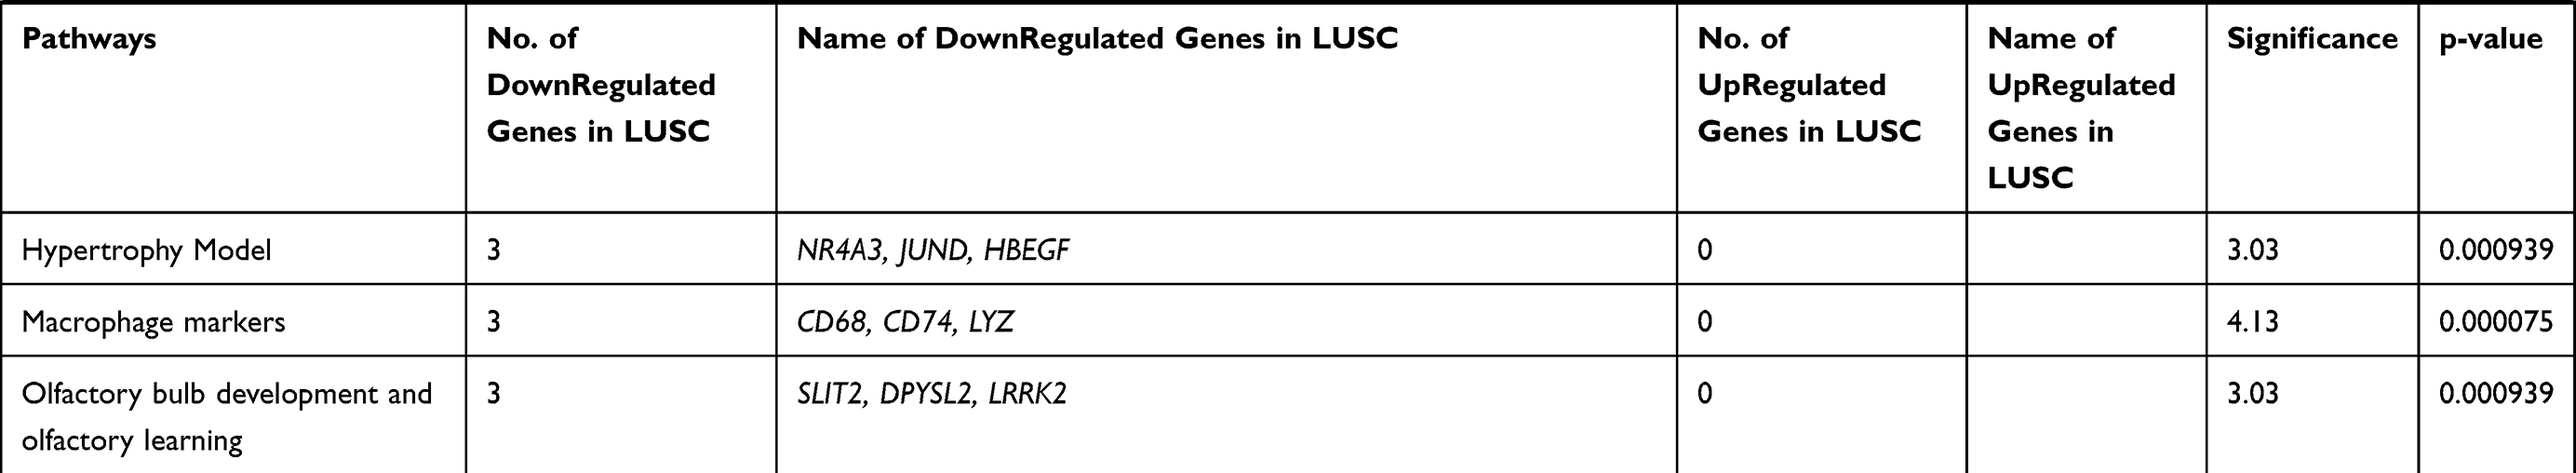 |
Table 2 Pathways Involved Due to Differentially Regulated Transcripts Between Control versus LUSC at Significance Value of P=<0.001 |
Differential Expression of Transcripts in LUAD Compared to LUSC
In the comparative analysis of LUAD with LUSC transcripts, we identified the up-regulation of 57 coding transcripts and down-regulation of 6 coding transcripts in LUAD (Supplementary Table 5). Most of the upregulated transcripts were involved in five pathways p=<0.001 (Table 3). We also analyzed the transcripts at the exonic level and observed that most of the upregulated transcripts belong to the Immune System pathways and the downregulated transcripts (RIMS2; ST18; KCNB2; INA; ICA1; SCG3) belongs to voltage-gated potassium channels in LUAD compare to LUSC (Supplementary Figure 2). We further analyzed the HTA data at fold change more than 2; P-val=<0.05 and FDR P-val=<0.05 (data not shown) and randomly picked 96 transcripts and validated on the NanoString nCounter platform.
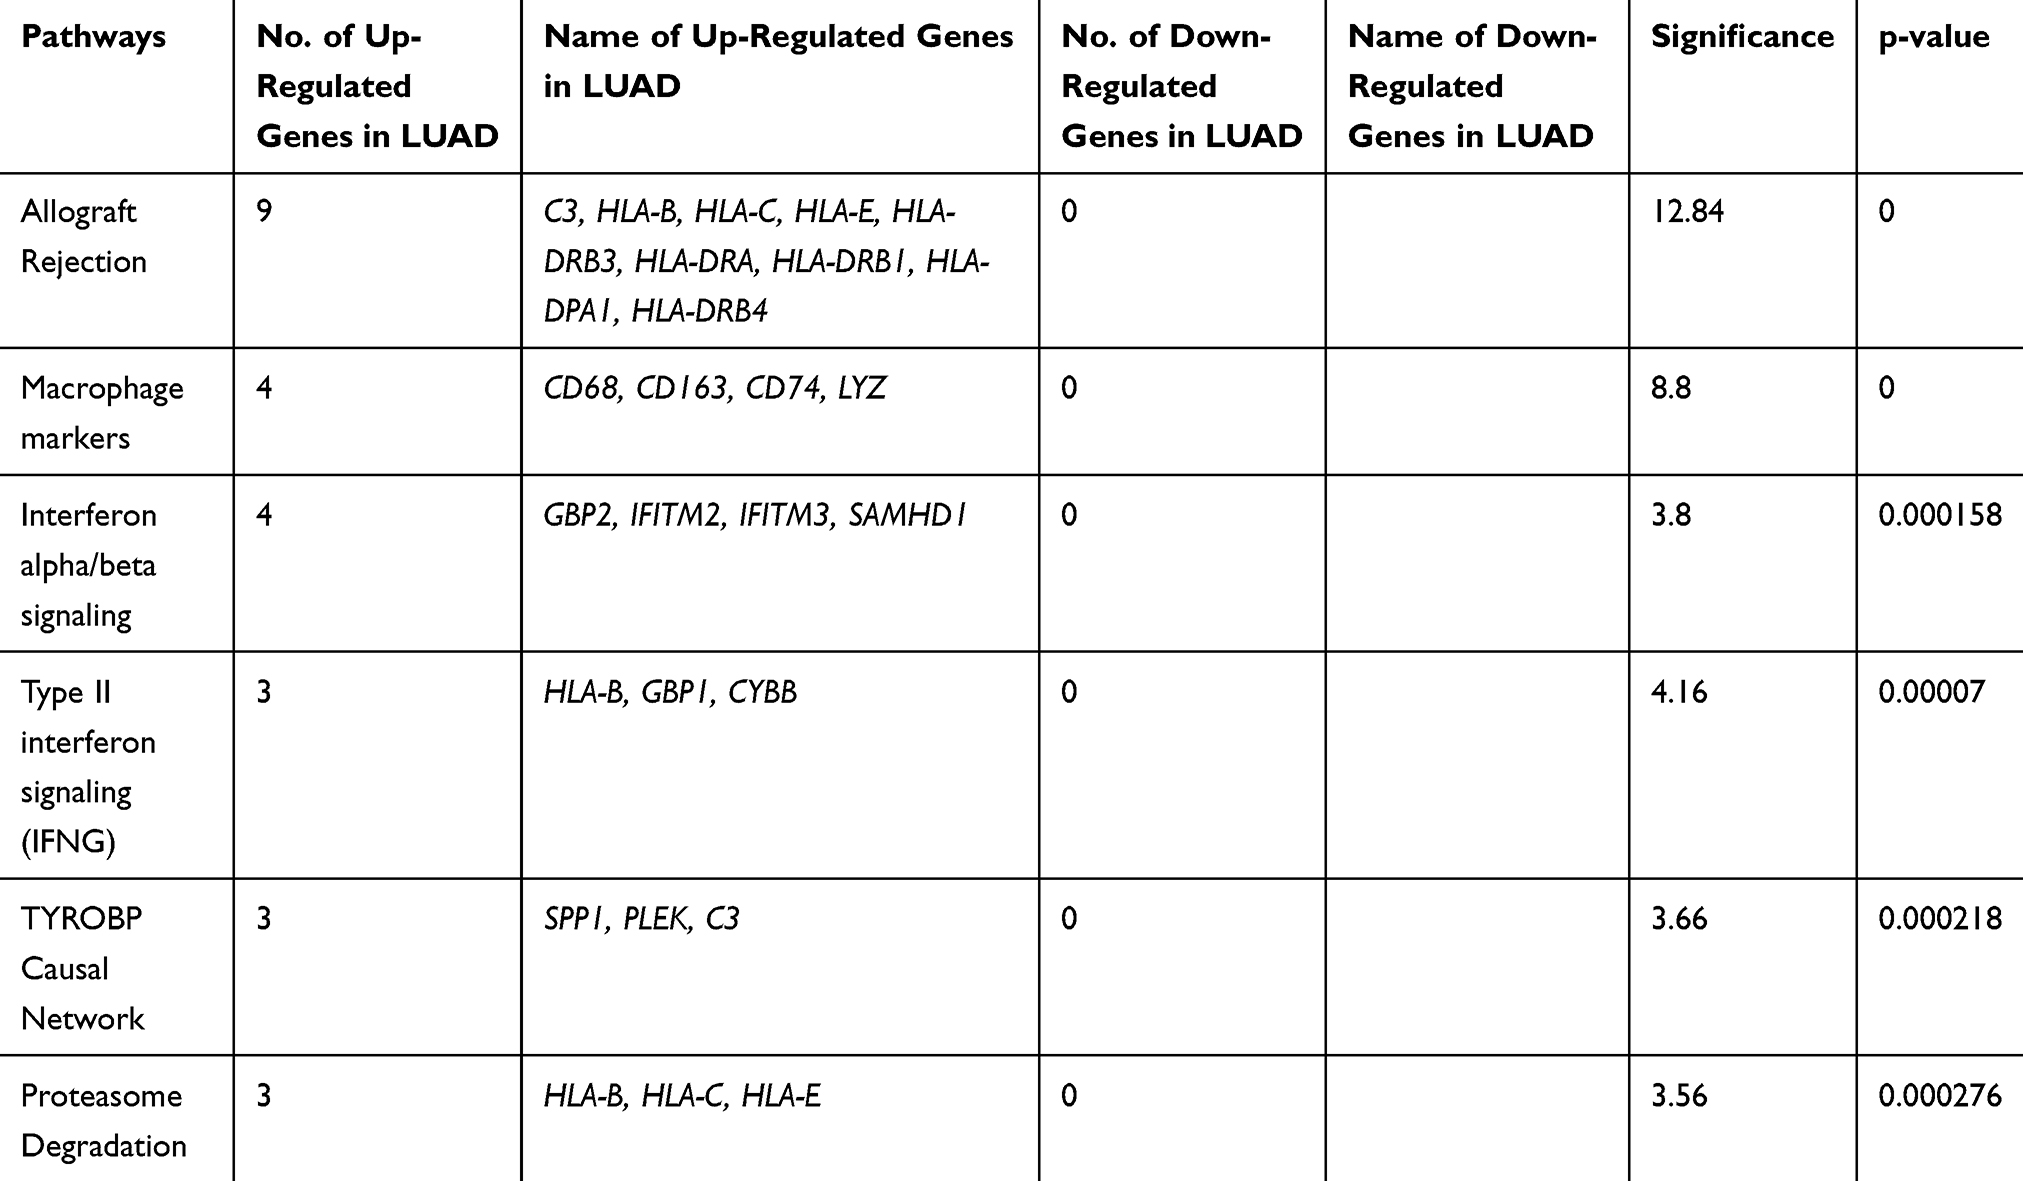 |
Table 3 Pathways Involved Due to Differentially Regulated Transcripts Between LUAD versus LUSC at a Significance Value of P=<0.001 |
Development of nCounter Platform for Validation of Significant Genes
The 96 transcripts were validated both in blood and tissue sample from the same patients to predict whether these signature transcripts can be identified in peripheral blood as a prognostic marker. Twenty-six NSCLC tissue and blood from the same patients have been analyzed on the NanoString platform. After analyzing the above data, we identified 40 transcripts were significantly validated from 96 transcripts (Figure 2A and B). Hence, a 40 gene panel could be considered for distinguishing LUAD and LUSC. Although, no significant cluster was observed in the blood of the same patients compared to lung control (Supplementary Figure 3). Out of 26, 13 histopathologically confirmed LUADs and 10 histopathologically approved LUSC samples were clustered transcriptionally in LUAD and LUSC group, respectively, while LT49 and LT15 histopathologically reported as LUSC transcriptionally clustered in LUAD. LT53 showed both adenosquamous profile. Specifically, six genes (NLGN1; ICA1; ZMAT4; ELOVL7; ST18; ADAM22) were downregulated, and 34 genes were upregulated in LUAD compared to LUSC tissue samples in 40 gene panel (Figure 2A and B). However, out of forty 10 transcripts A2M (24·7 fold up in LUAD); CCDC80 (15·6 fold up in LUAD); LCP1 (11·0 fold up in LUAD); SAMD9L (13·8 fold up in LUAD); HLA-DRB1 (28·5 fold up in LUAD); HLA-C (10·3 fold up in LUAD); CD44 (33·3 fold up in LUAD); LRP1 (10·7 fold up in LUAD) and ST18 (−10·9 fold down in LUAD), ICA1 (−10·75 fold down in LUAD) were validated at an exonic level including splicing index through HTA array2.0 data (Table 4).
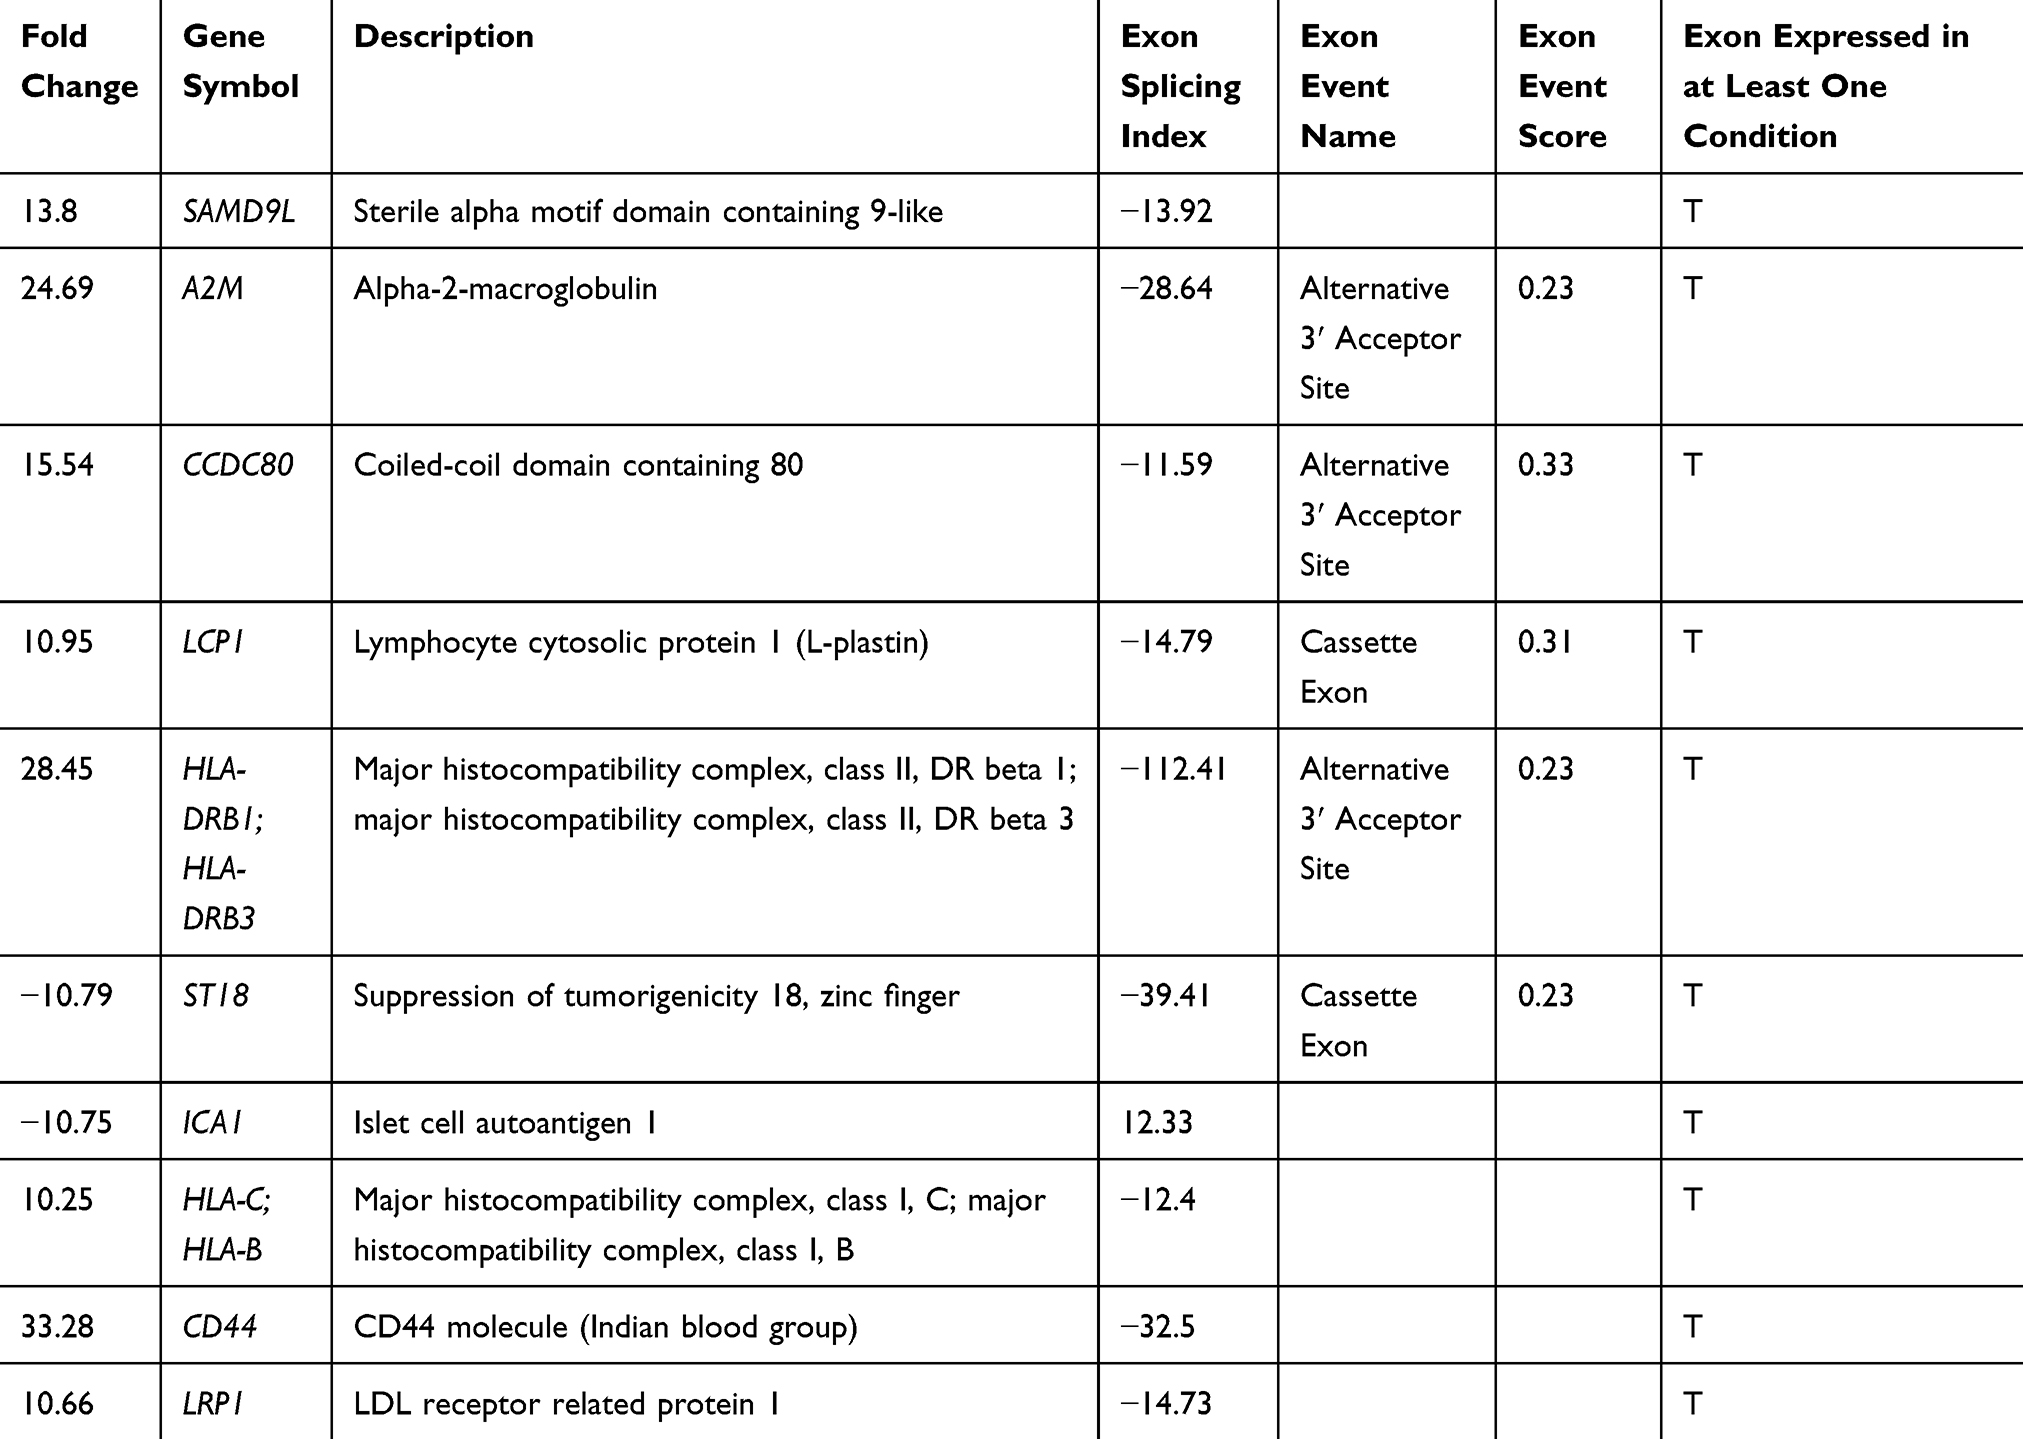 |
Table 4 Differential Splicing Index (SI>10) Based Fold Change (FC>10) of Transcripts Which Showed Differential Expression at Gene Level Both Through HTA 2.0 Array and NanoString-Based Approach in LUAD versus LUSC at Exonic at p and FDR p=0.001 |
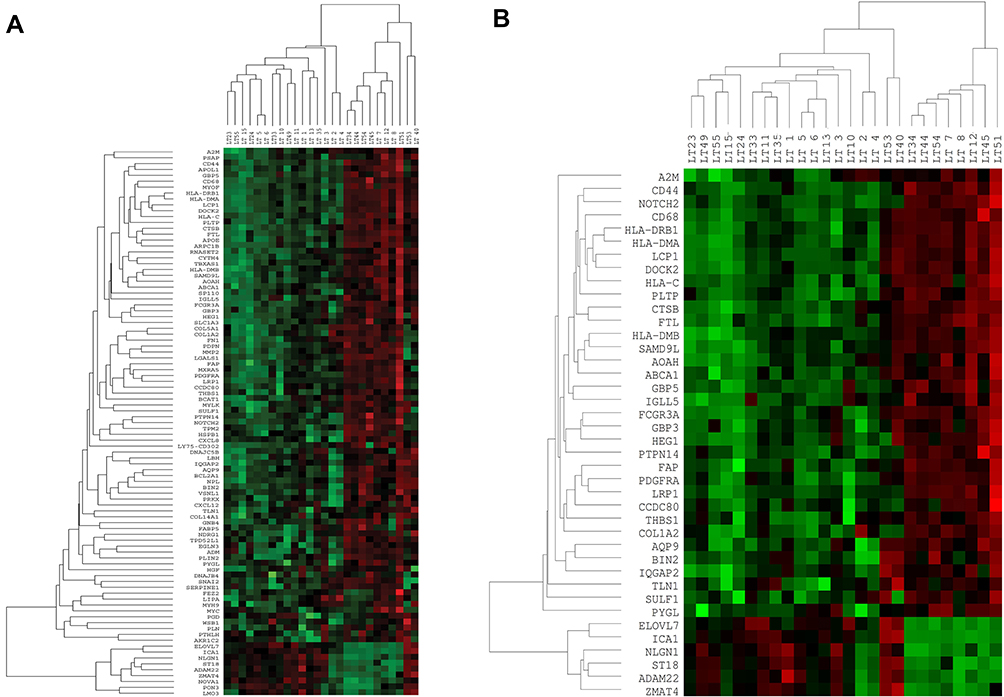 |
Figure 2 Gene-expression pattern by nCounter (NanoString) (A). Hierarchical clustering of 96 genes in total 26 Stage IIIA-NSCLC tissue and 4 benign/fibrotic (control) samples. Data normalization was performed using five housekeeping genes in 26 tumor samples. (B) Hierarchical clustering of 40 genes (Customized panel) in total 26 Stage IIIA-NSCLC tissue and 4 benign/fibrotic (control) samples. Data normalization was performed using five housekeeping genes in 26 tumor samples. |
Real-Time PCR-Based Validation of SPP1, CDH2, and RIMS2
Three significantly upregulated genes SPP1 in LUAD and CDH2 and RIMS2 in LUSC were observed in HTA data analysis. These genes may become potential markers for the understanding of disease progression. So, we were further validated in 20 LUAD/27 LUSC versus 30 control samples through Real-Time PCR using SYBR green. SPP1 is significantly overexpressed with 4.311±1.27 fold in LUAD and 13.41±3.82 fold in LUSC compared to control. CDH2 (11.53 ± 4.03 fold) and RIMS2 (24.79 ±9.043 fold) were significantly overexpressed only in LUSC (Figure 3).
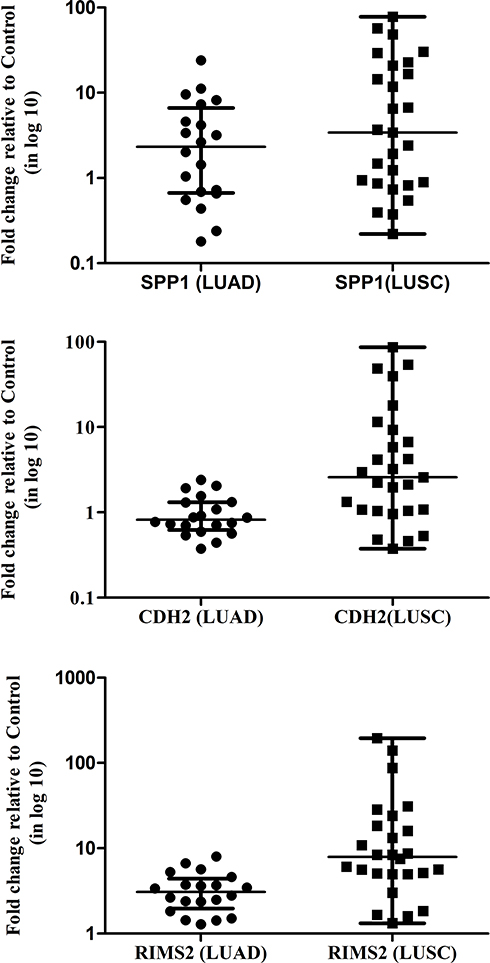 |
Figure 3 The expression of transcripts of SPP1, CDH2, and RIMS2 in NSCLC stage IIIA samples. β-Actin gene was used as the internal control. Data shown are the mean ± SEM of three independent experiments for each sample. |
Mutational Profile of NSCLC
Mutation genotyping has been done in 18 LUAD and 20 LUSC tissue samples using the Agena oncofous panel. Hot spot mutations of EGFR, KRAS, NRAS, and BRAF have been screened. KRAS is one of the most mutated genes in the RAS subfamily genes. Mutation in KRAS is responsible for various cancers such as colorectal cancer, pancreatic carcinoma, and lung carcinoma.14–16 We found pathogenic mutation A59T of KRAS in 61.11% of LUAD and 40% of LUSC and G12D & G12C of KRAS only in 5% of LUSC. Each non-pathogenic in-frame insertion of EGFR exon 20 H773>NPY, H773_V774insNPH, D770_N771insAPW, D770_N771insGL, D770_N771insGF, N771>GF and in-frame deletion of exon 19 E746_A750delELREA were observed in 5.55% LUAD. Whereas pathogenic mutation such as NRAS G13V was found in 5.55% of LUAD and BRAF L597V were found in 5% of LUSC (Table 5).
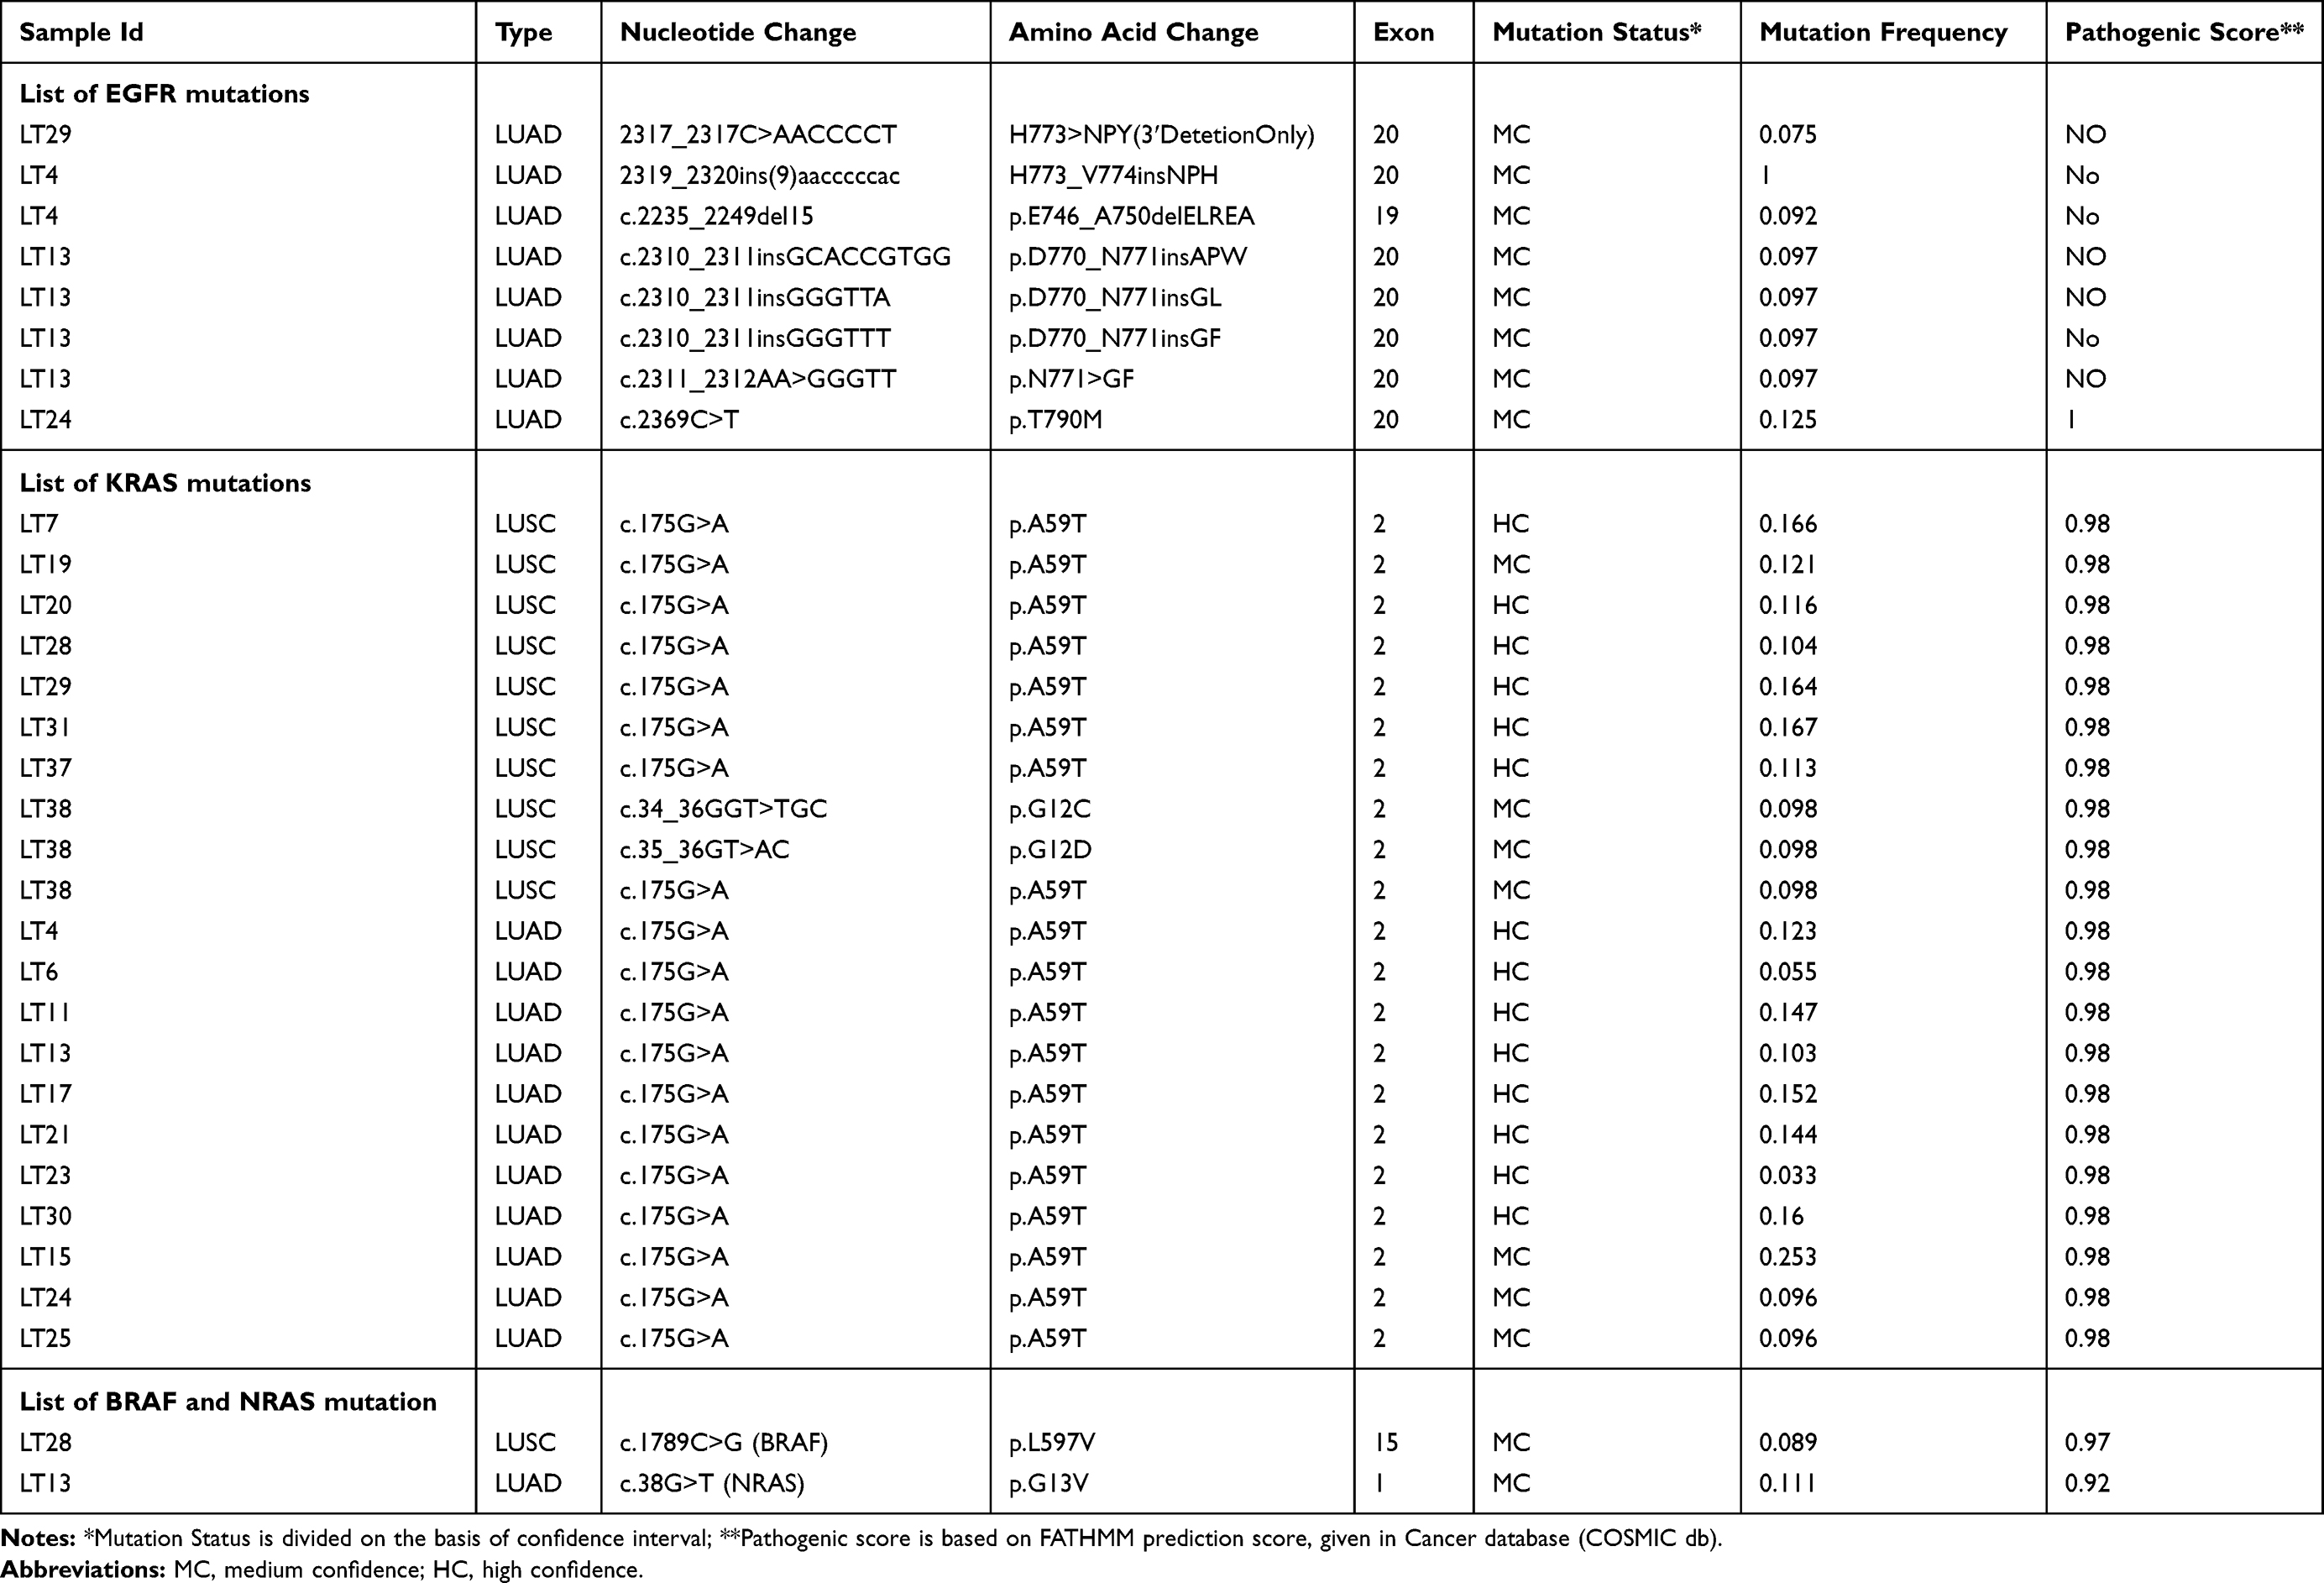 |
Table 5 Mutations of the EGFR, KRAS, BRAF and NRAS Gene in Lung Adenocarcinoma (LUAD) and Lung Squamous Cell Carcinoma (LUSC) Identified Through Agena MassARRAY® Platform |
Discussion
The current scenario of mortality and incidence of lung cancer has been increasing globally.1 Lung squamous cell carcinoma (LUSC) and Lung adenocarcinoma (LUAD) are the two subtypes of lung cancer and the incidence of LUSC was reported to be associated with smoking, whereas LUAD is a heterogeneous disease characterized by high rates of genetic mutation.17 The underlying pathological mechanisms of NSCLCs at the molecular level are still at the exploration stage. Various studies have been done to explore the association with the occurrence, progression, and prognosis of NSCLCs although the mortality rate of NSCLC is in part due to the lack of early detection of biomarkers. Hence, the identification of molecular markers at an early stage of NSCLC is required in urgency to improve the clinical efficacy. Now it is well established that the expression levels of particular genes may causative of cancers.18 Microarray (Human Transcriptome Array) and NanoString are high-throughput technology in obtaining quantitative changes in mRNA levels.
In the present study, we identified the up-regulation of CXCL10, PLAU, and down-regulation of FOLR1, DMBT1, SFTPC, and absence of DUSP4, FLG1, TDG, and GOS2 and classifying all our six LUAD samples (for HTA analysis) were of the squamoid subtype of adenocarcinoma.5 In four LUSC samples (for HTA analysis), upregulation of MCM10, TYMS, POLA1, and E2F3 and down-regulation of S100A genes and absence of specific S100A2-basal layer marker negated basal subtype of LUSC and down-regulation of ARHGDIB, MUC1, and absence of TNFRSF14, NF-kappaB, pulmonary surfactant proteins – SFTPC, SFTPB, SFTPD made null and void for the secretory subtype.4 Further absence of TP63 and xenobiotics metabolism genes ruled out the classical subtype. Hence, we concluded that all our LUSC samples were of primitive subtype of LUSC. Specifically, the upregulation of TTF1 in primitive-subtype LUSC, like the secretory property of LUAD as well as down-regulation of the immune response, suggests all four LUSC possess both primitive and secretory sub-type of LUSC.
Hence, as suggested by Wilkerson et al in our early stage, we can predict that all LUSC showing primitive and secretory subtype may have poor survival and maybe Pemetrexed resistance due to the up-regulation of TYMS.4 While, the Squamoid subtype of LUAD, suggestive of a high-grade tumor, ie, poorly differentiated, with maximum solid content, and the minimum papillary content, possessing both adeno and squamous type of property and may have a poor response to chemotherapy as suggested by Wilkerson et al.5
Further, 34 upregulated transcripts after validation through NanoString in LUAD compared to LUSC in tissue associated with the immune system regulatory pathways, suggested higher Immune destruction in LUSC (Supplementary Figure 2). Reports also indicate the presence of high inactivating mutations in the HLA gene has been observed in LUSC, which leads to Immune destruction (Mutation signature of LUSC with a high overall mutation rate (8.1 mutations/megabase)). The higher Immune destruction observed in our LUSC samples further supports this hypothesis.19 Up-regulation of some of the important genes ADAM22, ELOVL7, ICA1, NLGN1, ST18, ZMAT4, RIMS2, KCNB2, SCG3, and CDH2 transcripts at the gene and exonic level in LUSC showed involvement of neurotransmitter release and synaptic interactions (Wikipathways and Gene Cards). ADAM22 receptor binds to LGI-4 ligands, which helps in the enhanced proliferation of glia in the peripheral nervous system.20 During Transmission across Chemical Synapses, voltage-gated potassium channels (K+) channels involving KCNB2 for enhanced neurotransmitter release and neuronal excitability (Gene Card). Presynaptic protein-RIMS2 interacts with RAB3 for normal neurotransmitter release (Gene Card). Neuroendocrine secretory proteins-SCG3enhances neurotransmitter release. ICA1 May play a role in neurotransmitter secretion (Gene Card). Neuroligin family of neuronal cell surface proteins-NLGN1 enhances protein interaction at synapses.21 Further CDH2 (also known as Neuronal-cadherin (N-cadherin)) mediates pre- and post-synaptic adhesions and supports the above neurotransmitter release and synaptic interactions (“Entrez Gene: CDH2 cadherin 2, type 1, N-cadherin (neuronal)”).
Besides neurotransmitter release and synaptic interaction, the lipogenic gene (ELOVL7) was also up-regulated in LUSC. ELOVL7, involved in the elongation of saturated very-long-chain fatty acid (SVLFA) in the phospholipids and neutral lipids like cholesterol ester which is involved in de novo steroid synthesis (Gene Card). Hence, the overexpression of ELOVL7 in LUSC suggests more de novo steroid synthesis.22 Enhanced expression of ELOVL7 and its association with SVLFA has also been reported in prostate cancer cells.22 Another important marker, ST18 (suppression of tumorigenicity 18, breast carcinoma, zinc-finger protein), was over-expressed in LUSC, as suggested by Rava et al 2017.23 They suggested that ST18 expression is increased in epithelial cells due to tumor-associated macrophages and leads to liver tumorigenesis.23 Hence, overexpression in LUSC suggests enhanced tumorigenicity. Overexpression of ZMAT4 in LUSC is supported by other reports in which amplification (CNVs) of ZMAT4 has been observed in AML and ALL while deletion was observed in CML and CLL.24
Some of the genes were validated individually through Real-time PCR and observed that highly up-regulated transcripts showed the importance of understanding the disease. Most importantly LUAD showed significant expression of SPP1 and CD44. SPP1 is a secreted arginine, glycine, aspartic acid-containing phosphorylated sialoprotein secreted by macrophages, osteoclasts, epithelial cells, and endothelial cells in both tissue and blood.25 It binds to multiple integrins and the receptor CD44.26 The interaction between SPP1–CD44 interaction has also shown the importance of the progression of other cancers like colorectal cancer.27,28 The up-regulation of both SPP1 and CD44 was not observed in LUSC, suggesting the progression of LUAD Involves Activation of the Phosphatidylinositol 3-Kinase/Akt Signalling Pathway.29 Although, increased expression of SPP1 has also been associated with metastasis as it modulates VEGF expression and extracellular matrix in the lung.30 Reports have supported that the expression of SPP1 is high in other tumors like lung, colon, breast, and prostate cancer.26 Pang et al in 2019 have summarized multidimensional roles that OPN plays in the bone microenvironment, bone metastasis, and drug resistance, with prominence on breast and prostate cancers, via binding to αvβ3 integrin and CD44 receptor and inducing signaling cascades31 Hence, overexpression of SPP1 at Stage IIIA in 60% cases with an average value of 8·6 fold, LUAD may suggest bone metastasis. Importantly inhibitors like Agelastatin A, which is 1·5 to 16 times more potent than cisplatin and consisting of oroidin alkaloid as well as arresting cells in the G2 phase have been proposed for better management of LUAD patients.32
Enhanced expression of CDH2, a mesenchymal N-cadherin in 57·2% stage IIIA LUSC with 4·6-fold and 42·9% stage IIIA LUSC with 25·4-fold compared to LUAD average 2.6 fold up-regulation of CDH2 in 15% LUAD cases. CDH2 facilitates epithelial to mesenchymal transition to access the vasculature.33 Increased expression of CDH2 is highly predictive of brain metastasis in early and advanced lung cancer.7 Hence, enhanced expression of CDH2 in Stage IIIa LUSC compared to LUAD may show more transition into mesenchymal transition and higher inclination towards brain metastasis through transendothelial migration as supported by Grinberg-Rashi et al 2009.7 Hence, such LUSC cases can be subjected to early brain metastasis treatments like prophylactic CNS irradiation (PCI) which is effective in NSCLC with brain metastasis. The reduction of metastasis has been observed from 34·7% to 7·8%.34 Another pre-synaptic transcript, RIMS2 involved in synaptic membrane exocytosis (Gene Card), was upregulated in LUSC has not been reported as a metastatic marker. Overexpression of RIMS2 in Stage IIIA LUSC suggests more neurovascular involvement, while low expression of RIMS2 in LUAD suggests it less neurovascular involvement compared to LUSC showing intermediate involvement.35 It has also been reported that the nervous system modulates angiogenesis and microenvironments in tumors and affects metastasis.36
Additionally, genotyping has been done in DNA of the same stage IIIA NSCLC tissue samples using Agena MassArray Oncofocus panel. This panel includes EGFR, KRAS, NRAF, and BRAF hotspot mutations. KRAS is one of the most mutated genes in the RAS subfamily genes and responsible for various cancers such as colorectal cancer, pancreatic carcinoma, and lung carcinoma.14–16 Although the Catalogue of KRAS A59T mutations in the Cancer database (COSMIC db) gives them a FATHMM prediction score of 1.0, thus classifying them as both deleterious and pathogenic.37 The propensity of KRAS A59T was identified in both LUAD & LUSC samples. To the best of my knowledge, this is the first report to identify the prevalence of KRAS A59T mutation in NSCLC stage IIIA tumor. Although, this mutation has only been reported in colorectal adenocarcinoma.38 Additionally, two clinical trials for KRAS A59T are under process which can also be proposed for colorectal carcinoma.39–41 Further, the study required to identify the functional role of KRAS A59T in NSCLC. We identified EGFR T790M mutation in one sample, non-pathogenic exon 20 insertions in three LUAD samples suggesting resistance to TKIs in these samples.42 Our study reported the occurrence of all EGFR, KRAS, and NRAF mutation in two samples. Non-pathogenic mutation of KRAS (G12C and G12D) responsible for TKIs resistance has been observed in one sample. Pathogenic mutation of BRAF (L597V) and NRAS (G13V) that may be responsible for the development of tumors has also been observed.
In conclusion, we were able to molecularly categorize LUAD and LUSC-tissue, more precisely, identified markers that we are able to support aggressiveness and neuronal involvement in LUSC compared to LUAD. Additionally, a 40-gene transcript panel can aid in the specific histopathological diagnosis of NSCLC in the absence of IHC data. Importantly, an assessment of SPP1-tumorigenic/tumor-cell invasion to bone marker, CDH2-mesenchymal transition/brain metastasis marker, and pre-synaptic-neuro-vascular marker may show the level of tumorigenesis/predict the tumor-cell invasion to different sites (bone or brain) and neurovascular-involvement of the tumor. These markers enable us to categorize NSCLC stage IIIA into LUAD and LUSC plus these markers may be helpful to understand the pathophysiology of NSCLC. However, further data are required that are reproducible in most cases, so that they can be useful in general clinical practice.
Acknowledgments
This research did not receive any specific grant from funding agencies in the public, commercial, or not-for-profit sectors.
Equal contribution for the first author: Neetu Singh and Archana Mishra. Equal contribution for the second author: Dinesh Kumar Sahu, Mayank Jain, and Hari Shyam.
Disclosure
The authors report no conflicts of interest for this work.
The abstract of this paper was presented as a poster with interim findings at the 9th International conference 2019, Nextgen Genomics, Biology, Bioinformatics, and Technologies conference from September 30 to October 2, 2019. The poster’s abstract was not published in any journal.
References
1. Yu K-H, Wang F, Berry GJ, et al. Classifying non-small cell lung cancer histopathology types and transcriptomic subtypes using convolutional neural networks. bioRxiv. 2019;530360.
2. Sasaki H, Suzuki A, Tatematsu T, et al. Prognosis of recurrent non-small cell lung cancer following complete resection. Oncol Lett. 2014;7(4):1300–1304. doi:10.3892/ol.2014.1861
3. Fidler IJ, Yano S, Zhang RD, Fujimaki T, Bucana CD. The seed and soil hypothesis: vascularisation and brain metastases. Lancet Oncol. 2002;3(1):53–57. doi:10.1016/S1470-2045(01)00622-2
4. Wilkerson MD, Yin X, Hoadley KA, et al. Lung squamous cell carcinoma mRNA expression subtypes are reproducible, clinically important, and correspond to normal cell types. Clin Cancer Res. 2010;16(19):4864–4875. doi:10.1158/1078-0432.CCR-10-0199
5. Wilkerson MD, Yin X, Walter V, et al. Differential pathogenesis of lung adenocarcinoma subtypes involving sequence mutations, copy number, chromosomal instability, and methylation. PLoS One. 2012;7(5):e36530. doi:10.1371/journal.pone.0036530
6. Rosell R, Karachaliou N. Gene expression signatures predicting survival and chemotherapy benefit in patients with resected non-small-cell lung cancer. EBioMedicine. 2018;33:16–17. doi:10.1016/j.ebiom.2018.06.007
7. Grinberg-Rashi H, Ofek E, Perelman M, et al. The expression of three genes in primary non-small cell lung cancer is associated with metastatic spread to the brain. Clin Cancer Res. 2009;15(5):1755–1761. doi:10.1158/1078-0432.CCR-08-2124
8. Chomczynski P, Sacchi N. Single-step method of RNA isolation by acid guanidinium thiocyanate-phenol-chlorform extraction. Anal Biochem. 1987;162:156–159. doi:10.1016/0003-2697(87)90021-2
9. Singh N, Sahu DK, Goel M, Kant R, Gupta DK. Retrospective analysis of FFPE based Wilms’ tumor samples through copy number and somatic mutation related molecular inversion probe based array. Gene. 2015;565(2):295–308. doi:10.1016/j.gene.2015.04.051
10. Singh N, Sahu DK, Tripathi RK, et al. Differentially expressed full-length, fusion and novel isoforms transcripts-based signature of well-differentiated keratinized oral squamous cell carcinoma. Oncotarget. 2020;11(34):3227–3243. doi:10.18632/oncotarget.27693
11. Li K, Bihan M, Yooseph S, Methe BA. Analyses of the microbial diversity across the human microbiome. PLoS One. 2012;7(6):e32118. doi:10.1371/journal.pone.0032118
12. Singh N, Tripathi AK, Sahu DK, et al. Differential genomics and transcriptomics between tyrosine kinase inhibitor-sensitive and -resistant BCR-ABL-dependent chronic myeloid leukemia. Oncotarget. 2018;9(54):30385–30418. doi:10.18632/oncotarget.25752
13. Mishra A, Singh N, Shyam H, et al. Differential expression profiling of transcripts of IDH1, CEA, Cyfra21-1, and TPA in stage IIIa non-small cell lung cancer (NSCLC) of smokers and non-smokers cases with air quality index. Gene. 2020;766:145151. doi:10.1016/j.gene.2020.145151
14. Porru M, Pompili L, Caruso C, Biroccio A, Leonetti C. Targeting KRAS in metastatic colorectal cancer: current strategies and emerging opportunities. J Exp Clin Cancer Res. 2018;37(1):57. doi:10.1186/s13046-018-0719-1
15. Di Magliano MP, Logsdon CD. Roles for KRAS in pancreatic tumor development and progression. Gastroenterology. 2013;144(6):1220–1229. doi:10.1053/j.gastro.2013.01.071
16. Westcott PM, To MD. The genetics and biology of KRAS in lung cancer. Chin J Cancer. 2013;32(2):63–70. doi:10.5732/cjc.012.10098
17. Lawrence MS, Stojanov P, Polak P, et al. Mutational heterogeneity in cancer and the search for new cancer-associated genes. Nature. 2013;499(7457):214–218. doi:10.1038/nature12213
18. Chin L, Gray JW. Translating insights from the cancer genome into clinical practice. Nature. 2008;452(7187):553–563. doi:10.1038/nature06914
19. Hammerman PS, Lawrence MS, Voet D, et al. Comprehensive genomic characterization of squamous cell lung cancers. Nature. 2012;489(7417):519–525.
20. Fukata Y, Adesnik H, Iwanaga T, Bredt DS, Nicoll RA, Fukata M. Epilepsy-related ligand/receptor complex LGI1 and ADAM22 regulate synaptic transmission. Science. 2006;313(5794):1792–1795. doi:10.1126/science.1129947
21. Samarelli AV, Riccitelli E, Bizzozero L, et al. Neuroligin 1 induces blood vessel maturation by cooperating with the alpha6 integrin. J Biol Chem. 2014;289(28):19466–19476. doi:10.1074/jbc.M113.530972
22. Tamura K, Makino A, Hullin-Matsuda F, et al. Novel lipogenic enzyme ELOVL7 is involved in prostate cancer growth through saturated long-chain fatty acid metabolism. Cancer Res. 2009;69(20):8133–8140. doi:10.1158/0008-5472.CAN-09-0775
23. Rava M, D’Andrea A, Doni M, et al. Mutual epithelium-macrophage dependency in liver carcinogenesis mediated by ST18. Hepatology. 2017;65(5):1708–1719. doi:10.1002/hep.28942
24. Wan J, Gao Y, Zhao X, et al. The association between the copy-number variations of ZMAT4 and hematological malignancy. Hematology. 2011;16(1):20–23. doi:10.1179/102453311X12902908411751
25. Reinholt FP, Hultenby K, Oldberg A, Heinegard D. Osteopontin–a possible anchor of osteoclasts to bone. Proc Natl Acad Sci U S A. 1990;87(12):4473–4475. doi:10.1073/pnas.87.12.4473
26. Zhao H, Chen Q, Alam A, et al. The role of osteopontin in the progression of solid organ tumour. Cell Death Dis. 2018;9(3):356. doi:10.1038/s41419-018-0391-6
27. Ng L, Wan TM, Lam CS, et al. Post-operative plasma osteopontin predicts distant metastasis in human colorectal cancer. PLoS One. 2015;10(5):e0126219. doi:10.1371/journal.pone.0126219
28. Rao G, Wang H, Li B, et al. Reciprocal interactions between tumor-associated macrophages and CD44-positive cancer cells via osteopontin/CD44 promote tumorigenicity in colorectal cancer. Clin Cancer Res. 2013;19(4):785–797. doi:10.1158/1078-0432.CCR-12-2788
29. Lin YH, Yang-Yen HF. The osteopontin-CD44 survival signal involves activation of the phosphatidylinositol 3-kinase/Akt signaling pathway. J Biol Chem. 2001;276(49):46024–46030. doi:10.1074/jbc.M105132200
30. Lin Q, Guo L, Lin G, et al. Clinical and prognostic significance of OPN and VEGF expression in patients with non-small-cell lung cancer. Cancer Epidemiol. 2015;39(4):539–544. doi:10.1016/j.canep.2015.05.010
31. Pang X, Gong K, Zhang X, Wu S, Cui Y, Qian B-Z. Osteopontin as a multifaceted driver of bone metastasis and drug resistance. Pharmacol Res. 2019;144:235–244. doi:10.1016/j.phrs.2019.04.030
32. Mason CK, McFarlane S, Johnston PG, et al. Agelastatin A: a novel inhibitor of osteopontin-mediated adhesion, invasion, and colony formation. Mol Cancer Ther. 2008;7(3):548–558. doi:10.1158/1535-7163.MCT-07-2251
33. Drasin DJ, Robin TP, Ford HL. Breast cancer epithelial-to-mesenchymal transition: examining the functional consequences of plasticity. Breast Cancer Res. 2011;13(6):226. doi:10.1186/bcr3037
34. Bovi JA. Prevention of brain metastases. Front Neurol. 2018;2:758. doi:10.3389/fneur.2018.00758
35. Arese M, Bussolino F, Pergolizzi M, Bizzozero L, Pascal D. Tumor progression: the neuronal input. Ann Transl Med. 2018;6(5):89. doi:10.21037/atm.2018.01.01
36. Kuol N, Stojanovska L, Apostolopoulos V, Nurgali K. Role of the nervous system in cancer metastasis. J Exp Clin Cancer Res. 2018;37(1):5. doi:10.1186/s13046-018-0674-x
37. Shihab HA, Gough J, Cooper DN, et al. Predicting the functional, molecular, and phenotypic consequences of amino acid substitutions using hidden Markov models. Hum Mutat. 2013;34(1):57–65. doi:10.1002/humu.22225
38. Alcantara KMM, Malapit JRP, Yu RTD, et al. Non-redundant and overlapping oncogenic readouts of non-canonical and novel colorectal cancer KRAS and NRAS mutants. Cells. 2019;8(12):1557. doi:10.3390/cells8121557
39. Satake H, Sunakawa Y, Miyamoto Y, et al. A phase II trial of 1st-line modified-FOLFOXIRI plus bevacizumab treatment for metastatic colorectal cancer harboring RAS mutation: JACCRO CC-11. Oncotarget. 2018;9(27):18811–18820. doi:10.18632/oncotarget.24702
40. Deng Y, Hu H, Liu G et al. FOLFOXIRI with or without bevacizumab as first-line treatment for unresectable liver-only metastatic colorectal cancer patients with RAS mutation-type. 2015:TPS3624
41. Parseghian C.Panitumumab with or without trametinib in treating patients with stage IV colorectal cancer. 2019: NCT03087071.
42. Greulich H, Chen TH, Feng W, et al. Oncogenic transformation by inhibitor-sensitive and -resistant EGFR mutants. PLoS Med. 2005;2(11):e313. doi:10.1371/journal.pmed.0020313
 © 2020 The Author(s). This work is published and licensed by Dove Medical Press Limited. The
full terms of this license are available at https://www.dovepress.com/terms
and incorporate the Creative Commons Attribution
- Non Commercial (unported, 3.0) License.
By accessing the work you hereby accept the Terms. Non-commercial uses of the work are permitted
without any further permission from Dove Medical Press Limited, provided the work is properly
attributed. For permission for commercial use of this work, please see paragraphs 4.2 and 5 of our Terms.
© 2020 The Author(s). This work is published and licensed by Dove Medical Press Limited. The
full terms of this license are available at https://www.dovepress.com/terms
and incorporate the Creative Commons Attribution
- Non Commercial (unported, 3.0) License.
By accessing the work you hereby accept the Terms. Non-commercial uses of the work are permitted
without any further permission from Dove Medical Press Limited, provided the work is properly
attributed. For permission for commercial use of this work, please see paragraphs 4.2 and 5 of our Terms.