Back to Journals » International Journal of General Medicine » Volume 15
Comprehensive Analysis of the PROSER2-AS1-Related ceRNA Network and Immune Cell Infiltration in Papillary Thyroid Carcinoma
Authors Wang T, Yu Q, Zhang W, Gao L
Received 13 September 2021
Accepted for publication 16 December 2021
Published 16 February 2022 Volume 2022:15 Pages 1647—1663
DOI https://doi.org/10.2147/IJGM.S338019
Checked for plagiarism Yes
Review by Single anonymous peer review
Peer reviewer comments 2
Editor who approved publication: Dr Scott Fraser
Tingting Wang,1 Qian Yu,2 Wei Zhang,1 Li Gao1
1Department of Endocrinology and Metabology, The First Affiliated Hospital of Shandong First Medical University & Shandong Provincial Qianfoshan Hospital, Shandong Key Laboratory of Rheumatic Disease and Translational Medicine, Shandong Institute of Nephrology, Ji’nan, 250014, People’s Republic of China; 2Department of Nuclear Medicine, The Affiliated Hospital of Qingdao University, Qingdao, 266003, People’s Republic of China
Correspondence: Tingting Wang, Email [email protected]
Background: Papillary thyroid carcinoma (PTC) is a malignant tumor of the endocrine system, and distant metastasis leads to poor prognosis for patients with PTC. The competitive endogenous RNA (ceRNA) network and tumor-infiltrating immune cells might participate in tumor prognosis and distant metastasis. However, few studies have focused on ceRNAs and immune cells in PTC.
Methods: We identified differentially expressed lncRNAs (DELs) using the GEO2R tool of the GEO database. Through comprehensive analysis, we selected lncRNA PROSER2-AS1 and constructed a PROSER2-AS1-mediated ceRNA network. Survival was analyzed with a Kaplan-Meier (KM) curve. Gene set enrichment analysis (GSEA) was performed to determine the function of PROSER2-AS1 in the ceRNA network using TCGA database. Moreover, the relationship between PROSER2-AS1 and immune cell infiltration was analyzed with ssGSEA using the “GSVA” package in R.
Results: Comprehensive analysis of the GSE66783 dataset revealed 105 significantly differentially expressed lncRNAs. Univariate and multivariate Cox regression analyses were performed to assess the prognostic significance of the DELs, and we identified lncRNA PROSER2-AS1 as an independent factor for prognosis in PTC (p < 0.05). Considering the online tools LncRNASNP2 and miRWalk3.0, we constructed a PROSER2-AS1-related ceRNA network. Furthermore, the GSEA results suggested that PROSER2-AS1 may be involved in immune cell infiltration and that PROSER2-AS1 was correlated with 14 types of tumor-infiltrating immune cells. PROSER2-AS1 might function through TGFBR3.
Conclusion: lncRNA PROSER2-AS1 and related mRNAs (TGFBR3) may be potential prognostic biomarkers in PTC and may correlate with immune infiltrates.
Keywords: PROSER2-AS1, papillary thyroid carcinoma, immune cells, prognosis
Introduction
Recently, the morbidity of thyroid cancer has increased dramatically, accounting for 1–2%1,2 of all cancers, and papillary thyroid carcinoma (PTC) is the most common histological type.3 Currently, the treatment of thyroid cancer includes surgery, hormone therapy and radioiodine therapy. Most PTC patients have a good prognosis; however, PTC patients with distant metastasis have poor prognosis, and available treatments cannot dramatically improve prognosis.4 It has been reported that the mortality of thyroid cancer in China is increasing gradually at a rate of 1.4% per year.5 Fine needle biopsy is a reliable preoperative qualitative method for thyroid cancer, but it is easy to misdiagnose and to miss a diagnosis when the volume of nodules is small. Because of early lymph node metastasis and postoperative recurrence, patients with PTC face a poor prognosis. Therefore, early diagnosis and comprehensive treatment of PTC are particularly important.
Long noncoding RNAs (lncRNAs), with a length of more than 200 bases, are unable to be translated into proteins. Growing data suggest that lncRNAs are involved in tumor development processes, including pretranscription, posttranscription, cell proliferation, differentiation, apoptosis and migration.6,7 Thus, lncRNAs can act as new diagnostic biomarkers and therapeutic targets in cancer.8 lncRNAs associated with thyroid cancer are mainly divided into two categories: oncogenes and tumor suppressor genes. Among these lncRNAs, the main oncogenic lncRNAs are BANCR, HOTAIR, H19 and MALAT1,9–12 and the main tumor-suppressing lncRNAs are PTCSC3, PTCSC2 and MEG.13–16 Competing endogenous RNA (ceRNA) was proposed by Salmena et al17 who described a hypothesis that lncRNAs could induce gene silencing by binding to miRNAs. The ceRNA network plays crucial roles in tumorigenesis.17,18 As a result, it is imperative to investigate the role of ceRNA networks in the poor prognosis of PTC.
The tumor microenvironment (TME) is composed of extracellular matrix (ECM) and nonmalignant normal cells, including fibroblasts, pericytes, immune cells and endothelial cells.18–20 Tumor-infiltrating immune cells (TIICs) have emerged as a key factor that drives tumor initiation and metastasis.21 A recent study revealed that the occurrence and development of thyroid cancer are highly correlated with inflammation and immune cell infiltration, and exploring the immune cell infiltration pattern is helpful for judging the prognosis and treatment response of patients.22
In this study, we analyzed the regulatory ceRNA network of lncRNAs to further explore the molecular mechanism of the occurrence and development of PTC to identify more biological diagnostic and prognostic monitoring markers of PTC. We revealed a potential role for PROSER2-AS1 in tumor immunology and its prognostic value, which will help to further explore the profound effects of lncRNAs in the process of cancer.
Materials and Methods
Data Acquisition and Screening of DELs
The gene expression profile of GSE66783 (Platform: GPL19850) was selected from the Gene Expression Omnibus (GEO) (http://www.ncbi.nlm.nih.gov/geo/).23 The GSE66783 dataset included 5 pairs of PTC and normal thyroid tissues, and normalized microarray data were reanalyzed using the GEO2R online tools (https://www.ncbi.nlm.nih.gov/geo/geo2r/).24 The differentially expressed genes (DEGs) were considered significant when |logFC|>1, with an adjusted P value<0.05. A volcano plot was generated with the “ggplot2” package of R software. Differentially expressed lncRNAs (DELs) were identified by setting the cutoff value at |logFC| > 2 and adjusted P<0.05. The heatmap of the DELs was drawn by the complex Heatmap package of R software. We also gathered RNA-sequencing data of PTC from the TCGA database (https://genome-cancer.ucsc.edu/) and clinical information from 510 samples of tumors and 58 samples of paracancerous tissue. Our study procedure flowchart is shown in Figure 1. As all data in our study were obtained from public databases (GEO and TCGA database) following publication guidelines, the Ethics Committee of the First Affiliated Hospital of Shandong First Medical University & Shandong Provincial Qianfoshan Hospital required no further ethical approval for the study.
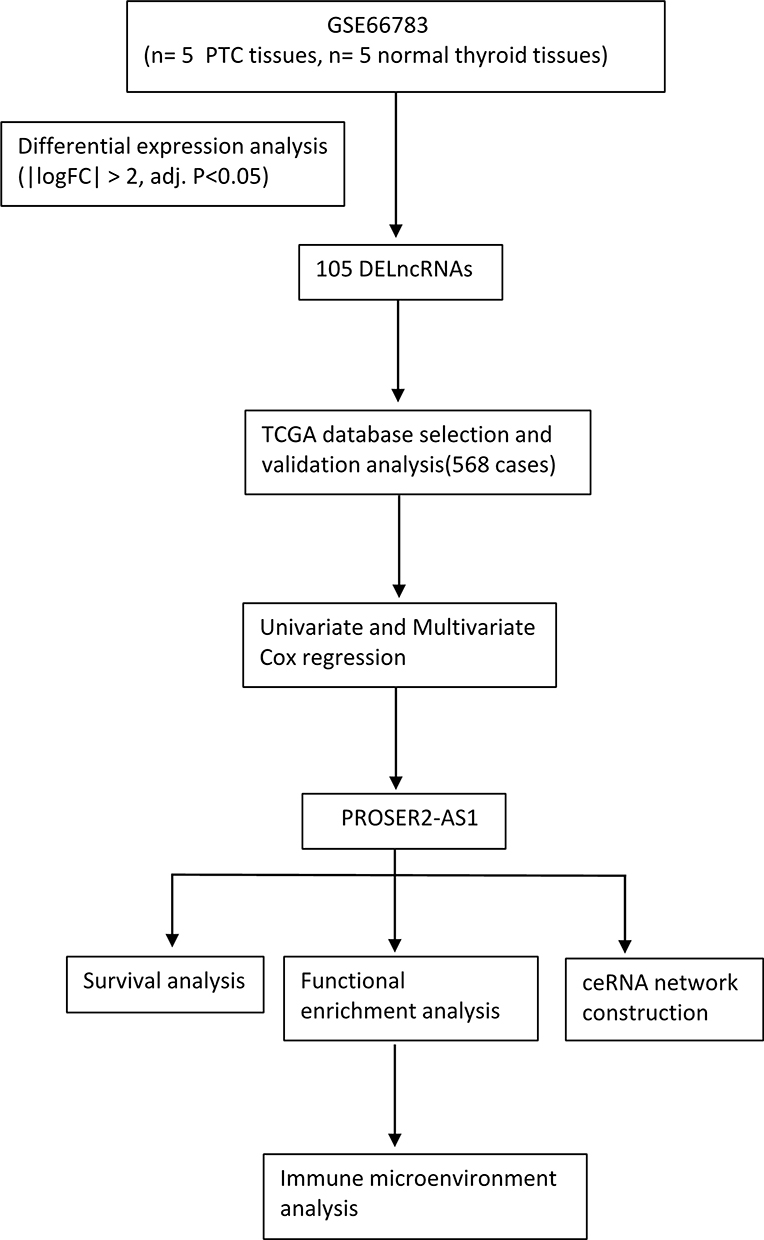 |
Figure 1 Flow diagram of data collection and analysis. |
Univariate and Multivariate Cox Analyses
Univariate Cox regression analysis was used to determine the effect of DELs on progression-free survival (PFS) using the survival package of R software. To identify independent prognostic factors, all significant variables on univariate Cox regression analysis (P≤0.05) were subjected to multivariate Cox regression analysis.
Survival Analysis
The prognostic analysis was performed using the R survival package (Version 3.6.3). The survival result was displayed as a Kaplan–Meier (K-M) curve with the cutoff value determined by survminer and visualized by survival (Version 3.6.3). A value of p <0.05 was considered statistically significant.
Gene Set Enrichment Analysis (GSEA)
To identify the potential function of PROSER2-AS1, gene set enrichment analysis (GSEA) was conducted between the low-and high-expression groups using the R package cluster Profiler (version 3.6.3). Gene sets with false discovery rate (FDR)< 0.25 and P.adjust <0.05 were considered to be significantly enriched.25,26
Immune Cell Infiltration Analysis
We conducted an immune cell infiltration analysis to evaluate the correlation between PROSER2-AS1 expression and the infiltrating levels of 24 immune cell types27 on the basis of TCGA database and performed using the single-sample GSEA (ssGSEA) method and the R package GSVA (version 3.6.3).28 Moreover, the relationships between PROSER2-AS1 expression and several immune cell biomarkers were estimated using the GEPIA database (http://gepia.cancer-pku.cn/index.html).29 The immune cell composition in PTC was obtained from the TCIA database (https://www.tcia.at/home).30
Construction of the ceRNA Network
Online tools of lncATLAS (http://lncatlas.crg.eu/)31 and LncSLdb (http://bioinformatics.xidian.edu.cn/lncSLdb/index.jsp)32 were used for cellular localization prediction of PROSER2-AS1. To confirm the ceRNA network, we screened the target miRNAs of PROSER2-AS1 based on lncRNASNP2 (http://bioinfo.life.hust.edu.cn/lncRNASNP#!/).33 The mRNAs targeted by miRNAs were predicted using miRWalk3.0 (http://mirwalk.umm.uni-heidelberg.de/).34 Predicted genes that were fitted to the miRanda, miRDB, and TargetScan databases were considered as target genes. We constructed a ceRNA network using Cytoscape software (Version 3.7.1).
Results
Identification of DELs in PTC Patients
We first obtained the gene expression profiles from the GSE66783 dataset, including 5 tumor samples and 5 paired normal thyroid samples. Volcano plots of the DERNAs (including DElncRNAs, DEmiRNAs, and DEmRNAs) were visualized using the ggplot2 package of R software (Figure 2A). Heatmap clustering was drawn by the Complex Heatmap package of R software (Figure 2B). By setting the cutoff value at |logFC| > 2 and adjusted P<0.05, we identified 105 DELs. We identified PROSER2-AS1 by conducting univariate and multivariate Cox regression analyses based on TCGA database (P≤0.05) (Table 1). In the univariate Cox regression, different levels of PROSER2-AS1 showed statistical significance with the variables (P=0.007). Multivariate analysis further revealed that PROSER2-AS1 (P<0.05) was an independent prognostic factor in the PFS of PTC patients. Figure 2D showed that multiple cancer types exhibited different PROSER2-AS1 expression, including breast, kidney, stomach, liver, uterus, prostate, brain, colon, rectum and thyroid cancer. However, the changing trends of PROSER2-AS1 expression in the above cancers were different. In thyroid cancer, the expression of PROSER2-AS1 was significantly reduced, as validated by TCGA database analysis (Figure 2C). The immune-related gene list was downloaded from ImmPort (https://www.immport.org/) (Table S2).
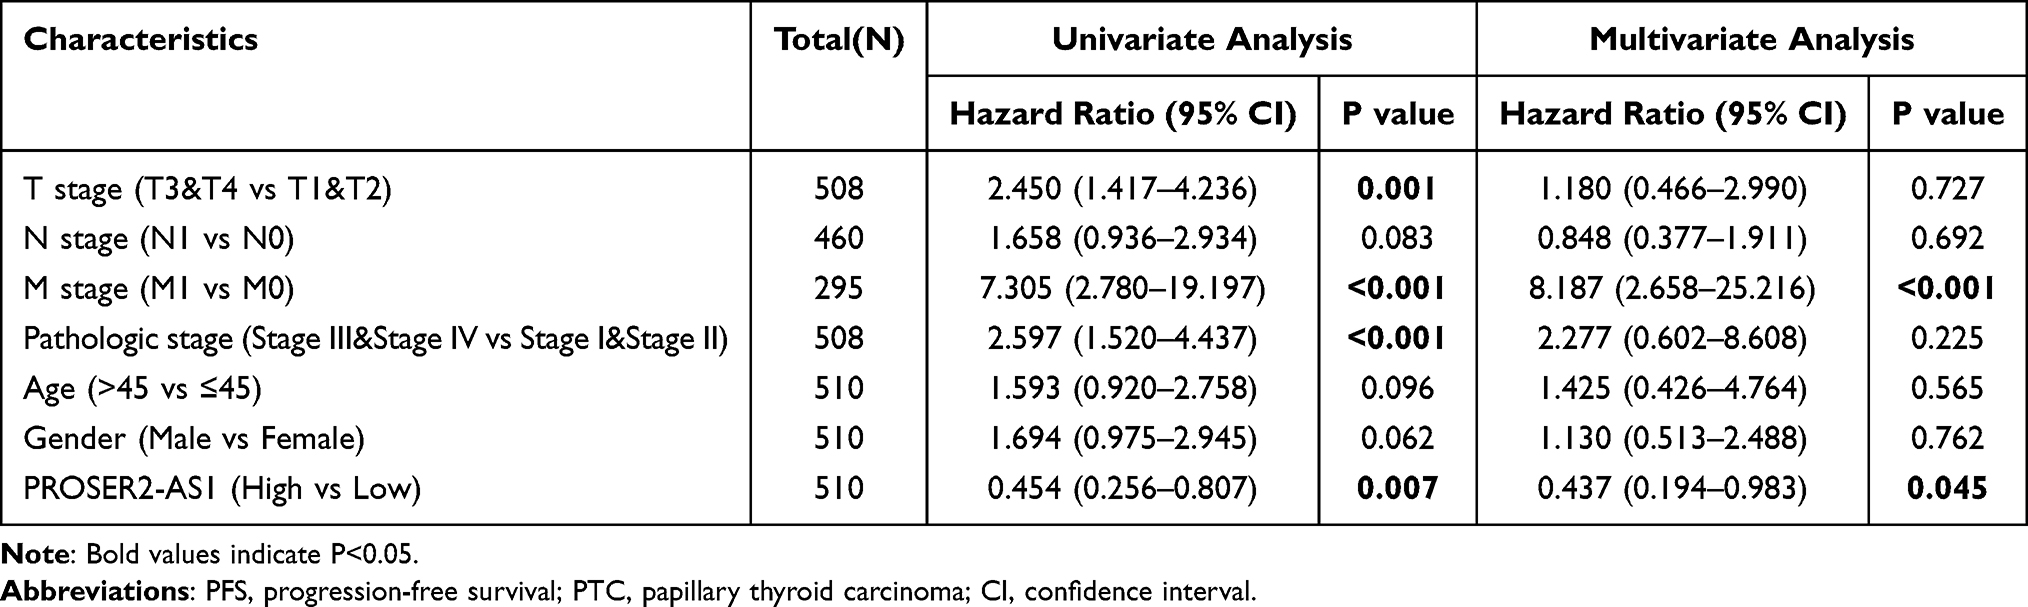 |
Table 1 Univariate and Multivariate Cox Regression Analyses of Clinical Characteristics Associated with PFS in PTC |
 |
Figure 2 Differentially expressed genes in thyroid papillary carcinoma and normal samples from GSE66783 datasets. (A) Volcano plot of DEGs in GSE66783. (B) Heatmap of DELs in GSE66783. (C) The expression of PROSER2-AS1 in thyroid papillary carcinoma and paired normal thyroid tissues. (D) The expression levels of PROSER2-AS1 in different types of tumors based on TCGA database (*P<0.05, **P<0.01, ***P<0.001). Abbreviations: DEGs, differentially expressed genes; DELs, differentially expressed lncRNAs. |
Association Between PROSER2-AS1 Expression and Prognosis in PTC
Correlations between PROSER2-AS1 and clinical parameters were examined using the ggplot2 package (Table 2). There were significant differences in T stage (P=0.015), N stage (P<0.001) and pathologic stage (P=0.023) between the PROSER2-AS1 low expression group and high expression group. We further used Kaplan–Meier curves to estimate the correlation of PROSER2-AS1 expression with the prognosis of PTC. The results showed that the lower expression group of PROSER2-AS1 had a poorer prognosis of PTC (PFS: HR=0.48, 95% CI=0.28–0.82, P=0.01) (Figure 3A). Additionally, subgroup analysis of KM curves by different clinical features using R software further revealed the association between PROSER2-AS1 expression and prognosis in PTC. We found that its decline was significantly linked with poor prognosis in the subgroups of T stage (PFS: HR=0.49, 95% CI=0.28–0.86, P=0.016), N stage (PFS:HR=0.41, 95% CI=0.20–0.87, P=0.011), M stage (PFS:HR=0.46, 95% CI=0.20–1.04, P=0.03), pathological stage (PFS:HR=0.48, 95% CI=0.23–1.00, P=0.049), age (>45 years) (PFS:HR =0.46, 95% CI=0.23–0.93, P=0.024) and sex (female)(PFS: HR=0.44, 95% CI=0.22–0.86, P=0.028), as shown in Figure 3B–G. The results demonstrated that PROSER2-AS1 expression significantly correlated with poorer outcome in PTC. ROC analysis of PROSER2-AS1 expression revealed that the area under the ROC curve was 0.820, which suggests that PROSER2-AS1 may be a potential diagnostic biomarker of PTC (Figure 3H).
 |
Table 2 Correlation Between PROSER2-AS1 Expression and Clinicopathological Characteristics in PTC |
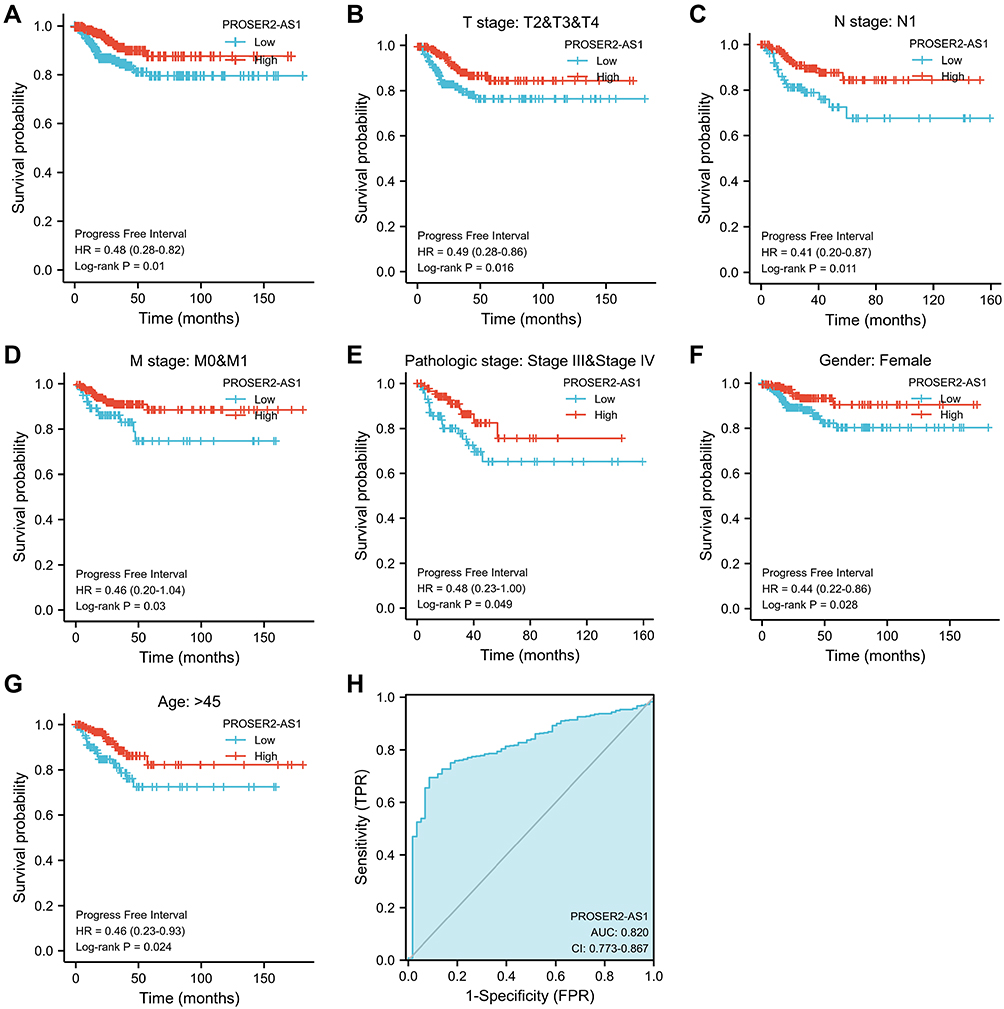 |
Figure 3 PROSER2-AS1 expression and prognosis in patients with PTC. (A) Kaplan–Meier (K-M) curves were drawn using the R package survminer to evaluate the prognostic value of PROSER2-AS1 in the PFS of PTC patients. (B–G) K-M curve subgroup analysis of T stage, N stage, M stage, pathological stage, sex and age. (H) ROC curve showing the efficiency of the PROSER2-AS1 expression level in distinguishing PTC tissue from nontumor tissue. |
Functional Enrichment Analysis
To predict the function of PROSER2-AS1, gene set enrichment analysis (GSEA) was used to search for KEGG and Reactome pathways using TCGA database. The results revealed that the immune regulatory interactions, antigen activating B cell receptor, FCGR activation, signaling by the B cell receptor and the role of phospholipids in phagocytosis were significantly enriched (Figure 4A). In addition, cytokine receptor interactions, antigen processing and presentation, the JAK-STAT signaling pathway, the cell cycle and the p53 signaling pathway were significantly enriched by KEGG pathway analysis (Figure 4B). These results suggested that PROSER2-AS1 is associated with many malignancy-related pathways in thyroid cancer, especially immune-related pathways.
 |
Figure 4 Enrichment plot from the GSEA. Gene set enrichment plots of the (A) REACTOME pathway and (B) KEGG pathway with low PROSER2-AS1 expression in PTC. Abbreviations: NES, normalized NS; Padj, adjusted P value; FDR, false discovery rate. |
Correlation Between PROSER2-AS1 and Immune Cell Infiltration
We explored the association between PROSER2-AS1 expression and infiltrating immune cells in PTC using the GSVA package of R software. As shown in Figure 5A, the results revealed that the levels of many infiltrating immune cell types, such as dendritic cells, macrophages, neutrophils, Th1 cells, Th2 cells and Treg cells, decreased significantly in the high-expression group of PROSER2-AS1. Next, we further analyzed the relationship between PROSER2-AS1 and the infiltrating immune cell types. PROSER2-AS1 expression was negatively correlated with the infiltration levels of B cells (r=−0.130, P=0.004), neutrophils (r=−0.240, P<0.001), dendritic cells (r=−0.260, P<0.001), macrophages (r=−0.220, P<0.001), Th1 cells (r=−0.220, P<0.001), Th2 cells (r=−0.320, P<0.001) and Treg cells (r=−0.300, P<0.001) and positively correlated with NK cells (r=0.170, P<0.001) (Figure 5B–I). Similar results were verified in Table 3. PROSER2-AS1 was significantly negatively correlated with M1 macrophage biomarkers (NOS2, IRF5, and PTGS2), neutrophil biomarkers (CEACAM8, ITGAM and CCR7), dendritic cell biomarkers (HLA-DPB1, HLA-DQB1, HLA-DRA, HLA-DPA1, CD1C, NRP1 and ITGAX), and Th1 biomarkers (STAT4 and STAT1) in PTC. B cells (0.98%), dendritic cells (0.34%), M1 macrophages (2.40%), M2 macrophages (4.12%), natural killer cells (0.46%), neutrophils (11.90%), CD4+ T cells (1.50%), CD8+ T cells (1.06%), and regulatory T cells (1.15%) comprised the known immune cell components in PTC (Figure 5J). These results suggested that PROSER2-AS1 is involved in tumor immune cell infiltration.
 |
Table 3 Correlation Between PROSER2-AS1 and Biomarkers of Immune Cells in PTC |
 |
Figure 5 Correlation of PROSER2-AS1 expression with immune cell infiltration in PTC. (A) Twenty-four immune cell infiltrates in different PROSER2-AS1 expression groups of PTC patients. (B–H) PROSER2-AS1 had significant negative correlations with the infiltrating levels of B cells, neutrophils, dendritic cells (DCs), macrophages, Th1 cells, Th2 cells and Treg cells. (I) PROSER2-AS1 had a positive correlation with infiltrating levels of NK cells. (J) Immune cell infiltration in papillary thyroid carcinoma. *P<0.05, **P<0.01, ***P<0.001. |
Construction of the ceRNA Network
We examined the subcellular localization of PROSER2-AS1 and found that it was mainly localized in the cytoplasm (Figure S1). To determine the underlying mechanisms, we constructed a lncRNA-miRNA-mRNA network. The prediction of lncRNA-miRNA and miRNA-mRNA functional pairs was carried out based on LncRNASNP2 and miRWalk3.0, respectively. We identified 28 pairs of lncRNA-miRNA (Figure S2) and 270 pairs of miRNA-mRNA (Table S1). A ceRNA network centered on PROSER2-AS1 was visualized using Cytoscape, as shown in Figure 6.
 |
Figure 6 The PROSER2-AS1 related ceRNA network in PTC. The yellow triangle represents lncRNA PROSER2-AS1. The green diamond represents miRNA. The blue triangle represents mRNA. |
Predicted PROSER2-AS1 Downstream Target Genes Associated with Immune Infiltration
The heatmap of the highest ranked co-expressed genes of PROSER2-AS1 was presented in Figure 7A. We determined 10 genes (FURIN, FGF2, RORA, NR3C1, TGFBR3, VEGFA, FGFR1, TGFBR1, ACVR2A and MAP2K1) related to immunity by analyzing the intersection of PROSER2-AS1-targeting mRNAs, an immune-related gene list and co-expressed genes using a Venn diagram (Figure 7B). Finally, only 2 genes (TGFBR3 and VEGFA) remained according to the principle of differential expression (Figure 7C) and survival curve analysis (Figure 7D and E) based on TCGA database. The expression levels of TGFBR3 and VEGFA were positively correlated with the expression of PROSER2-AS1 (Figure 7F and G). We next focused on the relationship between TGFBR3 and immune infiltration in PTC. As shown in Figure 8A, aDC (P<0.001), DC (P<0.001), macrophages (P<0.05), Th2 (P<0.01) and Treg (P<0.001) cells exhibited lower levels in the high TGFBR3 expression group compared to the low group. However, NK (P<0.001), T helper cells (P<0.01), Tcm (P<0.001) and Tgd (P<0.001) cells showed higher proportions in the high expression group. TGFBR3 had a negative relationship with infiltrating levels of aDC cells (r = −0.214, p < 0.001), DC cells (r = −0.224, p < 0.001), macrophages (r = −0.135, p =0.002), Th2 (r = −0.186, p < 0.001) and Treg cells (r = −0.284, p < 0.001) (Figure 8B–F), and positively correlated with T helper cells (r = 0.141, p = 0.001), Tcm (r = 0.218, p < 0.001), Tgd (r = 0.226, p < 0.001) and NK (r = 0.209, p < 0.001) in PTC (Figure 8G–J).
 |
Figure 7 Expression of PROSER2-AS1 target mRNA related to immune cell infiltration in PTC. (A) Heatmap of the top 50 co-expressed genes of PROSER2-AS1. (B) Overlap between the immune-related gene list, the PROSER2-AS1 target mRNA and co-expressed genes of PROSER2-AS1 shown in Venn diagrams. (C) mRNA gene expression of selected genes from (B) in PTC based on TCGA database. (D and E) KM curves of VEGFA and TGFBR3 in PTC patients. (F and G) PROSER2-AS1 has significant positive correlations with VEGFA and TGFBR3. ***P<0.001. |
 |
Figure 8 Correlation of TGFBR3 expression with immune cell infiltration in PTC. (A) Twenty-four immune cell infiltrates in different TGFBR3 expression groups of PTC patients. (B–F) TGFBR3 had significant negative correlations with the infiltrating levels of aDC, dendritic cells (DCs), macrophages, Th2 cells and Treg cells. (G–J) TGFBR3 had a positive correlation with infiltrating levels of T helper cells, Tgd cells, Tcm cells and NK cells. *P<0.05, **P<0.01, ***P<0.001. |
Discussion
With the application of high-resolution ultrasound and increasing attention to health, the incidence rate of thyroid carcinoma is increasing yearly. Papillary thyroid carcinoma (PTC) accounts for the majority of thyroid tumors. The prognosis of PTC is satisfactory; however, because of its biological characteristics, PTC is prone to spread via early lymph node metastasis or even distant metastasis, resulting in poor prognosis. Therefore, it is important to identify PTC accurately and early. In recent years, the biological function of lncRNAs has attracted much attention. Previous studies have shown that lncRNAs play a role in the occurrence and development of tumors, including papillary thyroid carcinoma.35–38 In this study, differentially expressed lncRNAs were identified through the GEO database. Among them, PROSER2-AS1 was identified by univariate and multivariate Cox analyses. The expression of PROSER2-AS1 was not consistent in different tumors. Through Pan Cancer analysis in TCGA database, PROSER2-AS1 expression was up-regulated in bladder urothelial carcinoma (BLCA), cholangio carcinoma (CHOL), colon adenocarcinoma (COAD), rectum adenocarcinoma (READ), and stomach adenocarcinoma (STAD) and down-regulated in breast invasive carcinoma (BRCA), glioblastoma multiforme (GBM), head and neck squamous cell carcinoma (HNSC), kidney chromophobe (KICH), kidney clear cell carcinoma (KIRC), prostate adenocarcinoma (PRAD) and uterine corpus endometrial carcinoma (UCEC). In thyroid carcinoma, its expression was down regulated, which suggested that it is a suppressor gene in thyroid cancer. Kaplan–Meier survival analysis implied that PTC patients with low expression of PROSER2-AS1 had shorter PFS (p <0.05). Multivariate Cox analysis confirmed that low expression of PROSER2-AS1 was an independent risk factor for FPS in PTC patients. In addition, K-M subgroup analysis showed that clinicopathologic features were also associated with poor prognosis in PTC, including advanced stage and lymph node metastases. ROC analysis verified the diagnostic value of PROSER2-AS1 in PTC. To further investigate the functions of PROSER2-AS1 in PTC, we performed GSEA based on TCGA database. The GSEA results showed that cytokine receptor interaction, antigen processing and presentation, JAK-STAT signaling pathway, cell cycle, p53 signaling pathway and immune regulatory interactions were differentially enriched in PROSER2-AS1-low cells. These results suggest that PROSER2-AS1 may be considered a PTC prognostic biomarker.
lncRNAs have unique advantages compared with ordinary genes, including differential expression in different tissues, diseases, and various stages, which suggests that lncRNAs may be biomarkers for the specificity of a certain tissue or a definitive stage of a disease. Increasing evidence has shown that lncRNAs play roles in the development of many diseases, including cancers.39–41 There are two main mechanisms of lncRNAs: transcriptional regulation and posttranscriptional regulation. The former plays a regulatory role in the nucleus by interacting with nuclear factors, while the latter plays a regulatory role in the cytoplasm through a ceRNA mechanism. In this study, PROSER2-AS1 was predicted to be located in the cytoplasm. To further study the mechanism, we established a PROSER2-AS1-related ceRNA network.
To date, accumulating evidence suggests that lncRNAs play important roles in the regulation of immune-related processes.42,43 Therefore, we further analyzed the relationship between PROSER2-AS1 and immune cell infiltration. PROSER2-AS1 expression was negatively correlated with the degrees of macrophage, B cell and neutrophil infiltration in PTC. These results implied that low-PROSER2-AS1 patients might have more active immune responses than high-PROSER2-AS1 patients. In the following study, we selected target mRNAs from the ceRNA network by taking the intersection of immune-related genes. Finally, we identified two mRNAs (TGFBR3 and VEGFA) by screening the differential expression and the effect on prognosis in TCGA database. Correlation analysis showed that there was a positive correlation between PROSER2-AS1 and the two target mRNAs. Vascular endothelial growth factor A (VEGFA) has been reported to promote angiogenesis previously. In recent years, the role of VEGFA in tumor immunity received much attention, suppression of T-cell responses44 and induction of Treg proliferation,45 resulting in tumor-induced immunosuppression. However, these results were not consistent with our bioinformatics analysis.
We next focused our attention on TGFBR3. Transforming growth factor beta receptor III (TGFBR3) is a coreceptor of the TGF-β superfamily. As a suppressor, TGFBR3 plays a role in tumor metastasis.46,47 Brent et al provided novel findings of decreased-expression of TGFBR3 suppressing tumor antigen-specific immune responses in both breast cancer and melanoma.48 In our study, we observed low TGFBR3 expression in PTC and low expression of TGFBR3 was associated with a poor prognosis, suggesting anti-oncogenic role of TGFBR3 in PTC. Further analysis revealed that there was positive correlation between TGFBR3 expression and NK cell infiltration and negative correlation between TGFBR3 expression and Treg cell infiltration in PTC. However, few studies have focused on the role of TGFBR3 in PTC. Additional studies are needed to clarify the impact of TGFBR3 on the metastasis of PTC.
Our study has the following limitations. First, the study was performed primarily based on bioinformatic analyses, which need further experimental verification. Second, the study was a retrospective study, which needs to be supported by the results of further prospective studies. Finally, there was no evaluation of the potential diagnostic role, and it needs to be further explored whether PROSER2-AS1 can be used as a diagnostic marker. As a result, follow-up studies are needed to further validate our findings.
Conclusion
The results of this study indicate that reduced expression of PROSER2-AS1 is correlated with clinical outcomes in PTC and provide evidence for the role of PROSER2-AS1 in immune cell infiltration. TGFBR3 maybe the downstream gene of PROSER2-AS1. In summary, PROSER2-AS1 may be an important regulator of immune cell infiltration and a potential prognostic biomarker in PTC patients.
Abbreviations
PTC, papillary thyroid carcinoma; ceRNA, competitive endogenous RNAs; DELs, differentially expressed lncRNAs; GSEA, Gene set enrichment analysis; lncRNAs, Long non-coding RNAs; TME, tumour microenvironment; ECM, extracellular matrix; TIICs, tumor-infiltrating immune cells; GEO, Gene Expression Omnibus; DEGs, differentially expressed genes; PFS, progression-free survival; TGFBR3, Transforming growth factor beta receptor III; VEGFA, Vascular endothelial growth factor A; TCGA, The Cancer Genome Atlas; GEPIA, Gene Expression Profiling Interactive Analysis; CI, confidence interval; TCIA, The Cancer Immunome Atlas.
Data Sharing Statement
The data that support the findings of the study are available in GEO database at https://www.ncbi.nlm.nih.gov/geo/, TCGA database at https://portal.gdc.cancer.gov/ and immune-related gene list at ImmPort (https://www.immport.org/).
Ethics Approval and Consent to Participate
Not applicable.
Acknowledgments
We acknowledge the R software, GEO, TCGA database for free use.
Disclosure
The authors have no conflicts of interest to declare.
References
1. La Vecchia C, Negri E. Thyroid cancer: the thyroid cancer epidemic - overdiagnosis or a real increase? Nat Rev Endocrinol. 2017;13(6):318–319. doi:10.1038/nrendo.2017.53
2. Morris LGT, Tuttle RM, Davies L. Changing trends in the incidence of thyroid cancer in the United States. JAMA Otolaryngol Head Neck Surg. 2016;142(7):709–711. doi:10.1001/jamaoto.2016.0230
3. Katoh H, Yamashita K, Enomoto T, Watanabe M. Classification and general considerations of thyroid cancer. Ann Clin Pathol. 2015;3(1):1045.
4. Xing M. Molecular pathogenesis and mechanisms of thyroid cancer. Nat Rev Cancer. 2013;13(3):184–199. doi:10.1038/nrc3431
5. Tian W, Xi H. Analysis of the survival status of patients with thyroid carcinoma. Chin J Pract Surg. 2016;36(5):489–493.
6. Cheetham S, Gruhl F, Mattick J, Dinger M. Long noncoding RNAs and the genetics of cancer. Br J Cancer. 2013;108(12):2419–2425. doi:10.1038/bjc.2013.233
7. Murugan AK, Munirajan AK, Alzahrani AS. Long noncoding RNAs: emerging players in thyroid cancer pathogenesis. Endocr Relat Cancer. 2018;25(2):R59–R82. doi:10.1530/ERC-17-0188
8. Qi P, Du X. The long non-coding RNAs, a new cancer diagnostic and therapeutic gold mine. Mod Pathol. 2013;26(2):155–165. doi:10.1038/modpathol.2012.160
9. Zhang J, Du Y, Zhang X, Li M, Li X. Downregulation of BANCR promotes aggressiveness in papillary thyroid cancer via the MAPK and PI3K pathways. J Cancer. 2018;9(7):1318. doi:10.7150/jca.20150
10. Zhu H, Lv Z, An C, et al. Onco-lncRNA HOTAIR and its functional genetic variants in papillary thyroid carcinoma. Sci Rep. 2016;6(1):1–7. doi:10.1038/s41598-016-0001-8
11. Liu L, Yang J, Zhu X, Li D, Lv Z, Zhang X. Long noncoding RNA H19 competitively binds miR‐17‐5p to regulate YES 1 expression in thyroid cancer. FEBS J. 2016;283(12):2326–2339. doi:10.1111/febs.13741
12. Liu J, Dong H, Yang Y, et al. Upregulation of long noncoding RNA MALAT1 in papillary thyroid cancer and its diagnostic value. Future Oncol. 2018;14(29):3015–3022. doi:10.2217/fon-2018-0416
13. Jendrzejewski J, Thomas A, Liyanarachchi S, et al. PTCSC3 is involved in papillary thyroid carcinoma development by modulating S100A4 gene expression. J Clin Endocrinol Metab. 2015;100(10):E1370–E1377. doi:10.1210/jc.2015-2247
14. He H, Li W, Liyanarachchi S, et al. Genetic predisposition to papillary thyroid carcinoma: involvement of FOXE1, TSHR, and a novel lincRNA gene, PTCSC2. J Clin Endocrinol Metab. 2015;100(1):E164–E172. doi:10.1210/jc.2014-2147
15. Wang Y, He H, Li W, et al. MYH9 binds to lncRNA gene PTCSC2 and regulates FOXE1 in the 9q22 thyroid cancer risk locus. Proc Natl Acad Sci. 2017;114(3):474–479. doi:10.1073/pnas.1619917114
16. Wang C, Yan G, Zhang Y, Jia X, Bu P. Long non-coding RNA MEG3 suppresses migration and invasion of thyroid carcinoma by targeting of Rac1. Neoplasma. 2015;62(4):541–549. doi:10.4149/neo_2015_065
17. Salmena L, Poliseno L, Tay Y, Kats L, Pandolfi PP. A ceRNA hypothesis: the Rosetta Stone of a hidden RNA language? Cell. 2011;146(3):353–358. doi:10.1016/j.cell.2011.07.014
18. Spill F, Reynolds DS, Kamm RD, Zaman MH. Impact of the physical microenvironment on tumor progression and metastasis. Curr Opin Biotechnol. 2016;40:41–48. doi:10.1016/j.copbio.2016.02.007
19. Del Prete A, Schioppa T, Tiberio L, Stabile H, Sozzani S. Leukocyte trafficking in tumor microenvironment. Curr Opin Pharmacol. 2017;35:40–47. doi:10.1016/j.coph.2017.05.004
20. Arneth B. Tumor microenvironment. Medicina. 2020;56(1):15. doi:10.3390/medicina56010015
21. Hirsch FR, Scagliotti GV, Mulshine JL, et al. Lung cancer: current therapies and new targeted treatments. Lancet. 2017;389(10066):299–311. doi:10.1016/S0140-6736(16)30958-8
22. Mould RC, van Vloten JP, AuYeung AW, Karimi K, Bridle BW. Immune responses in the thyroid cancer microenvironment: making immunotherapy a possible mission. Endocr Relat Cancer. 2017;24(12):T311–T329. doi:10.1530/ERC-17-0316
23. Selamat SA, Chung BS, Girard L, et al. Genome-scale analysis of DNA methylation in lung adenocarcinoma and integration with mRNA expression. Genome Res. 2012;22(7):1197–1211. doi:10.1101/gr.132662.111
24. Davis S, Meltzer PS. GEOquery: a bridge between the Gene Expression Omnibus (GEO) and bioConductor. Bioinformatics. 2007;23(14):1846–1847. doi:10.1093/bioinformatics/btm254
25. Yu G, Wang L-G, Han Y, He Q-Y. clusterProfiler: an R package for comparing biological themes among gene clusters. Omics. 2012;16(5):284–287. doi:10.1089/omi.2011.0118
26. Subramanian A, Tamayo P, Mootha VK, et al. Gene set enrichment analysis: a knowledge-based approach for interpreting genome-wide expression profiles. Proc Natl Acad Sci. 2005;102(43):15545–15550. doi:10.1073/pnas.0506580102
27. Bindea G, Mlecnik B, Tosolini M, et al. Spatiotemporal dynamics of intratumoral immune cells reveal the immune landscape in human cancer. Immunity. 2013;39(4):782–795. doi:10.1016/j.immuni.2013.10.003
28. Hänzelmann S, Castelo R, Guinney J. GSVA: gene set variation analysis for microarray and RNA-seq data. BMC Bioinform. 2013;14(1):1–15. doi:10.1186/1471-2105-14-7
29. Tang Z, Li C, Kang B, Gao G, Li C, Zhang Z. GEPIA: a web server for cancer and normal gene expression profiling and interactive analyses. Nucleic Acids Res. 2017;45(W1):W98–W102. doi:10.1093/nar/gkx247
30. Charoentong P, Finotello F, Angelova M, et al. Pan-cancer immunogenomic analyses reveal genotype-immunophenotype relationships and predictors of response to checkpoint blockade. Cell Rep. 2017;18(1):248–262. doi:10.1016/j.celrep.2016.12.019
31. Mas-Ponte D, Carlevaro-Fita J, Palumbo E, Pulido TH, Guigo R, Johnson R. LncATLAS database for subcellular localization of long noncoding RNAs. RNA. 2017;23(7):1080–1087. doi:10.1261/rna.060814.117
32. Wen X, Gao L, Guo X, et al. lncSLdb: a resource for long non-coding RNA subcellular localization. Database. 2018;2018. doi:10.1093/database/bay085
33. Miao Y-R, Liu W, Zhang Q, Guo A-Y. lncRNASNP2: an updated database of functional SNPs and mutations in human and mouse lncRNAs. Nucleic Acids Res. 2018;46(D1):D276–D280. doi:10.1093/nar/gkx1004
34. Sticht C, De La Torre C, Parveen A, Gretz N. miRWalk: an online resource for prediction of microRNA binding sites. PLoS One. 2018;13(10):e0206239. doi:10.1371/journal.pone.0206239
35. Dykes IM, Emanueli C. Transcriptional and post-transcriptional gene regulation by long non-coding RNA. Genom Proteom Bioinform. 2017;15(3):177–186. doi:10.1016/j.gpb.2016.12.005
36. Chen F, Yin S, Zhu J, et al. lncRNA DGCR5 acts as a tumor suppressor in papillary thyroid carcinoma via sequestering miR‑2861. Exp Ther Med. 2019;17(1):895–900. doi:10.3892/etm.2018.7012
37. Li X, Zhong W, Xu Y, Yu B, Liu H. Silencing of lncRNA LINC00514 inhibits the malignant behaviors of papillary thyroid cancer through miR-204–3p/CDC23 axis. Biochem Biophys Res Commun. 2019;508(4):1145–1148. doi:10.1016/j.bbrc.2018.12.051
38. Feng L, Yang B, Tang XD. Long noncoding RNA LINC00460 promotes carcinogenesis via sponging miR‐613 in papillary thyroid carcinoma. J Cell Physiol. 2019;234(7):11431–11439. doi:10.1002/jcp.27799
39. Fatica A, Bozzoni I. Long non-coding RNAs: new players in cell differentiation and development. Nat Rev Genet. 2014;15(1):7–21. doi:10.1038/nrg3606
40. Hudson WH, Prokhnevska N, Gensheimer J, et al. Expression of novel long noncoding RNAs defines virus-specific effector and memory CD8+ T cells. Nat Commun. 2019;10(1):1–11. doi:10.1038/s41467-018-07956-7
41. Liu SJ, Horlbeck MA, Cho SW, et al. CRISPRi-based genome-scale identification of functional long noncoding RNA loci in human cells. Science. 2017;355:6320. doi:10.1126/science.aah7111
42. Heward JA, Lindsay MA. Long non-coding RNAs in the regulation of the immune response. Trends Immunol. 2014;35(9):408–419. doi:10.1016/j.it.2014.07.005
43. Chen YG, Satpathy AT, Chang HY. Gene regulation in the immune system by long noncoding RNAs. Nat Immunol. 2017;18(9):962–972. doi:10.1038/ni.3771
44. Lapeyre-Prost A, Terme M, Pernot S, et al. Immunomodulatory activity of VEGF in cancer. Int Rev Cell Mol Biol. 2017;330:295–342. doi:10.1016/bs.ircmb.2016.09.007
45. Terme M, Pernot S, Marcheteau E, et al. VEGFA-VEGFR pathway blockade inhibits tumor-induced regulatory T-cell proliferation in colorectal cancer. Cancer Res. 2013;73(2):539–549. doi:10.1158/0008-5472.CAN-12-2325
46. Nishida J, Miyazono K, Ehata S. Decreased TGFBR3/betaglycan expression enhances the metastatic abilities of renal cell carcinoma cells through TGF-β-dependent and-independent mechanisms. Oncogene. 2018;37(16):2197–2212. doi:10.1038/s41388-017-0084-0
47. Fang W-Y, Kuo Y-Z, Chang J-Y, et al. The tumor suppressor TGFBR3 blocks lymph node metastasis in head and neck cancer. Cancers. 2020;12(6):1375. doi:10.3390/cancers12061375
48. Hanks BA, Holtzhausen A, Evans KS, et al. Type III TGF-β receptor downregulation generates an immunotolerant tumor microenvironment. J Clin Invest. 2013;123(9):3925–3940. doi:10.1172/JCI65745
 © 2022 The Author(s). This work is published and licensed by Dove Medical Press Limited. The
full terms of this license are available at https://www.dovepress.com/terms
and incorporate the Creative Commons Attribution
- Non Commercial (unported, 3.0) License.
By accessing the work you hereby accept the Terms. Non-commercial uses of the work are permitted
without any further permission from Dove Medical Press Limited, provided the work is properly
attributed. For permission for commercial use of this work, please see paragraphs 4.2 and 5 of our Terms.
© 2022 The Author(s). This work is published and licensed by Dove Medical Press Limited. The
full terms of this license are available at https://www.dovepress.com/terms
and incorporate the Creative Commons Attribution
- Non Commercial (unported, 3.0) License.
By accessing the work you hereby accept the Terms. Non-commercial uses of the work are permitted
without any further permission from Dove Medical Press Limited, provided the work is properly
attributed. For permission for commercial use of this work, please see paragraphs 4.2 and 5 of our Terms.