
Back to Journals » Journal of Inflammation Research » Volume 19
Comprehensive Analysis of Immunomodulatory-Related Genes Reveals MAPK14-Associated Myeloid-Derived Suppressor Cells Infiltration in Pediatric Sepsis
Authors Shi J, Jiang J  , Ye J , Dai W
Received 24 October 2025
Accepted for publication 6 February 2026
Published 20 February 2026 Volume 2026:19 568261
DOI https://doi.org/10.2147/JIR.S568261
Checked for plagiarism Yes
Review by Single anonymous peer review
Peer reviewer comments 2
Editor who approved publication: Dr Xin Du
Jia Shi,1 Jianze Jiang,2 Jin Ye,2 Wei Dai2
1Department of Pediatrics, Tongren Hospital, Shanghai Jiao Tong University School of Medicine, Shanghai, 200050, People’s Republic of China; 2Department of Clinical Medicine, Shangrao Key Laboratory of Acute and Critical Care Medicine, Jiangxi Medical College, Shangrao, Jiangxi Province, 334000, People’s Republic of China
Correspondence: Wei Dai, Email [email protected]
Background: Immune dysregulation is central to the pathogenesis of sepsis, yet the underlying immunomodulatory mechanisms in pediatric sepsis remain insufficiently defined. This study aimed to elucidate key immune-related gene signatures and cellular features associated with pediatric sepsis.
Methods: Integrated bioinformatic analyses were applied to identify immunomodulatory-related differentially expressed genes (IRDEGs). Immune modulation was further characterized by computing immunomodulatory scores (IMSs) using single-sample gene set enrichment analysis (ssGSEA), followed by subgroup stratification and immune cell infiltration analysis.
Results: Five hub IRDEGs—MAPK14, S100A9, HP, SERPINB1, and SIGLEC5—were identified. Among these, MAPK14 exhibited a strong association with myeloid-derived suppressor cells (MDSCs), which were significantly enriched in patients with high IMSs.
Conclusion: These findings reveal novel immunomodulatory axes in pediatric sepsis, emphasizing the role of MAPK14 and MDSCs. This work provides potential biomarkers and therapeutic targets for improving the clinical management of pediatric sepsis.
Keywords: pediatric sepsis, immunomodulation, machine learning, least absolute shrinkage and selection operator, myeloid-derived suppressor cells
Introduction
The intricate interplay between pro- and anti-inflammatory processes, which initiates serious infections with impaired organ function, is the basis of the death race between pathogens and the host immune system.1,2 The host’s disproportionate reaction to pathogens contributes to pediatric sepsis, which is characterized by high morbidity and mortality.3,4 Sepsis is responsible for more than 20% of pediatric fatalities globally, with children aged under 5 being particularly susceptible. At the onset of sepsis, 67% of these children show multiple organ dysfunction syndrome (MODS).5 Currently, there is no particularly efficacious treatment for sepsis apart from standard and supportive care, and severe sepsis still constitutes a leading cause of death. Moreover, existing diagnostic and therapeutic approaches for pediatric sepsis still fall short of clinical demands. Therefore, there is an urgent need to refine diagnostic accuracy, develop more effective treatments, and improve patient outcomes and prognosis-ultimately alleviating the financial burden on families and society.6,7
Mounting evidence indicates that immunomodulation has major effects on the development, prognosis and outcome of pediatric sepsis. This regulation of immune function involves interactions between immune cells and molecules in the immune system, as well as other systems such as the neuroendocrine system, to guarantee the most suitable level and form of immune response. If the immune response to external pathogenic microorganisms cannot be properly regulated, it could exert harmful effects on the body.8 Consequently, the immunomodulatory system decides not only the necessity of an immune reaction but also its intensity. The regulation is finely tuned and highly complex, exerting control over multiple phases of the immune response.9
The current definition of sepsis refers to a “dysregulated host response to infection”, and patients with sepsis could exhibit both enhanced inflammatory response and immunosuppression. The consequence of the former is early tissue damage and organ malfunction, while the latter, in extreme and persistent cases, causes multiple fatal complications, drastically increasing the mortality of kids in the middle and late stages of sepsis.10,11
However, it is a misconception to simply regard pediatric sepsis as a scaled-down version of adult sepsis. Essential distinctions exist between adult and pediatric sepsis in clinical presentation, pathogen spectrum, and immune response patterns. The pediatric immune system is in a state of dynamic development, and its innate immune cell function (such as the response of neutrophils and macrophages) and adaptive immune cell repertoire (predominantly composed of naive T cells) significantly differ from the mature immune system of adults. This immaturity and rapid variability result in a more unique pattern of immune dysregulation in pediatric patients, potentially favoring specific states of immunosuppression. Elucidating these immunological distinctions is crucial for understanding the specific pathological mechanisms in pediatric sepsis.
Immunosuppression in sepsis cases involves multiple cell types and features, which are associated with increased immune cell apoptosis, T cell depletion, cell reprogramming via epigenetic alterations, and decreased biosynthesis of activated cell surface molecules.12 Myeloid-derived suppressor cells (MDSC), also known as immature myeloid cells, are thought to possess immunosuppressive functions. Recent evidence indicates that these cells may be involved in immune dysfunction in sepsis, controlling the immune response. In sepsis, MDSC might play a dual role according to the disease stage. First, they can limit excessive inflammation in the early disease stage, allowing organs to gain protection from early dysfunction. In contrast, they can be deleterious by intensifying prolonged immunosuppression and promoting chronic critical illness (CCI) and/or persistent inflammation, immunosuppression, and catabolism syndrome (PICS).13 It is known that immune processes, eg, the secretion of inflammatory cytokines and chemokines, the manifestation of inhibitory receptors and the respective ligands, and changes in immune cell numbers and/or activity, are indispensable for the onset and progression of sepsis, as well as for the immunomodulatory processes of sepsis.
With the development of bioinformatics and immunology, in recent years, many studies have employed bioinformatics methods to examine large-scale and high-throughput genomic data for the early diagnosis of adult sepsis and the identification of biomarkers and immunotherapy targets. However, immune genes and the specific mechanisms of immune cells in childhood sepsis have not been examined. Therefore, this study aimed to conduct an in-depth assessment of the immune regulation mechanism of childhood sepsis, as well as a stratified analysis through Weighted Gene Co-expression Network Analysis(WGCNA), Least Absolute Shrinkage and Selection Operator (LASSO) and consensus clustering, to explore the immune characteristics of pediatric sepsis, which may better guide clinical diagnosis and treatment.
Materials and Methods
Data Acquisition and Preprocessing
The gene expression datasets GSE1390414 and GSE6968615 for pediatric sepsis patients were downloaded using the R package GEOquery16 from the GEO database.17 The GSE13904 dataset comprised a total of 227 whole blood samples from children, categorized as follows:51 samples from children with Systemic Inflammatory Response Syndrome (SIRS), 52 samples from children with sepsis, 106 samples from children with septic shock, and 18 samples from healthy children. The data were processed on the GPL570 [HG-U133_Plus_2] Affymetrix Human Genome U133 Plus 2.0 Array platform. The GSE69686 dataset contained a total of 149 pediatric whole blood samples. These samples were comprised of: 39 from children with clinical sepsis, 25 from children with sepsis, 58 from uninfected children, and 27 from uninfected children with chorioamnionitis. The data were processed on the GPL20292 [hGlue_3_0] Custom Affymetrix Human Transcriptome Array platform.
The case classifications within the aforementioned public datasets were all based on the pediatric-specific sepsis diagnostic criteria adhered to at the time of their original publication. GSE13904 followed the 2005 International Pediatric Sepsis Consensus Conference definition, while GSE69686 utilized a clinical definition based on organ dysfunction prevalent during its study period. Crucially, these definitions did not adopt the Sepsis-3 standard based on the adult SOFA score; instead, they incorporated age-specific physiological and clinical parameters necessary to identify severe systemic responses caused by infection in children. By integrating and analyzing this data, our study aims to explore common molecular features related to immune response dysregulation in children who meet the traditional pediatric sepsis definitions.
To precisely identify the core transcriptional features associated with infectious sepsis (rather than generalized systemic inflammation), we filtered the GSE13904 dataset. Specifically, we excluded samples from children with SIRS of non-infectious etiology to avoid interference from non-specific inflammatory signals. Meanwhile, we temporarily excluded samples from children with septic shock to focus on the fundamental pathophysiological state of sepsis, thereby preventing the masking of core signals by the extreme phenotype of the terminal disease stage. Subsequent analysis included the expression profile data from 52 whole blood samples of children with sepsis (Sepsis Cohort) and 18 whole blood samples of normal children (Control Cohort) from the GSE13904 dataset. All samples from the GSE69686 dataset were considered in the following analysis. The detailed dataset information can be found in Table 1.
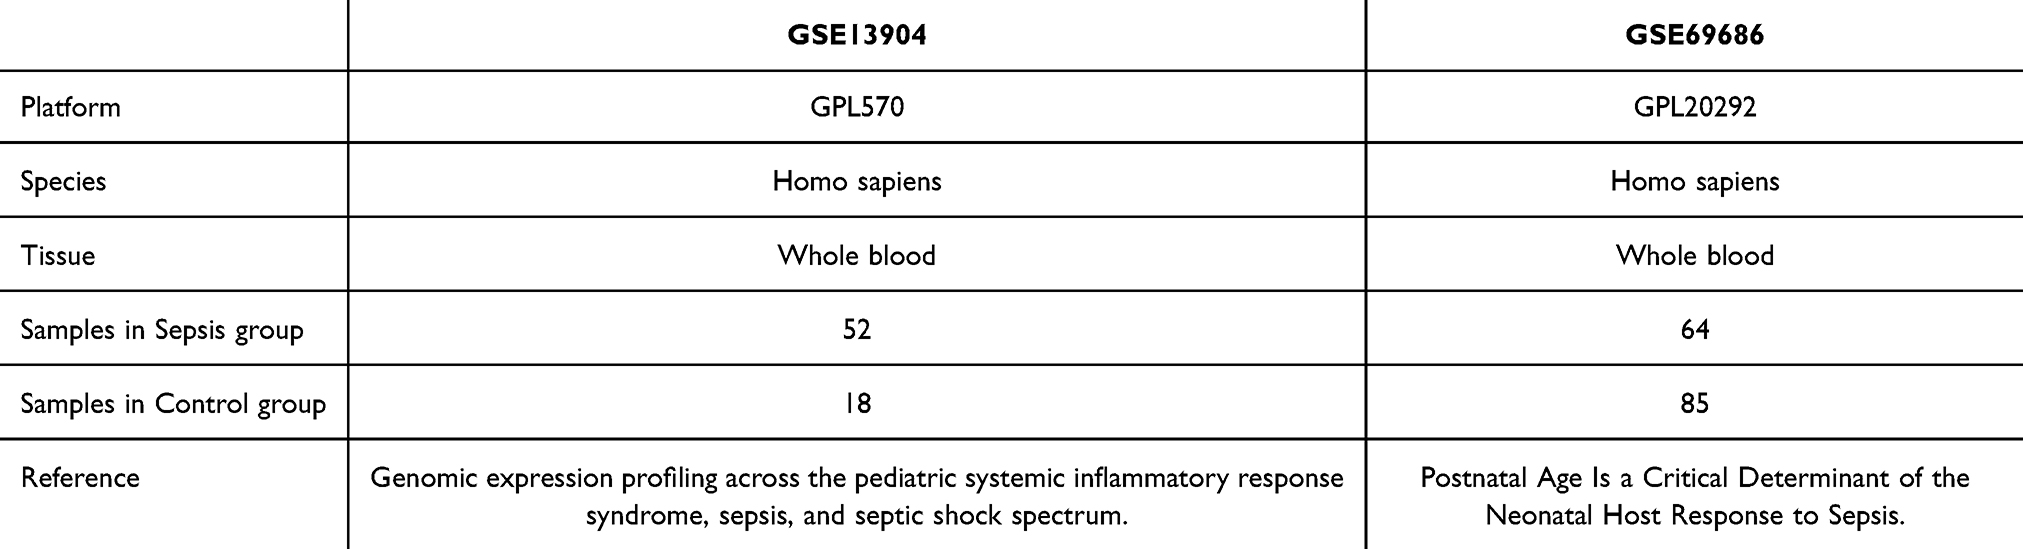 |
Table 1 Sepsis Data Set Information List |
Besides, Immunomodulatory-Related Genes (IRGs) were retrieved from the GeneCards database18 (https://www.genecards.org/). Our final set of IRGs consisted of 205 after filtering for “Protein Coding” and “Relevance Score > 1” using the keyword “Immunomodulatory”. The specific gene names can be found in Supplementary Table 1.
Identification of IRDEGs
The R package limma was employed to investigate GSE13904 (training dataset) and GSE69686 (validation dataset) to uncover the possible mechanisms, biological functions, and pivotal signaling pathways in pediatric sepsis. Initial data processing involved normalization of both GSE13904 and GSE69686 datasets using established microarray preprocessing protocols. Subsequent differential expression analysis was performed to systematically identify DEGs between clinical subgroups within each dataset. The DEGs meeting the selection criteria of log2FC > 0.5 and adjusted p-value (P.adj) < 0.05 were classified as upregulated DEGs, while genes with log2FC < −0.5 and P.adj < 0.05 were defined as downregulated DEGs.
We performed an intersection analysis of DEGs identified in both datasets, with the overlapping genes visualized via Venn diagrams to determine common differentially expressed genes (DEGs). The resulting common DEGs were subsequently cross-referenced with our curated list of IRGs through additional Venn analysis to identify pediatric sepsis-associated IRDEGs. The differential expression patterns were visualized using volcano plots generated with the ggplot2 R package and hierarchical clustering heatmaps created using the pheatmap R package.
Functional Enrichment Analyses
The R package ClusterProfiler19 was utilized to analyze IRDEGs with Gene Ontology (GO)20 and Kyoto Encyclopedia of Genes and Genomes (KEGG)21 pathway enrichment analyses. GO analysis is an approach for extensive functional enrichment analyses, revealing biological process (BP), molecular function (MF), and cellular component (CC). KEGG is a comprehensive knowledge base that provides systematic integration of genomes, biological pathways, diseases, and drugs. The significance thresholds were set at P.adj < 0.05 and false discovery rate (FDR/q-value) < 0.05, with Benjamini-Hochberg (BH) correction applied for multiple testing.
Gene Set Enrichment Analysis (GSEA)
GSEA22 is employed to evaluate the distribution pattern of genes from a predefined gene set within a phenotype-correlated ranked gene list, thereby assessing their potential contribution to the observed phenotype. In this study, all DEGs in the pediatric sepsis datasets (GSE13904 and GSE69686) were subjected to enrichment analysis using the clusterProfiler package. The parameters used were as follows: seed set to 2020, number of calculations set to 1000, minimum gene set size of 10, maximum gene set size of 500, and the P-value adjustment method set to BH. The c2.cp.all.v2022.1.Hs.symbols.gmt [All Canonical Pathways] (3050 gene sets) was retrieved from the Molecular Signatures Database (MSigDB)23 and used as the reference gene set. The significantly enriched pathways were selected based on the criteria of P.adj < 0.05 and FDR/q-value < 0.05.
WGCNA
WGCNA24 utilizes the correlation coefficients of normalized gene expression to evaluate the co-expression relationship between genes, defining genes with co-expression relationships as a module. The expression levels within the same module are comparable, while those of genes in different modules are markedly different. This analytical method can uncover the relationships between gene co-expression modules and clinical phenotypes, thus shedding light on the biological significance of these modules. This analysis was conducted using the R package WGCNA,25 with RsquaredCut of 0.90, minimum module gene number of 100, and module merging cut height of 0.2. By doing so, we were able to identify co-expression modules between genes from different clinical subgroups (Sepsis/Control Cohort) within the GSE13904 dataset. By correlating the co-expression modules with the clinical subgroups, we were able to identify the genes within the top three most correlated modules. These genes were then intersected with IRDEGs to obtain Module Immunomodulatory-related Differentially Expressed Genes (Module IRDEGs).
Feature Selection and LASSO Risk Model Development
Random Forest (RF)26 is a popular method for building predictive models, whose core involves constructing multiple independent decision trees through random sampling of data and features. The purpose of cross-validation is to tackle the problems of a single test result being too narrow and a lack of sufficient training data. Our model was built leveraging the expression levels of IRDEGs from the GSE13904 dataset, using the randomForest package.27 Our next step was to perform five runs of ten-fold cross-validation, then refine the number of variables by analyzing the cross-validation curve.
By adding a penalty term and reducing overfitting, LASSO regression analysis28 improves linear regression’s generalization ability. A LASSO risk model was developed by performing LASSO regression analysis, implemented via the R package glmnet,29 on the features selected through RF. The RiskScores for the GSE13904 and GSE69686 datasets were calculated by entering the key gene expression levels into the RiskScore formula. Then, we divided both datasets into High-risk and Low-risk Groups based on the median RiskScore within their respective Sepsis Cohorts. The key genes for our subsequent analysis were IRDEGs identified within the LASSO risk models. The LASSO RiskScore formula was derived as follows:

Animals, Grouping, and Experimental Design
Twelve male SD rats at postnatal day 14 (PND-14) (weight range: 30–40g) were purchased from Ziyuan Laboratory Animal Co. in Hangzhou. All animals were specific pathogen-free (SPF), housed under standard SPF conditions in the animal facility with ad libitum access to food and water, and acclimatized for 3–5 days prior to any experimental procedures. No genetic modifications were involved, and no previous procedures had been performed on them.
The animal experiment was designed as an exploratory validation study aimed at confirming the directionality of gene expression changes rather than performing mechanistic confirmation. The sample size is consistent with similar preliminary transcriptomic validation studies in sepsis research. To ensure the rigor and minimize systematic bias in this design, the animals were randomly divided into the sepsis group (n=6) and the control group (n=6) using a computer-generated random number sequence. Since this was an exploratory study and a formal power calculation was not feasible a priori, the sample size (n=6 per group) was determined based on preliminary data and common practice in similar studies investigating gene expression in rodent sepsis models. To minimize potential confounders, the order of treatments (injections and blood collection) was also randomized, and the cage positions of the animals were regularly rotated. Although blinding was not performed during the animal treatment and sample collection (due to the evident physical differences—eg, lethargy, piloerection—between LPS-treated and saline-control animals), the researcher who performed the quantitative polymerase chain reaction (qPCR) data analysis was fully blinded to the group allocation.
The primary outcome measure was the expression level of MAPK14, as it was the most significantly dysregulated gene in our preliminary bioinformatics analysis. The other four genes were considered secondary outcome measures. All animals that completed the 24-hour LPS challenge protocol were included in the analysis. No animals or data points were excluded.
Animal Modeling and qPCR Validation
The rats of the sepsis and control groups were injected with 100μL of LPS (10 mg/kg, i.p) and saline, respectively. Following a 24-hour LPS challenge, peripheral blood was collected from the retro-orbital venous plexus in isoflurane-anesthetized PND-14 rats (3% induction, 1.5% maintenance) and immediately processed for qPCR. All procedures, including isoflurane euthanasia, were performed in accordance with the Guide for the Care and Use of Laboratory Animals.
The RNAeasy Blood RNA Extraction Kit (Beyotime, China) was utilized for total RNA extraction from peripheral blood, in line with the manufacturer’s protocol. Subsequently, the Hifair II1st Strand cDNA Synthesis Kit (Yeasen, China) was employed for cDNA synthesis. Finally, qPCR utilized the Hieff qPCR SYBR Green Master Mix (Yeasen, China). GAPDH expression was employed for normalization. A Fluorescence Quantitative PCR Instrument (Jingle Scientific Instruments, Hangzhou) was employed to conduct qPCR, with gene expression determined by the 2−ΔΔCt method. Supplementary Table 2 contains the gene-specific PCR primers employed.
Diagnostic Performance of Key Genes and Validation Of LASSO Model
In a Cartesian coordinate system, a nomogram30 visually depicts the functional relationships among several independent variables using a cluster of non-intersecting line segments. With the help of the R package rms, we intended to generate a nomogram based on the results of the LASSO regression analysis. This nomogram visualized the interplay between key gene expression and pediatric sepsis diagnosis within the GSE13904 and GSE69686 datasets. Decision Curve Analysis (DCA)31 provides a simple and effective way to evaluate the utility of clinical prediction models, diagnostic tests, and molecular markers. With the R package ggDCA, the DCA plots were generated from two datasets using key genes. Our final step was to plot Receiver Operating Characteristics (ROC) curves for LASSO Riskscores from both datasets and calculate the Area Under the Curve (AUC) using the R package pROC. By doing so, we were able to evaluate the diagnostic accuracy of the LASSO RiskScore expression in predicting pediatric sepsis.
ssGSEA and IMS Construction
It is possible to quantify the relative abundance of infiltrating immune cells32,33 and to label the types of immune cells that are infiltrated using the ssGSEA algorithm. The enrichment scores calculated in the R package GSVA indicate the level of different immune cell types infiltrating each sample. As a first step, we calculated the infiltration abundance differences of 28 immune cells between the Sepsis and Control Cohorts in GSE13904. Our next step was to analyze the correlations among immune cells, along with the correlations between immune cells and key genes, within the Sepsis and Control Cohorts of this dataset. A final step was to visualize the corresponding plots using the R package ggplot2.
The expression matrices of key genes were analyzed employing the ssGSEA34 algorithm with the R package GSVA35 on the GSE13904 and GSE69686 datasets, respectively, to calculate the IMSs. According to their median IMSs, we divided both Sepsis Cohorts from both datasets into High-score and Low-score Groups. As a next step, we plotted ROC curves for the key genes in two datasets and calculated the Area Under the Curve (AUC) for each ROC curve. The purpose of this was to evaluate the diagnostic effectiveness of IMSs.
In addition, we carried out ssGSEA analysis on all genes, comparing both High-score and Low-score Groups, and the cluster 1 and cluster 2 derived from consensus clustering, all within the Sepsis Cohort of the GSE13904 dataset.
Consensus Clustering
The consensus clustering algorithm36 is used for identifying robust and consistent sample groupings by applying each clustering algorithm multiple times over a subset of the data and then combining the results. For the subtyping of samples, we used the R package ConsensusClusterPlus37 to perform consensus clustering on the key genes in GSE13904. Moreover, we conducted Principal Component Analysis (PCA)38 on each subtype in order to observe the differences between them.
Statistical Analysis
Throughout this article, R software (Version 4.1.2) was used for all data processing and analysis. The non-parametric Mann–Whitney U-test was selected for group comparisons because the sample size was small and the normality assumption could not be verified using the Shapiro–Wilk test (P < 0.05). In comparison with the two groups, the two-tailed Mann–Whitney U-test (Wilcoxon rank-sum test) was utilized. In instances involving three or more groups, Kruskal–Wallis test was employed for comparisons. Post-hoc pairwise comparisons were performed with Dunn’s test and adjusted for multiple comparisons via the Benjamini-Hochberg method (FDR < 0.05). Categorical variables were analyzed by Chi-squared test or Fisher’s exact test, depending on the nature of the data. The correlation coefficients between different molecules were calculated using Spearman correlation analysis, and a P-value less than 0.05 was considered statistically significant.
Results
Identification and Functional Enrichment of IRDEGs
The flow chart of this study is shown in Figure 1. To integrate the GEO datasets (GSE13904 and GSE69686) originating from two different microarray platforms, we adopted a rigorous two-step preprocessing strategy. Firstly, we independently performed background correction, quantile normalization, and log transformation on the raw data of each dataset using the limma package in R, ensuring within-dataset comparability (detailed in Supplementary Figure 1A–D). Subsequently, to eliminate the platform differences (batch effects) between the two datasets, we only retained the common genes present across both platforms and applied the ComBat function from the sva package to perform empirical Bayes correction on the merged data. This procedure effectively removed the batch effects, allowing biological variation to become the primary source of data variation, thus providing stable input data for the subsequent WGCNA analysis. There were 70 samples in the GSE13904 dataset, including 52 from children with sepsis and 18 from healthy children. Additionally, there were 149 samples in the GSE69686 dataset, including 64 pediatric sepsis and 85 control samples.
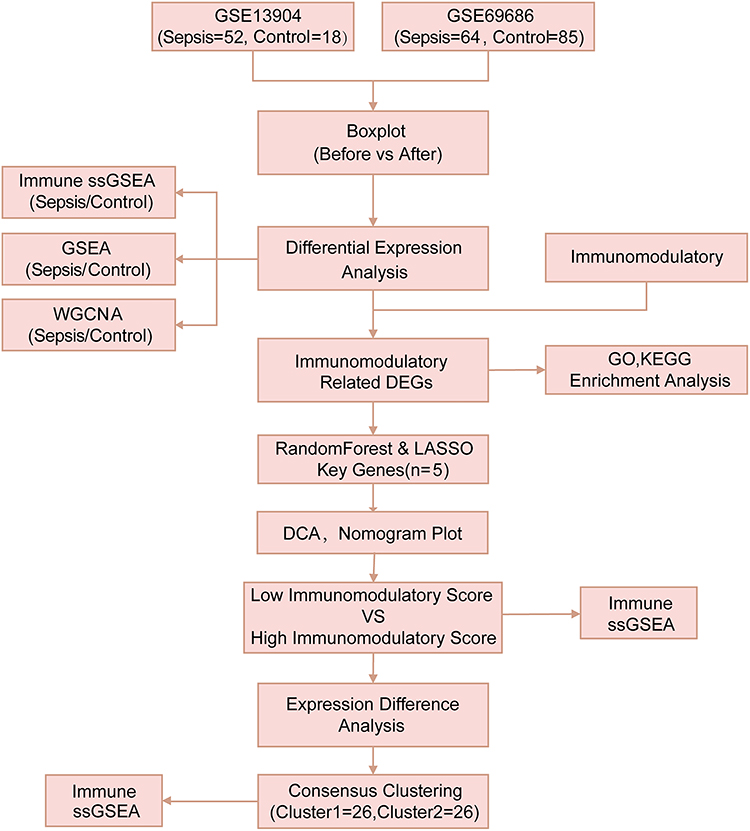 |
Figure 1 Technology Roadmap. The study flowchart of integrated bioinformatics and experimental validation for identifying sepsis-related immune signatures. |
The outcomes of the differential analysis showed that GSE13904 yielded 21653 DEGs, of which 328 met the criteria of |logFC|>0.5 and P.adj <0.05. In comparison to the Control Cohort, 68 genes in the Sepsis Cohort were downregulated, while 260 were upregulated. In GSE69686, there were 18946 DEGs. Based on the same criteria, 477 genes were upregulated and 103 genes were downregulated in children with sepsis, versus the Control Cohort. The differential analysis results from the two datasets are visualized with a volcano plot (Figure 2A and B). The next step is to take the intersection of the DEGs in the two datasets mentioned above and create a Venn diagram (Figure 2C). Subsequently, the common DEGs and IRGs were interposed. As a result, a total of 11 IRDEGs identified were shown in Figure 2D.
 |
Figure 2 The difference analysis between GSE13904 and GSE69686. (A) The Volcano plot of DEGs between the Sepsis Cohort and Control Cohort in GSE13904. (B) The Volcano plot of DEGs between the Sepsis Cohort and Control Cohort in GSE69686. Differential gene expression was depicted by colored dots: red (upregulated), blue (downregulated), and grey (non-significant). (C) The Venn diagram of DEGs in GSE13904 and GSE69686. (D) The Venn diagram of common DEGs and IRGs. (E) The chromosomal mapping of IRDEGs. (F) The heatmap of IRDEGs in GSE13904. (G) The heatmap of IRDEGs in GSE69686. (H) The differential expression analysis of IRDEGs in GSE13904. (I) The differential expression analysis of IRDEGs in GSE69686. (The symbol *** is equivalent to p < 0.001, which is highly statistically significant.). |
To map the chromosomal distribution of 11 IRDEGs, we relied on the RCircos package for positional annotation (Figure 2E). According to Figure 2E, these IRDEGs were primarily located on chromosomes 1, 2, 4, 6, 12, 16, 19, and X. Building on this, we further explored the differential expression of these 11 IRDEGs across different clinical subgroups in GSE13904 and GSE69686. This was visualized with a combination of heatmaps (Figure 2F and G) and group comparison plots (Figure 2H and I). Based on our differential expression analyses, all 11 IRDEGs (HP, SERPINB1, MAPK14, SIGLEC5, ITGAM, TLR2, TLR8, IL18R1, CLEC4E, and IL1R1) were significantly differentially expressed between the two clinical subgroups (Sepsis/Control Cohort) in both datasets.
To explore the associations of 11 IRDEGs with sepsis in children, we initially conducted GO and KEGG pathway analyses (Table 2). The 11 IRDEGs showed significant enrichment in specific GO terms. In the BP category, they were mainly involved in the regulation of interleukin-12 production, regulation of inflammatory response, positive regulation of leukocyte-mediated immunity, and reactive oxygen species metabolic process. For the CC category, the enrichments were observed in secretory granule lumen, cytoplasmic vesicle lumen, vesicle lumen, external side of plasma membrane, and tertiary granule. Regarding the MP category, the genes were associated with NAD+ nucleosidase activity, pattern recognition receptor activity, antioxidant activity, immune receptor activity and MAP kinase activity. In addition to GO enrichment, these 11 IRDEGs were also mainly enriched in several KEGG pathways, including Tuberculosis, Neutrophil extracellular trap formation, IL-17 signaling pathway, Hematopoietic cell lineage, and TNF signaling pathway. The GO enrichment data were visualized using bubble plots (Figure 3A) and ring network diagrams (Figure 3B–D), while the KEGG pathway enrichment data were displayed via bar graphs (Figure 3E) and divergent network diagrams (Figure 3F).
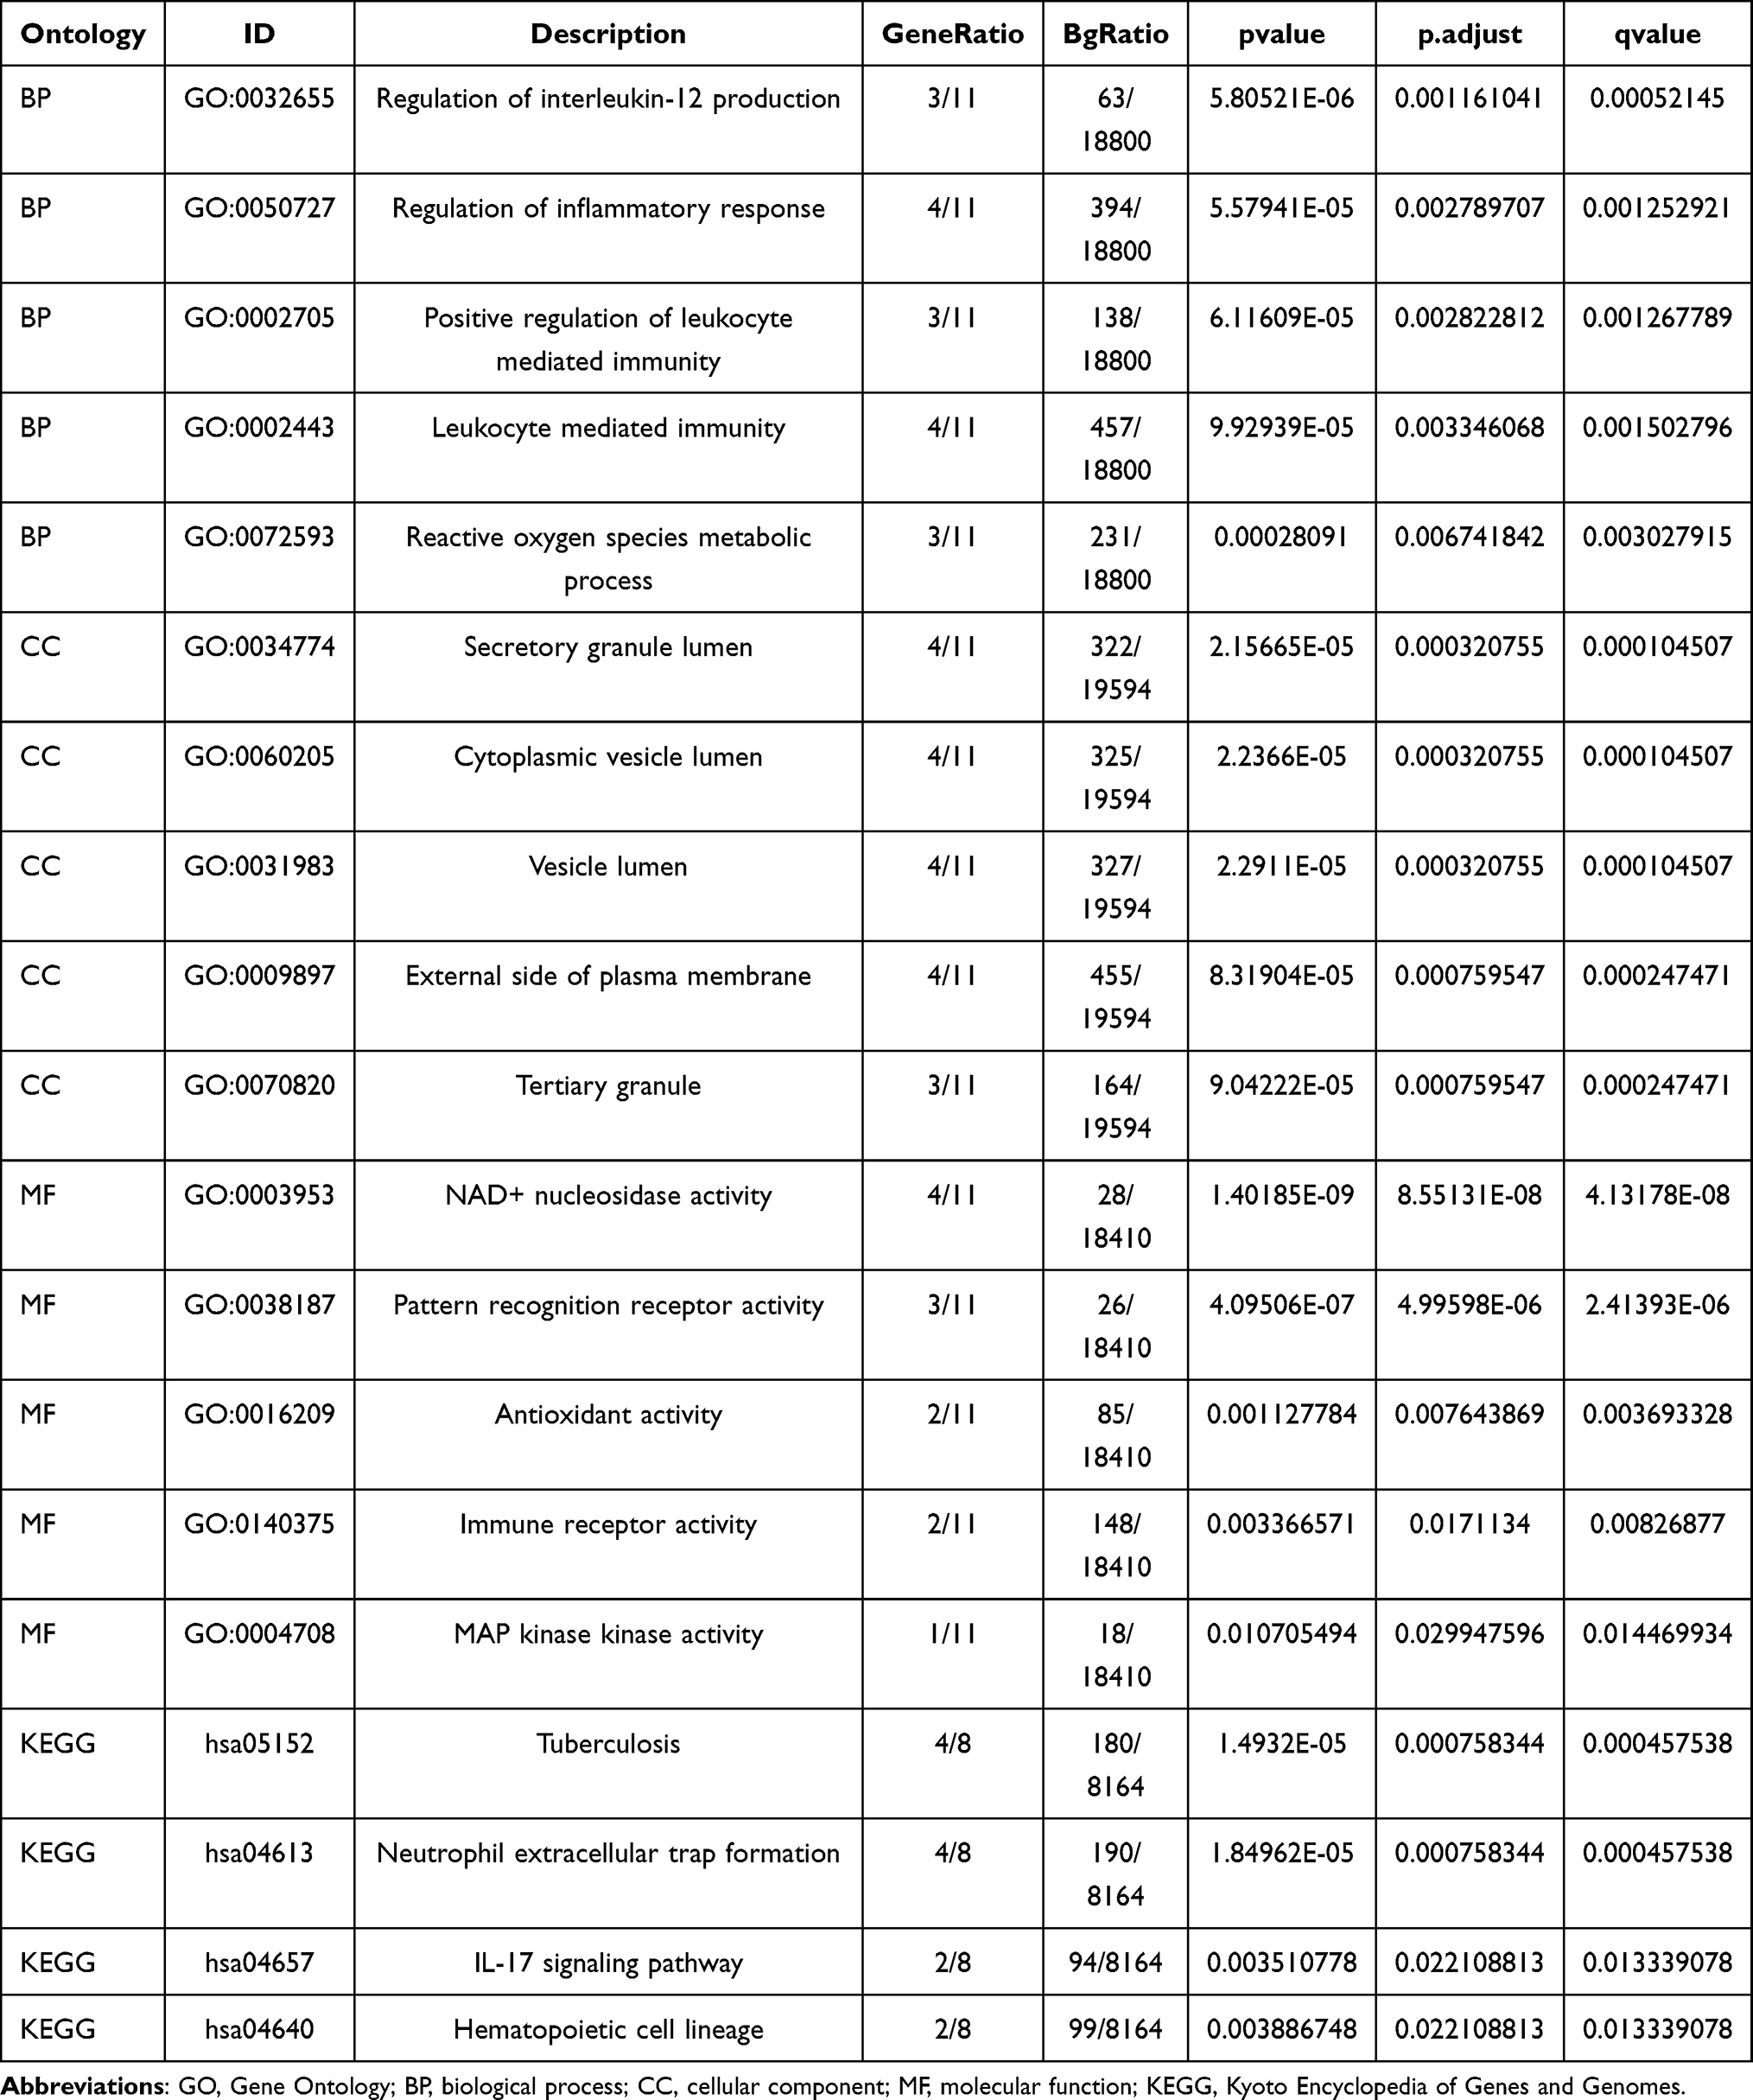 |
Table 2 GO KEGG Enrichment Analysis Results |
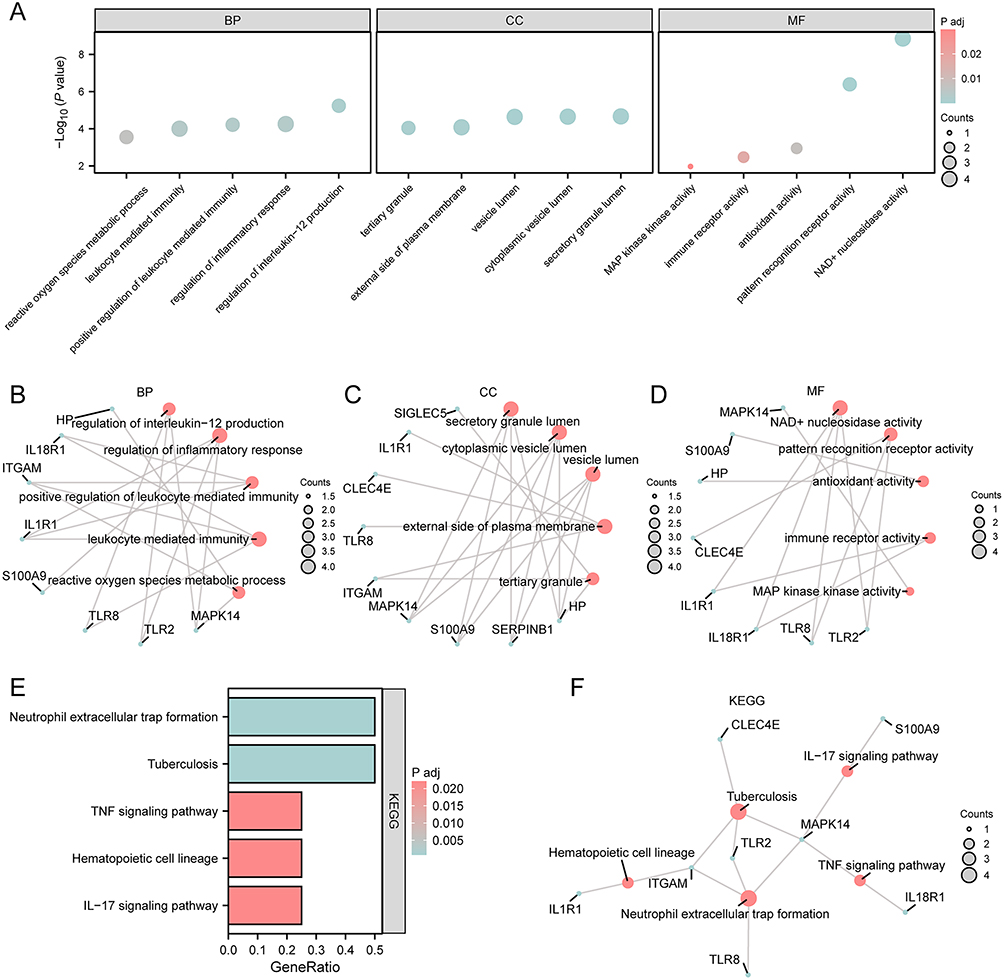 |
Figure 3 GO and KEGG analyses of IRDEGs. (A) The bubble plots of GO enrichment analyses for IRDEGs (BP, CC, MF category). The size of the circle reflected the number of counts. (B–D) The ring network plots of GO terms enriched in IRDEGs, categorized into BP (B), CC (C), and MF (D). (E) The bar plot of KEGG functional enrichment analysis of IRDEGs. The gradient bar color scale reflected the P.adj magnitude, where darker hues denote enhanced enrichment significance through progressively smaller p-values. (F) The divergence network plot of KEGG functional enrichment analysis of IRDEGs. (In the bubble plot (A), the ordinate was the magnitude of the p-value, and the abscissa was the category name. In the network plot (B–D and F), red dots represented specific pathways and blue dots represented specific genes. The screening criteria for GO/KEGG enrichment items were P.adj < 0.05 and FDR value (q-value) < 0.05. |
To ascertain the effects of genes linked to pediatric sepsis on this disease occurrence and development, GSEA was carried out to conduct an in-depth analysis of the connections between the biological processes, cellular components, and molecular functions influenced by the differentially expressed genes in both the GSE13904 and GSE69686 datasets. The DEGs in GSE13904 had significant enrichments in Signaling By Interleukins, Oxidative Stress Response, IL-4 Signaling Pathway, IL-6 7 Pathway, and additional pathways (Supplementary Figure 2A–E, Supplementary Table 3). The DEGs of GSE69686 were found to be notably enriched in Interleukin 1 Family Signaling, IL-1R Pathway, IL-1 Pathway, Neutrophil Degranulation, and additional pathways (Supplementary Figure 2F–J, Supplementary Table 4).
Identification of IRDEG-Enriched Modules via WGCNA
To assess gene expression differences between different clinical subgroups (Sepsis/Control Cohort) in the GSE13904 dataset, WGCNA was performed for all genes in different subgroups of GSE13904 to identify co-expression modules. This step was crucial as it focused the analysis on the genes with the most significant variability, potentially carrying more information about the differences between the subgroups.
Genes were pre-filtered by variances, retaining the top 90% most variable genes for downstream analysis. Subsequently, GSE13904 samples were clustered by clustering tree analysis, and the clustering results were displayed in Figure 4A. We determined the optimal power threshold by setting the screening criterion as 0.9 (Figure 4B). The top 90% genes of the GSE13904 dataset were involved in nine modules, including MEyellow, MEgreen, MEred, MEturquoise, MEblack, MEbrown, MEpink, MEblue and MEgrey (Figure 4C). Using a merge threshold of 0.2 (Figure 4C), we reclustered the top 90% genes and generated updated gene-module assignment visualizations (Figure 4D). Based on the grouping conditions in GSE13904 and expression patterns of the module genes, we identified the correlations between the 9 modules (MEyellow, MEgreen, MEred, MEturquoise, MEblack, MEbrown, MEpink, MEBlue and MEgrey) and clinical subgroups (Figure 4E). Finally, we took the intersection of 11 IRDEGs in GSE13904 with the module genes contained in the MEblue, MEbrown, and MEturquoise modules and drew a Venn diagram to obtain the module Immunomodulatory-Related Differentially Expressed Genes (Module IRDEGs), as shown in Figure 4F–H.
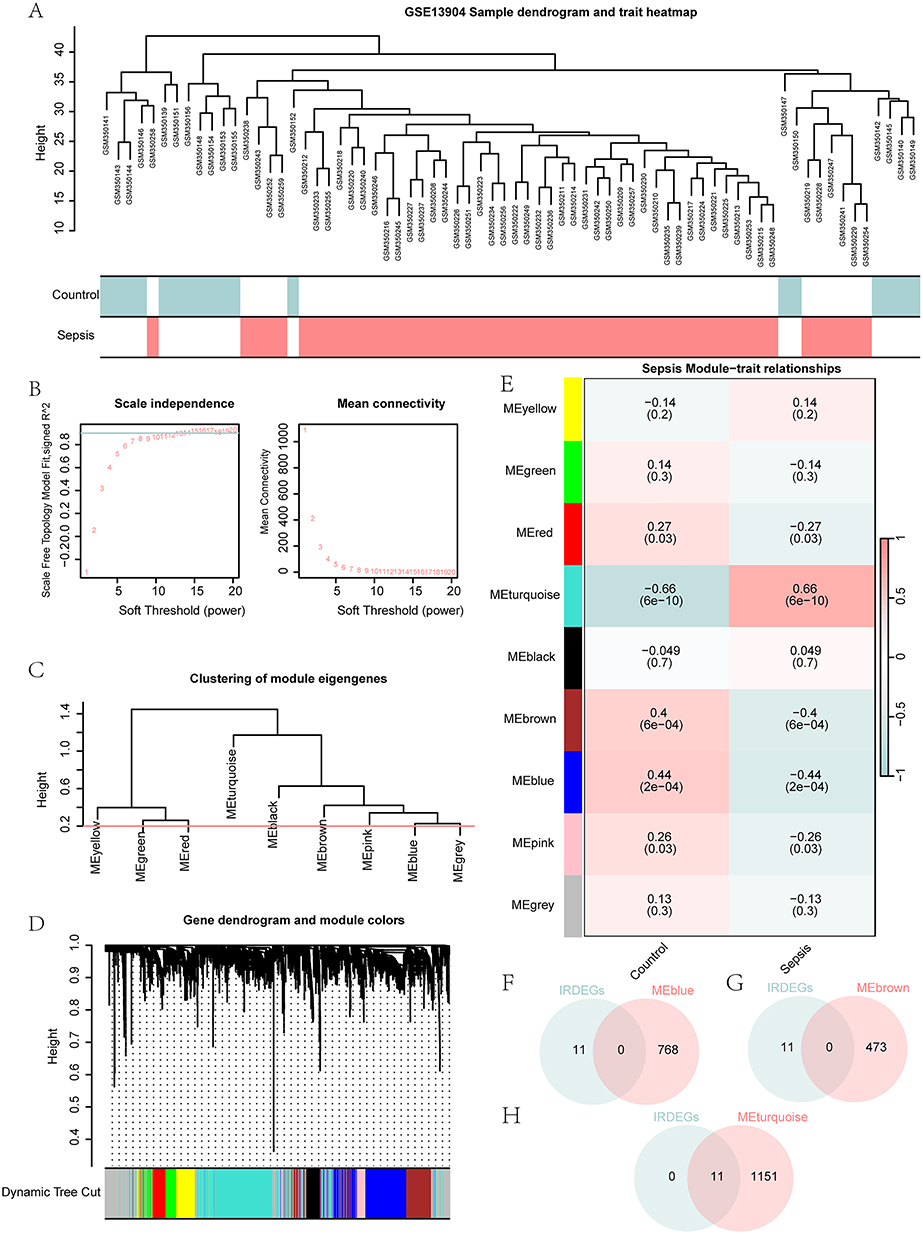 |
Figure 4 WGCNA identified co-expression modules in GSE13904. (A) The sample dendrogram and trait heatmap in GSE13904. (B) The analysis of network topology under different soft-thresholding powers in GSE13904. (C) The gene module dendrogram in GSE13904. (D) The visualization of the gene dendrogram and its respective module colors. (E) The visualization of module-trait association analysis between gene modules and clinical subgroups in GSE13904. (F–H) The Venn diagram of IRDEGs in GSE13904 with MEblue (F), MEbrown (G) and MEturquoise (H) module genes. |
Selection of Key Genes and LASSO Risk Model Construction
To evaluate the diagnostic performance of the 11 IRDEGs in GSE13904, RF was employed to investigate the levels of the 11 IRDEGs in the Sepsis and Control Cohorts. The error curve of decision trees was generated (Figure 5A) and the MeanDecreaseGini scatter plot (Figure 5B) of the 11 IRDEGs was then plotted for the screening of important genes. The higher the MeanDecreaseGini, the more important the genes for the grouping, that is, the greater the impact on the diagnosis of pediatric sepsis. Thereafter, the selection of the number of genes was guided by a cross-validation error curve (Figure 5C), which was generated by executing 10-fold cross-validation 5 times. The algorithm screened 5 IRDEGs with important effects on the diagnosis of pediatric sepsis.
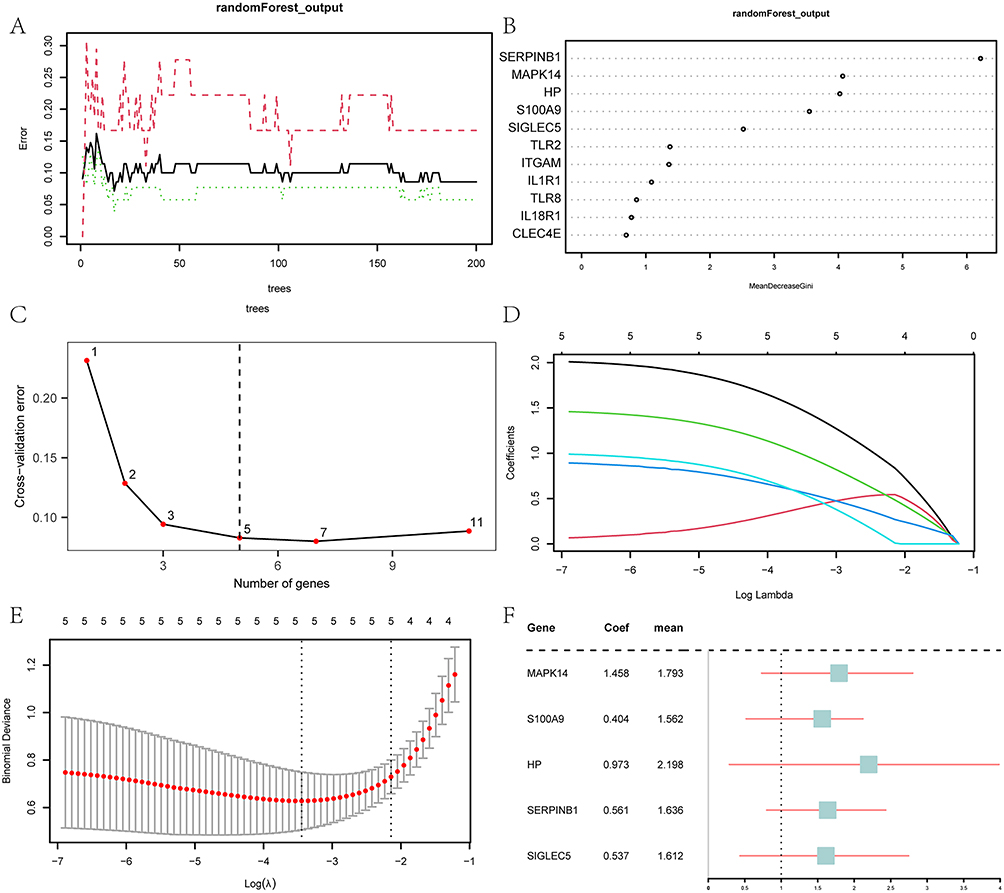 |
Figure 5 Screening of key genes and LASSO risk model construction. (A) The training error plot of the RF algorithm. (B) MeanDecreaseGini scatter plot of IRDEGs. (C) The cross-validation error plot. (D) The diagnostic model plot of the LASSO regression model. (E) The variable trajectory plot of the LASSO regression model. (F) The forest plot of key genes in the LASSO regression model. |
On the basis of the five IRDEGs identified by the RF algorithm, we constructed a LASSO risk model. As a visual representation of the regression results, the LASSO regression model diagram (Figure 5D) and the LASSO variable trajectory diagram (Figure 5E) were created. These data showed that the LASSO risk model contained a total of 5 IRDEGs, ie, MAPK14, S100A9, HP, SERPINB1 and SIGLEC5. In our subsequent research, these genes were designated as key genes, based on which a forest plot was plotted (Figure 5F).
In addition, by plugging the expression levels of these key genes into the RiskScore formula, we determined the RiskScore for each sample in GSE13904 and GSE69686. Based on the median RiskScore, the Sepsis Cohort samples were divided into Low-risk Group and High-risk Group. The formula for RiskScore calculation was thus:

Experimental Validation of Key Genes in a Rat Model
To confirm the expression of the five critical genes, qPCR was performed on peripheral blood specimens from 14-day-old rats. Compared with the control group, MAPK14 (1.005±0.099 vs 1.418±0.099) (Figure 6A) and SERPINB1 (1.042±0.220 vs 0.353±0.220) (Figure 6B) were significantly different in the model group. The change in the expression levels of these two genes was different, with elevated expression of MAPK14 and reduced expression of SERPINB1. S100A9 (1.012±0.174 vs 1.266±0.174) (Figure 6C), HP (1.039±0.215 vs 1.059±0.215) (Figure 6D) and SIGLEC5 (1.004±0.133 vs 1.360±0.133) (Figure 6E) were not significantly different in the sepsis samples. The qPCR analysis of MAPK14 results corroborated bioinformatics findings in the GEO datasets, indicating a validation of results.
 |
Figure 6 mRNA expression levels of 5 key genes in rat sepsis models. The comparisons of mRNA expression levels between the control and model groups for genes MAPK14 (A), SERPINB1 (B), S100A9 (C), HP (D) and SIGLEC5 (E). The bar plots showed the differences in mRNA expression levels between the control and model groups. The statistical method used to analyze the results was a paired sample t-test, with results expressed as mean ± standard deviation. (The symbol ns is equivalent to p ≥ 0.05 and has no statistical significance. The symbol * is equivalent to p < 0.05 and is statistically significant.). |
Diagnostic Evaluation of Key Genes and LASSO Risk Model
To comprehensively assess the diagnostic performance of key genes included in the LASSO risk model for pediatric sepsis, we adopted a systematic approach. Initially, to identify the impact of key genes on pediatric sepsis diagnosis, nomograms were generated from diagnostic models, illustrating the contribution of key gene expression within GSE13904 and GSE69686. Notably, in GSE13904, the expression levels of HP and MAPK14 played a significantly larger role in diagnosis compared to other variables (Supplementary Figure 3A). Similarly, analysis of GSE69686 revealed that SIGLEC5 and MAPK14 expression contributed markedly more to pediatric sepsis diagnosis than other variables (Supplementary Figure 3B).
Following this, to assess the clinical utility of the pediatric sepsis diagnostic models, we performed DCA on both datasets. The findings revealed that the models yielded a substantial net benefit and exhibited strong clinical performance, indicating that the potential benefits of treatment outweighed the associated risks (Supplementary Figure 3C and D).
Ultimately, the diagnostic utility of the LASSO risk model was validated by plotting ROC curves based on the RiskScore within both datasets, utilizing the R package pROC. The ROC curve for GSE13904 suggested that the expression of the RiskScore possessed a considerable degree of accuracy in the diagnosis of pediatric sepsis (Supplementary Figure 3E, AUC = 0.955). However, in GSE69686, the expression of the RiskScore presented with lower accuracy for pediatric sepsis diagnosis (Supplementary Figure 3F, AUC = 0.853).
Immune Landscape Differences Between Sepsis and Control in GSE13904
To gain deeper insight into the immune characteristics within GSE13904, we utilized the ssGSEA algorithm to calculate the infiltration abundance of 28 immune cell types in both the Sepsis and Control Cohorts. Subsequently, and analyzed the varying infiltration levels of these 28 immune cell types across the different cohorts, with the results displayed in a group comparison plot (Figure 7A). Our results showed that 18 immune cell types exhibited statistically significant differences in infiltration abundance, including Activated B cells, Activated CD8 T cells, Activated T cells, Central memory CD8 cells, Effector Memory CD4 cells, Gamma-Delta T cells, Immature B cells, Regulatory T cells, Type 1 T helper cells, Activated Dendritic cells, CD56bright Natural Killers, CD56dim Natural Killers, Macrophages, Mast Cells, MDSC, Monocytes, Natural Killers, Neutrophils, and Plasmacytoid Dendritic cells.
 |
Figure 7 ssGSEA immune characteristics in GSE13904. (A) The visualization of ssGSEA immune infiltration analysis between the Sepsis Cohort and Control Cohort in GSE13904. (B) The presentation of the correlation analysis of immune cell infiltration abundance in GSE13904. (C) The correlation scatter plots of immune cells and key genes in GSE13904. (The symbol ns is equivalent to p ≥ 0.05 and has no statistical significance. The symbol * is equivalent to p < 0.05 and is statistically significant. The symbol ** is equivalent to p < 0.01 and is highly statistically significant. The symbol *** is equivalent to p < 0.001 and is highly statistically significant.). |
Subsequently, we analyzed the correlations among the infiltration abundances of these 18 immune cells. The results consistently demonstrated significant positive correlations among them (Figure 7B). In parallel, we explored the correlations between the infiltration abundances of these 18 immune cells and the expression levels of five key genes (MAPK14, S100A9, HP, SERPINB1, SIGLEC5). Our analysis showed that the infiltration abundances of these 18 immune cells were significantly correlated with the expression of the five key genes, predominantly exhibiting positive correlations (Figure 7C).
IMS Stratification and Correlation with Key Genes
Within Sepsis Cohorts of the GSE13904 and GSE69686 datasets, the ssGSEA was conducted on the expression matrices of five key genes (MAPK14, S100A9, HP, SERPINB1, SIGLEC5) to obtain IMSs for each sample. Following this, the Sepsis Cohort samples in both datasets were stratified into High-score and Low-score Groups based on the median IMSs. The group comparison plots were visually presented to compare the differential expression values of key genes between the two scoring groups in the two datasets.
The results revealed that in GSE13904, the three key genes (MAPK14, SERPINB1, SIGLEC5) exhibited extremely statistically significant differences between the two scoring groups, and the two key genes (S100A9 and HP) showed statistically significant differences (p <0.01), and all of which were highly expressed in High-score Group (Supplementary Figure 4A). In GSE69686, all five key genes (MAPK14, S100A9, HP, SERPINB1 and SIGLEC5) also showed significant differences between the two scoring groups (p <0.001) and were notably upregulated in High-score Group (Supplementary Figure 4B).
Next, these ROC curves were generated based on the expression levels of 5 key genes (MAPK14, S100A9, HP, SERPINB1, SIGLEC5) within the Sepsis Cohort, comparing their expression between the two scoring groups across two datasets. The goal was to validate the diagnostic utility of the IMS.ROC curve analysis revealed HP (AUC=0.725, Supplementary Figure 4C), MAPK14 (AUC=0.791, Supplementary Figure 4D), S100A9 (AUC=0.703, Supplementary Figure 4E), SERPINB1 (AUC=0.819, Supplementary Figure 4F) and SIGLEC5 (AUC=0.859, Supplementary Figure 4G) had a diagnostic potential in GSE13904. In addition, in GSE69686, MAPK14 (AUC=0.879, Supplementary Figure 4H), S100A9 (AUC=0.810, Supplementary Figure 4I), SERPINB1 (AUC=0.873, Supplementary Figure 4J) and SIGLEC5 (AUC=0.899, Supplementary Figure 4K) had certain diagnostic potential, while HP (AUC=0.965, Supplementary Figure 4L) had a higher diagnostic performance.
Immune Feature Differences Between High and Low IMS Groups in GSE13904
To further investigate the immune characteristics of pediatric sepsis patients in GSE13904 and delineate the differences in immune infiltration between High-score and Low-score Groups, we conducted ssGSEA analysis on the Sepsis Cohort from this dataset, quantifying the infiltration levels of 28 immune cell types across both scoring groups. The degrees of infiltration differences of the 28 immune cell subsets were compared, and the results were presented through a group comparison plot (Figure 8A). The results showed significant abundance differences for six immune cell types, including Type 1 T helper cells, Activated dendritic cells, Macrophages, Mast cells, MDSC, and Natural killers. Subsequent research findings demonstrated a prevailing positive correlation between immune cells and genes across the two scoring groups within this dataset (Figure 8B and C). Furthermore, the stratified analysis yielded consistent findings with the aforementioned results. In Low-score Group of this dataset, the majority of key genes demonstrated significant positive correlations with immune cells. In High-score Group, the key gene MAPK14 exhibited marked positive correlations with all six immune cell subtypes analyzed (Figure 8D and E).
 |
Figure 8 ssGSEA immune characteristics between High and Low IMS Groups in GSE13904. (A) The group comparison plot of ssGSEA immune infiltration analysis between High-score/Low-score Groups in GES13904. (B and C) The correlation analysis of immune cell infiltration abundance among immune cells in Low-score (B) and High-score Groups (C) of pediatric sepsis patients from the GSE13904 dataset. (D and E) The correlation scatter plot of immune cells and key genes in Low-score (D) and High-score Groups (E) of pediatric sepsis patients from the GSE13904 dataset. (The symbol ns is equivalent to p ≥ 0.05, which has no statistical significance. The symbol * is equivalent to p < 0.05, which is statistically significant. The symbol ** is equivalent to p < 0.01, which is highly statistically significant.). |
Identification of Sepsis Subtypes via Consensus Clustering
To investigate the expression differences of key genes in pediatric sepsis patients from the GSE13904 dataset, we performed consensus clustering using the R package ConsensusClusterPlus. This analysis identified two sepsis-related subtypes (cluster 1 and cluster 2) (Figure 9A), with each subtype containing 26 samples. Furthermore, the PCA analysis of the expression matrix showed significant divergence between the two subtypes (Figure 9B). Meanwhile, we displayed the consensus clustering CDF plot (Figure 9C), the Delta area plot (Figure 9D), and a heatmap illustrating the differential expression of five key genes in the subtypes (Figure 9E). The expression of a key gene (HP) in cluster 2 showed an obvious positive correlation, and the remaining four key genes (MAPK14, S100A9, SERPINB1, and SIGLEC5) in both subtypes showed obvious negative correlations.
 |
Figure 9 Construction of sepsis subtypes. (A) The consensus clustering plot of Sepsis Cohort in GSE13904 (K=2). (B) The PCA analyses of two subtypes (cluster 1 and cluster 2) in the Sepsis Cohort of GSE13904. (C and D) The consensus CDF plot (C) and delta area plot under the CDF curve (D). (E) The heatmap of key genes in the two subtypes. (F) The group comparison plot of key genes in two subtypes of GSE13904. (The symbol ns is equivalent to p ≥ 0.05, which has no statistical significance. The symbol ** is equivalent to p < 0.01, which is highly statistically significant. The symbol *** is equivalent to p < 0.001, which is highly statistically significant.). |
Then, we used the Wilcoxon rank sum test to assess the differential expression of five key genes between the two subtypes in GSE13904. As shown in Figure 9F, four key genes exhibited statistically significant differences in expression between the two subtypes: S100A9, HP, SERPINB1 and SIGLEC5, with lower levels in cluster 1 than in cluster 2.
Immune Infiltration Differences Between Sepsis Subtypes in GSE13904
Next, to assess differences in immune infiltration between sepsis subtypes (cluster 1 and cluster 2) in GSE13904, the ssGSEA algorithm was employed to evaluate infiltration levels for 28 immune cell types. The Mann–Whitney U-test was used to analyze the differential immune infiltration patterns between the subtypes, with the results visualized through a group comparison plot (Figure 10A). In the Sepsis cohort of GSE13904, there were 4 immune cell types differentially infiltrated between the two subtypes, with statistical significance, namely Activated dendritic cells, Macrophages, Mast cells, and MDSC.
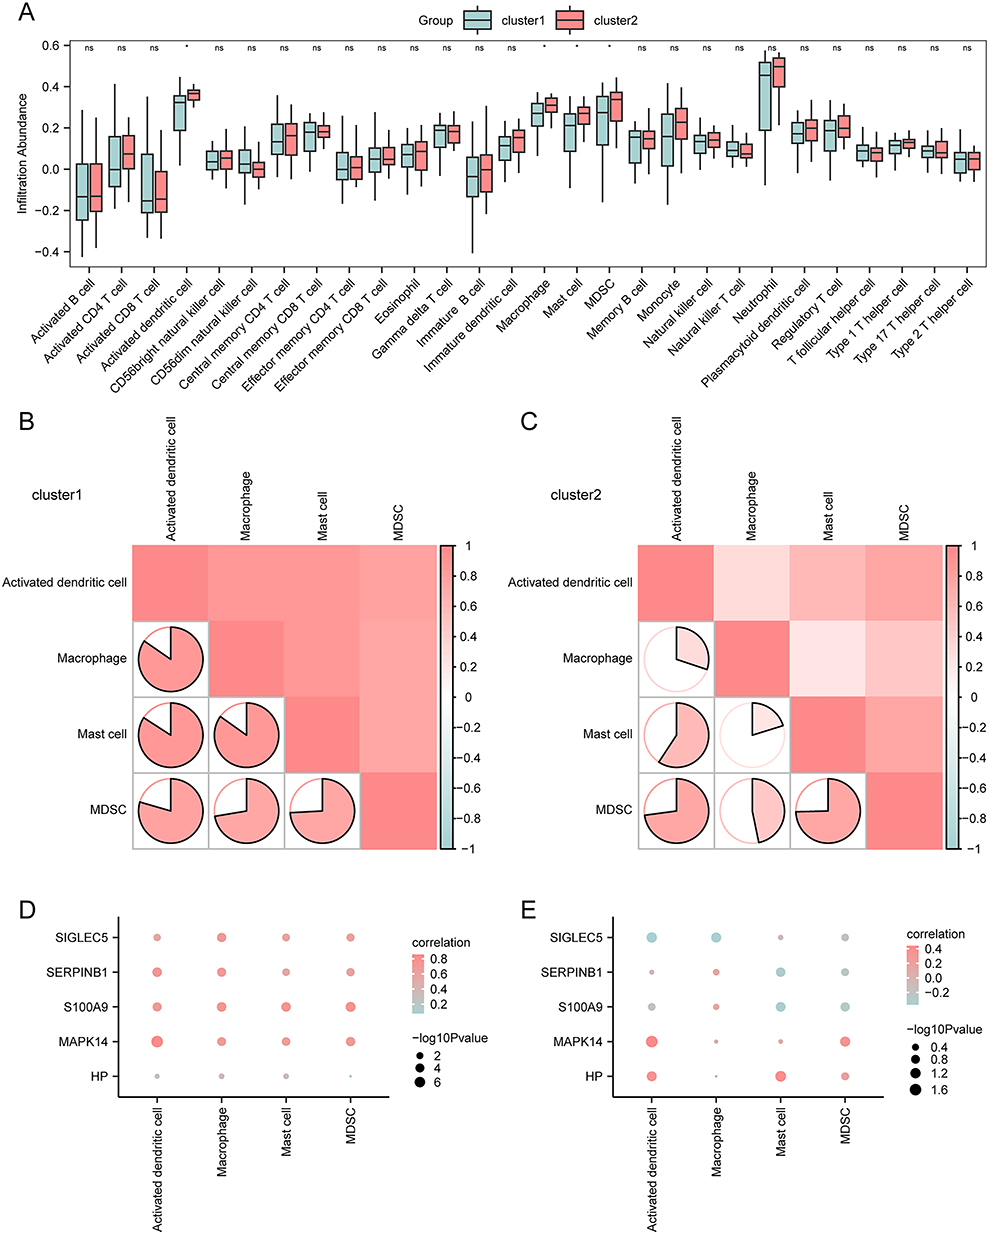 |
Figure 10 ssGSEA immune characteristics among two subtypes of pediatric sepsis samples in GSE13904. (A) The group comparison plot of ssGSEA immune infiltration analysis between two subtypes (cluster 1 and cluster 2) of pediatric sepsis in GSE13904. (B and C) The correlation analysis of immune cell infiltration abundance conducted on the two subtypes cluster 1 (B) and cluster 2 (C) in GSE13904. (D–E) The correlation scatter plots of immune cells and key genes conducted on the two subtypes cluster 1 (D) and cluster 2 (E) in GSE13904. (The symbol ns is equivalent to p ≥ 0.05 and has no statistical significance. The symbol * is equivalent to p < 0.05 and is statistically significant.). |
Our next step was to determine how the abundance of the four immune cell types within the two subtypes of the GSE13904 dataset correlates. According to the results, most immune cells showed a positive correlation (Figure 10B and C). In addition, we investigated the correlations between the infiltration levels of the four immune cell types and the expression of five key genes (MAPK14, S100A9, HP, SERPINB1, and SIGLEC5). The results were visualized using correlation dot plots (Figure 10D and E). In cluster 1 (Figure 10D), most key genes showed significant positive correlations with immune cell infiltration. In cluster 2 (Figure 10E), two key genes (MAPK14 and HP) exhibited relatively strong positive correlations with immune cells.
Discussion
Our integrated multi-transcriptome analysis provides a comprehensive overview of the immune landscape in pediatric sepsis and identifies immunomodulatory genes with potential diagnostic relevance. Notably, immune infiltration analysis of the GSE13904 dataset revealed that elevated MAPK14 expression was significantly associated with the infiltration of multiple immune cell populations, including activated DCs and MDSCs. In the present discussion, we place particular emphasis on the MAPK14–MDSC axis. This focus does not negate the relevance of other immune associations, but rather reflects both the statistical prominence of MAPK14 in our analyses and the established pathogenic importance of MDSCs in sepsis-related immunosuppression.
From a quantitative perspective, MAPK14 emerged as the most influential independent variable in the LASSO regression model constructed for pediatric sepsis, exhibiting the largest regression coefficient among candidate genes (Coef = 1.458). This finding suggests that MAPK14 may represent a central molecular feature within the identified immunoregulatory signature. In parallel, ssGSEA-based immune infiltration analysis demonstrated a significant positive correlation between MAPK14 expression levels and MDSC infiltration scores, supporting the hypothesis that MAPK14 is involved in immune regulation through pathways linked to MDSC expansion or function.
From a mechanistic standpoint, we prioritized MDSCs over DCs due to their distinct roles in the later stages of sepsis. While DCs primarily contribute to immune activation and antigen presentation, the large-scale expansion and sustained activation of MDSCs are widely recognized as key drivers of sepsis-induced immunoparalysis. This state of immune dysfunction increases susceptibility to secondary infections, contributes to organ failure, and is closely associated with poor long-term outcomes in pediatric patients. Taken together, the statistical weight of MAPK14, its consistent correlation with MDSC infiltration, and the central pathogenic role of MDSCs provide a coherent rationale for focusing on this regulatory axis.
Importantly, our findings were supported by cross-species validation at the expression level. In the LPS-induced rat sepsis model, MAPK14 expression was significantly upregulated in peripheral blood, consistent with the transcriptomic patterns observed in pediatric sepsis patients. Although this validation remains preliminary, it suggests that MAPK14 activation during systemic inflammatory stress may represent a conserved molecular response, thereby reinforcing its biological plausibility as a key mediator in sepsis-associated immune dysregulation.
MAPK14, a prominent member of the MAPK family, plays multifaceted roles in immune homeostasis. The MAPK14 signaling pathway is evolutionarily conserved and critically involved in innate immune responses and host defense, with dysregulation contributing to diverse pathophysiological processes.39,40 Beyond its role in cytokine production and innate immune signaling, MAPK14 also modulates adaptive immune responses by influencing the activity of multiple immune cell types.41 In pediatric sepsis, elevated MAPK14 expression has been associated with disease severity and therapeutic responsiveness, supporting its potential relevance as a prognostic indicator.42
MDSCs constitute a central immunosuppressive population within the septic immune microenvironment, exerting potent inhibitory effects on both innate and adaptive immunity.43 Their expansion is a characteristic feature of experimental and clinical sepsis and has been linked to nosocomial infections and adverse clinical outcomes.44 Despite their recognized importance, the upstream signaling mechanisms governing MDSC expansion and functional activation in sepsis remain incompletely understood. Given the broad regulatory capacity of MAPK14 in inflammatory signaling, it is plausible that MAPK14-related pathways may contribute to MDSC-mediated immunosuppression. This hypothesis provides a mechanistic framework linking MAPK14 activation to sepsis-induced immune paralysis and highlights a potential target for therapeutic modulation.
The immunomodulatory effects of MAPK14 are unlikely to operate in isolation but rather within a complex biological network. As a central signaling hub, MAPK14 promotes the production of pro-inflammatory cytokines45 and influences immune cell differentiation,46 including macrophage polarization and T helper cell lineage commitment. Moreover, MAPK14 regulates endothelial activation and adhesion molecule expression, thereby facilitating leukocyte recruitment and contributing to vascular permeability.47 These immune-mediated effects must be considered alongside microcirculatory and endothelial dysfunction, which are fundamental features of sepsis and acute respiratory distress syndrome. Clinical studies evaluating agents such as iloprost48 underscore the translational relevance of targeting both immunological and vascular components of sepsis, supporting an integrated pathophysiological framework.
Building on this perspective, immunotherapeutic strategies for pediatric sepsis should be tailored to distinct immune phenotypes. In hyperinflammatory states, cytokine-targeted therapies such as IL-1 receptor antagonists49 or JAK inhibitors50 may mitigate early tissue injury. Conversely, during immunosuppressive phases characterized by prominent MDSC expansion and MAPK14-associated signaling, immunostimulatory approaches—including cytokine supplementation,51 immune checkpoint modulation,52 or targeted regulation of MDSCs53—may help restore immune competence.
While MAPK14 represents a central node within this framework, the inclusion of S100A9, HP, SERPINB1, and SIGLEC5 strengthens the biological coherence of our model. These genes independently connect MAPK14 to key septic processes involving innate immune activation, immune checkpoint regulation, oxidative stress, and metabolic dysfunction.54–57 Our enrichment analyses further support this integrated view, reflecting leukocyte dysfunction across the continuum of sepsis—from early hyperinflammatory injury to later mitochondrial impairment.58,59
Several limitations of this study should be acknowledged. The analysis was primarily based on computational approaches, and functional interactions among the identified genes were not experimentally validated. Although a correlation between MAPK14 expression and MDSC infiltration was observed, mechanistic studies are required to confirm causality. In addition, ssGSEA-based immune deconvolution has inherent limitations, particularly in pediatric populations where age-dependent immune characteristics may influence gene expression signatures. Furthermore, the algorithm does not distinguish between polymorphonuclear and monocytic MDSC subsets, precluding subtype-specific analysis. Finally, residual batch effects arising from the integration of multiple public datasets may have influenced the results.
Conclusion
In summary, this study integrated pediatric sepsis transcriptomic data with immunoinformatic analyses and preliminary experimental validation to identify key immunomodulatory gene modules associated with disease pathogenesis. MAPK14 emerged as a central hub gene and potential biomarker, exhibiting a significant association with MDSC infiltration and defining a MAPK14–MDSC regulatory axis. These findings provide insight into the immune dysregulation characteristic of pediatric sepsis and emphasize the importance of immunophenotype-driven research. Collectively, this work establishes a conceptual framework for future mechanistic studies and the development of targeted immunomodulatory strategies in pediatric sepsis.
Data Sharing Statement
The raw gene expression data supporting this study are publicly available in the NCBI GEO database (https://www.ncbi.nlm.nih.gov/geo/) under accession numbers [GSE13904](https://www.ncbi.nlm.nih.gov/geo/query/acc.cgi?acc=GSE13904) (sepsis cohort) and [GSE69686](https://www.ncbi.nlm.nih.gov/geo/query/acc.cgi?acc=GSE69686) (validation set). All R scripts for data preprocessing, visualization, as well as the processed intermediate files and supplementary materials are available from the corresponding author or the first author upon reasonable request.
Ethics Approval and Consent to Participate
Animal Studies
The animal study protocol was reviewed and approved by the Institutional Animal Care and Use Committee (IACUC) of Shanghai Rat&Mouse Biotech Co., Ltd (Approval No. [202309(13)]). All experiments were conducted in accordance with the institution’s guidelines, which are based on the National Standards of China (GB/T 35892-2018), adhering to the principles of the 3Rs (Replacement, Reduction, Refinement). Furthermore, the reporting of this study complies with the ARRIVE Guidelines 2.0.
Human Data (Bioinformatics)
This study involved secondary analysis of pre-existing, de-identified data from public GEO datasets (GSE13904, GSE69686). In accordance with journal policy and national regulations, the study was submitted for review to the Ethics Committee of Shangrao Central Hospital, which granted a formal waiver of ethical approval (Reference Number: SRCH-ERC-EXEMPT-2025-001). The waiver confirms that this non-interventional research does not constitute human subjects research as defined in relevant ethical guidelines.
Acknowledgment
The authors acknowledge support from Tongren Hospital and Shangrao Key Laboratory of Acute and Critical Care Medicine.
Author Contributions
Jia Shi (First Author): Conceptualization, Methodology, Software, Validation, Formal analysis, Investigation, Data Curation, Writing – Original Draft, Writing – Review & Editing, Visualization.
Jianze Jiang: Resources, Formal analysis, Writing – Review & Editing, Visualization.
Jin Ye: Software, Validation, Formal analysis, Investigation, Data Curation, Writing – Review & Editing.
Wei Dai (Corresponding Author): Conceptualization, Methodology, Resources, Writing – Review & Editing, Supervision, Project administration, Funding acquisition.
All authors took part in drafting, revising or critically reviewing the article; gave final approval of the version to be published; have agreed on the journal to which the article has been submitted; and agree to be accountable for all aspects of the work.
Funding
This work was supported by the Science and Technology Program of the Jiangxi Provincial Health Commission (Grant No. 202510099).
Disclosure
All authors certify that they have no affiliations with or involvement in any organization or entity with any financial interest, or non-financial interest in the subject matter or materials discussed in this paper.
References
1. Delano MJ, Ward PA. The immune system’s role in sepsis progression, resolution, and long-term outcome. Immunol Rev. 2016;274:330–24. doi:10.1111/imr.12499
2. Hotchkiss RS. Sepsis-induced immunosuppression: from cellular dysfunctions to immunotherapy. Nat Rev Immunol. 2013;13:862–874. doi:10.1038/nri3552
3. Hsu C-Y, Tsai Y-H, Lin C-Y, et al. Application of a 72 h National Early Warning Score and incorporation with sequential organ failure assessment for predicting sepsis outcomes and risk stratification in an Intensive Care Unit: a Derivation and Validation Cohort Study. J Pers Med. 2021;11:910. doi:10.3390/jpm11090910
4. Bosmann M, Ward PA. The inflammatory response in sepsis. Trends Immunol. 2013;34:129–136. doi:10.1016/j.it.2012.09.004
5. Mithal LB, Arshad M, Swigart LR, et al. Mechanisms and modulation of sepsis-induced immune dysfunction in children. Pediatr Res. 2022;91:447–453. doi:10.1038/s41390-021-01879-8
6. Li H, Liu L, Zhang D, et al. SARS-CoV-2 and viral sepsis: observations and hypotheses. Lancet. 2020;395:1517–1520. doi:10.1016/S0140-6736(20)30920-X
7. Wang Y, Zhu K, Dai R, et al. Specific Interleukin-1 inhibitors, specific Interleukin-6 inhibitors, and GM-CSF blockades for COVID-19 (at the edge of sepsis): a systematic review. Front Pharmacol. 2021;12:804250. doi:10.3389/fphar.2021.804250
8. Xu Z, Liu A, Yang L, et al. Changes in immune function and immunomodulatory treatments of septic patients. Clin Immunol. 2022;239:109040. doi:10.1016/j.clim.2022.109040
9. Strzelec M, Detka J, Mieszczak P, et al. Immunomodulation—a general review of the current state-of-the-art and new therapeutic strategies for targeting the immune system. Front Immunol. 2023;14. doi:10.3389/fimmu.2023.1127704
10. Pei F, Yao R-Q, Ren C, et al. Expert consensus on the monitoring and treatment of sepsis-induced immunosuppression. Military Med Res. 2022;9:74. doi:10.1186/s40779-022-00430-y
11. van der Poll T, van de Veerdonk FL, Scicluna BP, Netea MG. The immunopathology of sepsis and potential therapeutic targets. Nat Rev Immunol. 2017;17:407–420. doi:10.1038/nri.2017.36
12. Shankar-Hari M, Fear D, Lavender P, et al. Activation-associated accelerated apoptosis of Memory B Cells in critically ill patients with sepsis. Crit Care Med. 2017;45:875–882. doi:10.1097/CCM.0000000000002380
13. Ruan W-S, Feng M-X, Xu J, et al. Early activation of myeloid-derived suppressor cells participate in sepsis-induced immune suppression via PD-L1/PD-1 axis. Front Immunol. 2020;11. doi:10.3389/fimmu.2020.01299
14. Wong HR, Cvijanovich N, Allen GL, et al. Genomic expression profiling across the pediatric systemic inflammatory response syndrome, sepsis, and septic shock spectrum. Crit Care Med. 2009;37:1558–1566. doi:10.1097/CCM.0b013e31819fcc08
15. Wynn JL, Guthrie SO, Wong HR, et al. Postnatal age is a critical determinant of the neonatal host response to sepsis. Mol Med. 2015;21:496–504. doi:10.2119/molmed.2015.00064
16. Davis S, Meltzer PS. GEOquery: a bridge between the Gene Expression Omnibus (GEO) and BioConductor. Bioinformatics. 2007;23:1846–1847. doi:10.1093/bioinformatics/btm254
17. Barrett T, Troup DB, Wilhite SE, et al. NCBI GEO: mining tens of millions of expression profiles--database and tools update. Nucleic Acids Res. 2007:
18. Stelzer G, Rosen N, Plaschkes I, et al. The GeneCards suite: from gene data mining to disease genome sequence analyses. Curr Protoc Bioinformatics. 2016;54:
19. Yu G, Wang L-G, Han Y, He Q-Y. clusterProfiler: an R package for comparing biological themes among gene clusters. OMICS. 2012;16:284–287. doi:10.1089/omi.2011.0118
20. Yu G. Gene ontology semantic similarity analysis using GOSemSim. Methods Mol Biol. 2020;2117:207–215. doi:10.1007/978-1-0716-0301-7_11
21. Kanehisa M, Goto S. KEGG: kyoto encyclopedia of genes and genomes. Nucleic Acids Res. 2000;28:27–30. doi:10.1093/nar/28.1.27
22. Subramanian A, Tamayo P, Mootha VK, et al. Gene set enrichment analysis: a knowledge-based approach for interpreting genome-wide expression profiles. Proc Natl Acad Sci U S A. 2005;102:15545–15550. doi:10.1073/pnas.0506580102
23. Liberzon A, Birger C, Thorvaldsdóttir H, et al. The Molecular Signatures Database (MSigDB) hallmark gene set collection. Cell Syst. 2015;1:417–425. doi:10.1016/j.cels.2015.12.004
24. Zhang B, Horvath S. A general framework for weighted gene co-expression network analysis. Stat Appl Genet Mol Biol. 2005;
25. Langfelder P, Horvath S. WGCNA: an R package for weighted correlation network analysis. BMC Bioinf. 2008;9:559. doi:10.1186/1471-2105-9-559
26. Gruber HE, Hoelscher GL, Ingram JA, et al. Genome-wide analysis of pain-, nerve- and neurotrophin-related gene expression in the degenerating human annulus. Mol Pain. 2012;8:63. doi:10.1186/1744-8069-8-63
27. Liu Y, Zhao H. Variable importance-weighted random forests. Quant Biol. 2017;5:338–351. doi:10.1007/s40484-017-0121-6
28. Cai W, van der Laan M. Nonparametric bootstrap inference for the targeted highly adaptive least absolute shrinkage and selection operator (LASSO) estimator. Int J Biostat. 2020;16. doi:10.1515/ijb-2017-0070
29. Engebretsen S, Bohlin J. Statistical predictions with glmnet. Clin Clin Epigenet. 2019;11:123. doi:10.1186/s13148-019-0730-1
30. Wu J, Zhang H, Li L, et al. A nomogram for predicting overall survival in patients with low-grade endometrial stromal sarcoma: a population-based analysis. Cancer Commun. 2020;40:301–312. doi:10.1002/cac2.12067
31. Van Calster B, Wynants L, Verbeek JFM, et al. Reporting and interpreting decision curve analysis: a guide for investigators. Eur Urol. 2018;74:796–804. doi:10.1016/j.eururo.2018.08.038
32. Charoentong P, Finotello F, Angelova M, et al. Pan-cancer immunogenomic analyses reveal genotype-immunophenotype relationships and predictors of response to checkpoint blockade. Cell Rep. 2017;18:248–262. doi:10.1016/j.celrep.2016.12.019
33. Barbie DA, Tamayo P, Boehm JS, et al. Systematic RNA interference reveals that oncogenic KRAS-driven cancers require TBK1. Nature. 2009;462:108–112. doi:10.1038/nature08460
34. Newman AM, Liu CL, Green MR, et al. Robust enumeration of cell subsets from tissue expression profiles. Nat Methods. 2015;12:453–457. doi:10.1038/nmeth.3337
35. Hänzelmann S, Castelo R, Guinney J. GSVA: gene set variation analysis for microarray and RNA-seq data. BMC Bioinf. 2013;14:7. doi:10.1186/1471-2105-14-7
36. Brière G, Darbo É, Thébault P, Uricaru R. Consensus clustering applied to multi-omics disease subtyping. BMC Bioinf. 2021;22:361. doi:10.1186/s12859-021-04279-1
37. Wilkerson MD, Hayes DN. ConsensusClusterPlus: a class discovery tool with confidence assessments and item tracking. Bioinformatics. 2010;26:1572–1573. doi:10.1093/bioinformatics/btq170
38. Ringnér M. What is principal component analysis? Nat Biotechnol. 2008;26:303–304. doi:10.1038/nbt0308-303
39. Kim DH, Feinbaum R, Alloing G, et al. A conserved p38 MAP kinase pathway in Caenorhabditis elegans innate immunity. Science. 2002;297:623–626. doi:10.1126/science.1073759
40. Ashwell JD. The many paths to p38 mitogen-activated protein kinase activation in the immune system. Nat Rev Immunol. 2006;6:532–540. doi:10.1038/nri1865
41. Canovas B, Nebreda AR. Diversity and versatility of p38 kinase signalling in health and disease. Nat Rev Mol Cell Biol. 2021;22:346–366. doi:10.1038/s41580-020-00322-w
42. Zhang N, Fan Y, Chen J, et al. MAPK14 drives ferroptosis and immune dysfunction in pediatric sepsis-induced acute lung injury. Cell Immunol. 2025;411-412:104948. doi:10.1016/j.cellimm.2025.104948
43. Veglia F, Sanseviero E, Gabrilovich DI. Myeloid-derived suppressor cells in the era of increasing myeloid cell diversity. Nat Rev Immunol. 2021;21:485–498. doi:10.1038/s41577-020-00490-y
44. Ost M, Singh A, Peschel A, et al. Myeloid-derived suppressor cells in bacterial infections. Front Cell Infect Microbiol. 2016;6:37. doi:10.3389/fcimb.2016.00037
45. Zhou L, Zhong Y, Li C, et al. MAPK14 as a key gene for regulating inflammatory response and macrophage M1 polarization induced by ferroptotic keratinocyte in psoriasis. Inflammation. 2024;47(5):1564–1584. doi:10.1007/s10753-024-01994-8
46. Wei J, Wei X, Deng L, et al. The PIK3C3/MAPK14 axis drives M1 polarization via autophagy Inhibition to exacerbate Sepsis-Induced acute lung injury. Sci Rep. 2025;15(1):42824. doi:10.1038/s41598-025-27088-5
47. Yang J, Xu H, Chen K, et al. Platelets-derived miR-200a-3p modulate the expression of ET-1 and VEGFA in endothelial cells by targeting MAPK14. Front Physiol. 2022;13:893102. doi:10.3389/fphys.2022.893102
48. Sarı Küçük R, Uluç K, Merve Çolakoğlu Ş, et al. The effect of using iloprost on prognosis in COVID-19 patients with ARDS: a retrospective clinical study. Eur Rev Med Pharmacol Sci. 2023;27(9):4269–4279. doi:10.26355/eurrev_202305_32337
49. Tan C, Wang W, Ma H, et al. Decoding IL-1 receptor 1 and 2 expression profiles across organs in sepsis. Front Cell Dev Biol. 2025;13:1675870. doi:10.3389/fcell.2025.1675870
50. Clere-Jehl R, Mariotte A, Meziani F, et al. JAK-STAT targeting offers novel therapeutic opportunities in sepsis. Trends Mol Med. 2020;26(11):987–1002. doi:10.1016/j.molmed.2020.06.007
51. Gao X, Cai S, Li X, et al. Sepsis-induced immunosuppression: mechanisms, biomarkers and immunotherapy. Front Immunol. 2025;16:1577105. doi:10.3389/fimmu.2025.1577105
52. Zhang W, Fang X, Gao C, et al. MDSCs in sepsis-induced immunosuppression and its potential therapeutic targets. Cytokine Growth Factor Rev. 2023;69:90–103. doi:10.1016/j.cytogfr.2022.07.007
53. Wu Y, Wang L, Li Y, et al. Immunotherapy in the context of sepsis-induced immunological dysregulation. Front Immunol. 2024;15:1391395. doi:10.3389/fimmu.2024.1391395
54. Su M, Chen C, Li S, et al. Gasdermin D-dependent platelet pyroptosis exacerbates NET formation and inflammation in severe sepsis. Nat Cardiovasc Res. 2022;1:732–747. doi:10.1038/s44161-022-00108-7
55. Choi YJ, Kim S, Choi Y, et al. SERPINB1-mediated checkpoint of inflammatory caspase activation. Nat Immunol. 2019;20:276–287. doi:10.1038/s41590-018-0303-z
56. Dr J, Ja B, S G, et al. Association between haptoglobin, hemopexin and mortality in adults with sepsis. Critical Care. 2013;17. doi:10.1186/cc13108
57. Vuchkovska A, Glanville DG, Scurti GM, et al. Siglec-5 is an inhibitory immune checkpoint molecule for human T cells. Immunology. 2022;166:238–248. doi:10.1111/imm.13470
58. McBride MA, Owen AM, Stothers CL, et al. The metabolic basis of immune dysfunction following sepsis and trauma. Front Immunol. 2020;11. doi:10.3389/fimmu.2020.01043
59. Nedeva C. Inflammation and cell death of the innate and adaptive immune system during sepsis. Biomolecules. 2021;11:1011. doi:10.3390/biom11071011
 © 2026 The Author(s). This work is published and licensed by Dove Medical Press Limited. The
full terms of this license are available at https://www.dovepress.com/terms
and incorporate the Creative Commons Attribution
- Non Commercial (unported, 4.0) License.
By accessing the work you hereby accept the Terms. Non-commercial uses of the work are permitted
without any further permission from Dove Medical Press Limited, provided the work is properly
attributed. For permission for commercial use of this work, please see paragraphs 4.2 and 5 of our Terms.
© 2026 The Author(s). This work is published and licensed by Dove Medical Press Limited. The
full terms of this license are available at https://www.dovepress.com/terms
and incorporate the Creative Commons Attribution
- Non Commercial (unported, 4.0) License.
By accessing the work you hereby accept the Terms. Non-commercial uses of the work are permitted
without any further permission from Dove Medical Press Limited, provided the work is properly
attributed. For permission for commercial use of this work, please see paragraphs 4.2 and 5 of our Terms.