Back to Journals » OncoTargets and Therapy » Volume 13
Comprehensive Analysis of Aberrantly Expressed Competitive Endogenous RNA Network and Identification of Prognostic Biomarkers in Pheochromocytoma and Paraganglioma
Authors Wang Z, Li Y, Zhong Y, Wang Y, Peng M
Received 15 July 2020
Accepted for publication 15 September 2020
Published 6 November 2020 Volume 2020:13 Pages 11377—11395
DOI https://doi.org/10.2147/OTT.S271417
Checked for plagiarism Yes
Review by Single anonymous peer review
Peer reviewer comments 2
Editor who approved publication: Prof. Dr. Nicola Silvestris
Zijun Wang,1 Yijian Li,2 Yanjun Zhong,3 Yinhuai Wang,2 Mou Peng2,4
1Department of Dermatology, The Second Xiangya Hospital, Central South University, Changsha, Hunan 410011, People’s Republic of China; 2Department of Urology, The Second Xiangya Hospital, Central South University, Changsha, Hunan 410011, People’s Republic of China; 3ICU Center, The Second Xiangya Hospital, Central South University, Hunan, Hunan 410011, People’s Republic of China; 4Department of Microbiology and Immunology, Albert Einstein College of Medicine, Bronx, NY 10461, USA
Correspondence: Mou Peng
Department of Urology, The Second Xiangya Hospital, Central South University, No. 139 Renmin Middle Road, Changsha, Hunan 410011, People’s Republic of China
Tel/ Fax +86-731-85295134
Email [email protected]
Background: Long non-coding RNA (lncRNA) functions as a competitive endogenous RNA (ceRNA) and plays an important role in the biological processes underlying tumorigenesis. However, studies describing the function of lncRNA in pheochromocytoma and paraganglioma (PCPG) remain largely unknown. Our study aims to construct a regulatory ceRNA network and explore prognostic biomarkers for PCPG through a comprehensive analysis.
Methods: PCPG data from The Cancer Genome Atlas (TCGA) were utilized to obtain differentially expressed lncRNAs (DElncRNAs), microRNAs (DEmiRNAs), and mRNAs (DEmRNAs). Kaplan–Meier analysis was used to detect prognostic biomarkers and Cytoscape was utilized to construct a regulatory network of ceRNA. Potential lncRNA–miRNA–mRNA axes were inferred by correlation analysis. GO and KEGG pathways were constructed using “clusterProfiler” and “DOSE” R-packages. Immunohistochemistry (IHC) staining was performed to validate differential protein expression levels of genes in the axes. Finally, the GSE19422 dataset and Pan-Cancer data were applied to validate the expression pattern and survival status of mRNAs, respectively.
Results: A total of 334 DElncRNAs, 116 DEmiRNAs, and 3496 DEmRNAs were identified and mainly enriched in hormone secretion, metabolism signaling, metastatic and proliferative pathways. Among these differentially expressed genes, 16 mRNAs, six lncRNAs, and two miRNAs were associated with overall survival of patients with PCPG and sequentially enrolled in the ceRNA network. Two lncRNA–miRNA–mRNA regulatory axes were predicted: AP001486.2/hsa-miR-195-5p/RCAN3 and AP006333.2/hsa-miR-34a-5p/PTPRJ. The GSE19422 dataset and IHC analysis validated that mRNA and protein levels of RCAN3 and PTPRJ were upregulated in PCPG tissues compared with adjacent adrenal gland medulla tissues. Pan-Cancer data showed that the upregulated expression of RCAN3 and PTPRJ was associated with favorable overall survival and disease-free survival.
Conclusion: A regulatory lncRNA–miRNA–mRNA ceRNA network was successfully constructed and 24 prognostic biomarkers were identified for PCPG patients. These findings may contribute toward a better understanding of the biological mechanism of tumorigenesis and enable further evaluation of the prognosis of patients with PCPG.
Keywords: pheochromocytoma and paraganglioma (PCPG), prognostic biomarker, ceRNA network
Introduction
Pheochromocytoma and paraganglioma (PCPG) is a neuroendocrine tumor originating from chromaffin cells and sympathetic chains, characterized by the production of catecholamines.1 Previous studies have shown that mutations in susceptibility genes of PCPG provide a basis for explaining the occurrence and development of PCPG.2 Patients with PCPG are typically characterized by severe hypertension, irritability, sweating, and other symptoms, potentially leading to serious complications such as cerebral hemorrhage and heart disease. At present, the diagnosis of PCPG mainly depends on medical history, physical examination, biochemical tests, and imaging examinations. Nevertheless, it is difficult to diagnose and perform effective preoperative preparation in the absence of catecholamine secretion. In addition, malignant PCPG can only be diagnosed when a metastasis is found, resulting in a poor prognosis. Novel molecular markers are helpful to clearly distinguish between benign and malignant PCPG.3,4 In order to confirm the diagnosis and characterization of PCPG, it is therefore necessary to explore the mechanisms of tumorigenesis and metastasis in PCPG.
Long non-coding RNA (lncRNA) is a non-coding RNA greater than 200 nucleotides in length. In recent years, studies have found that lncRNA is involved in many biological processes and plays an important role in tumorigenesis, progression, and metastasis.5 A few studies have examined lncRNA in PCPG.6,7 However, the specific role of other lncRNAs in PCPG is unclear. With the introduction of the competitive endogenous RNA (ceRNA) hypothesis and the understanding of the lncRNA–miRNA–mRNA network regulation mechanism, it has been shown that lncRNA directly silences mRNA expression and indirectly acts as a “sponge” of microRNA (miRNA) to regulate mRNA. As a post-transcriptional product, lncRNA performs as an miRNA sponge to fully bind to miRNA, reducing the binding of miRNA to mRNA, which results in decreased mRNA silencing and increased mRNA expression.8 Through the study of ceRNA regulatory networks, we can further understand the role of lncRNA in PCPG and identify prognostic biomarkers for PCPG.
In this study, we collected differentially expressed lncRNA (DElncRNA), differentially expressed miRNA (DEmiRNA), and differentially expressed mRNA (DEmRNA) in PCPG tissues compared with adjacent adrenal gland medulla tissues, based on The Cancer Genome Atlas (TCGA) database. We found differentially expressed mRNAs involved in hormone secretion, metabolism signaling pathways, and tumorigenesis biological behaviors. Through integration analysis, we constructed an lncRNA–miRNA–mRNA network for ceRNA analysis in PCPG. Subsequently, we obtained two lncRNA–miRNA–mRNA axes in PCPG and performed Kaplan–Meier survival analysis to identify prognostic biomarkers. We further validated the mRNA and protein expression of prognostic biomarkers by the Gene Expression Omnibus (GEO) database and immunohistochemistry (IHC) staining, separately.
Methods
RNA-Seq, miRNA Data, and Clinical Data from TCGA-PCPG
R-packaged GDCRNATools were utilized in this study.9 RNA sequencing (RNA-seq), miRNA, and clinical features of TCGA-PCPG data were downloaded from TCGA (https://portal.gdc.cancer.gov/). The RNA-seq and miRNA data from different patients were integrated separately into two files. Duplicated samples were removed from the RNA-seq matrix and miRNA matrix and the count data of duplicated genes were averaged. Raw count data were normalized by the trimmed mean of M values (TMM) method implemented in edgeR and further transformed by the voom method provided in limma. Low-expression genes (logCPM <1 in more than half of the samples) were filtered out. Differentially expressed genes were subsequently calculated by the “edgeR” package by comparing PCPG with normal adrenal gland tissue.
Identification of Differentially Expressed lncRNA, miRNA, and mRNA
All long non-coding genes and protein coding genes were separately reported by setting the “gene Type” argument in “gdcDEReport”. Gene symbols and biotypes based on the Ensembl 38.90 annotation were reported in the output. DElncRNA and DEmRNA were identified by inclusion criteria. The inclusion criteria were “|log2(fold change) | >2, FDR <0.05”. The same procedure was performed with miRNA data to find DEmiRNA. Volcano maps and heatmaps of lncRNA, miRNA, and mRNA were then constructed.
GO and KEGG Pathway Analysis
A functional enrichment analysis of differentially expressed mRNAs was performed via the R/Bioconductor packages “clusterProfiler” and “DOSE”. Gene Ontology (GO) and the Kyoto Gene and Genomic Encyclopedia (KEGG) were analyzed and the bubble maps of the GO and KEGG pathways were drawn. After generating the ceRNA network, mRNAs in the ceRNA network were analyzed for GO and KEGG enrichment analysis via R packages.
Survival Analysis
Survival analysis of differentially expressed lncRNA, miRNA, and mRNA in PCPG was performed with GDCRNATools. RNAs with p-value <0.05 were identified as prognostic biomarkers.
Expression Level of Prognostic Biomarkers Between Metastatic and Non-Metastatic PCPG Groups
Based on the clinical file downloaded by the GDCRNATools package, 168 PCPG patients with metastatic status were enrolled in this study and the clinical data and normalized expression value of prognostic markers were extracted. The unpaired t-test was used for statistical analysis. GraphPad version 8.3.1 was used to display the results.
Construction of lncRNA–miRNA–mRNA ceRNA Regulatory Network
Based on RNA-seq and miRNA data, lncRNA–miRNA interactions and mRNA–miRNA interactions were analyzed to search for shared miRNAs. There are three criteria for determining the ceRNA between lncRNA and mRNA. First, lncRNA and mRNA share a certain number of miRNAs. Second, the correlation between lncRNA and mRNA expression is positive. Third, those shared miRNAs should have similar effects to regulate the expression levels of lncRNA and mRNA.9 The miRcode database was used to predict lncRNA–miRNA interactions, and mirTarBase database was used to predict mRNA–miRNA interactions. The correlation coefficient was measured to assess the linear association between lncRNA and mRNA. Modulation of similarity and sensitivity correlations was used to calculate the possible regulatory effects of consensus miRNAs on lncRNA and mRNA. hyperPValue <0.01 and corPValue <0.01 were set for analysis. Prognostic lncRNA, differentially expressed miRNA, and prognostic mRNA were selected to generate the “node” and “edge” files. Then, we imported the node and edge data into Cytoscape to build a ceRNA network.
Prediction of lncRNA–miRNA–mRNA Axis and Correlations Between PCPG Genotypes and the lncRNA–miRNA–mRNA Axis
It is well known that shared miRNAs are capable of binding lncRNAs and mRNAs. The more miRNAs bind to the lncRNAs, the fewer miRNAs will bind to the mRNAs. High mRNA expression is associated with more lncRNAs and fewer miRNAs. According to this trend, the lncRNA–miRNA–mRNA axis was identified from the ceRNA network. The correlations between lncRNAs and mRNAs were further calculated to confirm the regulatory axis.
Based on 17 susceptibility genes, patients with PCPG were divided into four genotypes: the pseudohypoxia group, the kinase signaling group, the Wnt signaling group, and the disease-modifying gene group.10 The expression of susceptibility genes and lncRNA–miRNA–mRNA axis genes in PCPG was extracted and Pearson correlation analysis was used to analyze the correlations between PCPG genotypes and lncRNA–miRNA–mRNA axis.
Validation of mRNA Expression and Survival in Pan-Cancer
A gene expression microarray data (GSE19422) was downloaded from Gene Expression Omnibus (GEO) database. The dataset contained 84 primary pheochromocytoma (PCC)/paraganglioma tumors and six normal adrenal gland tissues, and the platform of GPL6480-Agilent-014850 Whole Human Genome Microarray 4x44K G4112F (Probe Name version) was used for the analysis.11 Gene symbols were annotated with the GPL6480 annotation file.
The mRNA expression of prognostic biomarkers involved in the lncRNA–miRNA–mRNA axis was plotted using TCGA-PCPG database and GSE19422 dataset. Overall survival and disease-free survival of these prognostic biomarkers in Pan-Cancer (excluding PCPG) were analyzed using the Gene Expression Profiling Interactive Analysis (GEPIA) database (http://gepia.cancer-pku.cn/).12
Immunohistochemistry (IHC)
Fifteen pairs of PCPG and adjacent adrenal gland tissues were collected from the Department of Urology, Second Xiangya Hospital of Central South University. At least two pathologists evaluated the HE staining of PCPG and adjacent adrenal gland tissues. Written informed consent was obtained from all patients and this study was approved by the Clinical Research Ethics Committee of the Second Xiangya Hospital of Central South University.
Patient samples harvested by surgical operation were fixed in neutral formalin and embedded in paraffin. Tissue slides were prepared and dewaxed by baking in an oven. The antigen retrieval was then carried out in a microwave oven with sodium citrate buffer pH 6.0 for 15 minutes, then the endogenous peroxidase was blocked by incubation in 3% hydrogen peroxide for 25 minutes, and then 3% BSA was used to block for 30 minutes at room temperature. Then, the sample was incubated with rabbit anti-human RCAN3 polyclonal antibody (1:200; Bioss, Beijing, China, #bs-11542R) or rabbit anti-human PTPRJ polyclonal antibody (1:200; Proteintech, Wuhan, China, #55123-1-ap) at 4°C overnight, followed by incubation with the secondary antibody, goat anti-rabbit antibody (1:200; Servicebio, Wuhan, China, #G23301), at room temperature for 50 minutes. Substrate and hematoxylin staining were used, and the slides were imaged by a microscope. The region of interest in the adjacent adrenal gland was the medulla. The IHC profiler was used to evaluate IHC score by ImageJ. The calculated scores were defined as: high positive = score 4, positive = score 3, low positive = score 2, and negative = score 1. Statistical analysis was performed using the paired t-test. The two groups were taken to have significant differences when p<0.05.
Results
Identification of Differentially Expressed lncRNA, miRNA, and mRNA
For a better understanding of the procedure used in this study, the workflow is presented in Figure 1. Altogether, 178 PCPG samples and three normal adrenal gland samples were included in the study. In total, 3496 mRNAs, 334 lncRNAs, and 116 miRNAs were obtained and met the inclusion criteria by comparing PCPG with normal adrenal gland tissue. The volcano plots and heatmaps are shown in Figure 2. The top 25 upregulated and top 25 downregulated mRNAs are shown in Table 1. Differentially expressed lncRNAs and differentially expressed miRNAs are shown in Tables 2, 3 and , respectively.
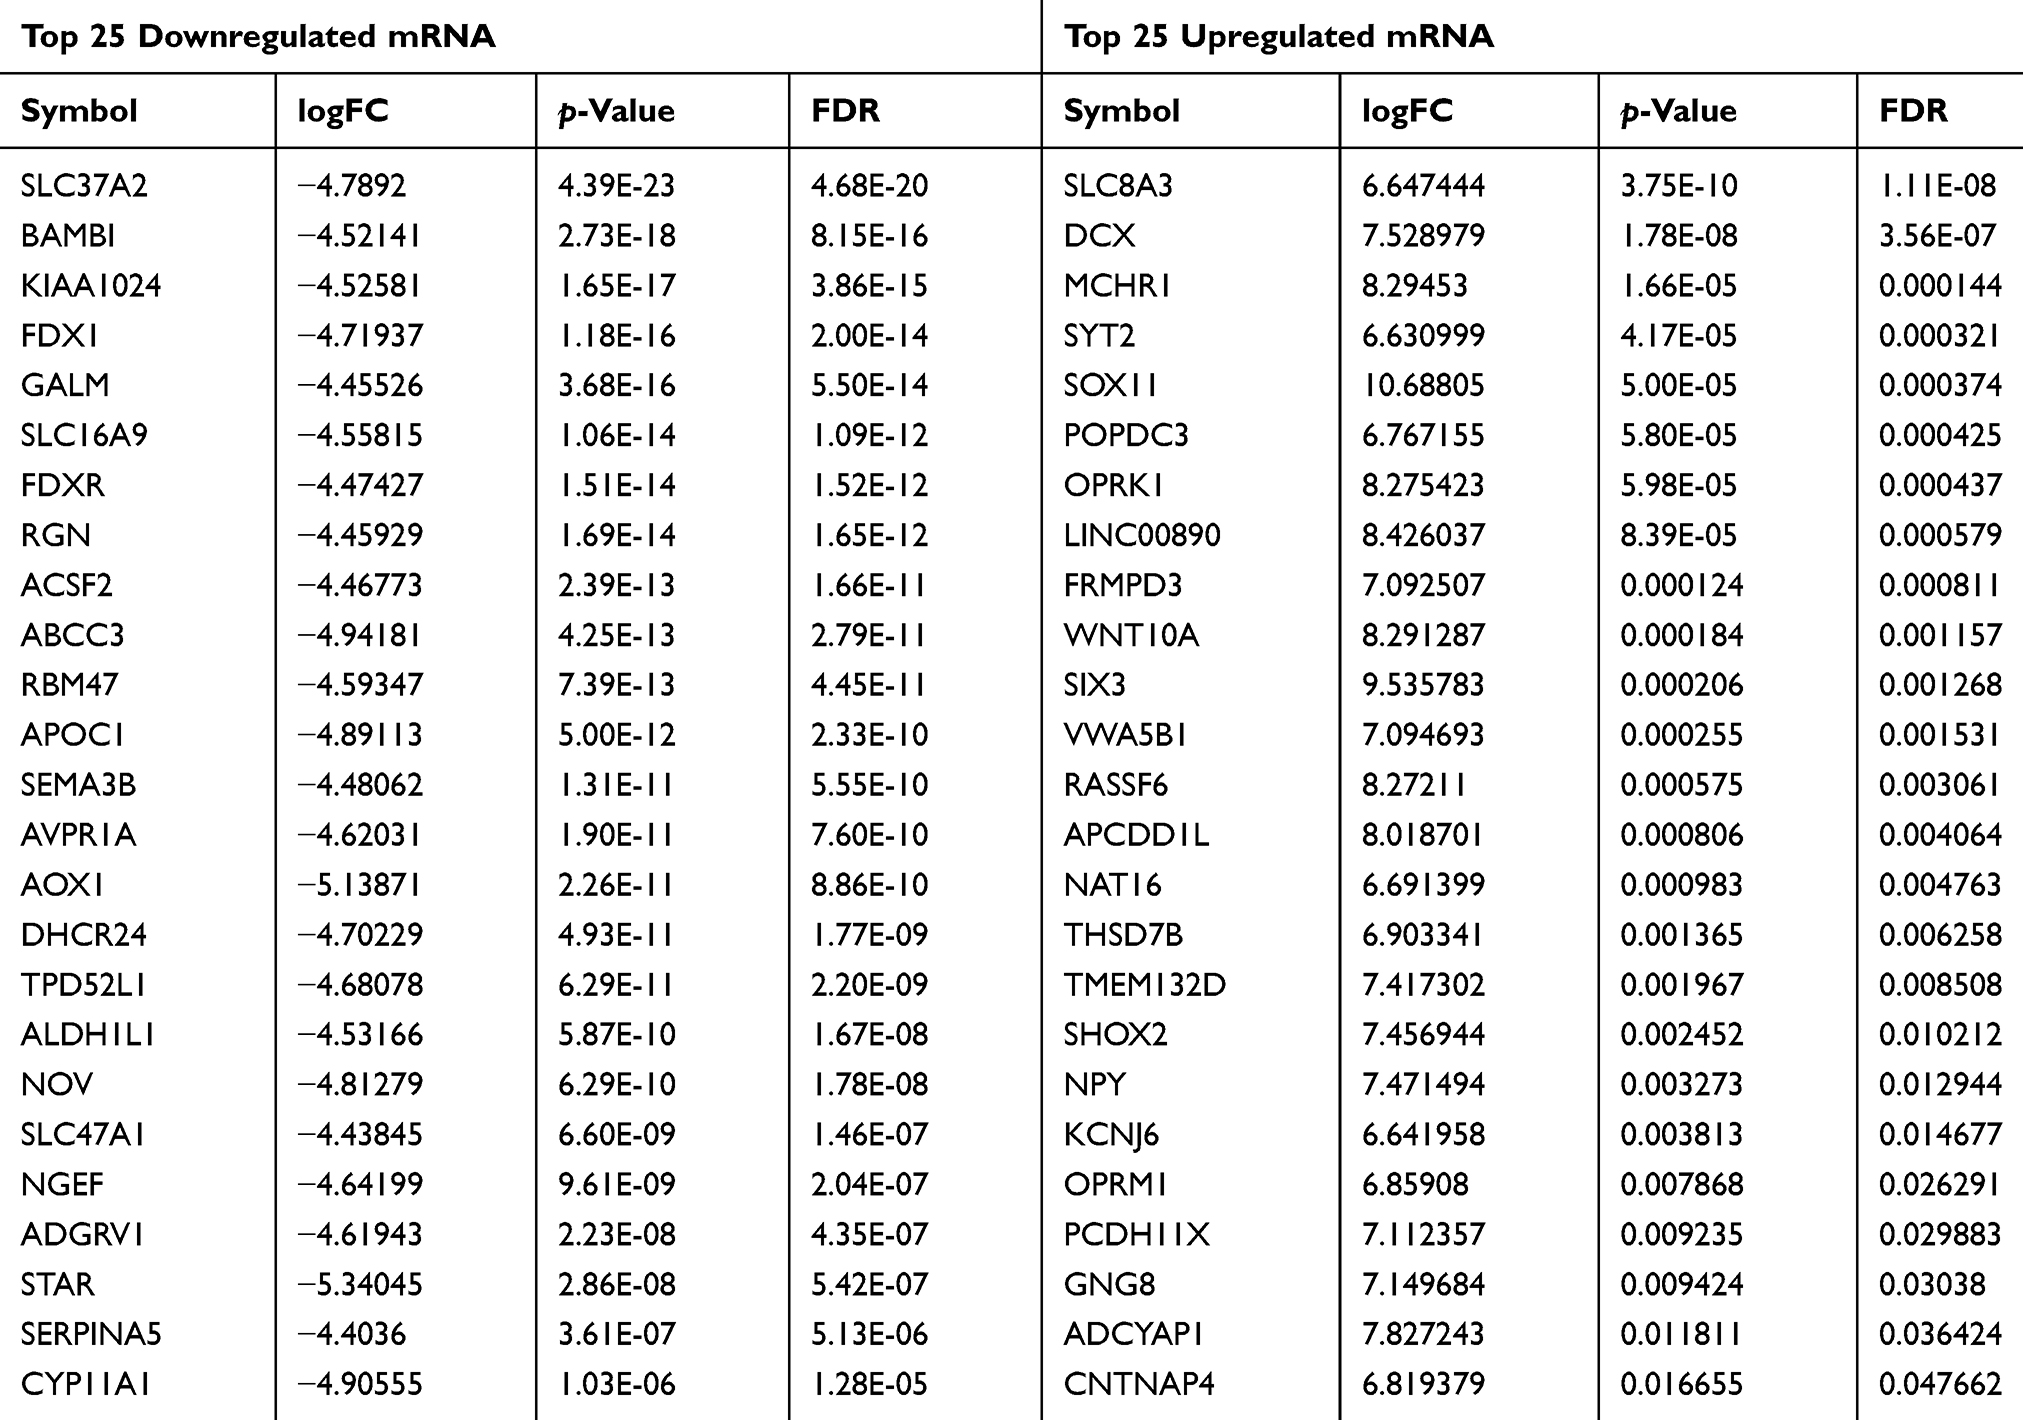 |
Table 1 Top 25 Downregulated and Top 25 Upregulated mRNA |
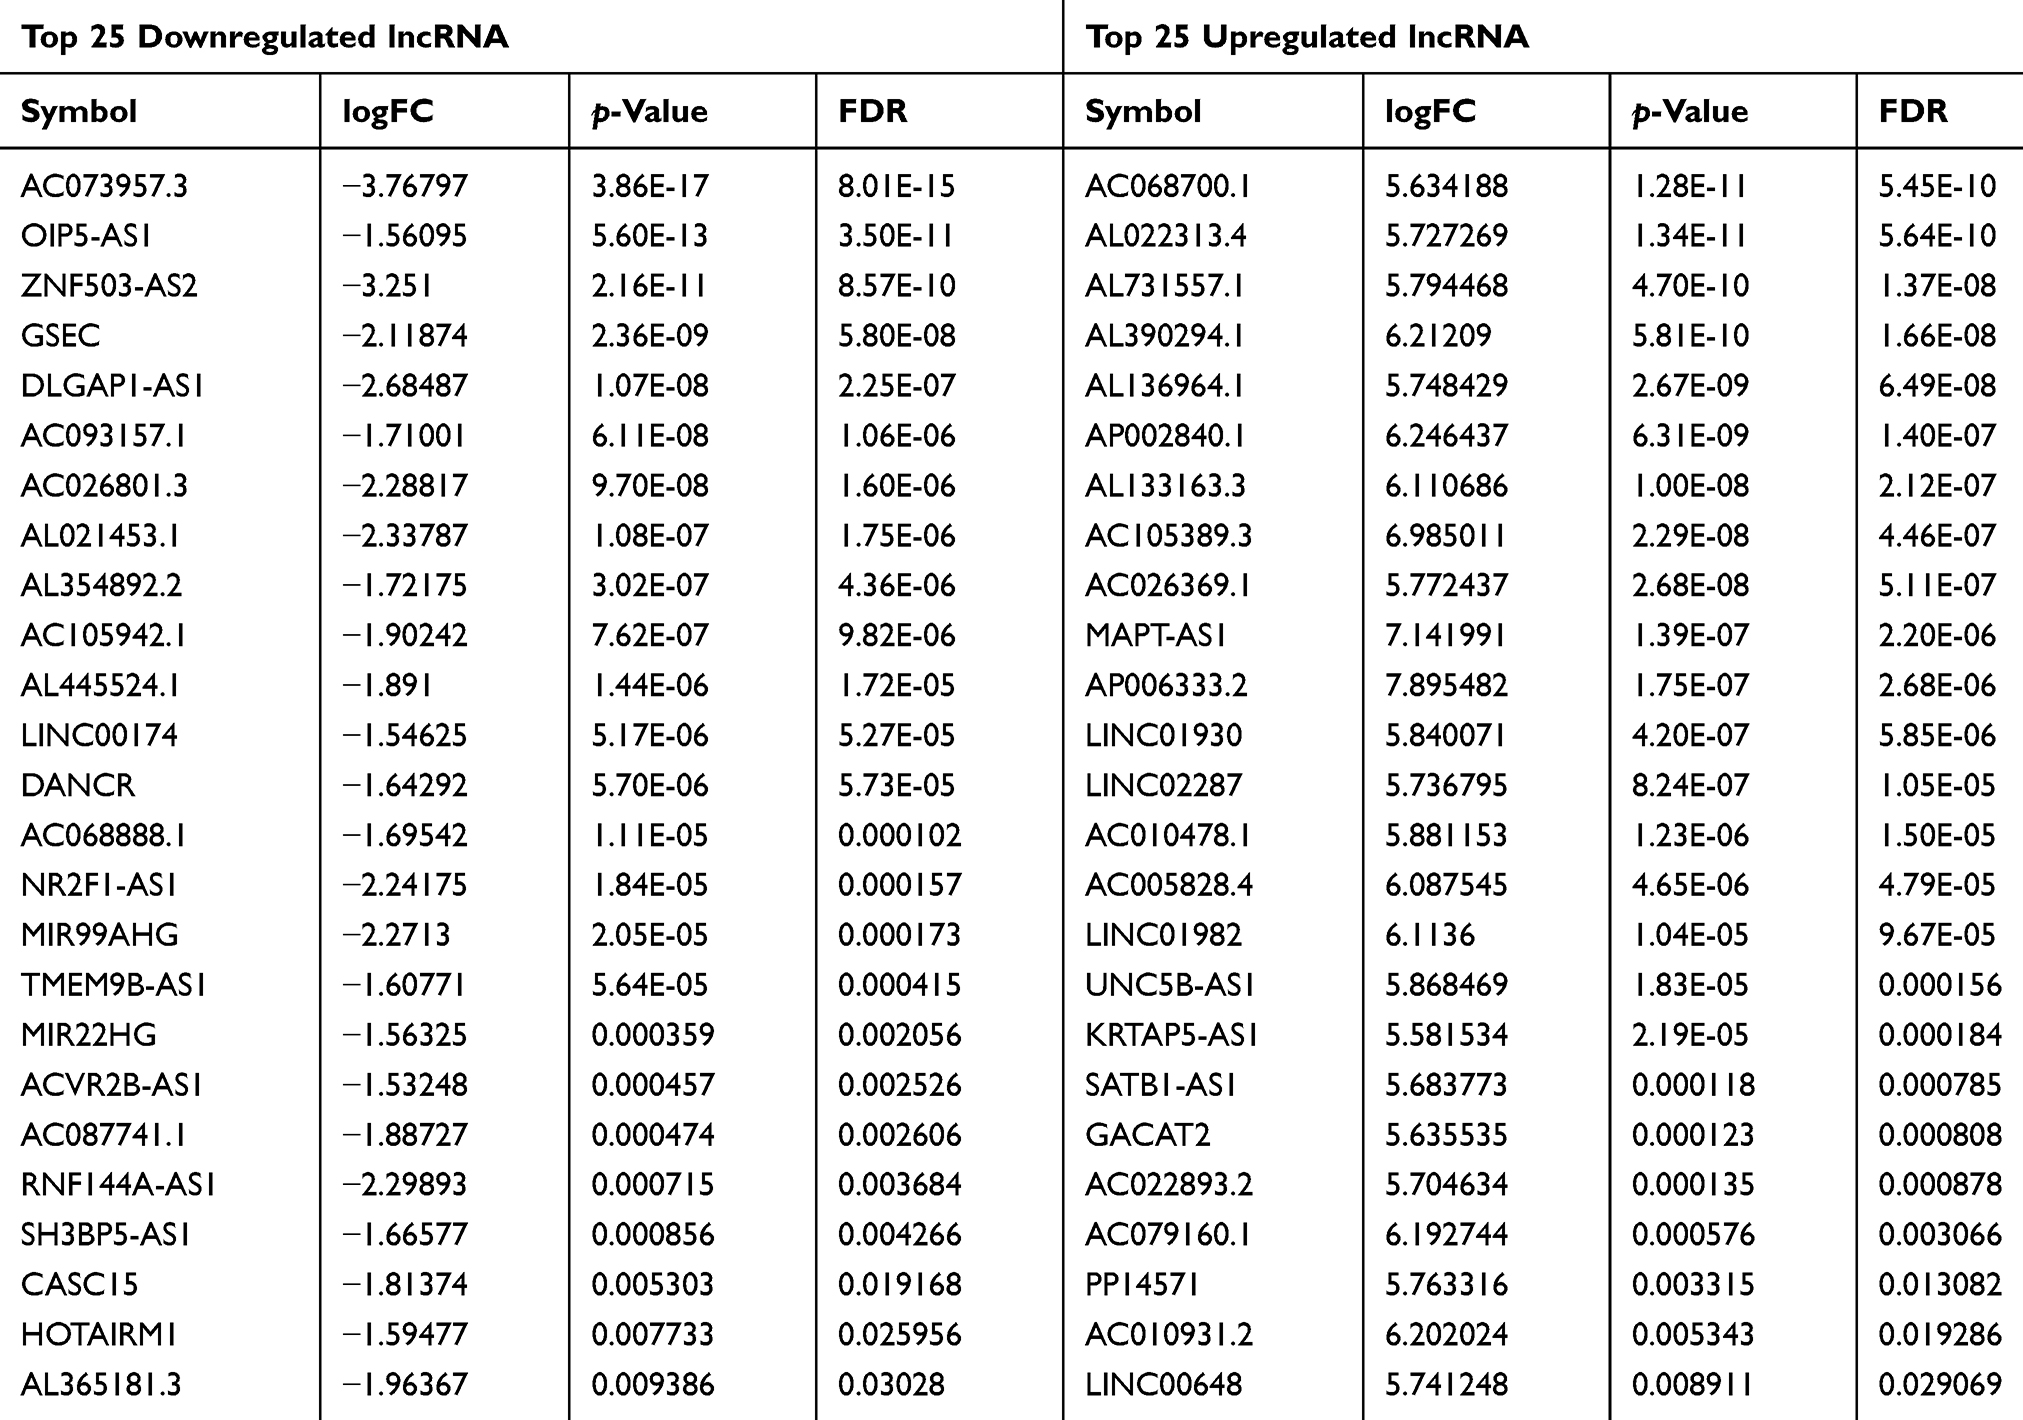 |
Table 2 Top 25 Downregulated and Top 25 Upregulated lncRNA |
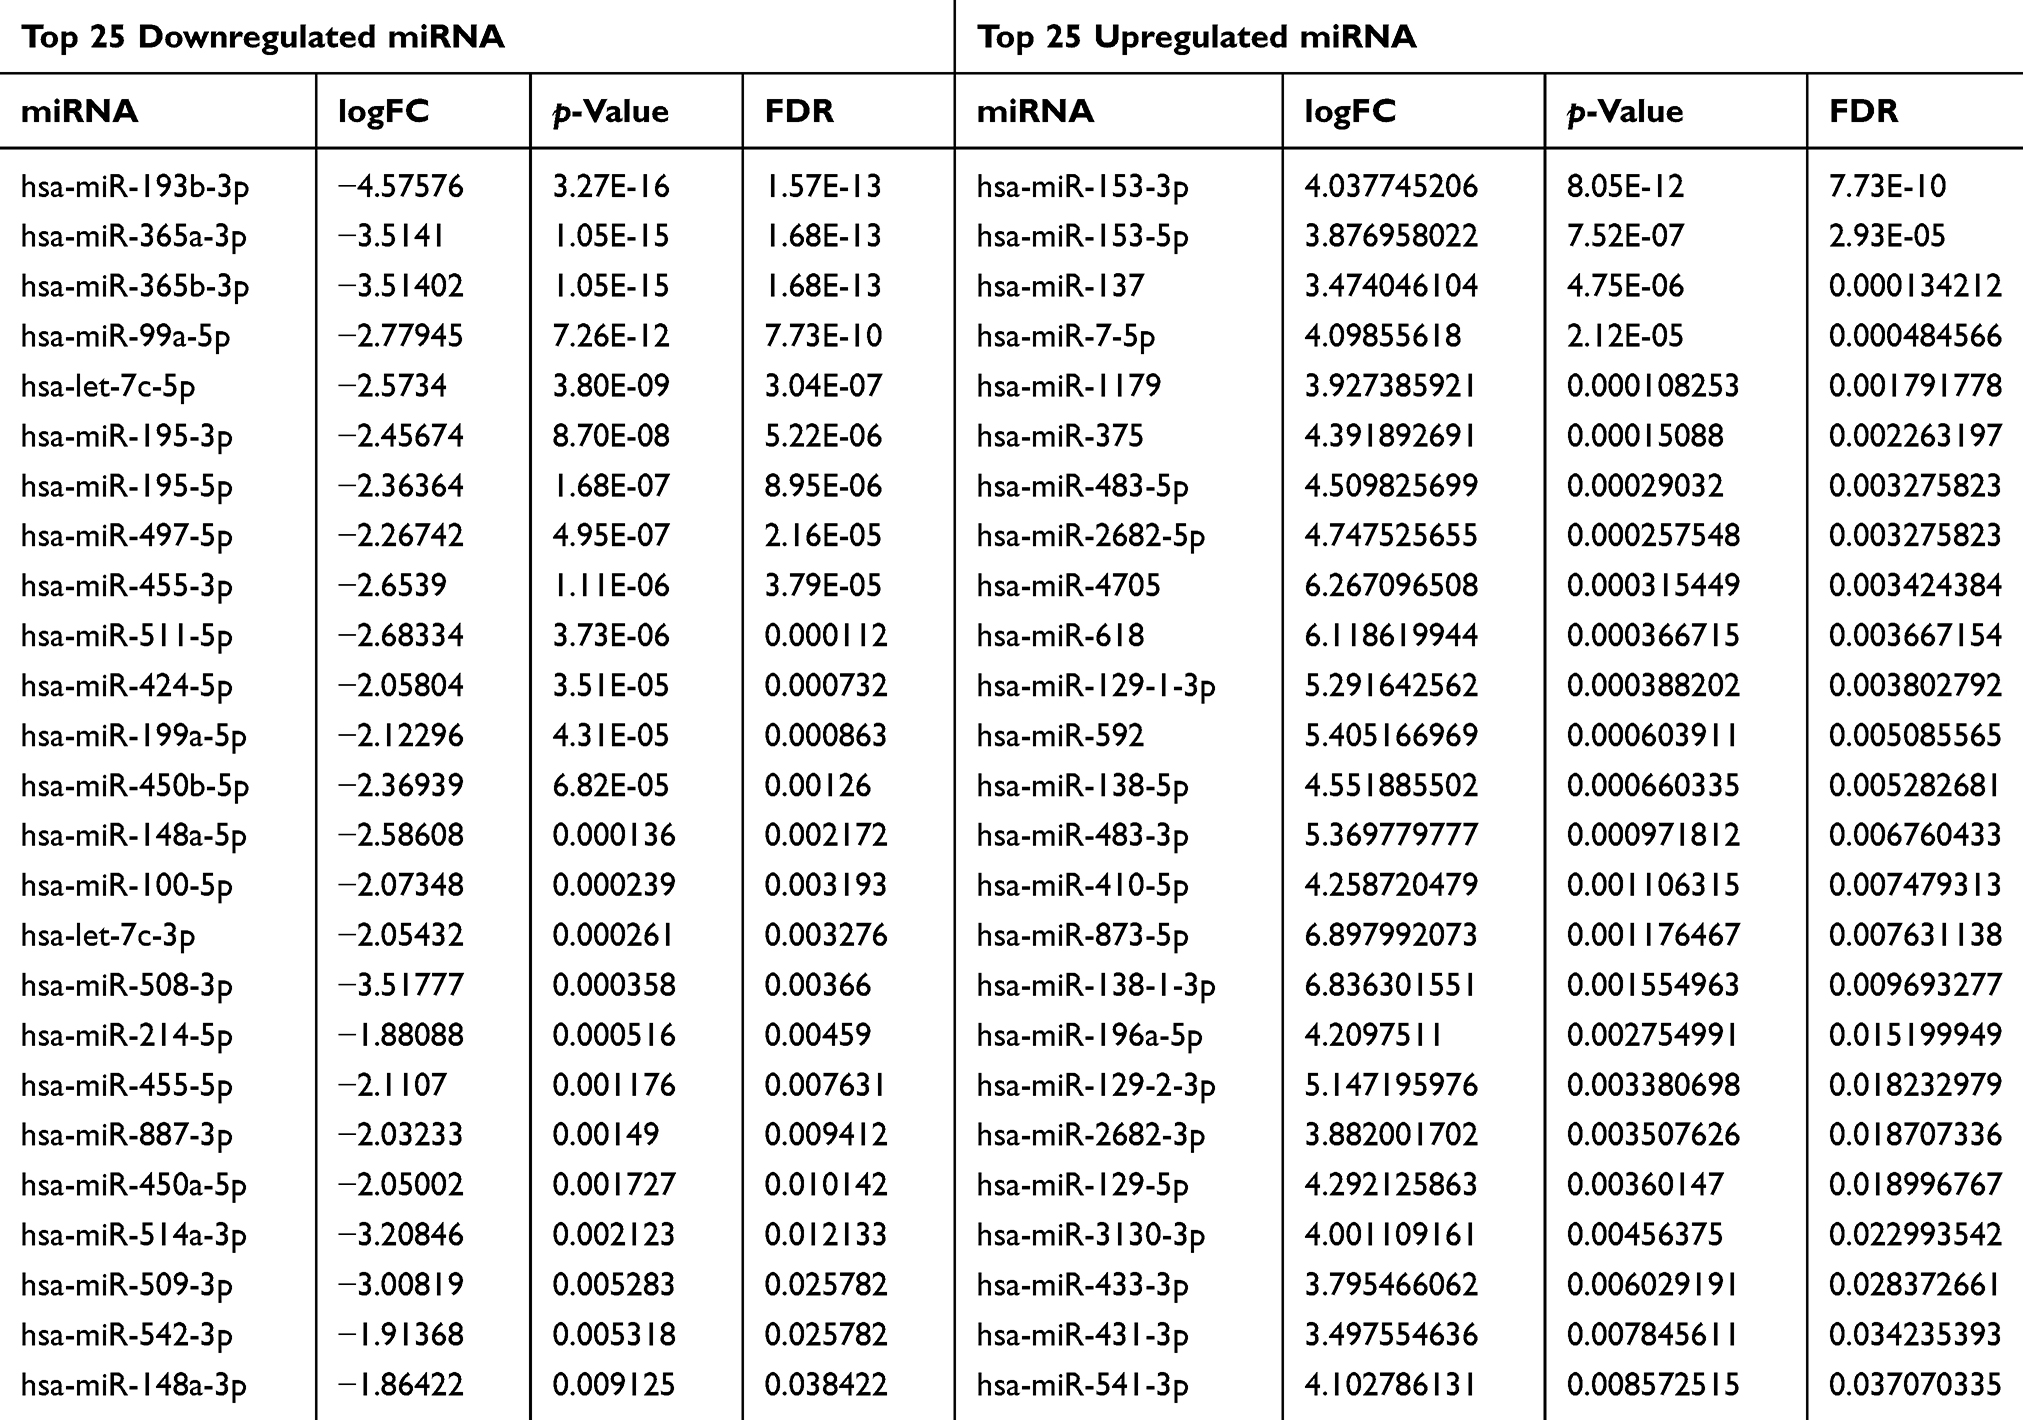 |
Table 3 Top 25 Downregulated and Top 25 Upregulated miRNA |
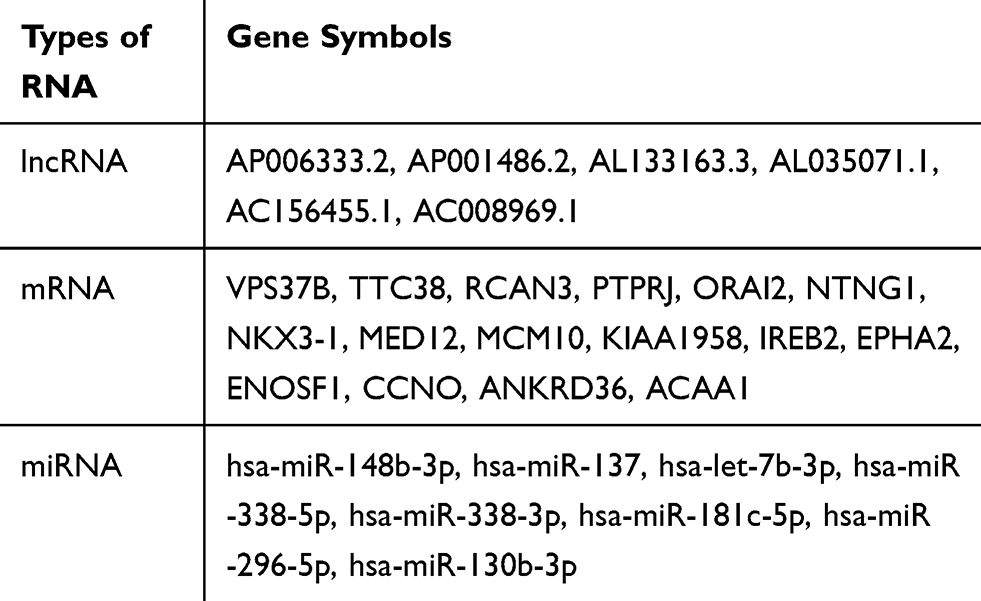 |
Table 4 Prognostic Biomarkers in Pheochromocytoma and Paraganglioma |
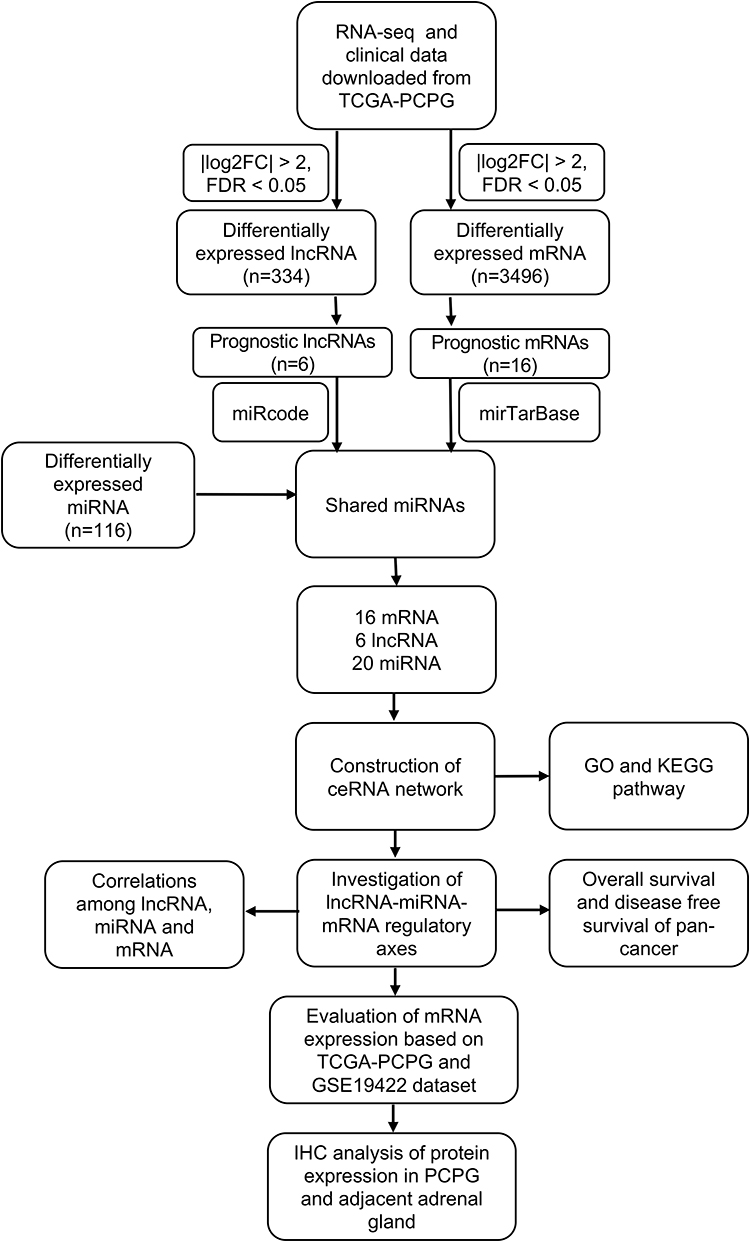 |
Figure 1 Workflow of the study. |
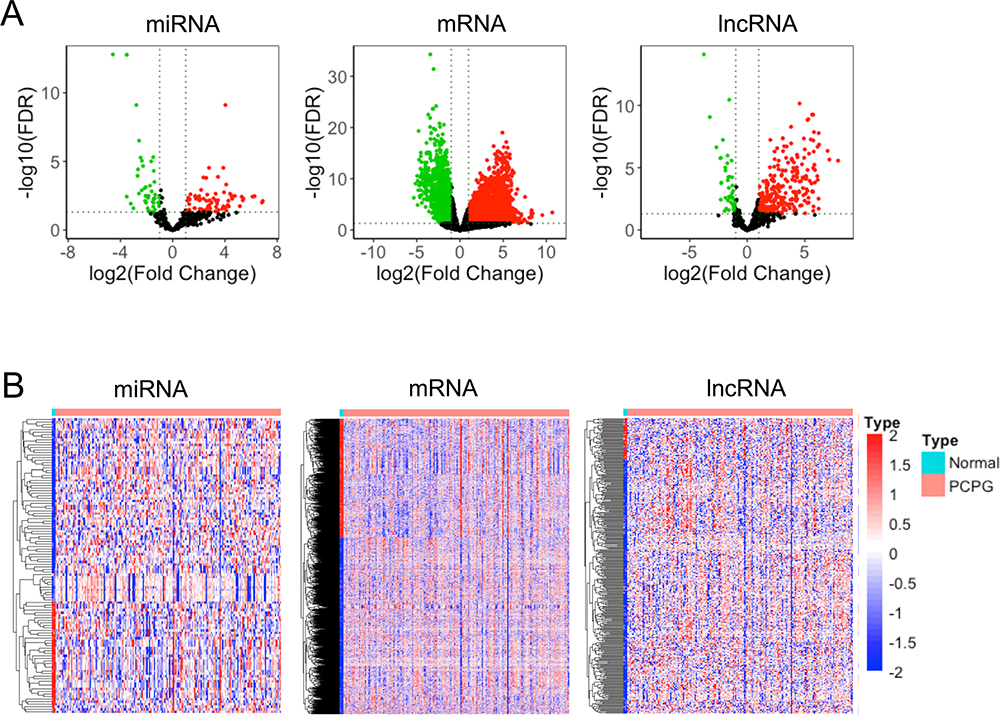 |
Figure 2 Differentially expressed miRNAs, mRNAs, and lncRNAs in tumor and normal adrenal gland tissues. (A) Volcano plots of miRNAs, mRNAs, and lncRNAs. Red: upregulated in tumor tissues. Green: upregulated in normal adrenal gland tissues. (B) Heatmap of differentially expressed lncRNAs (334 lncRNAs), differentially expressed mRNAs (3496 genes), and differentially expressed miRNAs (116 miRNAs). |
GO and KEGG Pathways Involved in PCPG
To investigate the function of differentially expressed mRNAs, analysis of the GO and KEGG pathways was performed. The main enriched biological processes were “synapse organization” (Figure 3A). The main enriched cellular components were “cell body” (Figure 3B). The main enriched molecular functions were “tubulin binding” (Figure 3C) (Supplementary Table 1). Differentially expressed genes were enriched in 59 KEGG signaling pathways (Supplementary Table 2) and the top 10 KEGG pathways are displayed in Figure 3D. Although the major functions of these differentially expressed mRNAs in PCPG are related to the metabolism and hormone secretion signaling pathways, there were some metastasis-associated pathways, such as “ECM-receptor interaction”, “adherens junction”, and “cell adhesion molecules”; pathways associated with proliferation, such as “MAPK signaling pathway”; and cancer metabolism-associated pathways, such as “choline metabolism in cancer”, “central carbon metabolism in cancer”, and “AMPK signaling pathway”.
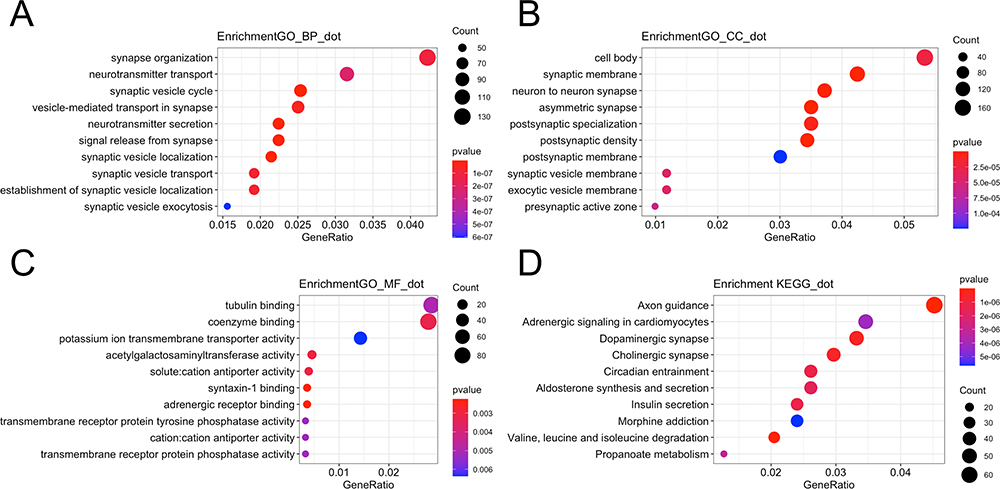 |
Figure 3 GO and KEGG pathways enriched in tumor tissues. (A) The top 10 enriched biological processes of differentially expressed genes. (B) The top 10 enriched cellular components of differentially expressed genes. (C) The top 10 enriched molecular functions of differentially expressed genes. (D) Bubble plot showing the top 10 enriched pathways. |
Identification of Prognostic Biomarkers
To identify the prognostic biomarkers in PCPG, Kaplan–Meier curves were plotted for each differentially expressed mRNA, miRNA, and lncRNA. In total, 16 mRNAs, six lncRNAs, and eight miRNAs were associated with the prognosis of PCPG patients (Table 4). For lncRNAs, the Kaplan–Meier curves of overall survival indicated that high expression of AP006333.2, AP001486.2, and AL035071.1 was associated with good prognosis, whereas high expression of AL133163.3, AC156455.1, and AC008969.1 was associated with poor prognosis (Figure 4). For miRNAs, the Kaplan–Meier curves of overall survival in this ceRNA network revealed that high expression of hsa-miR-148b-3p and hsa-miR-338-3p was associated with good prognosis (Figure 5). For mRNAs, the Kaplan–Meier curves of overall survival showed that high expression of VPS37B, TTC38, RCAN3, ORAI2, NTNG1, NKX3-1, EPHA2, ENOSF1, and ACAA1 was associated with good prognosis, whereas high expression of PTPRJ, MED12, MCM10, KIAA1958, IREB2, CCNO, and ANKRD36 was associated with poor prognosis (Figure 6).
 |
Figure 4 Kaplan–Meier survival curves for six differentially expressed long non-coding RNAs associated with overall survival in pheochromocytoma and paraganglioma. Six DElncRNAs are presented (p<0.05): AC008969.1, AC156455.1, AL035071.1, AL133163.3, AP001486.2, and AP006333.2. The initial pathological diagnosis of patients was set as day 0. Horizontal axis represents overall survival time (days) and vertical axis represents survival probability. |
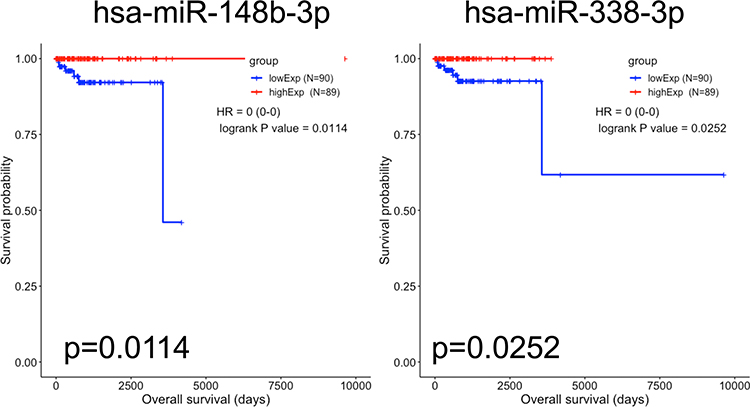 |
Figure 5 Kaplan–Meier survival curves for two differentially expressed miRNAs associated with overall survival in pheochromocytoma and paraganglioma. Two DEmiRNAs are presented (p<0.05): hsa-miR-148b-3p and hsa-miR-338-3p. The initial pathological diagnosis of patients was set as day 0. Horizontal axis represents overall survival time (days) and vertical axis represents survival probability. |
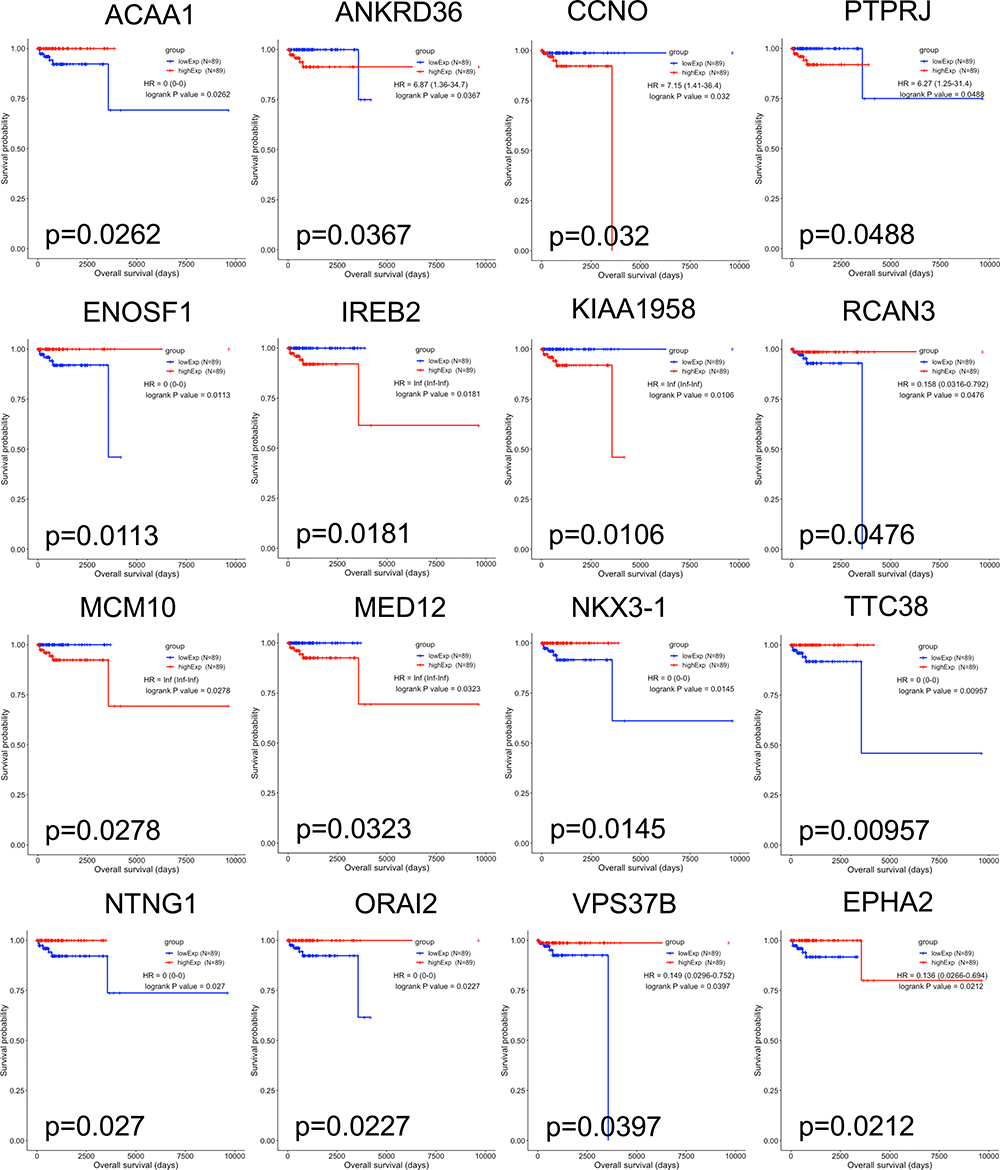 |
Figure 6 Kaplan–Meier survival curves for 16 differentially expressed mRNAs associated with overall survival in pheochromocytoma and paraganglioma. Sixteen DEmRNAs are presented (p<0.05): ACAA1, ANKRD36, CCNO, PTPRJ, ENOSF1, IREB2, KIAA1958, RCAN3, MCM10, MED12, NKX3-1, TTC38, NTNG1, ORAI2, VPS378, and EPHA2. The initial pathological diagnosis of patients was set as day 0. Horizontal axis represents overall survival time (days) and vertical axis represents survival probability. |
Different Expression of Prognostic Biomarkers Between Metastatic and Non-Metastatic PCPG Patients
By investigating the difference in expression of these prognostic biomarkers between metastatic patients and non-metastatic patients, we found that expression of hsa-miR-130b-3p and IREB2 was significantly higher in metastatic patients than in non-metastatic patients. In contrast, AP006333.2, hsa-miR-137, ACAA1, and NTNG1 were significantly more downregulated in metastatic patients compared with non-metastatic patients (Figure 7).
 |
Figure 7 Different expression of prognostic biomarkers between metastatic and non-metastatic PCPG patients. (A) Expression of lncRNA between metastatic and non-metastatic PCPG patients. (B) Expression of miRNA between metastatic and non-metastatic PCPG patients. (C) Expression of mRNA between metastatic and non-metastatic PCPG patients. |
Regulatory ceRNA Network and Two lncRNA–miRNA–mRNA Axes in PCPG
By exploring the interaction between prognostic lncRNA and differentially expressed miRNA, and the interaction between differentially expressed miRNA and prognostic mRNA, we found 20 shared miRNAs. The ceRNA regulatory network was based on 16 mRNAs, six lncRNAs, and 20 shared miRNAs (Figure 8A). Based on the difference of expression and correlation between lncRNA and mRNA, two lncRNA–miRNA–mRNA axes were identified: AP001486.2/hsa-miR-195-5p/RCAN3 and AP006333.2/hsa-miR-34a-5p/PTPRJ (Figure 8B). There were statistically significant positive correlations between AP001486.2 and RCAN3 (cor=0.46, p=1.4e-10) and between AP006333.2 and PTPRJ (cor=0.53, p=2.2e-14) (Figure 8C). There were significant negative correlations between AP001486.2 and hsa-miR-195-5p (cor=−0.26, p=0.00057), RCAN3 and hsa-miR-195-5p (cor=−0.19, p=0.01), AP006333.2 and hsa-miR-34a-5p (cor=−0.26, p=0.00057), and PTPRJ I and hsa-miR-34a-5p (cor=−0.23, p=0.0023).
 |
Figure 8 ceRNA network and regulatory axes. (A) A regulatory lncRNA–miRNA–mRNA ceRNA network in PCPG patients. Red: downregulated. Green: upregulated. Diamond shape: lncRNA. Rounded rectangle: miRNA. Triangle: mRNA. ceRNA: competitive endogenous RNA; PCPG: pheochromocytoma and paraganglioma. (B) Two lncRNA–miRNA–mRNA axes in the ceRNA network. (C) The expression of AP001486.2 was positively correlated with RCAN3 (R=0.46, p=1.4×10⁻¹⁰), whereas the expression of AP006333.2 was positively correlated with PTPRJ (R=0.53, p=2.2×10⁻¹⁴). The expression of hsa-miR-195-5p was negatively correlated with RCAN3 (R=−0.19, p=0.01) and AP001486.2 (R=−0.26, p=0.00057), whereas the expression of hsa-miR-34a-5p was negatively correlated with PTPRJ (R=−0.23, p=0.0023) and AP006333.2 (R=−0.26, p=0.00057). |
Correlations Between PCPG Genotypes and lncRNA–miRNA–mRNA Axes
In order to investigate the correlations between susceptibility genes and lncRNA–miRNA–mRNA axes, we extracted the expression value of 20 susceptibility genes and the lncRNA–miRNA–mRNA axes. We found that RET highly correlated with AP006333.2 in PCPG samples (R=0.66, p<2.2e-16) (Figure 9).
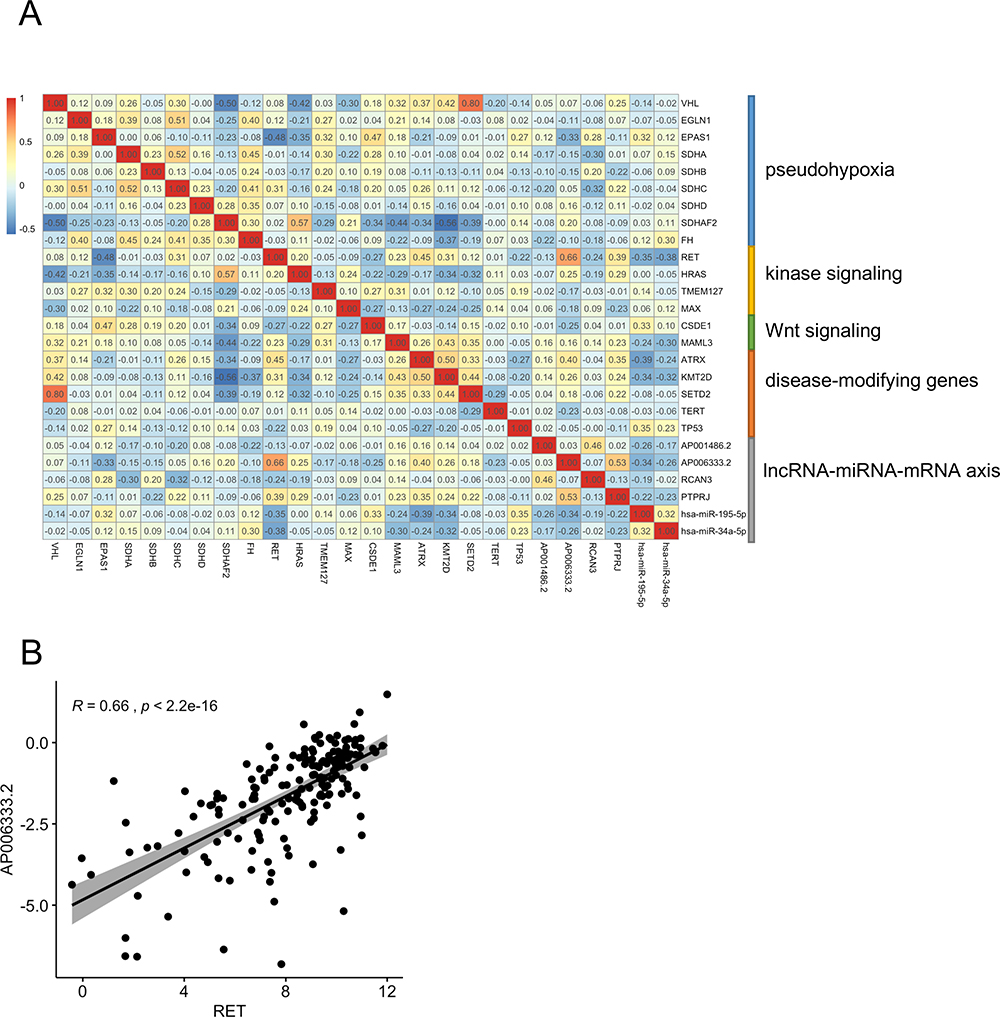 |
Figure 9 Correlations between PCPG genotypes and lncRNA–miRNA–mRNA axes. (A) Correlation heatmap of susceptibility genes and lncRNA–miRNA–mRNA axes genes. (B) Correlation plot between RET and AP006333.2. |
Enrichment Analysis Predicting the ceRNA Network
To predict the function of the ceRNA network, 16 mRNAs were involved in enrichment analysis of GO and KEGG pathways. The top 5 enriched biological processes (protein kinase B signaling, post-anal tail morphogenesis, positive regulation of cell junction assembly, negative regulation of protein kinase B signaling, and somitogenesis) are shown in Figure 10A. The top 5 enriched cellular components (ruffle membrane, specific granule, leading edge membrane, ruffle, and anchored component of synaptic membrane) are shown in Figure 10B. The top 5 enriched molecular functions (hydro-lyase activity, carbon-oxygen lyase activity, beta-catenin binding, nuclear hormone receptor binding, and lyase activity) are shown in Figure 10C. The top 5 enriched KEGG pathways (axon guidance, alpha-linolenic acid metabolism, biosynthesis of unsaturated fatty acids, fructose and mannose metabolism, and fatty acid degradation) are shown in Figure 10D. These results show that mRNAs in the ceRNA network were enriched in metabolism-related pathways.
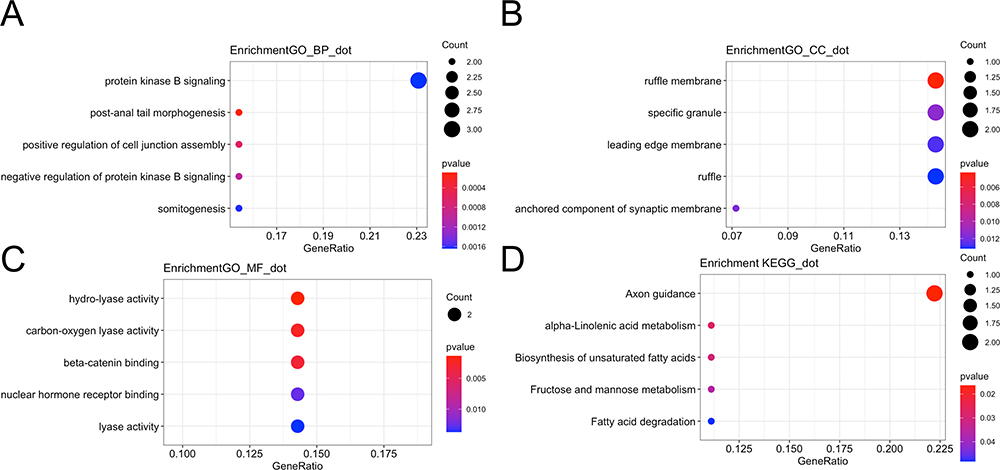 |
Figure 10 Enriched GO and KEGG pathways in the ceRNA network. (A) The top 5 enriched biological processes of the ceRNA network. (B) The top 5 enriched cellular components of the ceRNA network. (C) The top 5 enriched molecular functions of the ceRNA network. (D) Bubble plot showing the top 5 enriched pathways of the ceRNA network. |
Validation of Expression Levels of RCAN3 and PTPRJ and Prognostic Value in Pan-Cancer
Based on TCGA database, we found that RCAN3 and PTRPRJ expression levels in PCPG were higher than in normal adrenal gland tissue (RCAN3: p=0.0021; PTPRJ: p=0.00031). To validate the mRNA expression of RCAN3 and PTPRJ, we found a similar expression pattern of RCAN3 and PTPRJ in pheochromocytoma/paraganglioma primary tumors based on the GSE19422 dataset (RCAN3: p=0.00016; PTPRJ: p=0.014) (Figure 11). The results of IHC further indicated higher protein expression levels of RCAN3 and PTPRJ in pheochromocytoma/paraganglioma primary tumors compared with adjacent adrenal gland medulla tissues (RCAN3: p=0.0406, PTPRJ: p=0.0192) (Figure 12). To further identify the prognostic value of RCAN3 and PTPRJ, Kaplan–Meier curves of overall survival and disease-free survival in Pan-Cancer were plotted, and the high expression levels of RCAN3 and PTPRJ were associated with a favorable prognosis (Figure 13).
 |
Figure 11 PTPRJ and RCAN3 mRNA expression in TCGA and GSE19422 dataset. (A) PTPRJ and RCAN3 mRNA expression levels in PCPG were compared to normal adrenal gland tissue samples based on TCGA-PCPG database. (B) PTPRJ and RCAN3 mRNA expression levels in PCPG were compared to normal adrenal gland tissue levels based on the GSE19422 dataset. |
 |
Figure 12 Immunohistochemistry (IHC) analysis of protein expression of RCAN3 and PTPRJ in adjacent adrenal gland and PCPG tissues. (A) IHC results of RCAN3 and PTPRJ protein expression in adjacent adrenal gland and PCPG tissues. (B) Histogram of protein expression of RCAN3 and PTPRJ indicating that they were both upregulated in PCPG tissue compared with adjacent adrenal gland tissues. Scale bar, 50 µm. |
 |
Figure 13 Overall survival and disease-free survival of RCAN3 and PTPRJ mRNA expression in Pan-Cancer. |
Discussion
Previous studies have indicated that the mechanism of post-transcriptional regulation is complicated. Many factors, such as mRNA, miRNA, lncRNA, and circular RNA (circRNA), are involved. In our study, we integrally analyzed RNA-seq data and miRNA data of TCGA-PCPG and constructed a regulatory lncRNA–miRNA–mRNA network. Based on the ceRNA network, six lncRNAs, two miRNAs, and 16 mRNAs were identified as prognostic biomarkers in PCPG.
Several studies have identified differentially expressed genes of PCPG, which were different from those in our study. One previous study compared malignant PCPG with the benign samples from TCGA and COMETE databases to investigate malignancy-induced differentially expressed genes. It found 11 signaling pathways that were related to metabolic alteration and cancer signaling.13 Among these signaling pathways, dopamine signaling and cAMP signaling were also reported in our study. Another study used 183 pheochromocytoma samples and three control samples to identify differentially expressed RNAs that were annotated by conversion through the Ensembl file (Homo sapiens GRCh38.87.chr.gtf). In that study, the threshold was adjusted by p-value <0.01 and |log2 fold change (FC)| >2.0.14 Circadian entrainment, cholinergic synapse, and aldosterone synthesis and secretion were considered as the paramount pathways in their study. In our study, we included 178 PCPG samples and three normal adrenal gland samples from TCGA database and used the threshold of p<0.05 and |log2(fold change) | >2 to identify differentially expressed RNAs (lncRNA, miRNA, and mRNA) which were annotated within Ensembl 90. These identified differentially expressed RNAs were enriched in some KEGG signaling pathways that were related to metabolism alteration, hormone changes produced by the adrenal gland and tumorigenesis biological behavior. Some KEGG signaling pathways overlapped with study by Liang et al,14 such as glutamatergic synapse, circadian entrainment, cholinergic synapse, and aldosterone synthesis and secretion. Furthermore, some metastasis-associated pathways (such as ECM–receptor interaction, adherens junction, and cell adhesion molecules), proliferation-associated pathway (such as the MAPK signaling pathway), and cancer metabolism-associated pathways (such as choline metabolism in cancer, central carbon metabolism in cancer, and the AMPK signaling pathway) were mentioned in our study.
Functional, pathogenesis-based classification deepens our understanding of PCPG. The mutation of susceptibility genes dysregulates biological functions in PCPG. Based on this functional classification of susceptibility genes, PCPG patients can be divided into two clusters (cluster 1 and cluster 2)15 and further divided into four major groups: the pseudohypoxia group (VHL, EGLN1, EPAS1, SDHx, SDHAF2, FH), the kinase signaling group (RET, HRAS, TMEM127, MAX), the Wnt signaling group (CSDE1, MAML3), and the disease-modifying gene group (ATRX, KMT2D, SETD2, TERT, TP53).10 In our study, we found SDHA, SDHB, and RET as differentially expressed genes and the GO analysis revealed that the tricarboxylic acid cycle enzyme complex is involved in cellular components. This suggested that most of the patients with PCPG in TCGA database were in the pseudohypoxia group, in accordance with the previous study’s results.15
Studies on lncRNA in PCPG are emerging and several lncRNAs have been found to play a vital role in tumorigenesis and malignancy. Limited studies found that SOX2OT, EFNA3, and MALAT-1 were involved in injury induced by dihydrogen peroxide,16 hypoxia,17 and chemical hypoxia in PC-12 cells,18 respectively. A previous study indicated that LINC00472, RP11-455b3.1, and RP4-806M20.3 were associated with a poor clinical outcome in PCPG and the three lncRNAs served as prognostic biomarkers.19 More recently, another group identified C9orf147 and BSN-AS2 as independent prognostic lncRNAs for PCPG.14 In the present study, we identified that high expression of AC008969.1, AC156455.1, and AL133163.3 predicted a good prognosis in PCPG, while high expression of AP006333.2, AP001486.2, and AL035071.1 was associated with a poor prognosis. These six lncRNAs had not been reported in previous studies and needed to be further studied for their function and underlying mechanisms in PCPG.
Many studies have reported that miRNAs act as prognostic biomarkers in PCPG, such as miR-18320 and miR-483-5p.21 In our study, we found that high expression of two miRNAs, hsa-miR-148b-3p and hsa-miR-338-3p, was associated with a good prognosis in PCPG. Previous studies reported that hsa-miR-338-3p enhanced the risk of esophageal squamous cell carcinoma22 and decreased migration and invasion of colorectal carcinoma cells by targeting smoothened.23 miR-148b-3p was also associated with the osteogenic differentiation capability of BM-MSCs.24 These studies suggested various roles of miR-338-3p and miR-148b-3p in different diseases. In addition, we predicted that hsa-miR-195-5p and hsa-miR-34a-5p were involved in two lncRNA–miRNA–mRNA axes. hsa-miR-195 was also involved in a ceRNA network constructed by Liang et al14 and hsa-miR-195-5p was an anti-oncogene to inhibit cell proliferation and angiogenesis.25,26 hsa-miR-34a-5p was reported to induce apoptosis and cell-cycle arrest, and suppressed tumor invasion and migration.27
A number of mRNAs have been found as prognostic biomarkers in cancers.28 In our study, mRNAs in the ceRNA network were enriched in metabolism-related signaling pathways. Two genes (RCAN3, PTPRJ) are important in two predicted lncRNA–miRNA–mRNA axes. RCAN3 was a favorable prognostic biomarker while PTPRJ was an unfavorable marker in PCPG. RCAN3 not only may be involved in immune response as an endogenous regulator of the calcineurin–nuclear factor of activated T cells (NFAT) signaling pathway,29 but also plays a vital role in suppression of cancer.30 PTPRJ, also named CD148, could negatively regulate T-cell activation and play a role in feedback inhibition of T-cell immune responses,31 which may result in a poor prognosis in PCPG. However, in malignant cancers, PRPTJ acted as a tumor suppressor to inhibit the proliferation of cancer,32 suggesting a potential different mechanism by which PRPTJ serves as a favorable biomarker in Pan-Cancer.
There are some limitations of this study. First, the ceRNA network produced by our inclusion and exclusion criteria was not static and the updated databases may lead to more interactions of lncRNA–miRNA and mRNA–miRNA and expend the ceRNA network. Second, more cohorts of PCPG are required to validate novel prognostic biomarkers.
In summary, we successfully constructed an lncRNA–miRNA–mRNA regulatory ceRNA network in PCPG and identified 16 mRNAs, six lncRNAs, and two miRNAs as prognostic biomarkers. AP001486.2/hsa-miR-195-5p/RCAN3 and AP006333.2/hsa-miR-34a-5p/PTPRJ axes were predicted. These findings could contribute toward a better understanding of the biological mechanism of tumorigenesis of PCPG.
Abbreviations
ceRNA, competitive endogenous RNA; DElncRNA, differentially expressed lncRNA; DEmRNA, differentially expressed mRNA; DEmiRNA, differentially expressed miRNA; GO, gene ontology; KEGG, Kyoto Gene and Genomic Encyclopedia; PCPG, pheochromocytoma and paraganglioma; TCGA, The Cancer Genome Atlas.
Data Sharing Statement
The authors declare that the data supporting the findings of this study are available within the article.
Author Contributions
All authors have made great contributions to the concept and design, data acquisition or data analysis and interpretation; participated in the drafting of articles or strictly revised the content of important knowledge content; agreed to submit to the current journal; finally approved the version to be published; and agree to be responsible for all aspects of the work.
Funding
This study was supported by Hunan Provincial Natural Science Foundation of China (no. 2018JJ3762), the Fundamental Research Funds for the Central Universities of Central South University (no. 2018zzts262), China Scholarship Council (no. 201806370101, no. 201806375066), and the Scientific Research Project of Hunan Provincial Health Commission (no. 20190326). We would like to thank Editage for English language editing.
Disclosure
The authors declare that they have no conflict of interest.
References
1. Pang Y, Liu Y, Pacak K, Yang C. Pheochromocytomas and paragangliomas: from genetic diversity to targeted therapies. Cancers (Basel). 2019;11(4):436. doi:10.3390/cancers11040436
2. Welander J, Andreasson A, Juhlin CC, et al. Rare germline mutations identified by targeted next-generation sequencing of susceptibility genes in pheochromocytoma and paraganglioma. J Clin Endocrinol Metab. 2014;99(7):E1352–60. doi:10.1210/jc.2013-4375
3. Fishbein L, Leshchiner I, Walter V, et al. Comprehensive molecular characterization of pheochromocytoma and paraganglioma. Cancer Cell. 2017;31(2):181–193. doi:10.1016/j.ccell.2017.01.001
4. Calsina B, Castro-Vega LJ, Torres-Perez R, et al. Integrative multi-omics analysis identifies a prognostic miRNA signature and a targetable miR-21-3p/TSC2/mTOR axis in metastatic pheochromocytoma/paraganglioma. Theranostics. 2019;9(17):4946–4958. doi:10.7150/thno.35458
5. Dhamija S, Diederichs S. From junk to master regulators of invasion: lncRNA functions in migration, EMT and metastasis. Int J Cancer. 2016;139(2):269–280. doi:10.1002/ijc.30039
6. Job S, Georges A, Burnichon N, et al. Transcriptome analysis of lncRNAs in pheochromocytomas and paragangliomas. J Clin Endocrinol Metab. 2020;105(3):Mar. doi:10.1210/clinem/dgz168
7. Ghosal S, Das S, Pang Y, et al. Long intergenic noncoding RNA profiles of pheochromocytoma and paraganglioma: a novel prognostic biomarker. Int J Cancer. 2020;146(8):2326–2335. doi:10.1002/ijc.32654
8. Xiao X, Zhou T, Guo S, et al. LncRNA MALAT1 sponges miR-204 to promote osteoblast differentiation of human aortic valve interstitial cells through up-regulating Smad4. Int J Cardiol. 2017;243:404–412. doi:10.1016/j.ijcard.2017.05.037
9. Li R, Qu H, Wang S, et al. GDCRNATools: an R/Bioconductor package for integrative analysis of lncRNA, miRNA and mRNA data in GDC. Bioinformatics. 2018;34(14):2515–2517. doi:10.1093/bioinformatics/bty124
10. Kantorovich V, Pacak K. New insights on the pathogenesis of paraganglioma and pheochromocytoma. F1000Res. 2018;7:1500. doi:10.12688/f1000research.14568.1
11. Lopez-Jimenez E, Gomez-Lopez G, Leandro-Garcia LJ, et al. Research resource: transcriptional profiling reveals different pseudohypoxic signatures in SDHB and VHL-related pheochromocytomas. Mol Endocrinol. 2010;24(12):2382–2391. doi:10.1210/me.2010-0256
12. Tang Z, Li C, Kang B, Gao G, Li C, Zhang Z. GEPIA: a web server for cancer and normal gene expression profiling and interactive analyses. Nucleic Acids Res. 2017;45(W1):W98–W102. doi:10.1093/nar/gkx247
13. Suh YJ, Park JH, Bilegsaikhan SE, Lee DJ. Transcriptome analysis reveals significant differences in gene expression of malignant pheochromocytoma or paraganglioma. Int J Endocrinol. 2019;2019:7014240. doi:10.1155/2019/7014240
14. Liang YC, Wu YP, Chen DN, et al. Building a competing endogenous RNA network to find potential long non-coding RNA biomarkers for pheochromocytoma. Cell Physiol Biochem. 2018;51(6):2916–2924. doi:10.1159/000496043
15. Backman S, Maharjan R, Falk-Delgado A, et al. Global DNA methylation analysis identifies two discrete clusters of pheochromocytoma with distinct genomic and genetic alterations. Sci Rep. 2017;7:44943. doi:10.1038/srep44943
16. Yin D, Zheng X, Zhuang J, Wang L, Liu B, Chang Y. Downregulation of long noncoding RNA Sox2ot protects PC-12 cells from hydrogen peroxide-induced injury in spinal cord injury via regulating the miR-211-myeloid cell leukemia-1 isoform2 axis. J Cell Biochem. 2018;119(12):9675–9684. doi:10.1002/jcb.27280
17. Gong W, Qie S, Huang P, Xi J. Deletion of long noncoding RNA EFNA3 aggravates hypoxia-induced injury in PC-12 cells by upregulation of miR-101a. J Cell Biochem. 2019;120(1):836–847. doi:10.1002/jcb.27444
18. Yang L, Xu F, Zhang M, et al. Role of LncRNA MALAT-1 in hypoxia-induced PC12 cell injury via regulating p38MAPK signaling pathway. Neurosci Lett. 2018;670:41–47. doi:10.1016/j.neulet.2018.01.036
19. Ghosal S, Das S, Pang Y, et al. Long intergenic noncoding RNA profiles of pheochromocytoma and paraganglioma: a novel prognostic biomarker. Int J Cancer. 2019. doi:10.1002/ijc.32654
20. Pillai S, Lo CY, Liew V, et al. MicroRNA 183 family profiles in pheochromocytomas are related to clinical parameters and SDHB expression. Hum Pathol. 2017;64:91–97. doi:10.1016/j.humpath.2017.03.017
21. Lowery AJ, Walsh S, McDermott EW, Prichard RS. Molecular and therapeutic advances in the diagnosis and management of malignant pheochromocytomas and paragangliomas. The Oncologist. 2013;18(4):391–407. doi:10.1634/theoncologist.2012-0410
22. Yang M, Liu R, Sheng J, et al. Differential expression profiles of microRNAs as potential biomarkers for the early diagnosis of esophageal squamous cell carcinoma. Oncol Rep. 2013;29(1):169–176. doi:10.3892/or.2012.2105
23. Xue Q, Sun K, Deng HJ, Lei ST, Dong JQ, Li GX. MicroRNA-338-3p inhibits colorectal carcinoma cell invasion and migration by targeting smoothened. Jpn J Clin Oncol. 2014;44(1):13–21. doi:10.1093/jjco/hyt181
24. Mollazadeh S, Fazly Bazzaz BS, Neshati V, et al. Overexpression of MicroRNA-148b-3p stimulates osteogenesis of human bone marrow-derived mesenchymal stem cells: the role of MicroRNA-148b-3p in osteogenesis. BMC Med Genet. 2019;20(1):117. doi:10.1186/s12881-019-0854-3
25. Cai C, He H, Duan X, et al. miR-195 inhibits cell proliferation and angiogenesis in human prostate cancer by downregulating PRR11 expression. Oncol Rep. 2018;39(4):1658–1670. doi:10.3892/or.2018.6240
26. Xu H, Hu YW, Zhao JY, et al. MicroRNA-195-5p acts as an anti-oncogene by targeting PHF19 in hepatocellular carcinoma. Oncol Rep. 2015;34(1):175–182. doi:10.3892/or.2015.3957
27. Haghi M, Taha MF, Javeri A. Suppressive effect of exogenous miR-16 and miR-34a on tumorigenesis of breast cancer cells. J Cell Biochem. 2019;120(8):13342–13353. doi:10.1002/jcb.28608
28. Chistiakov DA, Myasoedova VA, Grechko AV, Melnichenko AA, Orekhov AN. New biomarkers for diagnosis and prognosis of localized prostate cancer. Semin Cancer Biol. 2018;52(Pt 1):9–16. doi:10.1016/j.semcancer.2018.01.012
29. Park JS, Jeong JH, Byun JK, et al. Regulator of Calcineurin 3 ameliorates autoimmune arthritis by suppressing Th17 cell differentiation. Am J Pathol. 2017;187(9):2034–2045. doi:10.1016/j.ajpath.2017.05.008
30. Martinez-Hoyer S, Sole-Sanchez S, Aguado F, et al. A novel role for an RCAN3-derived peptide as a tumor suppressor in breast cancer. Carcinogenesis. 2015;36(7):792–799. doi:10.1093/carcin/bgv056
31. Harrod TR, Justement LB. Evaluating function of transmembrane protein tyrosine phosphatase CD148 in lymphocyte biology. Immunol Res. 2002;26(1–3):153–166. doi:10.1385/ir:26:1-3:153
32. Zhang XF, Tu R, Li K, Ye P, Cui X. Tumor Suppressor PTPRJ Is a Target of miR-155 in Colorectal Cancer. J Cell Biochem. 2017;118(10):3391–3400. doi:10.1002/jcb.25995
 © 2020 The Author(s). This work is published and licensed by Dove Medical Press Limited. The
full terms of this license are available at https://www.dovepress.com/terms
and incorporate the Creative Commons Attribution
- Non Commercial (unported, 3.0) License.
By accessing the work you hereby accept the Terms. Non-commercial uses of the work are permitted
without any further permission from Dove Medical Press Limited, provided the work is properly
attributed. For permission for commercial use of this work, please see paragraphs 4.2 and 5 of our Terms.
© 2020 The Author(s). This work is published and licensed by Dove Medical Press Limited. The
full terms of this license are available at https://www.dovepress.com/terms
and incorporate the Creative Commons Attribution
- Non Commercial (unported, 3.0) License.
By accessing the work you hereby accept the Terms. Non-commercial uses of the work are permitted
without any further permission from Dove Medical Press Limited, provided the work is properly
attributed. For permission for commercial use of this work, please see paragraphs 4.2 and 5 of our Terms.