Back to Journals » International Journal of General Medicine » Volume 15
Comprehensive Analysis and Prognosis Prediction of N6-Methyladenosine-Related lncRNAs in Immune Microenvironment Infiltration of Gastric Cancer
Authors Huang J ![]() , Chen W, Chen C
, Chen W, Chen C ![]() , Jie Z, Xiao T
, Jie Z, Xiao T
Received 26 November 2021
Accepted for publication 24 February 2022
Published 8 March 2022 Volume 2022:15 Pages 2629—2643
DOI https://doi.org/10.2147/IJGM.S349399
Checked for plagiarism Yes
Review by Single anonymous peer review
Peer reviewer comments 2
Editor who approved publication: Dr Scott Fraser
Jianfeng Huang,* Wenzheng Chen,* Changyu Chen,* Zhigang Jie, Tao Xiao
Department of Gastrointestinal Surgery, The First Affiliated Hospital of Nanchang University, Nanchang, 330006, Jiangxi, People’s Republic of China
*These authors contributed equally to this work
Correspondence: Zhigang Jie; Tao Xiao, Department of Gastrointestinal Surgery, The First Affiliated Hospital of Nanchang University, No. 1519 Dongyue Road, Nanchang, 330006, Jiangxi, People’s Republic of China, Email [email protected]; [email protected]
Purpose: N6-methyladenosine (m6A) RNA modification plays an important role in regulating tumor microenvironment (TME) infiltration. However, the relationship between the expression pattern of m6A-related long non-coding RNAs (lncRNAs) and the immune microenvironment of gastric cancer (GC) is unclear.
Methods: In this study, 23 m6A-related lncRNAs were identified by Pearson’s correlation analysis and univariate Cox regression analysis. According to the expression of these lncRNAs, we identified two distinct molecular clusters by consensus clustering and compared the differences of the TME and enriched pathways between the two clusters. We further constructed a prognostic risk signature and verified it using The Cancer Genome Atlas training and testing cohorts.
Results: The results showed that cluster 1 was associated with tumor-related and immune activation-related pathways. In addition, cluster 1 was also associated with higher ImmuneScore, StromalScore, and ESTIMATEScore. The results of the stratified survival analysis and independent prognosis analysis indicated that the risk signature is an independent prognostic indicator for patients with GC. In addition, it can effectively predict survival status in patients with different clinical characteristics. Furthermore, we found that the risk signature was associated with a variety of tumor-infiltrating immune cells, and that low risk scores were significantly correlated with high expression of programmed death-1 (PD-1) and cytotoxic T-lymphocyte associated protein 4 (CTLA4), as well as sensitivity to chemotherapeutic drugs (eg, fluorouracil and oxaliplatin).
Conclusion: This evidence contributes to our understanding of the regulation of TME infiltration by m6A-related lncRNAs and may lead to more effective immunotherapy and chemotherapy for patients with GC.
Keywords: N6-methyladenosine, gastric cancer, tumor microenvironment, lncRNA risk signature, prognostic
Introduction
According to global cancer data, gastric cancer (GC) ranks fifth in incidence and third in cancer-related death, with >1 million new cases and approximately 769,000 deaths reported annually.1,2 At the time of treatment, most patients with GC are already in the advanced stage of the disease. Consequently, they are prone to recurrence and metastasis following surgical resection, resulting in a 5-year survival rate <40%.3 Therefore, the identification of new prognostic markers and development of new therapeutic targets is necessary to improve the survival time of patients with advanced GC.
N6-methyladenosine (m6A) is one of the most widely studied methylation modifications and the most important chemical modification of eukaryotic messenger RNAs (mRNAs).4,5 Accumulating evidence has shown that m6A modification mediates a dynamic and reversible process,6 which is composed of the methyltransferase complex (writers), demethylase (erasers), and functional manager (readers) to perform biological functions.7 M6A methylation is involved in the maturation, translation, and splicing of mRNA.8 Moreover, it affects tissue development, cell self-renewal, DNA damage response, and is closely related to the occurrence and development of numerous types of tumors.9–11 Recently, the expression of m6A-related genes in GC and their potential role in the tumor microenvironment (TME) have been extensively described. Xu et al found that the expression of m6A key genes leads to changes in the immune microenvironment, thus affecting the prognosis of patients with GC.12 Zhang et al reported the methylation modification patterns of m6A based on 21 m6A regulators and their correlation with TME infiltration in GC.13 Thus far, most studies on m6A-related genes and GC have focused on protein-coding genes.
Long non-coding RNAs (lncRNAs) are the main component of non-coding RNAs (length: ≥200 bp). Previous studies have shown that they largely play a key role in chromatin modification, as well as transcriptional and post-transcriptional regulation.14 Recent studies have demonstrated that lncRNAs are involved in the remodeling of the TME and may lead to tumor immunosuppression.15 Xu et al reported that lncRNA SATB2 antisense RNA 1 (SATB2-AS1) can affect the microenvironment of immune cells in colorectal cancer by regulating SATB2, thereby affecting the prognosis of patients.16 However, the relationship between the expression pattern of m6A-related lncRNAs and TME infiltration in GC is unclear.
In the present study, we identified and analyzed m6A-related lncRNAs associated with the prognosis of GC using data obtained from The Cancer Genome Atlas (TCGA) database. Using the consensus clustering method, these lncRNAs were divided into two subgroups. Differences in prognosis and the TME between the two subgroups were compared, and their potential functions were explored. Furthermore, a risk signature of m6A-related lncRNAs was constructed, and the relationship between risk score and immune cell infiltration, immune checkpoint inhibitors, and chemosensitivity was analyzed. These studies can be useful in predicting the prognosis of patients with GC and lead to individualized treatment.
Materials and Methods
Data Acquisition and Correlation Analysis
RNA-sequencing transcriptome data and clinical data from TCGA (https://tcga-data.nci.nih.gov/tcga/) database for the Stomach Adenocarcinoma (STAD) project were downloaded on April 20, 2021. GTF files from the Ensembl (http://asia.ensembl.org) database for differentiating and identifying the mRNAs and lncRNAs were also downloaded. We performed Pearson correlation analysis to identify m6A-related lncRNAs. The thresholds were set as absolute correlation coefficient >0.4 and p-value <0.001.
Identification of lncRNAs Related to the Prognosis of GC
Univariate Cox regression analysis was used to identify lncRNAs associated with the prognosis of GC from 491 m6A-related lncRNAs (P<0.05). These lncRNAs were used for subsequent analysis.
Consensus Clustering of m6A-Related lncRNAs
Firstly, we removed the normal tissue samples. Based on the expression of 23 lncRNAs, we used the ConsensusClusterPlus package30 to group 375 GC tissues. Next, we used the CDF value to verify the results of clustering. The KM curve and clinical factors were used to test the relationship between clustering results and prognosis.
GSEA
We investigated the potential KEGG pathways between different cluster subgroups using the GSEA and retrieved the reference gene set from the c2.cp.kegg.v7.1.symbols files. A P-value <0.05 and false discovery rate <0.05 denoted significantly enriched pathways.
Construction and Validation of a Risk Signature Model
LASSO Provisional Cox regression analysis was performed to construct a m6A-related lncRNAs risk signature model using the training and testing sets. The formula used to calculate the risk scores was as follows: Risk score = Ʃ (Exp [lncRNA] × coef [lncRNA]), where Exp [lncRNA] presents the expression of each lncRNA and coef [lncRNA] represents the coefficient of each lncRNA. The KM and ROC curves were used to evaluate the performance of the risk signature.
Correlations with Clinicopathological Characteristics and Establishment of a Nomogram
The complete dataset with corresponding clinical information was used for subsequent analysis. KM survival subgroup analysis, as well as univariate and multivariate Cox regression analyses, were used to determine whether the risk signature and clinical traits were related to the OS of patients with GC. Nomograms were constructed to calculate the total score and predict the probability of 1-, 2-, and 3-year survival.
TME and Tumor-Infiltrating Immune Cells
The proportion of the immune-stromal component in the TME of distinct cluster subgroups was estimated using the ESTIMATE algorithm31 in R language version 3.6.3 and presented as the Immune score, StromalScore, and ESTIMATEScore. The CIBERSORT algorithm32 was used to evaluate the infiltration levels of different immune cells in the high- and low-risk groups.
Prediction of Sensitivity to Immunotherapy and Chemotherapy
The Ggstatsplot package was utilized to understand the relationship between the risk score and effectiveness of common immune checkpoint inhibitors. Based on the STAD dataset from TCGA, the IC50 of common chemotherapeutics was calculated to evaluate the sensitivity to chemotherapy using the pRRophetic package.33
Statistical Analysis
The correlation between genes and lncRNAs was determined using Pearson correlation analysis. Patients with GC were divided into different groups according to the consistency analysis or risk score; the median was used as the cut-off value. The clinical data of the subgroups were analyzed using the chi-squared test or Fisher’s exact test. Differences in the survival rate between groups were determined according to the KM survival curve and verified using the Log rank test. The R version 4.0 was used for all statistical analysis; P-values <0.05 denoted statistically significant differences.
Results
Identification of m6A-Related lncRNAs in GC
The analytical process used in this study is shown in Figure 1. Firstly, we downloaded transcriptome RNA-sequencing data of 32 normal and 375 tumor samples, as well as matched clinical data of 371 cases of GC from TCGA database. Subsequently, the transcriptome data were annotated according to Ensembl’s gene transfer format (GTF) files, and mRNAs and lncRNAs were distinguished. For the identification of m6A-related lncRNAs, co-expression analysis was performed to assess the relationship between 21 m6A RNA methylation regulators and lncRNAs. Among all lncRNAs related to m6A, those with |R|>0. 4 and P<0. 001 were considered valuable. A total of 625 interactions (29 and 596 negative and positive correlations, respectively) and 491 m6A-related lncRNAs were identified (Figure 2A, Supplementary Table S1).
 |
Figure 1 Analysis workflow of this study. |
 |
Figure 2 Identification of m6A-related lncRNAs. (A) The co-expression network view shows the lncRNAs highly related to m6A (R>0.4, P<0.001). (B) Forest map showing 23 lncRNAs identified by the univariate cox regression method. Heatmap (C) and boxplot (D) showing the differential expression of 23 lncRNAs in gastric cancer and adjacent normal tissues. *P<0.05, **P<0.01, and ***P<0.001. |
Identification and Differential Expression of lncRNAs Related to the Prognosis of GC
We performed univariate Cox regression analysis including 491 lncRNAs to further identify lncRNAs related to the prognosis of GC. The results showed that 23 lncRNAs were closely related to the prognosis of GC (Figure 2B). Of these, 11 and 12 lncRNAs were associated with poor and good prognosis, respectively. Figure 2C and D illustrate the differential expression of these 23 lncRNAs between GC and adjacent normal gastric tissues. The P-values indicated statistically significant differences in the expression of all 23 lncRNAs.
Consensus Clustering of m6A-Related lncRNAs Identified Two Clusters of GC
Based on the similarity in the expression of the 23 m6A-related lncRNAs, we used the ConsensusClusterPlus package to group 375 GC tissues. When k=2, the value of clustering distribution function (CDF) was the smallest (Supplementary Figure 1) and the consensus matrix showed a clear boundary, indicating that the samples could be stably clustered (Figure 3A). The clustering results were analyzed using the Kaplan–Meier (KM) curve. The overall survival (OS) of the cluster 1 subgroup was significantly shorter than that of the cluster 2 subgroup (Figure 3B). Moreover, compared with the cluster 2 subgroup, the cluster 1 subgroup was linked to a higher clinical stage (Figure 3C). Therefore, we suspected that the cluster 1 subgroup was closely related to the malignant degree of GC. To better investigate the clustering results and their potential functions, we performed a Gene Set Enrichment Analysis (GSEA). The findings showed that the cluster 1 subgroup was enriched in terms of the mitogen-activated protein kinase (MAPK) signal pathway, calcium signal pathway, leukocyte transendothelial migration, and extracellular matrix (ECM) receptor interaction (Supplementary Figure 2). Because multiple immune-related pathways were involved in the cluster 1 subgroup, we investigated whether different clustering subgroups exerted an effect on the TME. As shown in Figure 4A–C, the ImmuneScore, StromalScore, and ESTIMATEScore of the cluster 1 subgroup were significantly higher than those of the cluster 2 subgroup, indicating that larger amounts of immune or stromal components were present in the TME. Figure 4D shows differences in the infiltration levels of 22 types of immune cells between the cluster 1 and 2 subgroups. Furthermore, these lncRNAs may also be related to the expression of immune checkpoint inhibitors (Figure 4E–H).
 |
Figure 3 Differential overall survival (OS) and clinicopathological features of patients with gastric cancer in the cluster 1 (n=266) and cluster 2 (n=105) subgroups. (A) Consensus clustering matrix for k=2. (B) Kaplan–Meier curves of OS for patients with gastric cancer in the two subgroups (P=0.001). (C) Heatmap and clinicopathologic features of the two clusters. |
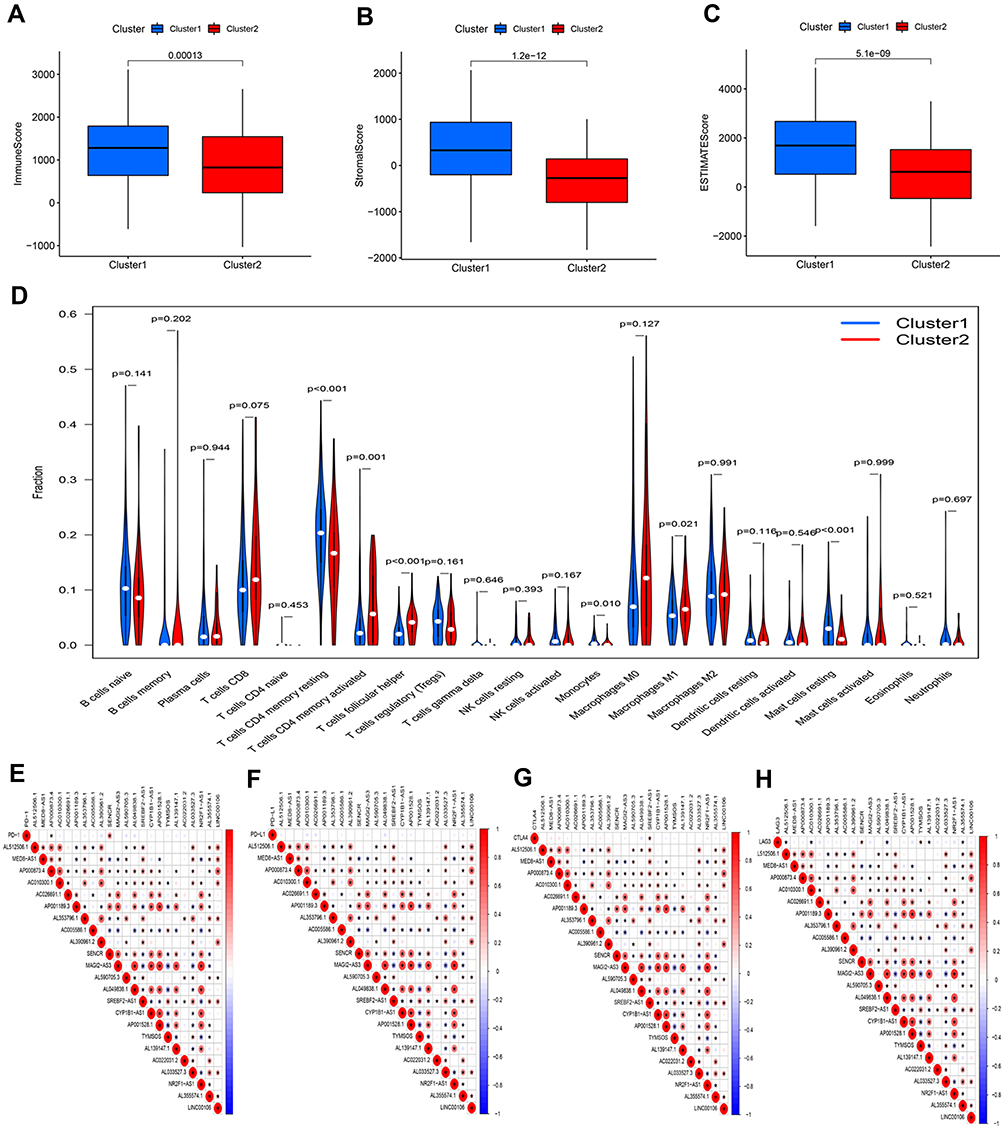 |
Figure 4 Characteristics of tumor microenvironment and immune cell infiltration in two distinct clusters. Comparison of ImmuneScore (A), StromalScore (B), and ESTIMATEScore (C) in clusters 1 and 2. (D) Difference analysis of the infiltration of 22 types of immune cells between clusters 1 and 2. Spearman correlation analysis between m6A-related lncRNAs and immune checkpoint inhibitors: (E) PD-1, (F) PD-L1, (G) CTLA4, and (H) LAG3. |
Construction and Validation of a m6A-Related lncRNA Risk Signature
A total of 371 patient samples were randomly allocated to a training set (n=187) or a testing set (n=184). We performed least absolute shrinkage and selection operator (LASSO) Provisional Cox regression analysis to construct a nine-lncRNA risk signature model (Supplementary Figure 3). The risk score of each patient in the training and testing sets was calculated using the risk formula:
Risk score model = (−0.36351 × Exp AP000873.4) + (0.47845 × Exp AC026691.1) + (−0.2724 × Exp AC005586.1) + (−0.22886 × Exp AL390961.2) + (0.387416 × Exp AL590705.3) + (−0.05856 × Exp TYMSOS) + (0.470581 × Exp AL139147.1) + (0.180678 × Exp AC022031.2) + (−0.10854 × Exp AL355574.1).
The median risk score was used as the cut-off value, and patients in the training and testing sets were divided into high- and low-risk groups. The number of deaths was markedly higher in the high-risk group versus the low-risk group, regardless of the set (training or testing) (Figure 5A and B). Based on the KM survival analysis, the low-risk group had a better OS than the high-risk group in both the training and testing sets (Figure 5C and D). In addition, the results of the receiver operating characteristic (ROC) curve showed that the area under the curve values of the risk score were higher than those of other clinical factors, such as age, sex, grade, and stage (0.787 and 0.678 in the training and testing sets, respectively) (Figure 5E and F).
 |
Figure 5 Construction and validation of risk signatures of m6A-related lncRNAs in the training and testing cohorts. (A and B) Distribution of risk score, survival status, and gene expression among patients in the training and testing cohorts. (C and D) The Kaplan–Meier curves of the high- and low-risk groups in the training and testing cohorts were compared. (E and F) ROC curves showing the predictive efficiency of the risk score, age, sex, grade, and stage for the 5-year survival rate in the training and testing cohorts. |
Prognostic Value of the m6A-Related lncRNAs Risk Signature
We conducted a KM curve analysis of different clinicopathological features to further investigate the value of the risk signature in clinical assessment. All patients with GC were stratified according to clinical pathological variables, including age, cancer sex, grade, T stage, N stage, M stage, and clinical stage. For each stratification, the OS rate in the high-risk group was significantly lower than that recorded in the low-risk group (Figure 6A–N). These results indicated that the risk signature was an effective predictor of survival in subgroups of patients with different clinical factors. Furthermore, we also found that most patients in the high- and low-risk groups corresponded to the cluster 1 and cluster 2 subgroups, respectively (P<0.001). This finding is consistent with our previous conclusion (Figure 6O).
 |
Figure 6 Kaplan–Meier survival curves for the high- and low-risk groups stratified by clinical characteristics. Age (A and B), sex (C and D), grade (E and F), T stage (G and H), N stage (I and J), M stage (K and L), and clinical stage (M and N) in the complete dataset. (O) Heatmap. |
Independent Analysis and Construction of a Nomogram
Univariate and multivariate Cox regression analyses were performed in the training and testing sets to investigate whether the risk score could represent an independent prognostic factor for patients with GC. The analyses showed that the risk score was the most stable predictor of prognosis compared with other clinical factors (eg, age, sex, grade, and stage). In addition, the OS rate decreased with the increase of the risk score (Figure 7A–D). Moreover, a nomogram was constructed based on independent prognostic factors to establish an individualized prediction model for patients with GC (Figure 7E and F).
 |
Figure 7 Independent analysis and construction of a nomogram. (A and B) Univariate Cox regression analysis of prognostic factors. (C and D) Multivariate Cox regression analysis of prognostic factors. (E and F) A nomogram was constructed based on clinical factors and risk score to predict the prognosis of patients with gastric cancer. |
Relationship Between Tumor-Infiltrating Immune Cells and Expression of Immune Checkpoint Inhibitors with the Risk Signature
Since the high-risk group was closely related to the cluster 1 subgroup, we speculated that the risk score was also related to tumor-infiltrating immune cells. As shown in Figure 8A, the risk score was positively correlated with resting memory CD4 T cells, activated natural killer cells, monocytes, M2 macrophages, resting dendritic cells, and resting mast cells. In addition, it was negatively correlated with memory B cells, activated memory CD4 T cells, follicular helper T cells, and M0 macrophages. We further investigated the relationship between the risk signature and immune checkpoint inhibitors. We found that low risk scores were associated with high expression of programmed death-1 (PD-1) (Figure 8B) and cytotoxic T-lymphocyte associated protein 4 (CTLA4) (Figure 8D), while high risk scores were associated with high expression of V-set immunoregulatory receptor (VSIR) (Figure 8F). However, there was no significant association between the risk score and expression of PD-L1 (Figure 8C), lymphocyte-activation gene 3 (LAG3) (Figure 8E), and indoleamine 2,3-dioxygenase 1 (IDO1) (Figure 8G).
 |
Figure 8 Estimation of tumor-infiltrating immune cells (TICs) and immune checkpoint inhibitors by risk signature. (A) The relationship between the infiltration level of 10 immune cell types and risk score. Low risk scores were correlated with upregulated (B) PD-1 and (D) CTLA4, while high risk scores were correlated with upregulated (F) VSIR. However, there was no statistically significant difference observed for (C) PD-L1, (E) LAG3, and (G) IDO1 in patients with gastric cancer. |
Prediction of Chemosensitivity Using the Risk Signature
We used the pRRophetic algorithm to predict the relationship between the risk score and sensitivity to common chemotherapeutic agents used in the treatment of GC. Figure 9 shows that the low-risk scores were associated with a higher half inhibitory concentration (IC50) for fluorouracil and oxaliplatin, but not paclitaxel and cisplatin. This evidence indicated that the risk signature can be used as a potential predictor of chemosensitivity.
 |
Figure 9 Prediction of chemosensitivity using the risk signature. High risk scores were associated with lower IC50 for (A) fluorouracil and (B) oxaliplatin, but not (C) paclitaxel and (D) cisplatin. |
Discussion
Previous studies have suggested that m6A-related protein-coding genes play an important role in a variety of tumors by regulating the tumor immune microenvironment and affecting the effectiveness of immune checkpoint inhibitors.13,17 m6A-related lncRNAs also play an important role in the development of tumors. Yu et al identified a m6A-related lncRNA signature, which can effectively predict the prognosis of patients with renal clear cell carcinoma.18 Huang et al identified several m6A-related lncRNAs, which can act as potential prognostic markers of metastatic skin cutaneous melanoma.19 However, the expression pattern of m6A-related lncRNAs in GC and its correlation with the immune microenvironment and effectiveness of immunotherapy remain unclear, warranting further investigation.
In this study, prognostic m6A-related lncRNAs were identified and analyzed via Pearson correlation analysis and univariate Cox regression analysis. In order to better understand the effects of different clustering on the prognosis and immune microenvironment of GC, according to the expression of prognostic lncRNAs, we identified two distinct molecular clusters by consensus clustering. The clinical stage was more advanced and the OS time was significantly shorter in the cluster 1 subgroup compared with the cluster 2 subgroup. The results of the GSEA showed that tumor-related pathways and immune activation-related pathways were enriched, including MAPK and calcium signaling pathways, leukocyte transendothelial migration, and ECM receptor interaction. In addition, the results obtained using the ESTIMATE algorithm indicated that higher ImmuneScore, StromalScore, and ESTIMATEScore were associated with worse OS. This evidence implied that the TME is closely related to the prognosis of patients with GC. Previous reports have also confirmed that different components and proportions in the TME can affect the prognosis of patients with malignant tumors.20–22
Through LASSO Cox regression analysis, we further constructed a nine m6A-related lncRNA risk signature and validated it using two independent cohorts. The results of the survival analysis showed that the risk signature had strong prognostic value in both the training and testing sets. Further ROC analysis showed that this risk signature had higher accuracy in predicting the total survival of patients with GC compared with other clinicopathological features. In addition, the results of the stratified survival and independent prognosis analyses revealed that the risk signature is an independent prognostic indicator for patients with GC and can effectively predict the survival status in patients with different clinical factors. The nomogram, constructed based on independent prognostic factors, provided a quantitative and intuitive method for predicting the probability of survival in patients with GC.
Different types of tumor-infiltrating immune cells exert varied effects on the progression of malignant tumors. It has been reported that M2 macrophages promote the metastasis of GC cells in vivo and in vitro by regulating chitinase 3 like 1 (CHI3L1).23 Another study reported that increased levels of intratumoral CD4 T cells are associated with tumor progression and poorer patient survival in GC.24 The present study demonstrated that the risk score was closely related to the infiltration of CD4 T cells, M2 macrophages, natural killer cells, dendritic cells, and monocytes. The results suggested that these immune cells play an important role in the development of GC.
Numerous studies have shown that immune checkpoints are important factors affecting the prognosis and treatment of tumors, including advanced GC.25 Blocking CTLA4 can enhance the anti-tumor response by promoting the activation of T cells.26 We hypothesize that immunotherapy can eliminate cancer cells, produce more new antigens, and inhibit the development of tumors, thereby prolonging the life span of patients with advanced GC. Our results showed that a low-risk score was significantly correlated with high expression of PD-1 and CTLA4, but not PD-L1, LAG3, and IDO1. In addition, some lncRNAs may affect the resistance of tumors to common chemotherapeutic drugs.27 Qiao et al reported that lncRNA high mobility group AT-hook 1 pseudogene 4 (HMGA1P4) can promote resistance to cisplatin in GC by upregulating certain genes.28 Zhang et al found that lncRNA metastasis associated lung adenocarcinoma transcript 1 (MALAT1) regulates ZFP91 by sponging miR-22-3p, thus promoting the development of resistance to oxaliplatin in GC cells.29 Our risk model showed that low risk is associated with sensitivity to chemotherapeutic drugs, such as fluorouracil and oxaliplatin, but not paclitaxel and cisplatin. Therefore, patients in the low-risk group are more likely to benefit from immunotherapy and chemotherapy than those in the high-risk group.
To our knowledge, this study is the first to investigate the relationship between m6A-related lncRNAs and immune infiltration, immunotherapy, and chemotherapy in GC. In-depth study of the effects of m6A-related lncRNAs on immune cell infiltration in tumors will help us to better understand the regulation of the TME and its effect on prognosis. In addition, the risk signature model we constructed can accurately predict the prognosis of patients with GC and can help distinguish patients who could benefit from immunotherapy and chemotherapy. However, the limitations of the present study should be acknowledged. The main datasets used herein were obtained from TCGA database; other large cohorts should also be used to reduce the risk of selection bias. In addition, the prognostic model we constructed warrants further validation in a large clinical center to confirm its practical value in the clinical setting.
Conclusions
In summary, the novel prognostic signature based on m6A-related lncRNAs is an effective, practical, and quantitative method for clinicians to predict survival and to provide individualized treatment of gastric cancer, and is expected to be applied in clinical practice in the future.
Abbreviations
M6A, N6-methyladenosine RNA; GC, Gastric cancer; TME, Tumor microenvironment; LncRNAs, Long non-coding RNAs; TCGA, The Cancer Genome Atlas; GTF, Gene transfer format; CDF, Clustering distribution function; OS, Overall survival; GSEA, Gene Set Enrichment Analysis; LASSO, Least absolute shrinkage and selection operator; ROC, Receiver operating characteristic; IC50, half inhibitory concentration.
Data Sharing Statement
The raw data of this study are derived from the TCGA database (https://portal.gdc.cancer.gov/) available databases.
Ethics Approval and Consent to Participate
The study was approved by the The First Affiliated Hospital of Nanchang University Ethics Committee.
Acknowledgments
We hereby thank the Department of Gastrointestinal Surgery of the First Affiliated Hospital of Nanchang University for their strong support for this study.
Author Contributions
All authors made a significant contribution to the work reported, whether that is in the conception, study design, execution, acquisition of data, analysis and interpretation, or in all these areas; took part in drafting, revising or critically reviewing the article; gave final approval of the version to be published; have agreed on the journal to which the article has been submitted; and agree to be accountable for all aspects of the work.
Funding
The present study was funded by the Scientific Research Foundation of the Education Office Jiangxi Province (grant number GJJ170129), the fourth batch of school-level demonstration virtual simulation experimental teaching projects of Nanchang University and the National Natural Science Foundation (grant number 81960503).
Disclosure
The authors declare that they have no competing interests.
References
1. Smyth EC, Nilsson M, Grabsch HI, van Grieken NC, Lordick F. Gastric cancer. Lancet. 2020;396:635–648. doi:10.1016/S0140-6736(20)31288-5
2. Sung H, Ferlay J, Siegel RL, et al. Global cancer statistics 2020: GLOBOCAN estimates of incidence and mortality worldwide for 36 cancers in 185 countries. CA Cancer J Clin. 2021;71:209–249. doi:10.3322/caac.21660
3. Katai H, Ishikawa T, Akazawa K, et al. Five-year survival analysis of surgically resected gastric cancer cases in Japan: a retrospective analysis of more than 100,000 patients from the nationwide registry of the Japanese Gastric Cancer Association (2001–2007). Gastric Cancer. 2018;21:144–154. doi:10.1007/s10120-017-0716-7
4. Meyer KD, Saletore Y, Zumbo P, Elemento O, Mason CE, Jaffrey SR. Comprehensive analysis of mRNA methylation reveals enrichment in 3’ UTRs and near stop codons. Cell. 2012;149:1635–1646.
5. Dominissini D, Moshitch-Moshkovitz S, Schwartz S, et al. Topology of the human and mouse m6A RNA methylomes revealed by m6A-seq. Nature. 2012;485:201–206. doi:10.1038/nature11112
6. Jia G, Fu Y, Zhao X, et al. N6-methyladenosine in nuclear RNA is a major substrate of the obesity-associated FTO. Nat Chem Biol. 2011;7:885–887. doi:10.1038/nchembio.687
7. Yang Y, Hsu PJ, Chen YS, Yang YG. Dynamic transcriptomic m(6)A decoration: writers, erasers, readers and functions in RNA metabolism. Cell Res. 2018;28:616–624. doi:10.1038/s41422-018-0040-8
8. Fazi F, Fatica A. Interplay between N6-methyladenosine (m6A) and non-coding RNAs in cell development and cancer. Front Cell Dev Biol. 2019;7:116. doi:10.3389/fcell.2019.00116
9. Pinello N, Sun S, Wong JJ. Aberrant expression of enzymes regulating m(6)A mRNA methylation: implication in cancer. Cancer Biol Med. 2018;15:323–334. doi:10.20892/j.issn.2095-3941.2018.0365
10. Selberg S, Blokhina D, Aatonen M, et al. Discovery of small molecules that activate RNA methylation through cooperative binding to the METTL3-14-WTAP complex active site. Cell Rep. 2019;26:3762–3771.e3765. doi:10.1016/j.celrep.2019.02.100
11. Chen J, Du B. Novel positioning from obesity to cancer: FTO, an m(6)A RNA demethylase, regulates tumour progression. J Cancer Res Clin Oncol. 2019;145:19–29. doi:10.1007/s00432-018-2796-0
12. Xu X, Zhou E, Zheng J, et al. Prognostic and predictive value of m6A “eraser” related gene signature in gastric cancer. Front Oncol. 2021;11:631803. doi:10.3389/fonc.2021.631803
13. Zhang B, Wu Q, Li B, et al. m(6)A regulator-mediated methylation modification patterns and tumor microenvironment infiltration characterization in gastric cancer. Mol Cancer. 2020;19:53. doi:10.1186/s12943-020-01170-0
14. Rinn JL, Chang HY. Genome regulation by long noncoding RNAs. Annu Rev Biochem. 2012;81:145–166. doi:10.1146/annurev-biochem-051410-092902
15. Luo Y, Yang J, Yu J, et al. Long non-coding RNAs: emerging roles in the immunosuppressive tumor microenvironment. Front Oncol. 2020;10:48. doi:10.3389/fonc.2020.00048
16. Xu M, Xu X, Pan B, et al. LncRNA SATB2-AS1 inhibits tumor metastasis and affects the tumor immune cell microenvironment in colorectal cancer by regulating SATB2. Mol Cancer. 2019;18:135. doi:10.1186/s12943-019-1063-6
17. Yi L, Wu G, Guo L, Zou X, Ad Huang P. Comprehensive analysis of the PD-L1 and immune infiltrates of m(6)A RNA methylation regulators in head and neck squamous cell carcinoma. Mol Ther Nucleic Acids. 2020;21:299–314. doi:10.1016/j.omtn.2020.06.001
18. Yu J, Mao W, Sun S, et al. Identification of an m6A-related lncRNA signature for predicting the prognosis in patients with kidney renal clear cell carcinoma. Front Oncol. 2021;11:663263. doi:10.3389/fonc.2021.663263
19. Huang S, Lyu S, Gao Z, et al. m6A-related lncRNAs are potential biomarkers for the prognosis of metastatic skin cutaneous melanoma. Front Mol Biosci. 2021;8:687760. doi:10.3389/fmolb.2021.687760
20. Chen P, Yang Y, Zhang Y, Jiang S, Li X, Wan J. Identification of prognostic immune-related genes in the tumor microenvironment of endometrial cancer. Aging. 2020;12:3371–3387. doi:10.18632/aging.102817
21. Li J, Li X, Zhang C, Zhang C, Wang H. A signature of tumor immune microenvironment genes associated with the prognosis of non‑small cell lung cancer. Oncol Rep. 2020;43:795–806. doi:10.3892/or.2020.7464
22. Yang S, Liu T, Nan H, et al. Comprehensive analysis of prognostic immune-related genes in the tumor microenvironment of cutaneous melanoma. J Cell Physiol. 2020;235:1025–1035. doi:10.1002/jcp.29018
23. Chen Y, Zhang S, Wang Q, Zhang X. Tumor-recruited M2 macrophages promote gastric and breast cancer metastasis via M2 macrophage-secreted CHI3L1 protein. J Hematol Oncol. 2017;10:36. doi:10.1186/s13045-017-0408-0
24. Zhuang Y, Peng LS, Zhao YL, et al. Increased intratumoral IL-22-producing CD4(+) T cells and Th22 cells correlate with gastric cancer progression and predict poor patient survival. Cancer Immunol Immunother. 2012;61:1965–1975.
25. Kono K, Nakajima S, Mimura K. Current status of immune checkpoint inhibitors for gastric cancer. Gastric Cancer. 2020;23:565–578. doi:10.1007/s10120-020-01090-4
26. Esmaily M, Masjedi A, Hallaj S, et al. Blockade of CTLA-4 increases anti-tumor response inducing potential of dendritic cell vaccine. J Control Release. 2020;326:63–74. doi:10.1016/j.jconrel.2020.06.017
27. Wei L, Sun J, Zhang N, et al. Noncoding RNAs in gastric cancer: implications for drug resistance. Mol Cancer. 2020;19:62. doi:10.1186/s12943-020-01185-7
28. Qiao XL, Zhong ZL, Dong Y, Gao F. LncRNA HMGA1P4 promotes cisplatin-resistance in gastric cancer. Eur Rev Med Pharmacol Sci. 2020;24:8830–8836. doi:10.26355/eurrev_202009_22822
29. Zhang Z, Li M, Zhang Z. LncRNA MALAT1 modulates oxaliplatin resistance of gastric cancer via sponging miR-22-3p. Onco Targets Ther. 2020;13:1343–1354. doi:10.2147/OTT.S196619
30. Wilkerson MD, Hayes DN. ConsensusClusterPlus: a class discovery tool with confidence assessments and item tracking. Bioinformatics. 2010;26:1572–1573. doi:10.1093/bioinformatics/btq170
31. Yoshihara K, Shahmoradgoli M, Martínez E, et al. Inferring tumour purity and stromal and immune cell admixture from expression data. Nat Commun. 2013;4:2612. doi:10.1038/ncomms3612
32. Newman AM, Liu CL, Green MR, et al. Robust enumeration of cell subsets from tissue expression profiles. Nat Methods. 2015;12:453–457. doi:10.1038/nmeth.3337
33. Geeleher P, Cox N, Huang RS. pRRophetic: an R package for prediction of clinical chemotherapeutic response from tumor gene expression levels. PLoS One. 2014;9:e107468. doi:10.1371/journal.pone.0107468
 © 2022 The Author(s). This work is published and licensed by Dove Medical Press Limited. The
full terms of this license are available at https://www.dovepress.com/terms
and incorporate the Creative Commons Attribution
- Non Commercial (unported, 3.0) License.
By accessing the work you hereby accept the Terms. Non-commercial uses of the work are permitted
without any further permission from Dove Medical Press Limited, provided the work is properly
attributed. For permission for commercial use of this work, please see paragraphs 4.2 and 5 of our Terms.
© 2022 The Author(s). This work is published and licensed by Dove Medical Press Limited. The
full terms of this license are available at https://www.dovepress.com/terms
and incorporate the Creative Commons Attribution
- Non Commercial (unported, 3.0) License.
By accessing the work you hereby accept the Terms. Non-commercial uses of the work are permitted
without any further permission from Dove Medical Press Limited, provided the work is properly
attributed. For permission for commercial use of this work, please see paragraphs 4.2 and 5 of our Terms.