Back to Journals » ImmunoTargets and Therapy » Volume 14
Comprehensive Analyses of Single-Cell and Bulk RNA Sequencing Data From M2 Macrophages to Elucidate the Immune Prognostic Signature in Patients with Gastric Cancer Peritoneal Metastasis
Authors Tang Q ![]() , Tang L, Wang X, Zhang Y, Liu W, Yang T, Wu Y, Ma Y, Lei T, Song W
, Tang L, Wang X, Zhang Y, Liu W, Yang T, Wu Y, Ma Y, Lei T, Song W
Received 19 November 2024
Accepted for publication 4 March 2025
Published 4 April 2025 Volume 2025:14 Pages 383—402
DOI https://doi.org/10.2147/ITT.S506143
Checked for plagiarism Yes
Review by Single anonymous peer review
Peer reviewer comments 3
Editor who approved publication: Dr Sarah Wheeler
Qiao Tang,1,2,* Liang Tang,1,2,* Xiaofeng Wang,1,* Yongxin Zhang,1 Wenwei Liu,3 Ting Yang,3 Yuxin Wu,1 Yuanchen Ma,3 Tianxiang Lei,4 Wu Song1
1Department of Gastrointestinal Surgery, The First Affiliated Hospital, Sun Yat-SenYou University, Guangzhou, Guangdong, People’s Republic of China; 2Laboratory of Surgery, The First Affiliated Hospital, Sun Yat-SenYou University, Guangzhou, Guangdong, People’s Republic of China; 3Center for Stem Cell Biology and Tissue Engineering, Sun Yat-SenYou University, Guangzhou, Guangdong, People’s Republic of China; 4Department of Thyroid and Hernia Surgery, Guangdong Provincial People’s Hospital, Southern Medical University, Guangzhou, Guangdong, People’s Republic of China
*These authors contributed equally to this work
Correspondence: Tianxiang Lei; Email [email protected] Wu Song, Email [email protected]
Purpose: The peritoneum is a common site of metastasis in gastric cancer (GC), associated with poor prognosis and significant morbidity. The proclivity of GCs to metastasize to the peritoneum has been hypothesized to occur due the latter’s immunosuppressive microenvironment, such as stromal infiltration and M2 macrophage enrichment, which are associated with increased risk of PM. As far as we know, a model that can effectively predict the prognosis of patients with GCPM is still lacking. Consequently, we constructed a prognostic risk model based on M2 macrophages associated with gastric cancer peritoneal metastasis, aiming to enhance predictive precision and guide tailored therapeutic interventions.
Methods: M2 macrophage-associated genes were identified in combination with marker genes from single-cell RNA sequencing (scRNA-seq) and modular genes from weighted gene coexpression network analysis (WGCNA). A prognostic model was constructed via LASSO analysis and validated in internal and external cohorts. We further compared the immune microenvironment, immune checkpoints, and chemotherapeutic drug sensitivity between patient groups stratified by risk to clarify the immune landscape in the GCPM.
Results: Our study identified 38 M2 macrophage-related genes via single-cell and bulk RNA sequencing. We developed a prognostic model based on the expression levels of 4 signature genes: DAB2, SPARC, PLTP, and FOLR2. The feasibility of the model was validated with internal and external validation sets (TCGA, GSE62254 and IMvigor210). The model also supported the prediction results of prognosis on the basis of the immunohistochemical results. Notably, patients with higher risk scores had a lower proportion of MSI-H and TMB, a higher prevalence of stages III–IV, and a lower likelihood of responding favorably to immunotherapy.
Conclusion: Our prognostic risk model could effectively predict the prognosis and response to chemo-immune therapy in patients with GCPM. The risk score is a promising independent prognostic factor that is closely correlated with the immune microenvironment and clinicopathological characteristics.
Keywords: gastric cancer, peritoneal metastasis, scRNA-seq, M2 macrophages, immunotherapy response, prognosis
Graphical Abstract:

Introduction
Gastric cancer is a globally important disease, with more than 1 million new cases estimated annually. It is the fifth most common cancer and third most common cause of cancer-related death worldwide.1,2 Peritoneal metastasis is a common site of metastasis in gastric cancer (GC) and is associated with a poor prognosis and significant morbidity. Clinically, 10–-30% of patients already have peritoneal metastases (PM) at the time of initial diagnosis, and over 50% of stage II and III patients develop PM within five years despite receiving curative surgery.3–5 The median survival of patients with advanced gastric cancer has been reported to be less than one year.6 These tumors tend to be resistant to traditional systemic therapy; however, this remains the current standard of care recommended by most international clinical guidelines.7
Immunotherapy is considered a new avenue for the treatment of peritoneal metastasis in patients with gastric cancer, and immune checkpoint inhibitor (ICI) therapy has been widely used for solid tumor treatment.8 The results of the KEYNOTE-012 study in 2016 suggested that pembrolizumab, a PD-1 antibody, has potential efficacy as a therapy for patients with recurrent or metastatic PD-L1-positive gastric cancer.9 Moreover, the ATTRACTION-2 study investigated the efficacy of nivolumab, which significantly improved the survival rate of gastric cancer patients compared with the placebo group.10 Although immune checkpoint blockade (ICB) immunotherapy has revolutionized cancer treatment, its response rate in patients with advanced GC remains limited. This lack of response is likely due to our limited knowledge about the tumor immune microenvironment (TIME).11
The TIME comprises various components, such as immune and stromal cells, which secrete cytokines and other factors through interactions that affect cancer progression and metastasis.12 Notably tumor-associated macrophages (TAMs) are among the main immune cells in the tumor microenvironment of GCPM, and M2-like TAMs play crucial roles in promoting a suppressive tumor immune microenvironment (TIME) and immune evasion.13 Huang et al constructed a CRC prognostic model via single-cell techniques to screen for eight genes associated with M2 subtypes and metabolism.14 Therefore, in-depth exploration of macrophage-specific subsets and important marker genes is crucial for understanding how M2 macrophages play a role in the immunosuppressive microenvironment of the PM.
In this study, we constructed a 4-gene prediction model based on GCPM-associated M2 macrophages by combining single-cell and bulk data, which was further verified in the TCGA-STAD, GSE62254, and IMvigor210 cohorts. Moreover, the IHC score, which is based on protein levels, also supported the validation of the model. Overall, our study provides novel insights that may benefit the clinical management of GCPM. The workflow is shown in the graphical abstract.
Materials and Methods
Data Source
The GCPM scRNA-Seq datasets GSE163558 and GSE183904 were downloaded from the GEO database. Bulk RNA-Seq data, gene mutation data, and clinical information were downloaded from TCGA (https://portal.gdc.cancer.gov/). The GSE62254 and IMvigor210 ‘cohort data were downloaded from the GEO and IMvigor210 databases (http://researchpub.gene.com/IMvigor210CoreBiologies) for external cohort validation. The flow diagram of the study is shown in the graphical abstract.
Integration and Clustering of Single-Cell RNA Sequencing Data
Integration of the scRNA-Seq data was performed via reciprocal principal component analysis (RPCA). Before integration, three lists were created for the merged T, N, and PM data, which were then combined and integrated via Seurat (version 4.0.5).15 The tissue samples and their subpopulations were clustered separately to identify the PM-dominant macrophage clusters. The proportions of cells in each cluster were subsequently calculated. Each cell subcluster in the integrated data was annotated on the basis of a canonical marker according to previous studies or the CellMarker database (http://biocc.hrbmu.edu.cn/CellMarker/).16
Differential Expression Gene Analysis of PM-Dominant Macrophage Clusters
To identify genes that mark the PM state within the macrophage subcluster containing the PM-dominated cluster, we performed differential expression gene (DEG) analysis on all cell clusters via the FindAllMarkers function in the R package “Seurat”.Seurat.15 We selected the top five genes on the basis of their log2-fold change values. These genes are potential markers for PM.
Cellular Cross-Talking Analysis
The interactions between different cells in the TIME were analyzed vai CellChat (version 1.1.3) (https://github.com/sqjin/CellChat).17 Enriched interactions between ligands and receptors were determined via a permutation test. To infer cell-cell interactions, we identified differentially expressed signaling genes, calculated the ensemble average expression and intercellular communication probability, and detected statistically significant intercellular communication.
Weighted Gene Coexpression Network Analysis (WGCNA)
Gene coexpression networks associated with M2 macrophages in the TCGA-STAD cohort were constructed via the R package “WGCNA”.18 First, we performed hierarchical clustering on TCGA-STAD samples to identify genes. A scale-free network was constructed using weighted correlation coefficients (r). The network’s scale-free topology was evaluated using different values of the β shrinkage parameter, and it was found that a default value of β = 5 provided a good match for the scale-free topology (scale-free R2 = 0.90). By adjusting the soft threshold parameter β, the logarithm of the number of nodes (genes) connected to the surrounding nodes k (log(k)) is negatively correlated with the logarithm of the probability of occurrence of that node (log (p(k))), thereby fitting the entire gene network to a scale-free distribution.18 We calculated the modular-characteristic gene values for each sample and used a heatmap to display the expression profile of the genes within the module.
Construction and Validation of a Prognostic Risk Model
A prognostic model based on scRNA-Seq and bulk RNA-Seq data was constructed via least absolute shrinkage and selection operator (LASSO) regression analysis, which was conducted via the R package “glmnet” (version 4.1–-1).19 Candidate genes were screened via univariate Cox regression analysis. We split the TCGA-STAD data set into training and test sets at a ratio of 1:1 via the R package caret (version 6.0–-47). A 10-fold cross-validation of the prognostic genes was conducted via different training sets. The risk score for the prognostic model was calculated via the following formula.

where coef is the regression coefficient, Exp is the gene expression level, “n” is the total number of candidate genes, and “I” is the sequence of the genes in the model. We used the “timeROC” packageto generate receiver operating characteristic (ROC) curves and assessed the predictive performance of risk scores by calculating area under the curve (AUC).20
Construction of the Predictive Nomogram
On the basis of multivariate Cox proportional hazards regression, risk scores and clinical parameters, including age, sex, TNM stage, pathological stage of tumor differentiation (neoplasm), and molecular subtypes, were gathered and analyzed to construct a predictive nomogram. A nomogram was created via the “rms” (version 6.2.0) and “survival”- in the R software package to predict the 1-, 3-, and 5-year OS.
Estimation of Immune Infiltration in the TIME
The infiltration scores of 28 immune cells and immune-related pathways were determined via single-sample gene set enrichment analysis (ssGSEA) with the R package GSVA (version 1.40.1). We used an online site (http://tide.dfci.harvard.edu/) for grading via the TIDE algorithm. For the IPS ratings, we relied on the IOBR package. Moreover, the estimated scores of immune, stromal and tumor purity were calculated via the ESTIMATE algorithm with the R package “IOBR”.The IOBR.21
Gene Mutation Analysis
The R package “maftools” was utilized to analyze the mutation of high- to low- rated grouped genes. The MSI information of GC patients was downloaded from the TCGA database, the differences in risk scores across different MSI statuses were compared, and “ggplot2” was used for visualization.
Clinical Analysis of Immunotherapy and Chemotherapy for Immune Subtypes
The TIDE (http://tide.dfci.harvard.edu/) algorithm was used to evaluate the effects of the three types of immune molecules on the potential clinical subtypes of immune therapy. A higher TIDE score indicates a greater likelihood of immune escape.
Functional Enrichment Analysis and Gene Set Enrichment Analysis (GSEA)
Gene Ontology (GO) function and Kyoto Encyclopedia of Genes and Genomes (KEGG) pathway enrichment analyses of M2 macrophage-related proteins were performed via Funrich. Gene set enrichment analysis (GSEA) of the four candidate genes for the prognostic model was conducted via GSEA.The GSEA.22
Drug Sensitivity Analysis
The drug sensitivity dataset (NCI-60) was downloaded from CellMiner (https://discover.nci.nih.gov/cellminer). The associations between the risk score and the half-maximal inhibitory concentration (IC50) of the anticancer drugs were assessed via R package “pRRophetic”.23 Pearson correlation analysis was used to study the relationship between gene expression levels and drug sensitivity.24
Patient Tissue Samples
GCPM tumor tissues were collected from 45 patients who visited the Department of Gastrointestinal Surgery, First Affiliated Hospital, Sun Yat-senyou University. Informed consent was obtained from all patients prior to the analysis. All patient-related studies were reviewed and approved by the Institutional Review Board of the First Affiliated Hospital of Sun Yat-senyou University. The study was in accordance with the Declaration of Helsinki.
IHC Staining
The tissue samples were fixed overnight in 10% buffered formalin at room temperature. The samples were then embedded in liquid paraffin, followed by overnight heating at 60°C. The prepared paraffin blocks were sectioned into 5 µm slices, which were then dried and deparaffinized in ethanol at 4°C. After overnight incubation with the appropriate primary antibody, the sections were incubated with an HRP-conjugated secondary antibody for 30 min. Finally, the sections were stained with DAB staining solution. Microscopic observations were performed, and image analysis software was used to analyze the sections. The primary antibodies used were against CD163 (Abcam, 1:100), DAB2 (Proteintech, 1:200), SPARC (Proteintech, 1:1000), PLTP (Abcam, 1:250), and FOLR2 (Abcam, 1:100).
Statistical Analysis
All the statistical analyses were conducted via R software (version 4.1.2), the corresponding fundamental package, and GraphPad Prism (version 8). Nonparametric, chi-and 8). Nonparametric, whichsquare, and Student’s t-tests were used to determine the differences between the two groups. Survival curve analyses (Kaplan‒Meier curves) were performed via the log-rank (Mantel‒Cox) test. Hazard ratios in the survival analyses were calculated using univariate and multivariate Cox regression analyses. A two-sided p- value <0.05 or log rank p- value <0.05 was considered statistically significant.
Results
Identification of Cell Subsets in the TME on the Basis of GC-PM/T/N
To explore the cellular heterogeneity in the TME of primary and peritoneal metastatic GC tissues, we comprehensively analyzed the single-cell datasets GSE163558 and GSE183904. Sixteen cell clusters were identified from the N, T, and PM samples (Figure 1A and B). The cell clusters were annotated on the basis of the expression of canonical marker genes (Figure 1C). Canonical marker genes were acquired from Cell Markers and previous literature: T cells (CD3D, CD3E, and CD2), B cells (CD79A and CD79B), epithelial cells (EpCAM, KRT18, KRT19, and MUC1), M2 macrophages (CSF1R, CD163, MRC1, MS4A4A, FCGR3A and FOLR2), chief cells (LIPF and PGC), stromal cells (COL1A2, ACTA2, ENG, and VWF), neutrophils (FCGR3B and MNDA), and mast cells (CPA3 and TPSAB1). The expression levels of these marker genes are shown in Figure 1D. We have conducted functional validation to further support the accuracy of the M2 classification (Figure S1A). Furthermore, the proportion of annotated cell clusters was calculated, and the results revealed that the proportions of T cells, M2 macrophages, and stromal cells were greater in the PM groups (Figure 1E). Interestingly, macrophages were the main components in the TIME of the GCPM, which is consistent with the finding of a previous study.25 Therefore, M2 macrophages may play an important role in GCPM progression, and further exploration of the underlying mechanisms of M2 macrophages is imperative.
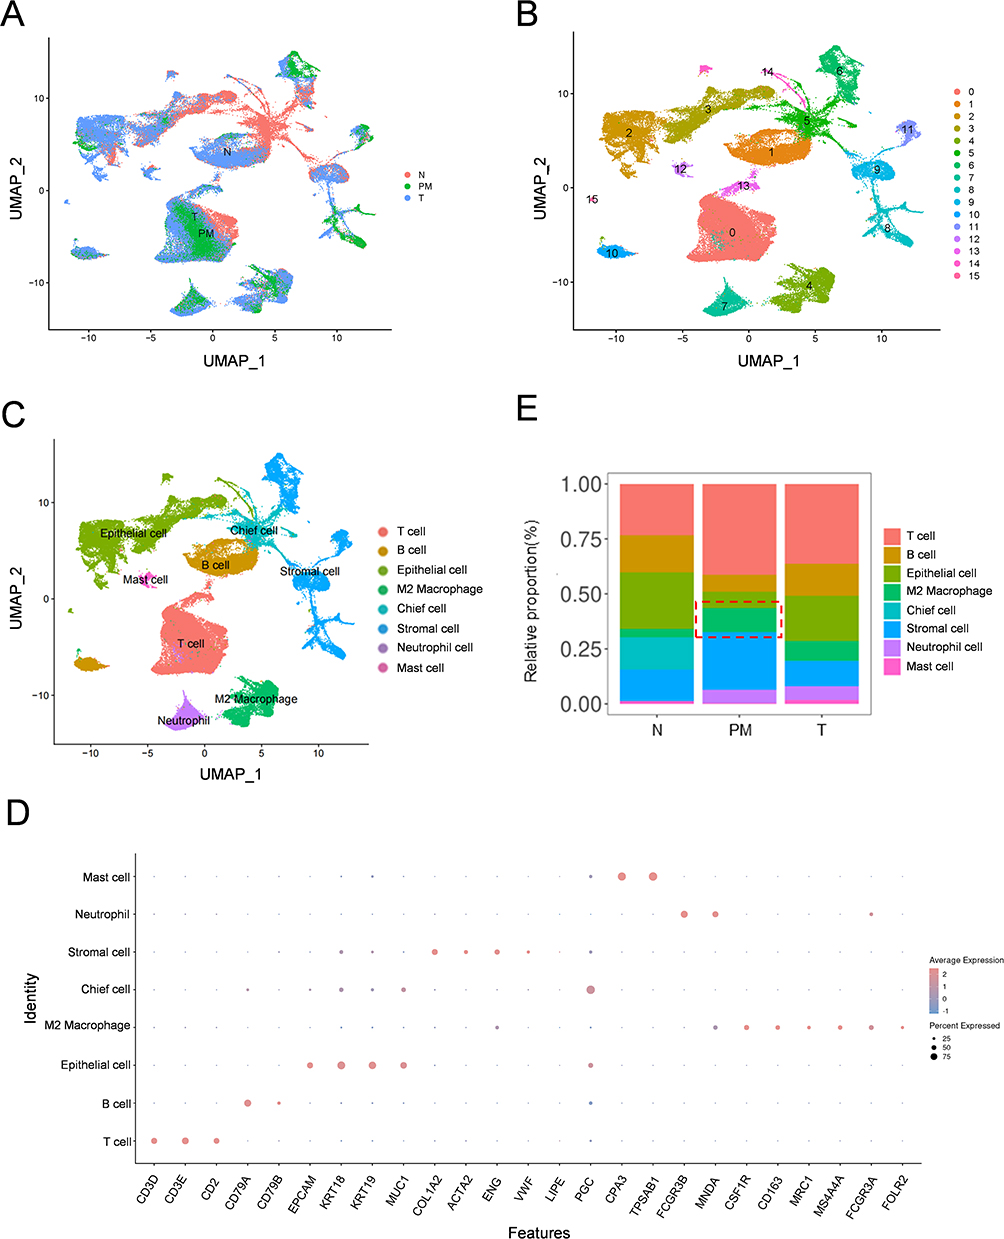 |
Figure 1 Integration Analysis of scRNA-Seq from T, N and PM of GC patients. (A) UMAP plot of single cells from different samples (T, N and PM). (B) UMAP plot exhibiting single cells classified by major cell types. (C) UMAP plot displaying cell clusters identified through unsupervised clustering. (D) Dot plot indicating the expression of canonical marker genes for T cells, B cells, epithelial cells, stromal cells, chief cell, mast cell, neutrophil, and M2 macrophage in each cluster. (E) Proportion bar plot revealing the frequency of each cell cluster in different samples (T, N and PM). Abbreviations: scRNA-Seq, Single-Cell Sequencing; T, Primary Tumor; N, Normal Samples; PM, Peritoneal Metastasis; GC, Gastric Cancer; UMAP, Uniform Manifold Approximation and Projection. |
The Cell‒Cell Communication of the GCPM Is Stronger Than That of the Primary Tumor
Cell‒cell interactions are key elements in regulating individual cellular processes and intercellular relationships, that drive the invasiveness of malignancies.17,26 Our results indicated that the total number of interactions was significantly greater in GCPM patients, particularly between M2 macrophages, T cells, and stromal cells (Figure S1B and C). Moreover, we found that the overall signaling pathways were enriched in GCPM patients (Figure S1D). The outgoing/incoming signaling patterns of each single cell were explored, and the results indicated that the strength of the signaling patterns was greater (Figures S1E, F and S2A–EThe S2A-E). Therefore, we believe that the degree of cellular communication between M2 macrophages and other cells is greater in GCPM patients.
Identification of Reclustering of Macrophage Subpopulations Associated with GCPM
Increasing evidence shows that macrophages, as one of the main immune cells of TIME, play a crucial role in the subsequent evolution of the malignant tumors.27–29 Peritoneal macrophages are involved in peritoneal metastasis.30 The results of unsupervised clustering revealed that macrophages constituted a relatively high proportion of the TIME in the GCPM. Thus, we performed reclustering of the subpopulation of macrophages separately to investigate the differences in transcriptomic gene expression in the macrophages of GCPM patients. The results revealed nine cell clusters, and the PM-dominated clusters in macrophages were clusters 2 and 5 (the cell proportion was greater than that in N and T cells) (Figure 2A - C). We then performed differential expression gene (DEG) analysis and the top five DEGs among the 138 DEGs are illustrated in a heatmap (Figure 2D). The DEGs from clusters 2 and 5 and all the clusters in the macrophage subpopulation are shown in Tables S1 and S2, respectively. In summary, we identified specific subclusters 2 and 5 associated with the GCPM by reclustering the macrophages.
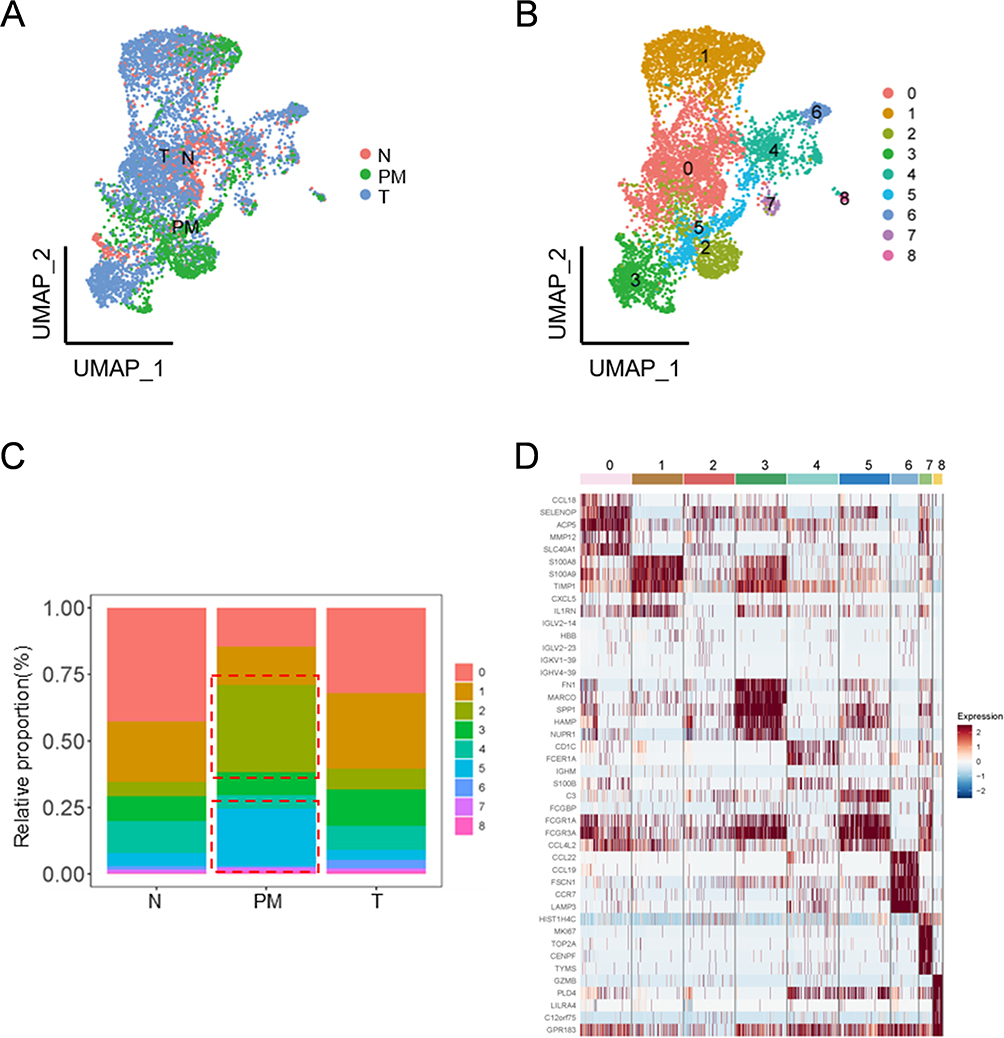 |
Figure 2 DEGs were Identified by Cell Proportion Analysis of Reclustered M2 Macrophage. (A and B) UMAP plot depicting the reclustered M2 macrophage. In picture A, the cells are categorized according to the Louvain algorithm; Picture B categorizes the cells based on their sources. (C) Proportion bar plot revealing the frequency of each M2 macrophage subcluster. (D) Heatmap of top five cluster-specific genes in each M2 macrophage subcluster. Abbreviations: DEGs, Differentially Expressed Genes; UMAP, Uniform Manifold Approximation and Projection; GC, Gastric Cancer. |
The M2 Macrophage-Related Gene Signature Was Identified via WGCNA
M2-MRS was identified via WGCNA to construct a scale-free coexpression network. First, we performed hierarchical clustering on all datasets to identify outliers and group samples into a dendrogram. Hierarchical clustering revealed that one outlier was detected, and the remaining samples were clustered (Figure 3A). Second, to ensure the scaling property of the network, we selected a soft thresholding power of β =5 (Figure 3B and C), and identified 10 modules (Figure 3D). Further analysis of the correlation between different gene modules and M2 macrophages revealed that the yellow module (MEyellow) (r= 0.51, p= 2e-26) and brown module (MEbrown) (r= 0.42, p= 7e-18) had robust positive correlations with M2 macrophages, which was considered the “M2 macrophage module”, in which all genes were specifically coexpressed with M2 macrophages in GC (Figure 3E). The MEyellow and MEbrown modules contained 428 genes (Box S1).
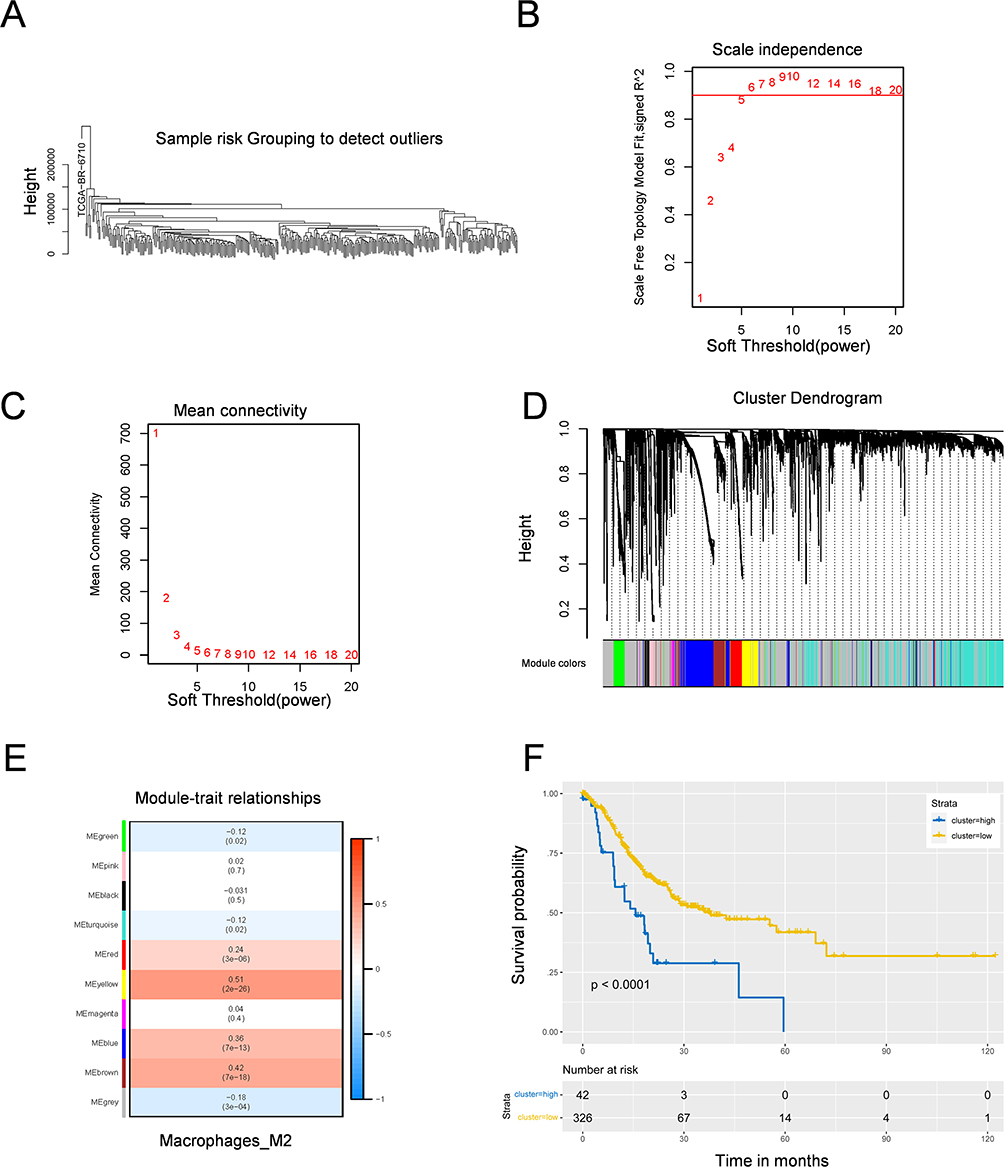 |
Figure 3 M2 macrophage-related gene signature was identified by WGCNA algorithm. (A) Hierarchical clustering of samples for WGCNA. (B and C) Scale-free fit index analysis for soft thresholding powers. Picture B was Scale-free topology model fit, which showed the relationship between the soft thresholding power β and a scale-free R2 (R2=0.90). Picture C showed connectivity for the soft thresholding power β. (D) The cluster dendrogram showing that genes were divided into different modules based on the topological overlap matrix. (E) A heatmap of the correlation between different modules and M2-like macrophage identified by WGCNA. (F) Kaplan-Meier survival of relationship between infiltration of M2 macrophages and overall survival in GC patients. |
Moreover, GC patients were divided into high- and low-risk groups according to the optimal cutoff value of the M2 macrophage infiltration score, and K-M survival analysis indicated that the high-risk group was associated with worse OS (Figure 3F). In addition, the results of the Reactome pathway analysis revealed that 20 pathways were significantly enriched (p<0.05), and the top 10 annotation results revealed that the M2-MRS identified by WGCNA was associated with extracellular matrix-related pathways, and immunoregulatory interactions between lymphoid and nonlymphoid cells (Figure S3A). Furthermore, GO analysis revealed that the enriched GO terms were mainly related to extracellular matrix organization, positive regulation of cytokine production, and the humoral immune response (Figure S3B -D). These results revealed that M2 macrophage-related genes are closely related to immune function and related signaling pathways.
Construction of Integrated Prognostic Models of PM-Specific Related M2 Macrophage Signature Genes on the Basis of Single-Cell and Bulk RNA-Seq
To improve the prognostic ability of GCPM patients, we aimed to construct a prognostic model based on scRNA-seq and bulk RNA-seq data. The intersection between M2-MRS was identified via a Venn diagram, which included 38 genes (Figure 4A). We then conducted univariate Cox regression analysis to identify 20 genes associated with OS (Figure 4B). Twenty candidate genes were included and a four-gene model (PLTP, SPARC, DAB2, and FOLR2) was obtained via LASSO Cox regression analysis via the optimal λ value (λ min = 0.0295) generated via tenfold cross-validation (Figure 4C D). The four-gene model formula was as follows: risk score = expression level of DAB2 × (0.117) + expression level of SPARC × (0.345) + expression level of PLTP × (0.148) + expression level of FOLR2 × (−0.03).
 |
Figure 4 A M2 macrophage-related signature was identified based on scRNA-Seq and bulk RNA-Seq. (A) The Venn diagram plot of mutual M2 macrophage-related genes identified from scRNA-Seq and bulk RNA-Seq. (B) Forest plot of prognostic genes determined using univariate Cox regression analysis. (C) LASSO regression with tenfold cross-validation to obtain prognostic genes using the smallest λ value. (D) The distribution of LASSO regression coefficients to identify the penalty term parameter (λ) by analyzing partial likelihood deviations. (E) The forest plots of multivariate regression analyses showing the relationship between the M2 macrophage risk-Score and various clinical characteristics. (F) Distribution of risk plots and survival status of patients in high- and low-risk groups. (G) The AUCs of the risk model obtained using ROC analysis for predicting 3- and 5-year survival in test set. (H) Kaplan–Meier survival analysis of high- and low-risk groups in TCGA-STAD. (I) A heatmap of expression levels of four prognostic genes in high- and low-risk groups. Abbreviations: ScRNA-by SCRNA-Seq, Single Cell RNA Sequencing; LASSO, Least Absolute Shrinkage and Selection Operator; AUCs, Area Under Curves; ROC, Receiver Operating Characteristic. |
All patients from the TCGA-STAD cohort were divided into high- and low-risk groups on the basis of the calculated score via the optimal cutoff value. Multivariate Cox regression analysis revealed that the four-gene model could independently predict the PM status or prognosis of patients with GC (HR=0.51, 95% CI=0.36‒0.73, p<0.001) (Figure 4E). OS with the corresponding risk score was analyzed, and the results revealed that the high-risk group contained more patients with GC and was associated with a worse prognosis (Figure 4F). In the test set, the 3-year and 5-year AUCs were 0.64 and 0.75, respectively (Figure 4G). Kaplan‒Meier (KM) analysis revealed that patients with low-risk scores had significantly better overall survival (Figure 4H). The expression levels of these four genes are shown in Figure 4I. In addition, three candidate genes in the risk model were related to poor prognosis in patients with GC (Figure S4A -C). Gene set enrichment analysis (GSEA) was performed on four candidate genes, and the results revealed signatures for the activation of the “ECM_RECEPTOR_INTERACTION”, “FOCAL_ADHESION”, “CELL_ADHESION_MOLECULES_CAMS”, and “CYTOKINE_CYTOKINE_RECEPTOR_INTERACTION” signaling pathways, which are associated with the metastasis of GC (Figure S4D). In summary, our prognostic models, which are based on M2 macrophage signature genes, are powerful tools for predicting GCPM prognosis.
Screening of Independent Prognostic Factors and Construction of a Nomogram
The relationships between clinicopathological features and the risk score revealed significant differences between the high-risk and low-risk groups with respect to tumor grade, AJCC stage, or T stage (Figure S5A). We developed a comprehensive nomogram that integrates the risk score with patient clinical variables to predict the probabilities of 3- and 5-year OS within the TCGA-STAD cohort (Figure S5B). The calibration curve revealed a remarkable concurrence between the projected probabilities and actual observed outcomes (Figure S5C). To further validate the generalizability of the nomogram, we subjected it to scrutiny using independent GSE62254 gastric cancer datasets, elucidating the 3- and 5-year calibration curves, as depicted in Figure S5D. The results revealed that the risk score demonstrated unparalleled proficiency in predicting the prognosis of patients with gastric cancer (GC).
The High-Risk Score Group Had a Lower Proportion of Patients with MSI-H and TMB
Next, we investigated the differences in genomic analysis between the high- and low-risk groups in the TCGA-STAD cohort. As shown in Figure 5A and B, the top 20 missense mutations, sorted by mutation frequency, were observed to have a relatively high mutation frequency in the low-risk group, except for NRXN1, and the top five mutated genes were TTN, TP53, MUC16, LRP1B, and SYNE1. Evidence suggests that patients with high MSI and TMB in gastric cancer typically benefit from immunotherapy.31,32 Thus, we explored the association between MSI/TMB status and the risk score, and the results revealed that patients with higher risk scores had a lower proportion of MSI-H patients (Figure 5C). More interestingly, we observed a negative correlation between TMB level and risk score (Figure 5D), and TMB levels were significantly greater in the low-risk group than in the high-risk group in the TCGA-STAD cohort (Figure 5E), whereas there was no significant difference in the IMvigor210 cohort (Figure 5F). These results suggest that patients with higher risk scores may be less suitable for immunotherapy.
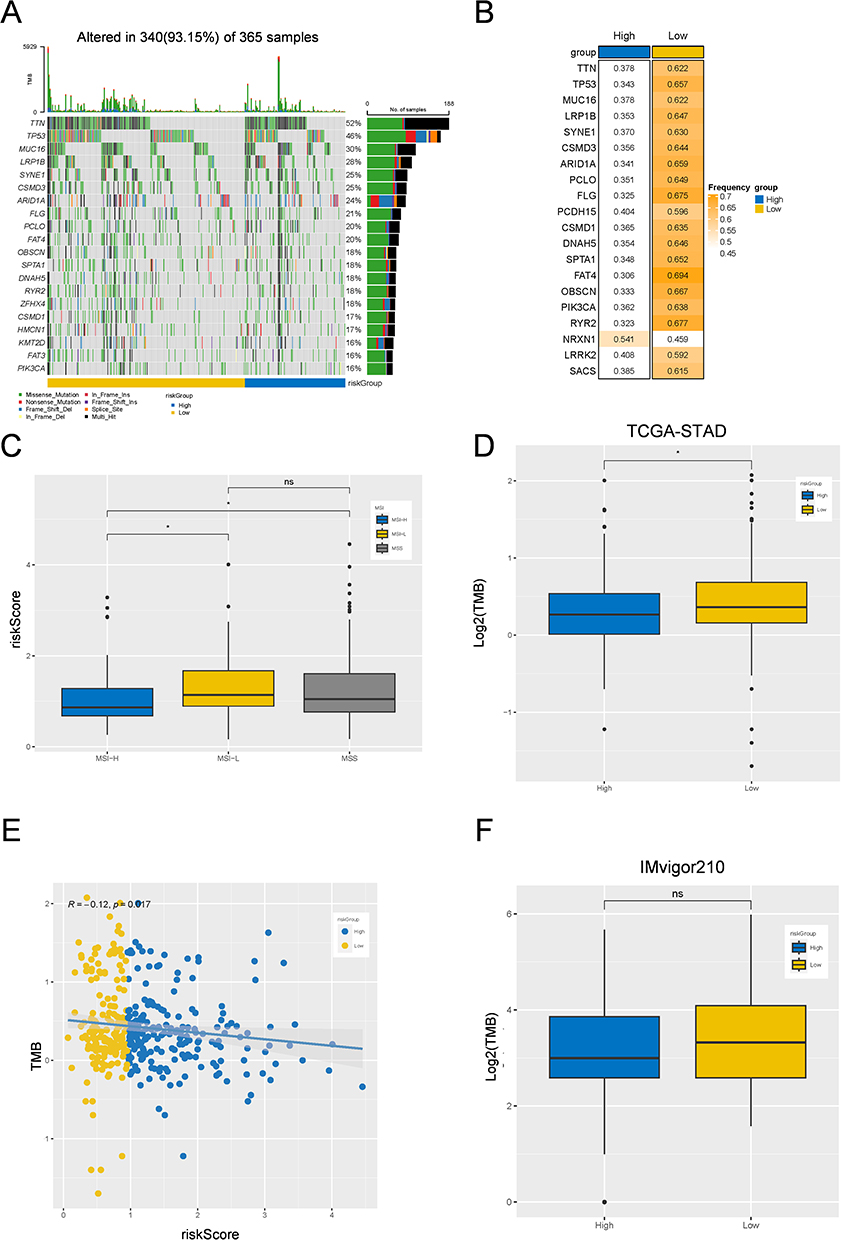 |
Figure 5 Gene mutation landscape among low-risk and high-risk group. (A and B) Mutation waterfall plots showing the top 20 genes with the highest mutation frequency in low-risk and high-risk groups. (C) Box plots of the relationship between risk-Score and MSI/MSS among the high- and low-risk groups in TCGA-STAD cohort (D) Box plots of the TMB difference in among the high- and low-risk groups in TCGA-STAD cohort. (E) Linear regression analysis analyzing the relationship between risk-Score and TMB. (F) Box plots of the TMB difference among the high- and low-risk groups in IMvigor210 cohort. *p < 0.05; Not Statistically Significant. Abbreviation: TMB, Tumor Mutation Burden. |
The High-Risk Score Group Was Less Sensitive to Immunotherapy
We subsequently evaluated the infiltration levels of three types of immune cells in the high-risk group. Interestingly, the infiltration most of the 28 immune cell subpopulations was greater in the high-risk group than in the low-risk group, whereas the enrichment of anticancer immune cells (activated CD4 T cells, CD8 T cells, and T helper cells 17), intermediate immunocytes (activated and immature B cells), and protumor immunocytes (neutrophils) was not significantly different (Figure 6A and B). The fractions of stromal and immune cells revealed that the stromal, immune, and ESTIMATE scores were significantly greater in the high-risk group (Figure 6C). We further analyzed the immune exhaustion signature and the results revealed that the expression levels of CAFs, MDSCs, TAMs, EMT, exhausted T cells, and the corresponding receptor signatures were greater in the high-risk group (Figure 6D).
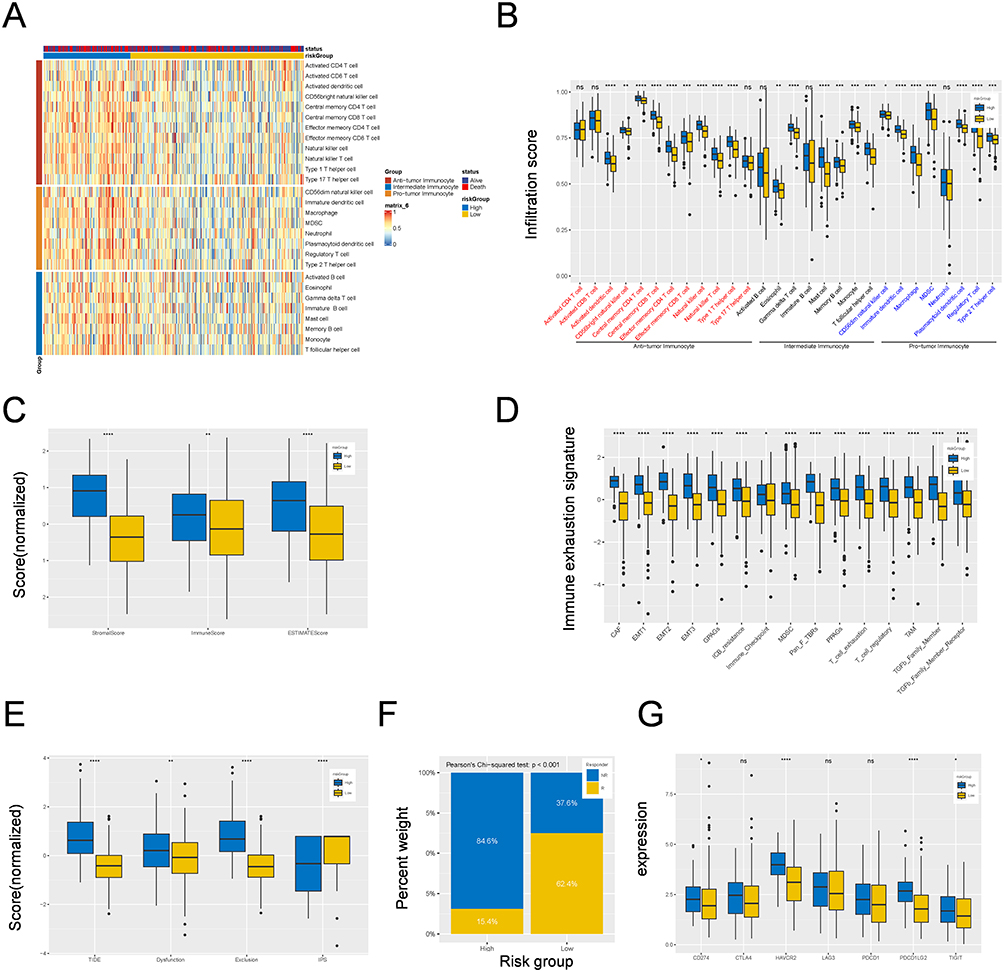 |
Figure 6 Correlation between M2 macrophage-related signature and immune landscape and immunotherapy in TCGA-STAD cohort. (A) A heatmap showing the landscape of 28 tumor-infiltrating immune cell types among high- and low-risk groups identified by ssGSEA. (B) Box plots showing the difference of infiltrating immune cell among high- and low-risk groups. (C) Box plots showing the relationship between risk-Score and stromal score, immune score and ESTIMATE score among high- and low-risk groups. (D) Box plots showing the difference of 28 tumor-infiltrating immune cell types or pathways in different risk groups. (E) Box plots showing the relationship between riskScore and the scores of TIDE, Dysfunction, Exclusion and IPS. (F) Box plots showing the response rate to immunotherapy among high- and low-risk groups. (G) Box plots showing the relationship between risk-Score the expression levels of immunosuppression checkpoint genes. *p < 0.05; **p < 0.01; ***p < 0.001; ****p < 0.0001; Not Statistically Significant. Abbreviation: ssGSEA, Single Sample Gene Set Enrichment Analysis. |
Moreover, we assessed the IPS, TIDE score and novel tumor immunotherapy response rate biomarkers.33 The results revealed that GC patients in the high-risk group had higher TIDE, dysfunction, and exclusion scores, whereas a lower IPS score indicated a higher rate of tumor immune escape (Figure 6E). In addition, the rate of patients in the low-risk group was more sensitive to immunotherapy, which suggests that the prognostic model may be indicative of treatment response in these patients (Pearson’s chi-squared test, p<0.001) (Figure 6F). The expression levels of immunosuppressive checkpoint genes were investigated, and the results revealed that CD274, CTLA4, HAVCR2, LAG3, PDCD1, PDCD1LG2, and TIGIT levels were increased in the high-risk group (Figure 6G). These results indicate that patients in the low-risk group may be more sensitive to immunotherapy.
The Prediction Model Was Validated in the GSE62254 and IMvigor210 Cohorts
To verify our prognostic model’s effectiveness, we assessed the model’s performance via two external sources: GSE62254 and IMvigor210. The results revealed that patients in the high-risk group had a worse prognosis (Figure 7A). The immune response results are also shown in Figure 7B and C. ssGSEA revealed that the expression levels of CAFs, MDSCs, TAMs, EMT, exhausted T cells, and their corresponding receptor signatures were greater in the high-risk group (Figure 7D). Moreover, the immunosuppressive checkpoint results revealed that HAVCR2, PDCD1, and PDCD1LG2 expression was greater in the high-risk group in the GSE62254 cohort (Figure 7E), and CD274, CTLA4, HAVCR2, LAG3, PDCD1, PDCD1LG2, and TIGIT expression was greater in the high-risk group than in the IMvigor210 cohort.
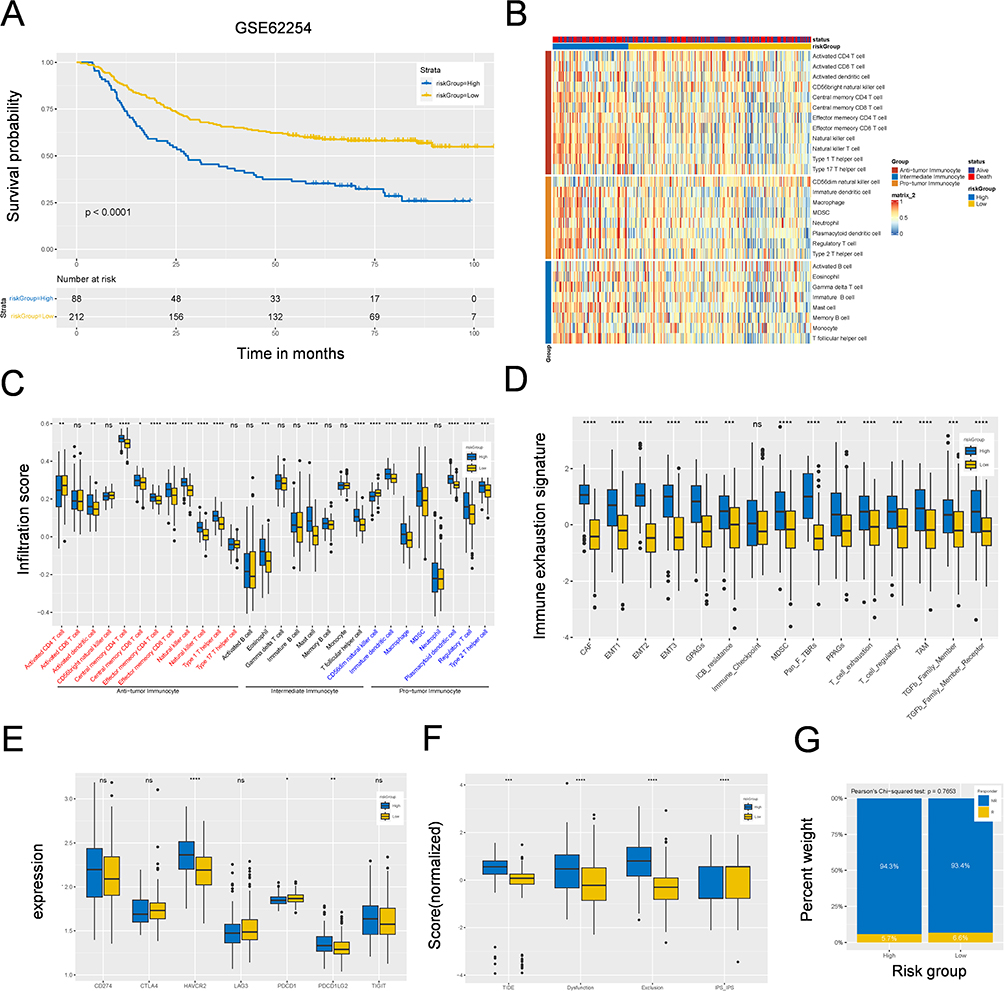 |
Figure 7 Correlation between M2 macrophage-related signature and immune landscape and immunotherapy in GSE62254 cohort. (A) Kaplan–Meier survival analysis of high- and low-risk groups in GSE62254 cohort. (B) A heatmap showing the landscape of 28 tumor-infiltrating immune cell types among high- and low-risk groups identified by ssGSEA. (C) Box plots showing the difference of infiltrating immune cell among high- and low-risk groups. (D) Box plots showing the difference of 28 tumor-infiltrating immune cell types or pathways in different risk groups. (E) Box plots showing the relationship between risk-Score the expression levels of immunosuppression checkpoint genes. (F) Box plots showing the relationship between risk-Score and the scores of TIDE, Dysfunction, Exclusion and IPS. (G) Box plots showing the response rate to immunotherapy among high- and low-risk groups. *p < 0.05; **p < 0.01; ***p < 0.001; ****p < 0.0001; Not Statistically Significant. Abbreviation: ssGSEA, Single Sample Gene Set Enrichment Analysis. |
In addition, the TIDE, dysfunction, exclusion and IPS scores were also verified, as shown in Figure 7F. However, the response rate to immunotherapy was not significantly different between the low- and high-risk groups in the GSE62254 cohort (Pearson’s chi-squared test, p=0.7653; Figure 7G). All the same results were observed in the IMvigor210 cohort (Figure S6A -F). These results further demonstrated the predictive power of our four-gene prognostic model.
Clinical Validation of the Risk Model
To substantiate the prognostic significance of our model, we recruited a clinical cohort consisting of 45 patients with GC to verify the expression of the four genes. The clinical information and original IHC score data are presented in Table S3. First, we demonstrated that M2 macrophage infiltration levels in GCPM tissues were greater than those in PT tissues and that GCPM and CD163-High patients had a worse prognosis (p=0.003 and p=0.040) (Figure 8A -D). Next, we found that three genes (DAB2, SPARC, and FOLR2) were highly expressed in the PM, whereas the expression level of FOLR2 was relatively low (Figure 8A and B). This also explains why FOLR2 was a negative risk factor in the model. Finally, we divided the 30 GCPM patients into high- and low-risk groups on the basis of their immunohistochemical scores. The results revealed that the high-risk group significantly overexpressed DAB2, SPARC, and PLTP, whereas the FOLR2 group showed no statistically significant difference (Figure 8E and F). This may be related to the low basal expression of FOLR2 in GC patients. In addition, Kaplan‒Meier analysis revealed that the high-risk group was significantly associated with worse survival in GCPM patients (p= 0.013) (Figure 8G). All the above experimental results were consistent with our constructed risk model, indicating that these four genes serve as potential prognostic biomarkers for predicting the survival of patients with GCPM.
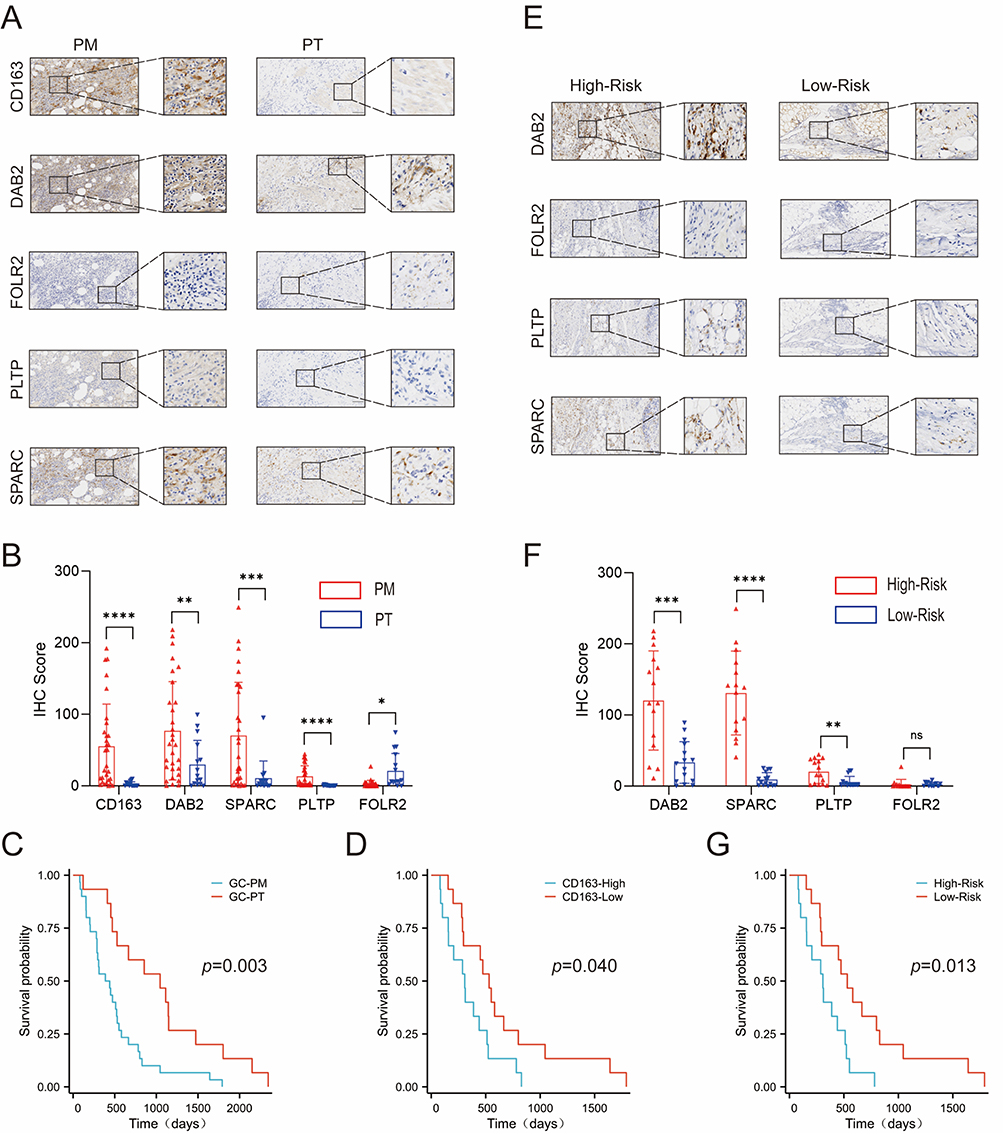 |
Figure 8 Validating the risk model genes in a clinical group. (A) The representative immunohistochemical image is derived from the five genes in the PM and PT. Scale bar, 200 µm. (B) Expression levels of the five genes were compared between the PT and PM. P values were presented by two-tailed unpaired Student’s t-test. (C) Kaplan–Meier survival curves of GC patients based on PM. P value was determined by the two-tailed log rank sum test. (D) Kaplan–Meier survival curves of GC patients based on expression levels of CD163. (E) The representative immunohistochemical image is derived from the four genes in the risk model that are in the high-risk and low-risk groups. Scale bar, 200 µm. (F) Expression levels of the four genes were compared between the high-risk and low-risk groups. P values were presented by two-tailed unpaired Student’s t-test. (G) Kaplan–Meier survival curves of GC patients based on risk scores. P value was determined by the two-tailed log rank sum test. *p < 0.05; **p < 0.01; ***p < 0.001; ****p < 0.0001; Not Statistically Significant. Abbreviations: GC, Gastric Cancer; PM, Peritoneal Metastasis; PT, Primary Tumor. |
Drug Sensitivity Analysis for the High‒ and Low‒Risk Groups
To further enhance the clinical value of the risk model, drug sensitivity was assessed to predict potential antitumor drugs for patients with GCPM based on the CellMiner database. The results indicated that patients in the high-risk group had higher sensitivity scores to dasatinib, docetaxel, doxorubicin, gemcitabine and imatinib (Figure S7A), whereas low-risk patients were more sensitive to bosutinib, gefitinib, lenalidomide and methotrexate (Figure S7B). In addition, we analyzed the relationships between the expression levels of the three genes and the IC50 values of the chemotherapeutic drugs separately. These results are consistent with the above findings that the expression levels of DAB2, PLTP, and SPARC were positively correlated with the sensitivity of cancer cells to dasatinib, docetaxel, doxorubicin, gemcitabine and imatinib (Figure S7C -E). In conclusion, these drugs may be promising for the treatment of GCPM.
Discussion
The peritoneum is a common site of metastasis in gastric cancer (GC) and is, associated with a poor prognosis and significant morbidity. The ability of GCs to metastasize to the peritoneum has been hypothesized to be due to their immunosuppressive microenvironment.34 M2 macrophages are important components of the immunosuppressive microenvironment. Previous studies have shown that macrophages cocultured with GC cells likely differentiate into M2-type TAMs and exert immunosuppressive effects on GC. Moreover, peritoneal macrophages are phenotypically and functionally polarized to the M2 phenotype in patients with PM from GCs.27,35 Therefore, it is necessary to screen M2 macrophage subsets specifically associated with GCPMs to identify more accurate targets for immunotherapy. Currently, scRNA-seq has emerged as a useful tool for transcriptional stratification to define cell subpopulations and identify specific biomarkers among different cell types in various cancers, including GC.36 Therefore, a GCPM-specific correlation M2-MRS prognostic model was constructed on the basis of scRNA-seq and bulk RNA-seq, which has been verified to be effective in predicting patient prognosis and immunotherapy response.
First, we integrated single-cell data from the GSE163558 and GSE183904 cohorts and analyzed cellular heterogeneity in the TIMEs of different tissues. The results revealed that eight main cell clusters. Moreover, we compared the proportions of components and found that T cells, M2 macrophages, and stromal cells were enriched in the PM, which is consistent with the finding of a previous study.25,37 Sen reported that T cells can be divided into four types: naïve, effector, memory, and exhausted.38 The predominance of exhausted T cells may have contributed to the high proportion of T cells observed in the PM. In addition, the cell communication results revealed that the overall patterns of interaction and signaling were more active in the PM. Among these, the cell‒cell interaction between M2 macrophages, T cells and stromal cells is increased in GCPM patients, which may be related to the occurrence of GCPM. Li also confirmed the strong cell- cell interaction between mCAFs and macrophages in GCPM patients.39 Zhao reported that the increased risk of GCPM is associated with the enrichment of M2 macrophages and stromal cells.34 On this basis, we reclustered M2 macrophages and identified clusters 2 and 5, which were specifically related to GCPM. To increase the stability of the signatures, we recognized the yellow and brown modules composed of 428 genes as the key modules via WGCNA, which has a robust positive correlation with M2 macrophages. In summary, M2 macrophages play a crucial role in creating an immunosuppressive environment that promotes GC development and peritoneal metastasis.
Next, we conducted an integrated analysis of DEGs from the scRNA-seq and bulk RNA-seq data to identify an M2 macrophage-related signature within the GCPM. The 4-gene prognostic model based on the M2 macrophage-related signature was established via the LASSO algorithm, which involves DAB2, SPARC, PLTP, and FOLR2, and the ROC curve results demonstrated that it had promising predictive efficacy for prognosis and was an independent prognostic factor for OS in patients with GC. Long reported that the interaction between DAB2+TAMs and FAP+CAFs promotes the formation of an immune barrier and is correlated with poor patient survival and nonresponse to immunotherapy in patients with HCC.40 SPARC expression in gastric cancer is significantly associated with lymph node and distant metastasis.41,42 Deng reported that SPARC contributes to the M2 polarization of macrophages.43 PLTP is a widely expressed lipid transfer protein that can be used as a biomarker to predict the prognosis of GC patients.44,45 Jiang reported that FOLR2 was specifically expressed in M2 macrophages and was positively correlated with CD163.46 We also considered that clinical characteristics could have an impact on the prognosis of patients; therefore, clinical characteristics were subjected to multifactorial Cox analyses, which revealed the independent influences of stage and risk score on the OS of GC patients. These models were further constructed as nomogram models, with a calibration curve verifying their remarkably favorable predictive ability.
Furthermore, patients in the high-risk group had lower MSI-H proportions, which indicated a poorer response to immunotherapy. ssGSEA revealed that immunosuppressive cells were enriched in the TIME. However, the high-risk group also presented increased levels of antitumor immunocytes, such as activated CD4/CD8+ T cells, activated dendritic (DC) cells, and natural killer (NK) cells. Studies have reported that both antitumor immune cells and protumor immune cells can coexist in the mucosal tissue of patients with gastric cancer.15 Although a greater proportion of antitumor immunocytes was found in high-risk patients, the expression of immune checkpoint genes (CD274, CTLA4, HAVCR2, LAG3, PDCD1, PDCD1LG2 and TIGIT) was greater, and immunosuppressive pathways (EMT, TGFβ) were more active in high-risk patients. These results suggest that patients with low‒risk scores are more likely to benefit from immunotherapy. The results of drug sensitivity indicated that the high-risk group presented higher sensitivity scores to dasatinib, docetaxel, doxorubicin, gemcitabine and imatinib, which was positively correlated with the expression levels of DAB2, PLTP, and SPARC. These results indicate that our model can provide a reference for the selection of chemotherapy drugs for patients with clinical GCPM.
Finally, to improve the reliability of our model’s predictive power, we clinically collected 45 gastric cancer samples for immunohistochemical verification (30 GCPM samples and 15 GC samples). To compensate for the lack of polychromatic immunohistochemistry, we attempted to make continuous thin sections to ensure the similarity of each section, to determine the effects of five molecules on the same slide. It is well known that CD163 and CD206 are classical markers of M2 macrophages in human tissues; therefore, we roughly regarded CD163 as an infiltration index of M2 macrophages. Our results revealed that CD163, DAB2, SPARC, and PLTP were highly expressed in GCPM patients, whereas FOLR2 was relatively poorly expressed, which also explains why the PLTP prognostic model risk coefficient was negative. In addition, DAB2, SPARC, and PLTP were significantly overexpressed in the high-risk group, whereas FOLR2 was not significantly different between the high- and low-risk groups. In fact, FOLR2 was weakly expressed in the GCPM, which may explain the lack of difference between the high- and low-risk groups. Encouragingly, the survival analysis revealed that patients in the high-risk group had worse outcomes than expected (p=0.013), suggesting that our model is incomparably reliable.
The main strength of our study is that we constructed the first GCPM prognostic model based on specific M2 macrophages, and this model was validated in our GCPM clinical specimens. However, this study has several limitations. First, the sample size of scRNA-seq was insufficient and there was heterogeneity between scRNA-seq and bulk RNA-seq. Second, it was not possible to experimentally validate M2-MRS in human macrophages due to the difficulty in obtaining specimens of peritoneal metastasis of gastric cancer. In addition, in recent years, the classification of macrophages is no longer limited to the traditional M1 and M2 models. Nevertheless, many current studies have not completely abandoned the traditional dichotomy, which remains to be seen in scientific progress. Finally, we did not perform cellular and animal experiments to investigate the effect of these marker genes on the biological behaviour of GCPM in vivo and in vitro. Therefore, further experimental designs are needed to investigate the role and mechanism of cell-state-specific M2 macrophage markers in GCPM progression.
Conclusion
Our findings indicated that cellular heterogeneity was found among the peritoneal metastatic tissues and primary tumor tissues of patients with GC, among which, M2 macrophages play crucial roles in the TIME. A prognostic model based on GCPM-specific M2 macrophages was constructed by integrating scRNA-Seq and bulk RNA-Seq data. The model has been validated in multiple ways, which could effectively predict both the prognosis and response rate to immunotherapy in GC patients. Of course, there are limitations to our results, and future relevant mechanisms need to be further validated in vivo and in vitro experiments. Overall, this study could be used as a reliable predictor of GCPM efficacy, providing novel insights into prediction and precision medicine for patients with GCPM in the future.
Abbreviations
PM, peritoneal metastasis; scRNA-seq, single-cell RNA sequencing; WGCNA, weighted gene coexpression network analysis; GC, gastric cancer; ICI, immune checkpoint inhibitor; ICB, immune checkpoint blockade; TIME, tumor immune microenvironment; TAMs, tumor-associated macrophages; OS, overall survival; AUC, area under the curve; ROC, receiver operating characteristic; LASSO, least absolute shrinkage and selection operator; TMB, tumor mutation burden.
Data Sharing Statement
The datasets presented in the present study are available from the TCGA database (https://portal.gdc.cancer.gov/), GEO database (https://www.ncbi.nlm.nih.gov/geo/), and IMvigor210 database (http://researchpub.gene.com/IMvigor210CoreBiologies). The data generated in this study and the supplementary materials are contained within the article.
Ethics Approval and Informed Consent
Informed consent was obtained from all patients prior to the analysis. All patient-related studies were reviewed and approved by the Institutional Review Board of the First Affiliated Hospital of Sun Yat-senyou University. The study was in accordance with the Declaration of Helsinki.
Acknowledgments
The authors would like to thank the Department of Gastrointestinal Surgery, The First Affiliated Hospital, and Laboratory of Surgery, The First Affiliated Hospital, Sun Yat-senyou University for providing support and instructions.
Funding
This work was supported by the National Natural Science Foundation of China [grant number: 81871908]. National Natural Science Foundation of China [grant number: 82070529]. General projects of the Guangdong Provincial Natural Science Foundation [grant number: 2021A1515010791].
Disclosure
The authors report no conflicts of interest in this work.
References
1. Smyth EC, Nilsson M, GrabschGrably HI, van Grieken NC, Lordickby Lordick F. Gastric cancer. Lancet. 2020;396(10251):635–648635–648. doi:10.1016/S0140-6736(20)31288-5
2. Sung H, Ferlay J, Siegel RL, et, and al. Global cancer statistics 2020: GLOBOCAN estimates of incidence and mortality worldwide for 36 cancers in 185 countries. CA Cancer J Clin. 2021;71(3):209–249209–249. doi:10.3322/caac.21660
3. Lei Z, Wang J, Li Z, et, and al. Hyperthermic intraperitoneal chemotherapy for gastric cancer with peritoneal metastasis: a multicenter propensity score-matched cohort study. Chin J Cancer Res. 2020;32(6):794–803794–803. doi:10.21147/j.issn.1000-9604.2020.06.12
4. CoccoliniCocktails F, Gheza F, LottiLotty M, et, And al. Peritoneal carcinomatosis. World J Gastroenterol. 2013;19(41):6979–69946979–6994. doi:10.3748/wjg.v19.i41.6979
5. Yonemura Y, EndouEnded Y, Sasaki T, et, and al. Surgical treatment for peritoneal carcinomatosis from gastric cancer. Eur J Surg Oncol. 2010;36(12):1131–11381131–1138. doi:10.1016/j.ejso.2010.09.006
6. Zhu BY, Yuan SQ, Nie RC, et, and al. Prognostic factors and recurrence patterns in T4 gastric cancer patients after curative resection. J Cancer. 2019;10(5):1181–11881181–1188. doi:10.7150/jca.28993
7. Nakamura M, Ojima T, Nakamori M, et, and al. Conversion surgery for gastric cancer with peritoneal metastasis Based on the diagnosis of second-look staging laparoscopy. J Gastrointest Surg. 2019;23(9):1758–17661758–1766. doi:10.1007/s11605-018-3983-7
8. Joshi SS, Badgwellby Badgwell BD. Current treatment and recent progress in gastric cancer. CA Cancer J Clin. 2021;71(3):264–279264–279. doi:10.3322/caac.21657
9. Muro K, Chung HC, Shankaran V, et, and al. Pembrolizumab for patients with PD-L1-positive advanced gastric cancer (KEYNOTE-012): a multicenter, open-label, phase 1b trial. Lancet Oncol. 2016;17(6):717–726717–726. doi:10.1016/S1470-2045(16)00175-3
10. Kang YK, Boku N, Satoh T, et, And al. Nivolumab in patients with advanced gastric or gastro-esophageal junction cancer refractory to, or intolerant of, at least two previous chemotherapy regimens (ONO-4538-12, ATTRACTION-2): a randomized, double-blind, placebo-controlled, Phase 3 trial. Lancet. 2017;390(10111):2461–24712461–2471. doi:10.1016/S0140-6736(17)31827-5
11. Kang YK, Chen LT, Ryu MH, et, And al. Nivolumab plus chemotherapy versus placebo plus chemotherapy in patients with HER2-negative, untreated, unresectable advanced or recurrent gastric or gastro-esophageal junction cancer (ATTRACTION-4): a randomized, multicenter, double-blind, placebo-controlled, phase 3 trial. Lancet Oncol. 2022;23(2):234–247234–247. doi:10.1016/S1470-2045(21)00692-6
12. Yasuda T, Wang YA. Gastric cancer immunosuppressive microenvironment heterogeneity: implications for therapy development. Trends Cancer. 2024;10(7):627–642627–642. doi:10.1016/j.trecan.2024.03.00810.1016byj.trecan.2024.03.008
13. Shi T, Zhang Y, Wang Y, et, And al. DKK1 promotes tumor immune evasion and impedes anti-PD-1 treatment by inducing immunosuppressive macrophages in gastric cancer. Cancer Immunol Res. 2022;10(12):1506–15241506–1524. doi:10.1158/2326-6066.CIR-22-0218
14. Huang F, Wang Y, Shao Y, et, And al. M2 macrophage classification of colorectal cancer reveals intrinsic connections with metabolism reprogramming and clinical characteristics. Pharmgenomics Pers Med. 2024;17:383–399383–399. doi:10.2147/PGPM.S458798
15. Gribov A, Sill M, LückLick S, et, And al. SEURAT: visual analytics for the integrated analysis of microarray data. BMC Med Genomics. 2010;3:21. doi:10.1186/1755-8794-3-21
16. Zhang X, Lan Y, Xu J, et, And al. CellMarker: a manually curated resource of cell markers in human and mouse. Nucleic Acids Res. 2019;47(D1):D721–d8The D721–D8. doi:10.1093/nar/gky900
17. Jin S, Guerrero-Juarez CF, Zhang L, et, And al. Inference and analysis of cell-cell communication using cellchat. Nat Commun. 2021;12(1):1088. doi:10.1038/s41467-021-21246-9
18. Langfelderby Langfelder P, Horvath S. WGCNA: an R package for weighted correlation network analysis. BMC Bioinf. 2008;9:559. doi:10.1186/1471-2105-9-559
19. Friedman J, Hastie T, Tibshirani R. Regularization paths for generalized linear models via coordinate descent. J Stat Softw. 2010;33(1):1–221–22. doi:10.18637/jss.v033.i01
20. Hebert PD, Cywinska A, Ball SL, deWaardDewaard JR. Biological identifications through DNA barcodes. Proc Biol Sci. 2003;270(1512):313–321313–321. doi:10.1098/rspb.2002.2218
21. Yoshihara K, Shahmoradgoli M, MartínezMartinez E, et, And al. Inferring tumor purity and stromal and immune cell admixture from expression data. Nat Commun. 2013;4:2612. doi:10.1038/ncomms3612
22. Subramanian A, Tamayo P, Mootha VK, et, And al. Gene set enrichment analysis: a knowledge-based approach for interpreting genome-wide expression profiles. Proc Natl Acad Sci U S A. 2005;102(43):15545–1555015545–15550. doi:10.1073/pnas.0506580102
23. GeeleherGeeally P, Cox NJ, Huang RS. Clinical drug response can be predicted using baseline gene expression levels and in vitro drug sensitivity in cell lines. Genome Biol. 2014;15(3):R47. doi:10.1186/gb-2014-15-3-r47
24. Shankavaram UT, Varma S, Kane D, et, And al. CellMiner: a relational database and query tool for the NCI-60 cancer cell lines. BMC Genomics. 2009;10:277. doi:10.1186/1471-2164-10-277
25. Cheng S, Li Z, Gao R, et, And al. A pan-cancer single-cell transcriptional atlas of tumor infiltrating myeloid cells. Cell. 2021;184(3):792–809.e23. doi:10.1016/j.cell.2021.01.010
26. Tulchinsky M, Weihs D. Computational modeling reveals a vital role for proximity-driven additive and synergistic cell-cell interactions in increasing cancer invasiveness. Acta Biomater. 2023;163:392–399392–399. doi:10.1016/j.actbio.2022.03.048
27. Takahashi K, Kurashina K, Yamaguchi H, et, And al. Altered intraperitoneal immune microenvironment in patients with peritoneal metastases from gastric cancer. Front Immunol. 2022;13:969468. doi:10.3389/fimmu.2022.969468
28. Song H, Wang T, Tian L, et, And al. Macrophages on the peritoneum are involved in gastric cancer peritoneal metastasis. J Cancer. 2019;10(22):5377–53875377–5387. doi:10.7150/jca.31787
29. Xu WX, Wang DD, Zhao ZQ, et, And al. Exosomal microRNAs shuttling between tumor cells and macrophages: cellular interactions and novel therapeutic strategies. Cancer Cell Int. 2022;22(1):190. doi:10.1186/s12935-022-02594-y
30. Wang F, Li B, Wei Y, et, And al. Tumor-derived exosomes induce PD1(+) macrophage population in human gastric cancer that promotes disease progression. Oncogenesis. 2018;7(5):41. doi:10.1038/s41389-018-0049-3
31. Smyth EC, Wotherspoon A, Peckitt C, et, And al. Mismatch repair deficiency, microsatellite instability, and survival: an exploratory analysis of the medical research council adjuvant gastric infusional chemotherapy (MAGIC) trial. JAMA Oncol. 2017;3(9):1197–12031197–1203. doi:10.1001/jamaoncol.2016.6762
32. Rizzo A, Ricci AD, Brandi G. PD-L1, TMB, MSI, and other predictors of response to immune checkpoint inhibitors in biliary tract cancer. Cancers. 2021;13(3):1.
33. Jiang P, Gu S, Pan D, et, And al. Signatures of T-cell dysfunction and exclusion predict cancer immunotherapy response. Nat Med. 2018;24(10):1550–15581550–1558. doi:10.1038/s41591-018-0136-1
34. Zhao JJ, Ong CJ, Srivatsavaby Srivatsava S, et, And al. Spatially resolved niche and tumor microenvironmental alterations in gastric cancer peritoneal metastases. Gastroenterology. 2024;167(7):1384–1398.e41384–1398.e4. doi:10.1053/j.gastro.2024.08.007
35. Nakamura Y, Kinoshita J, Yamaguchi T, et, And al. Crosstalk between cancer-associated fibroblasts and immune cells in peritoneal metastasis: inhibition in the migration of M2 macrophages and mast cells by tranilast. Gastric Cancer. 2022;25(3):515–526515–526. doi:10.1007/s10120-021-01275-5
36. Shi R, Wang X, Wu Y, et, And al. APOBEC-mediated mutagenesis is a favorable predictor of prognosis and immunotherapy for bladder cancer patients: evidence from pan-cancer analysis and multiple databases. Theranostics. 2022;12(9):4181–41994181–4199. doi:10.7150/thno.73235
37. Wang H, Wu C, Tong X, Chen S. A biomimetic metal-organic framework nanosystem modulates immunosuppressive tumor microenvironment metabolism to amplify immunotherapy. J Control Release. 2023;353:727–737727–737. doi:10.1016/j.jconrel.2022.11.054byj.jconrel.2022.11.054
38. SenYou DR, Kaminski J, Barnitzby Barnitz RA, et, And al. The epigenetic landscape of T-cell exhaustion. Science. 2016;354(6316):1165–11691165–1169. doi:10.1126/science.aae0491
39. Li Y, Zheng Y, Huang J, et, And al. CAF-macrophage crosstalk in tumour microenvironments governs the response to immune checkpoint blockade in gastric cancer peritoneal metastases. Gut. 2024;2024:1.
40. Long F, Zhong W, Zhao F, et, And al. DAB2 (+) macrophages support FAP (+) fibroblasts in shaping tumor barrier and inducing poor clinical outcomes in liver cancer. Theranostics. 2024;14(12):4822–48434822–4843. doi:10.7150/thno.99046
41. Zhao ZS, Wang YY, Chu YQ, Ye ZY, Tao HQ. SPARC is associated with gastric cancer progression and poor survival of patients. Clin Cancer Res. 2010;16(1):260–268260–268. doi:10.1158/1078-0432.CCR-09-1247
42. Yin J, Chen G, Liu Y, et, And al. Downregulation of SPARC expression decreases gastric cancer cellular invasion and survival. J Exp Clin Cancer Res. 2010;29(1):59. doi:10.1186/1756-9966-29-59
43. Deng SK, Jin Y, Jin Y, Wang JF. SPARC induces M2 polarization of macrophages to promote proliferation, migration, and angiogenesis of cholangiocarcinoma cells. Neoplasma. 2022;69(5):1101–11071101–1107. doi:10.4149/neo_2022_220324N333
44. Li Z, Chen H, Chen Z, Xie L, Pan D. Bioinformatics analysis reveals prognostic significance of the macrophage marker gene signature in gastric adenocarcinoma. Front Biosci. 2024;29(5):172.
45. Huang K, Chen S, Xie R, et, And al. Identification of three predictors of gastric cancer progression and prognosis. FEBS Open Bio. 2020;10(9):1891–18991891–1899. doi:10.1002/2211-5463.12943
46. Jiang Y, Qu X, Zhang M, et, And al. Identification of a six-gene prognostic signature for bladder cancer associated macrophage. Front Immunol. 2022;13:930352. doi:10.3389/fimmu.2022.930352
 © 2025 The Author(s). This work is published and licensed by Dove Medical Press Limited. The
full terms of this license are available at https://www.dovepress.com/terms
and incorporate the Creative Commons Attribution
- Non Commercial (unported, 4.0) License.
By accessing the work you hereby accept the Terms. Non-commercial uses of the work are permitted
without any further permission from Dove Medical Press Limited, provided the work is properly
attributed. For permission for commercial use of this work, please see paragraphs 4.2 and 5 of our Terms.
© 2025 The Author(s). This work is published and licensed by Dove Medical Press Limited. The
full terms of this license are available at https://www.dovepress.com/terms
and incorporate the Creative Commons Attribution
- Non Commercial (unported, 4.0) License.
By accessing the work you hereby accept the Terms. Non-commercial uses of the work are permitted
without any further permission from Dove Medical Press Limited, provided the work is properly
attributed. For permission for commercial use of this work, please see paragraphs 4.2 and 5 of our Terms.