Back to Journals » Clinical Ophthalmology » Volume 15
Comparison of Visual Acuity Measurement Using Three Methods: Standard ETDRS Chart, Near Chart and a Smartphone-Based Eye Chart Application
Authors Tiraset N, Poonyathalang A ![]() , Padungkiatsagul T
, Padungkiatsagul T ![]() , Deeyai M, Vichitkunakorn P
, Deeyai M, Vichitkunakorn P ![]() , Vanikieti K
, Vanikieti K
Received 28 January 2021
Accepted for publication 12 February 2021
Published 26 February 2021 Volume 2021:15 Pages 859—869
DOI https://doi.org/10.2147/OPTH.S304272
Checked for plagiarism Yes
Review by Single anonymous peer review
Peer reviewer comments 2
Editor who approved publication: Dr Scott Fraser
Nanida Tiraset,1 Anuchit Poonyathalang,1 Tanyatuth Padungkiatsagul,1 Montakarn Deeyai,1 Polathep Vichitkunakorn,2 Kavin Vanikieti1
1Department of Ophthalmology, Faculty of Medicine Ramathibodi Hospital, Mahidol University, Bangkok, Thailand; 2Department of Family and Preventive Medicine, Faculty of Medicine, Prince of Songkla University, Songkhla, Thailand
Correspondence: Kavin Vanikieti Email [email protected]
Purpose: To validate the Rosenbaum near vision card (Near Chart) and a smartphone-based visual acuity (VA) test (Eye Chart) against a standard retro-illuminated Early Treatment Diabetic Retinopathy Study (ETDRS) chart within participants.
Materials and Methods: A cross-sectional study of participants aged ≥ 18 years was conducted. VA was measured in all participants using the ETDRS chart, Near Chart and smartphone-based Eye Chart application, respectively. VA was converted to logarithm of the minimum angle of resolution (logMAR) for statistical analysis. Eyes with ETDRS VA worse than 1.0 logMAR (20/200) were excluded. The main outcome measures were levels of agreement between VA measured using the Near Chart or Eye Chart application vs the ETDRS chart.
Results: A total of 295 eyes of 151 participants were included. One hundred participants (66.2%) were female and the mean age was 64.3 ± 12.5 years. Educational level was high school or below for 49% of participants and at Bachelor’s degree or above for 51%. The median logMAR VAs of all eyes tested using the ETDRS chart, Near Chart and Eye Chart application were 0.1, 0.0 and 0.1, respectively. The median VA difference between the Near Chart vs ETDRS chart and Eye Chart application vs ETDRS chart was 0.0 logMAR in both cases for both the right eye (OD) and left eye (OS). Intraclass correlation coefficient (ICC) demonstrated a strong positive correlation between VA tested with the Near Chart vs ETDRS chart (OD: ICC=0.85; p< 0.001, OS: ICC=0.77; p< 0.001) and Eye Chart application vs ETDRS chart (OD: ICC=0.88; p< 0.001, OS: ICC=0.74; p< 0.001).
Conclusion: VA measurements with the Near Chart and smartphone-based Eye Chart application corresponded well to the standard ETDRS chart, suggesting potential utility of alternative portable VA tests for in-office or remote vision monitoring, particularly during periods of physical distancing such as the Coronavirus disease 2019 (COVID-19) era.
Keywords: visual acuity, ETDRS chart, Rosenbaum near vision card, smartphone-based Eye Chart application, COVID-19
Introduction
Visual impairment is a major global public health problem. According to the latest data from the World Health Organization, about one billion people globally have a visual impairment that could have been prevented or has yet to be addressed.1 Worldwide, most people with visual impairment live in low-middle income countries with limited healthcare accessibility and availability. Blindness and moderate to severe visual impairment have a wide range of negative socio-economic implications related to employment status, care-taking requirements, independence, quality of life, educational opportunities,2 and the risk of accidents3 and death.4–6
Visual acuity measurement is the most important method to evaluate overall visual function and is the most commonly performed procedure in ophthalmic clinical practice. Visual acuity testing is essential in helping clinicians to assess the severity of visual impairment, to determine whether further investigations are required, to decide on the urgency of treatment and to quantify visual changes over time.7
The current gold standard of visual acuity measurement in clinical practice and clinical research is the retro-illuminated logarithm of the minimum angle of resolution (logMAR) chart that was used in the Early Treatment Diabetic Retinopathy Study (ETDRS) (Figure 1). Each line of the chart contains five optotypes and the optotype size is changed on each line by a constant proportion. Visual acuity testing with the ETDRS chart generally requires a 4-meter distance and its use may be limited by its relatively high cost, large chart size, poor availability and applicability.8–11 Consequently, other methods of visual acuity measurement are still necessary in general ophthalmic offices (eg Snellen chart and Rosenbaum near vision card).
 |
Figure 1 Early Treatment Diabetic Retinopathy Study (ETDRS) chart. |
Smartphone applications play important roles in current daily life. The utility of mobile applications is rapidly expanding in various medical specialties. The Eye Chart (Eye Chart; version 2.3) is a free application for the Apple iOS in smartphone and tablet versions. This application assesses visual acuity using Snellen and tumbling E charts (Figure 2), making it applicable for use in patients unable to identify letters. However, the Eye Chart has not been standardized for visual acuity measurement. In consequence, a validation study is essential to assess the reliability of this smartphone-based visual acuity assessment tool by comparison with the standard ETDRS chart.
 |
Figure 2 Eye Chart application: (A) Snellen chart display; (B) tumbling E display. |
The Rosenbaum near vision card (Near Chart) (Figure 3) and Eye Chart may be useful in remote monitoring for homebound patients, those with high-risk chronic ocular diseases (such as age-related macular degeneration), or with potentially recurrent disease, and could substantially minimize costs to society associated with frequent clinic visits, lost patients’ or family members’ work hours, and transportation expenses.12 In addition, remote patient monitoring is an important consideration in the Coronavirus disease 2019 (COVID-19) era in terms of physical distancing policy.
 |
Figure 3 Rosenbaum near vision card (Near Chart). |
The main purpose of this study is to validate Near Chart and smartphone-based Eye Chart application visual acuity test against the standard retro-illuminated ETDRS chart in the same participants on the same visit.
Materials and Methods
Ethical Approval
This study protocol followed the tenets of the Declaration of Helsinki and was approved by the Institutional Review Board of the Faculty of Medicine Ramathibodi Hospital, Mahidol University, Bangkok. All participants provided informed consent prior to inclusion in the study and their privacy was protected throughout the analysis. The purposes of the study and examination process were clearly explained to the participants. The Eye Chart application was authorized by the program developer for use in this study.
Participants
This cross-sectional study was conducted in the outpatient clinic, Ramathibodi Hospital, Bangkok from September to November 2020. Patients aged 18 years and above who needed visual acuity measurement were invited to participate. Demographic data including age, gender and educational level were collected.
Visual Acuity Measurement
Prior to visual acuity measurement, all participants underwent manifest and subjective refraction tests to measure refractive error. The participants then underwent monocular visual acuity measurement using the ETDRS chart, Rosenbaum near vision chart (Near Chart) and smartphone-based Eye Chart application, respectively.
Participants were asked to follow the instructions given by the single examiner (author NT) before proceeding with the tests. To achieve the best-corrected visual acuity, all participants were corrected for presbyopia if necessary, and held the Near Chart at a constant viewing distance of 14 inches. For the Eye Chart application (a viewing distance of 4 feet) and the ETDRS chart (a viewing distance of 4 meters), participants wore their distance refractive error correction, if any. Viewing distances were measured prior to each examination, and were monitored during each test. All visual acuity tests were conducted monocularly with the fellow eye occluded, in the same room and lighting conditions by the single examiner (author NT). All participants were encouraged in all tests to read the smallest optotypes possible and to make their best guess when the task became difficult.
The Eye Chart application was developed as a smartphone-based service and uses Snellen and tumbling E displays. It was installed on an iPhone X (iOS 14.2). During the test, the device was set at eye-level and the screen brightness was set to maximum. The examiner asked the participants to read the letters (English alphabet) from the first line to the smallest letter they could read. In illiterate participants, the tumbling E was used and participants were asked to indicate the orientation of the branches of the letter E (top, bottom, right, left). For the Near Chart, participants were encouraged to read the optotypes in the same manner as the Eye Chart application.
ETDRS visual acuity was measured as the line on which the participant was able to identify more than half of the optotypes, and fewer than half on the next line (smaller optotypes). Due to the unequal number of optotypes on each line of the Near Chart and Eye Chart application, the visual acuity score was recorded as the line on which at least half of the optotypes were correctly identified. Visual acuity measured on these charts was converted to logMAR units for statistical analysis.
A flow diagram depicting the procedure followed in this study is shown in Figure 4. The main outcome measures were levels of agreement between visual acuities measured using the Near Chart or smartphone-based Eye Chart application versus the standard ETDRS chart.
 |
Figure 4 A flow diagram depicting the procedure followed in this study. |
Sample Size and Statistical Analysis
A sample size of at least 100 participants was based on a thorough review of current relevant literature.
Averages are reported as mean ± standard deviation (SD) for normally distributed variables or median with interquartile range (IQR) for non-normally distributed variables. Correlation plots and Bland–Altman scatterplots were used to show the relationships between visual acuity data sets. A jitter technique was used to ensure all data points were visible. For Bland–Altman scatterplots, the mean ± 2SD of visual acuity difference between two of the methods being compared was used to represent the limits of agreement. The intraclass correlation coefficient was used as a test of significance of the relationship between acuity data sets. Statistical significance was defined as p<0.05 and 95% confidence intervals (CI) were calculated to assess the difference between the means or medians (continuous and interval variables).
Results
Demographic and Refractive Data
A total of 302 eyes of 151 participants were included in this study, but seven eyes (2.3%) with visual acuity worse than 1.0 logMAR (20/200) on the ETDRS chart were excluded from analysis (n=295 eyes). The mean age was 64.3 ± 12.5 years (range, 18–85 years) and 66.2% of participants were female. The educational level of participants was high school or below for 49% and bachelor’s degree level or above for 51%. Demographic and refractive data including lens status and median spherical equivalent refractive errors reported at distance and near are detailed in Table 1.
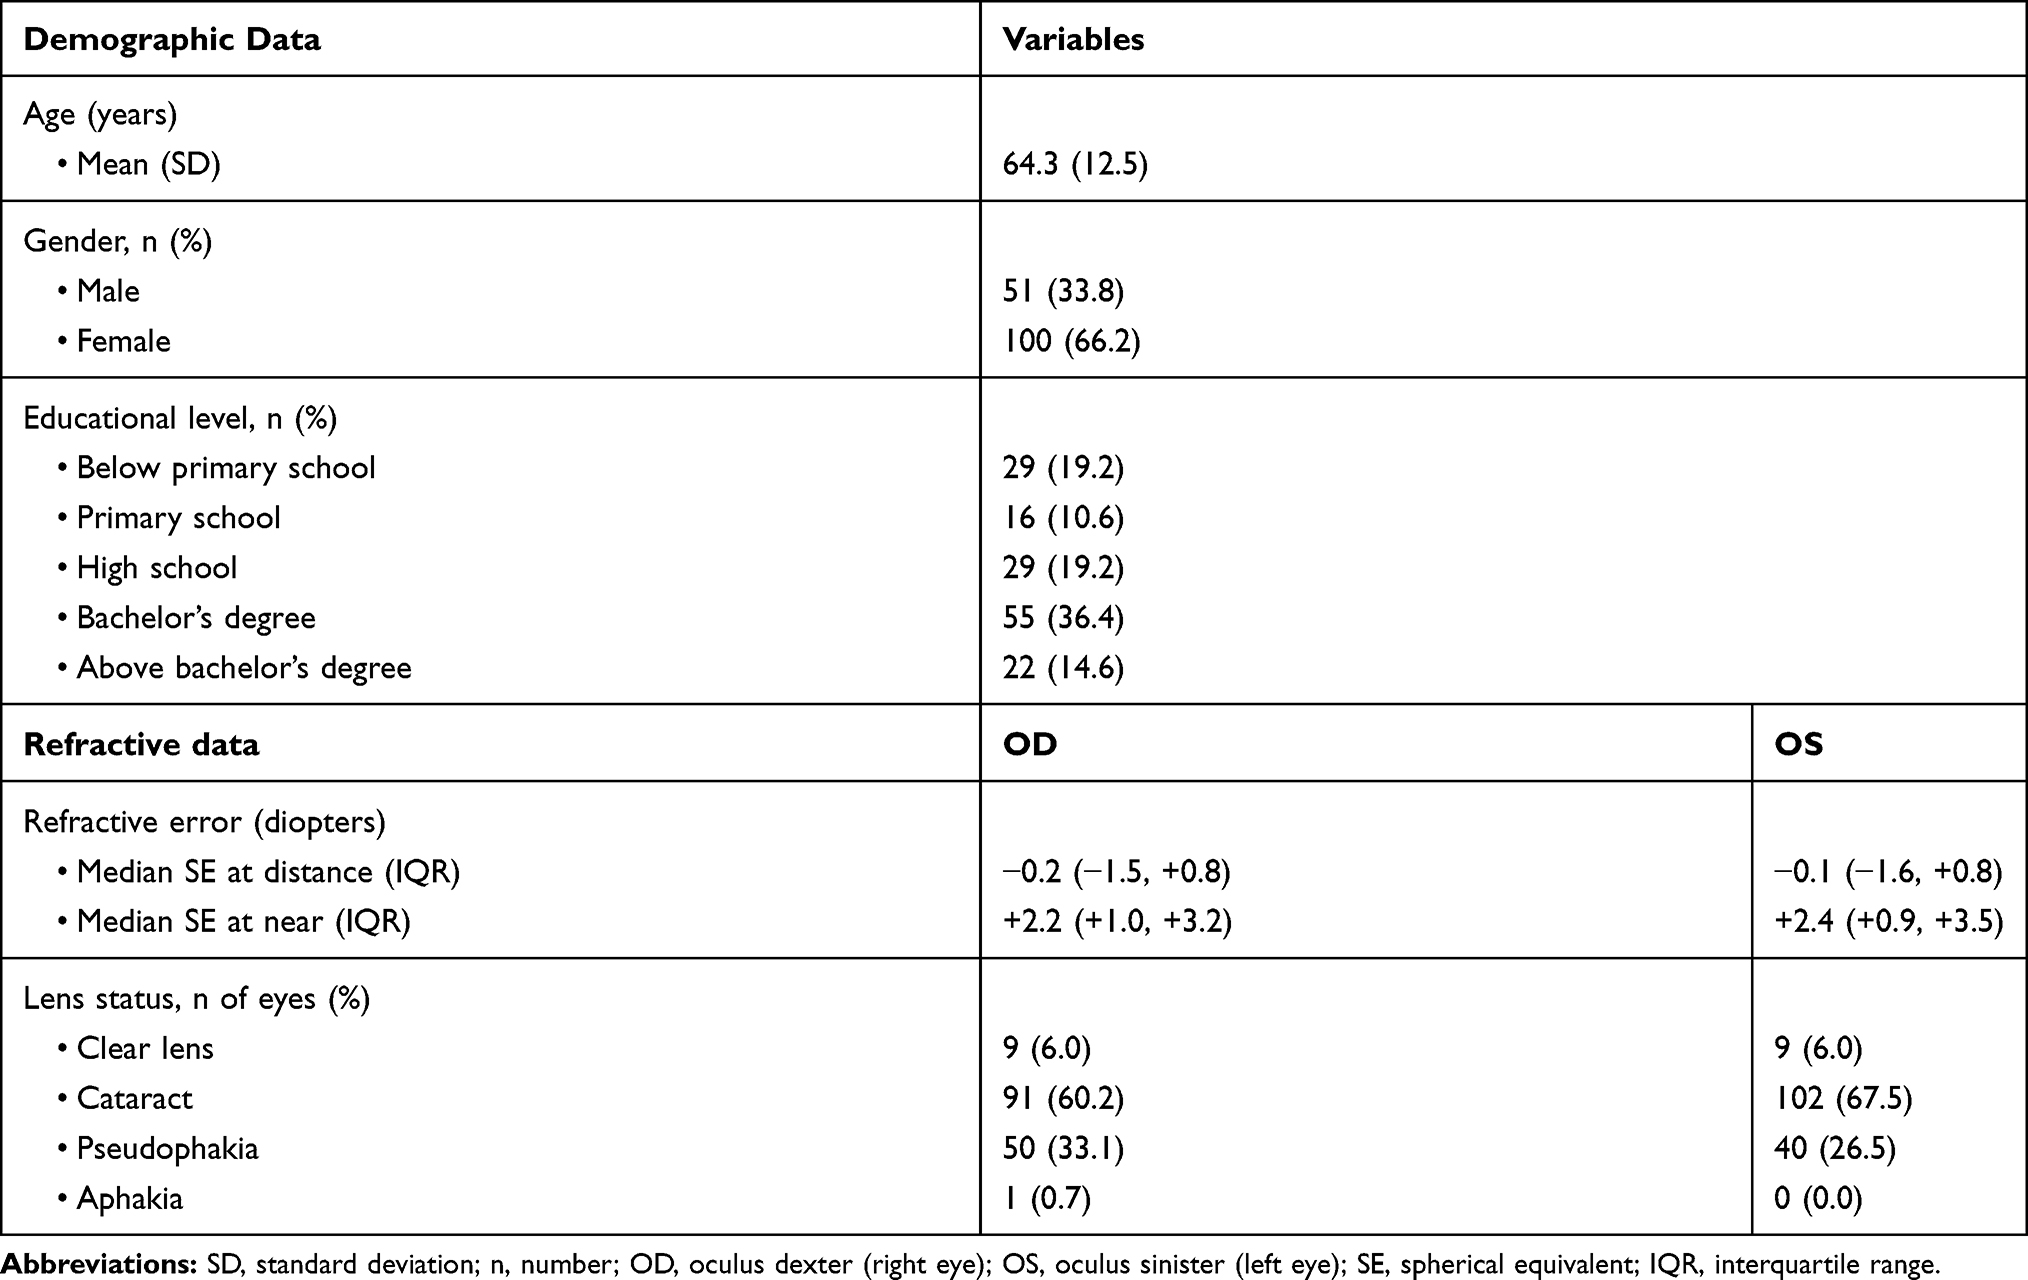 |
Table 1 Demographic and Refractive Data |
Near Chart vs ETDRS Chart
The median visual acuities measured using the ETDRS and the Near Chart were 0.1 logMAR (IQR 0.0, 0.18 logMAR) and 0.0 logMAR (IQR 0.0, 0.1 logMAR) respectively. The median difference between these acuities was 0.0 logMAR (IQR −0.1, 0.0 logMAR), and was identical in the right (OD) and left eye (OS) (Table 2). The intraclass correlation coefficient (ICC) showed a strong positive correlation between these acuity measures in each eye (OD: ICC=0.85; p<0.001, OS: ICC=0.77; p<0.001). The correlation plots and Bland–Altman difference plots for these comparisons are shown in Figure 5.
 |
Table 2 Visual Acuity Comparison Between Near Chart and ETDRS Chart |
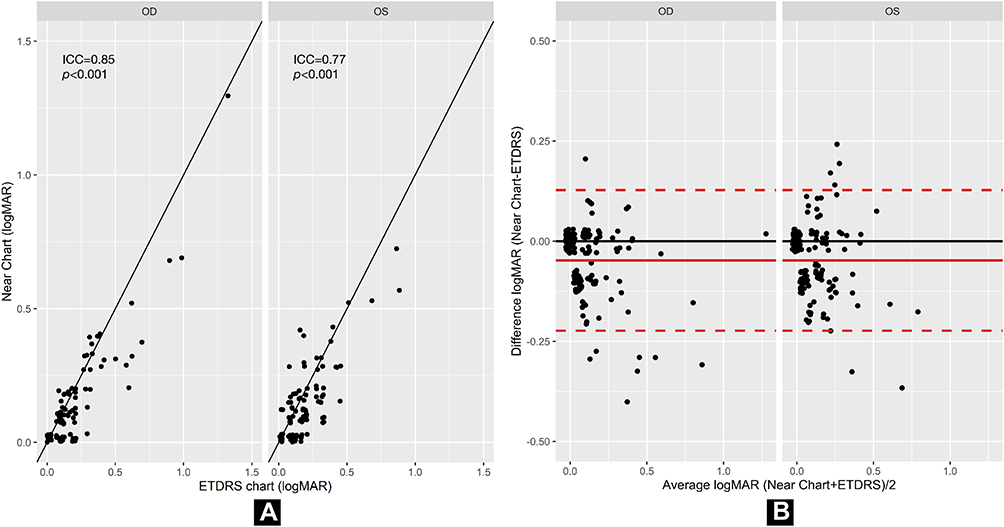 |
Figure 5 Comparison between logMAR visual acuity with Near Chart vs ETDRS chart. (A) Correlation between logMAR visual acuity in logMAR measured using the Near Chart and ETDRS chart for the right (OD) and left eye (OS). The black solid lines show linear regression. (B) A Bland–Altman plot demonstrating the differences in logMAR visual acuity scores between the Near Chart and ETDRS chart acuities for the right (OD) and left eye (OS). The x-axis displays the average logMAR acuity of the two methods being compared. The y-axis displays the difference in logMAR acuity between the two methods. Values above zero on the y-axis represent higher logMAR values (lower acuity) for the Near Chart than the ETDRS chart. The red solid line represents the mean visual acuity difference between the methods (−0.05 logMAR). The red dashed lines represent the limits of agreement (±2 SD of the mean visual acuity difference; SD=0.09 logMAR). Abbreviation: ICC, intraclass correlation coefficient. |
Eye Chart Application vs ETDRS Chart
The median visual acuity measured using the Eye Chart application was identical to that of the ETDRS (see above) with a median difference of 0.0 logMAR for the right eye (OD) (IQR 0.0, 0.0 logMAR) and left eye (OS) (IQR −0.1, 0.0 logMAR) (Table 3). Consistent with this, a strong positive correlation was found between these acuities in each eye (OD: ICC=0.88; p<0.001, OS: ICC=0.74; p<0.001). The correlation plots and Bland–Altman difference plots for these comparisons are shown in Figure 6.
 |
Table 3 Visual Acuity Comparison Between Eye Chart Application and ETDRS Chart |
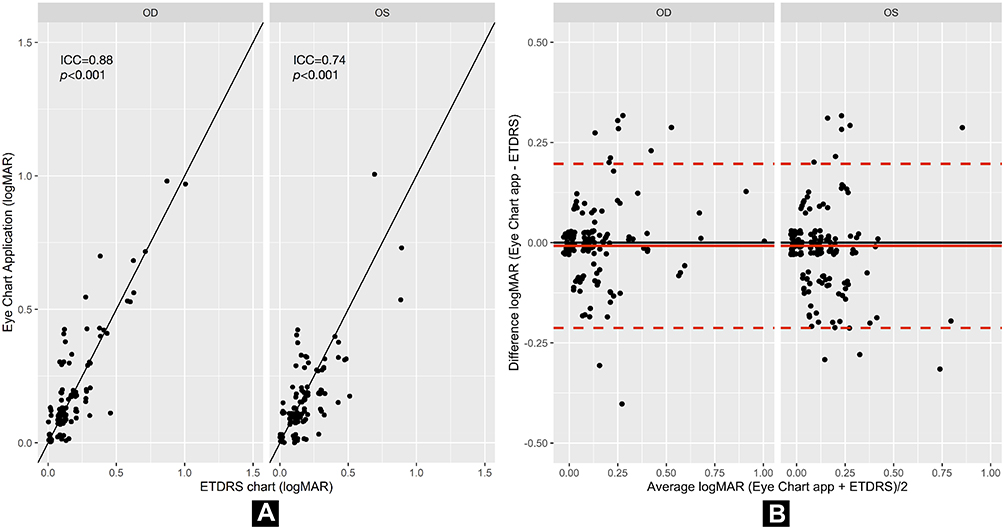 |
Figure 6 Comparison between logMAR visual acuity with Eye Chart application vs ETDRS chart. (A) Correlation between the visual acuity in logMAR measured using the Eye Chart application and ETDRS chart for the right (OD) and left eye (OS). The black solid lines show linear regression. (B) A Bland–Altman plot demonstrating the differences in logMAR visual acuity scores between the Eye Chart application and ETDRS chart for the right (OD) and left eye (OS). The x-axis displays the average logMAR acuity of the two methods being compared. The y-axis displays the difference in logMAR acuity between the two methods. Values above zero on the y-axis represent higher logMAR values (lower acuity) for the Eye Chart application than the ETDRS chart. The red solid line represents the mean of visual acuity difference between the methods (−0.01 logMAR). The red dashed lines represent the limits of agreement (±2 SD of the mean visual acuity difference; SD=0.10 logMAR). Abbreviation: ICC, intraclass correlation coefficient. |
The above results demonstrate good agreement between the standard ETDRS chart and both the Near Chart and the Eye Chart application.
Eye Chart Application vs Near Chart
We also compared visual acuities measured using the Eye Chart application and the Near Chart. The median visual acuities measured using these charts are shown above. The median visual acuity difference between them was 0.0 logMAR (IQR 0.0, 0.1 logMAR) for both the right (OD) and left eye (OS) (Table 4). A strong positive correlation was found between these acuities in each eye (OD: ICC=0.79; p<0.001, OS: ICC=0.74; p<0.001). The correlation plots and Bland–Altman difference plots for these comparisons are shown in Figure 7.
 |
Table 4 Visual Acuity Comparison Between Eye Chart Application and Near Chart |
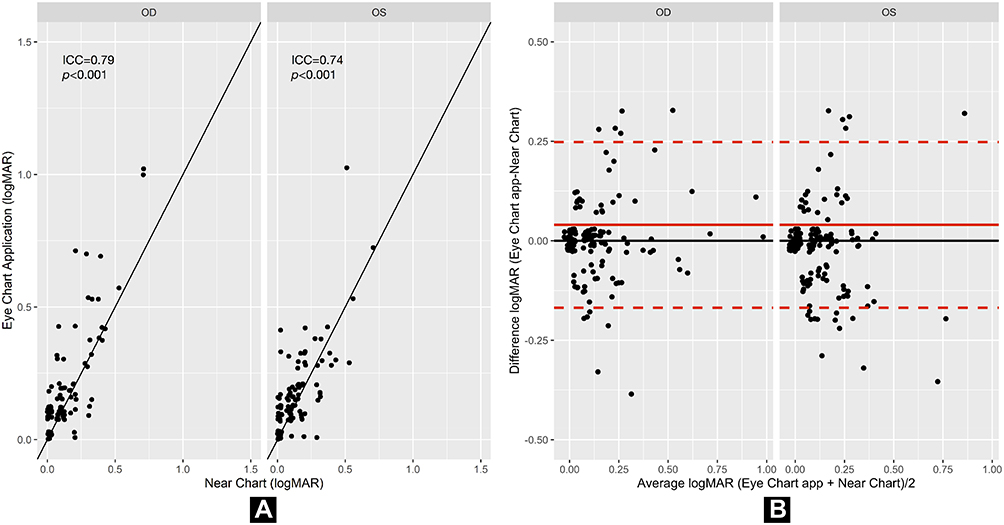 |
Figure 7 Comparison between logMAR visual acuity with Eye Chart application vs Near Chart. (A) Correlation between visual acuity in logMAR measured with the Eye Chart application and Near Chart for the right (OD) and left eye (OS). The black solid lines show linear regression. (B) A Bland–Altman plot demonstrating the differences in logMAR visual acuity scores between the Eye Chart application and Near Chart for the right (OD) and left eye (OS). The x-axis displays the average logMAR acuity of the two methods being compared. The y-axis displays the difference in logMAR acuity between the two methods compared. Values above zero on the y-axis represent higher logMAR values (lower acuity) for the Eye Chart application than the Near Chart. The red solid line represents the mean visual acuity difference between the two methods (0.04 logMAR). The red dashed lines represent the limits of agreement (±2 SD of the mean visual acuity difference; SD=0.10 logMAR). Abbreviation: ICC, intraclass correlation coefficient. |
A summary of intraclass correlation analysis of each pair-wise visual acuity measurement comparison is provided in Table 5. No adverse events from performing any of visual acuity tests were reported in this study.
 |
Table 5 A Summary of Intraclass Correlation Coefficient Analysis of Each Pair-Wise Visual Acuity Measurement Comparison |
Discussion
This study demonstrates that visual acuities measured using the Near Chart and Eye Chart application are in good agreement and are consistent with those measured using the standard retro-illuminated ETDRS chart.
Medical use of mobile technology has expanded rapidly with the global availability of smart device technology. It is important that these technologies are validated to encourage their use by health care providers and patients’ acceptance of them, especially in underdeveloped areas with limited eye care personnel and resources. The Near Chart and Eye Chart application are portable and reliable visual acuity assessment tools for remote patient monitoring, and offer potential benefits for use during periods in which physical distancing is required.
The Rosenbaum near vision card (Near Chart) is a portable visual acuity test, and is commonly used for near vision evaluation. To date, evidence on the comparison between distance and near visual acuities among ophthalmic diseases and even in the same disease is inconclusive. For example, better visual acuity at near than at distance with a significant mean difference of 1.38 lines (p< 0.001) has been found in cataract but no such disparity was found in age-related macular degeneration.13 Likewise, in amblyopic eyes, some studies14,15 have reported poorer visual acuity at near than at distance, but other studies are in disagreement with this.16,17
The present study concurs with previous research showing a similar level of agreement between a near visual acuity measurement (using the Runge near card) and the ETDRS chart.18
The smartphone-based visual acuity test may be of potential benefit in remote or self-administered visual acuity testing. This technology has a significant impact on practice in terms of remote health monitoring, which may reduce patient stress, increase patient empowerment, and reduce overall costs, with potentially fewer visits to the clinic. In the field of ophthalmology, remote monitoring between clinic visits could detect progression of high-risk chronic disease before irreversible damage occurs.19,20
It has been reported that smartphone-based and Rosenbaum near vision card visual acuities differ significantly from Snellen acuities.12 However, some studies19–21 have found good agreement between the smartphone-based application and the standard visual acuity measurement, in agreement with our results.
A clinician interested in using the Near Chart or Eye Chart application used here to replace the standard ETDRS chart should be aware of several practical considerations. In our study, while the acuities all showed good agreement, tests were conducted by a single trained examiner with well-controlled testing distance, illumination, and current refractive error correction. Conditions may be more variable in telemedicine or patients’ self-monitoring applications. Thus, it may be necessary to have assistant while performing the Near Chart or Eye Chart application in some populations especially in the elderly to increase the accuracy of the measurement.
To our knowledge, no studies comparing visual acuities measured using the Eye Chart application to those measured using the standard ETDRS chart have been published to date. Our results indicate that visual acuities measured using the Near Chart or Eye Chart application are substantially accurate visual acuity measurements and that these tests may be used for in-office and remote vision monitoring, such as during the COVID-19 era with physical distancing requirements.
Our study had some limitations. First, eyes with visual acuity worse than 1.0 logMAR (20/200) measured using the ETDRS chart were not included in the statistical analysis. Second, the only smart device used in this study was iPhone X. Future research using Eye Chart application in other smart devices is needed to validate our results.
Conclusions
Visual acuity measurements with the Rosenbaum near vision card (Near Chart) and smartphone-based Eye Chart application corresponded well to standard ETDRS acuities, suggesting applications for in-office and remote vision monitoring. This validation of portable methods may have utility during the COVID-19 era with physical distancing policies.
Acknowledgments
We thank Catherine Suttle, PhD, from Edanz Group (https://en-author-services.edanz.com/ac) for editing a draft of this manuscript.
Funding
This study was supported by Faculty of Medicine Ramathibodi Hospital, Mahidol University, Bangkok, Thailand.
Disclosure
The authors declare that they have no conflicts of interest for this work.
References
1. World Health Organization (WHO). Visual impairment and blindness factsheet [Internet]; 2020. Available from: https://www.who.int/news-room/fact-sheets/detail/blindness-and-visual-impairment.
2. Eckert KA, Carter MJ, Lansingh VC, et al. A simple method for estimating the economic cost of productivity loss due to blindness and moderate to severe visual impairment. Ophthalmic Epidemiol. 2015;22:349–355. doi:10.3109/09286586.2015.1066394
3. Evans BJ, Rowlands G. Correctable visual impairment in older people: a major unmet need. Ophthalmic Physiol Opt. 2004;24:161–180. doi:10.1111/j.1475-1313.2004.00197.x
4. McCarty CA, Nanjan MB, Taylor HR. Vision impairment predicts 5 year mortality. Br J Ophthalmol. 2001;85:322–326. doi:10.1136/bjo.85.3.322
5. Taylor HR, Katala S, Muñoz B, Turner V. Increase in mortality associated with blindness in rural Africa. Bull World Health Organ. 1991;69(3):335–338.
6. Zheng DD, Christ SL, Lam BL, Arheart KL, Galor A, Lee DJ. Increased mortality risk among the visually impaired: the roles of mental wellbeing and preventive care practices. Invest Ophthalmol Vis Sci. 2012;53:2685–2692. doi:10.1167/iovs.11-8794
7. Han X, Scheetz J, Keel S, et al. Development and validation of a smartphone-based visual acuity test (Vision at home). Transl Vis Sci Technol. 2019;8(4):27. doi:10.1167/tvst.8.4.27
8. Precision Vision. Products [Internet]. Available from: http://precision-vision.com.
9. Brady CJ, Eghrari AO, Labrique AB. Smartphone-based visual acuity measurement for screening and clinical assessment. JAMA. 2015;314(24):2682–2683. doi:10.1001/jama.2015.15855
10. Shamir RR, Friedman Y, Joskowicz L, Mimouni M, Blumenthal EZ. Comparison of Snellen and early treatment diabetic retinopathy study charts using a computer simulation. Int J Ophthalmol. 2016;9(1):119–123. doi:10.18240/ijo.2016.01.20
11. Kaiser PK. Prospective evaluation of visual acuity assessment: a comparison of snellen versus ETDRS charts in clinical practice (An AOS Thesis). Trans Am Ophthalmol Soc. 2009;107:311–324.
12. Phung L, Gregori NZ, Ortiz A, Shi W, Schiffman JC. Reproducibility and comparison of visual acuity obtained with SightBook mobile application to near card and Snellen chart. Retina. 2016;36(5):1009–1020. doi:10.1097/IAE.0000000000000818
13. Mercado CL, Doroslovacki P, Wang J, et al. Comparison of distance and near visual acuity in patients with vision loss due to cataract. Int Ophthalmol. 2017;37:169–172. doi:10.1007/s10792-016-0247-y
14. Catford GV. Amblyopia: a comparison between distance and near vision. Br J Ophthalmol. 1956;40:633–635. doi:10.1136/bjo.40.10.633
15. Lennarson L, France T, Portnoy J, et al. A comparison of distance and near vision in amblyopia.
16. Von Noorden GK, Helveston EM. Influence of eye position on fixation behavior and visual acuity. Am J Ophthalmol. 1970;70:199–204. doi:10.1016/0002-9394(70)90002-4
17. Chun H, Lee YC. Comparison between distance and near visual acuity in amblyopes. Medicine (Baltimore). 2020;99(46):e23111. doi:10.1097/MD.0000000000023111
18. Cooke MD, Winter PA, McKenney KC, et al. An innovative visual acuity chart for urgent and primary care settings: validation of the Runge near vision card. Eye (Lond). 2019;33(7):1104–1110. doi:10.1038/s41433-019-0372-8
19. Brucker J, Bhatia V, Sahel JA, Girmens JF, Mohand-Saïd S. Odysight: a mobile medical application designed for remote monitoring-a prospective study comparison with standard clinical eye tests. Ophthalmol Ther. 2019;8(3):461–476. doi:10.1007/s40123-019-0203-9
20. Jan-Bond C, Wee-Min T, Hong-Kee N, et al. REST—an innovative rapid eye screening. Test J Mob Technol Med. 2015;4:20–25. doi:10.7309/jmtm.4.3.4
21. Bastawrous A, Rono HK, Livingstone IA, et al. Development and validation of a smartphone-based visual acuity test (Peek Acuity) for clinical practice and community-based fieldwork. JAMA Ophthalmol. 2015;133(8):930–937. doi:10.1001/jamaophthalmol.2015.1468
 © 2021 The Author(s). This work is published and licensed by Dove Medical Press Limited. The
full terms of this license are available at https://www.dovepress.com/terms
and incorporate the Creative Commons Attribution
- Non Commercial (unported, 3.0) License.
By accessing the work you hereby accept the Terms. Non-commercial uses of the work are permitted
without any further permission from Dove Medical Press Limited, provided the work is properly
attributed. For permission for commercial use of this work, please see paragraphs 4.2 and 5 of our Terms.
© 2021 The Author(s). This work is published and licensed by Dove Medical Press Limited. The
full terms of this license are available at https://www.dovepress.com/terms
and incorporate the Creative Commons Attribution
- Non Commercial (unported, 3.0) License.
By accessing the work you hereby accept the Terms. Non-commercial uses of the work are permitted
without any further permission from Dove Medical Press Limited, provided the work is properly
attributed. For permission for commercial use of this work, please see paragraphs 4.2 and 5 of our Terms.