")
Back to Journals » Clinical Ophthalmology » Volume 8
Comparison of the nerve fiber layer of type 2 diabetic patients without glaucoma with normal subjects of the same age and sex
Authors Takis A, Alonistiotis D , Panagiotidis D, Ioannou N, Papaconstantinou D, Theodossiadis P
Received 8 May 2013
Accepted for publication 20 July 2013
Published 25 February 2014 Volume 2014:8 Pages 455—463
DOI https://doi.org/10.2147/OPTH.S47762
Checked for plagiarism Yes
Review by Single anonymous peer review
Peer reviewer comments 2
Alexandros Takis,1 Dimitrios Alonistiotis,1 Dimitrios Panagiotidis,1 Nikolaos Ioannou,1 Dimitris Papaconstantinou,2 Panagiotis Theodossiadis1
1Ophthalmological University Clinic of Athens, Attikon Hospital, Athens, Greece; 2Ophthalmological University Clinic of Athens, Geniko Kratiko Hospital, Athens, Greece
Background: The retinal nerve fiber layer (RNFL) thickness in patients with diabetes mellitus type 2 was compared to normal subjects of similar age and sex, having first excluded any risk factors for glaucoma. The correlation between the RNFL thickness and the severity of diabetic retinopathy was investigated at its primary stages and with other ocular and diabetic parameters.
Methods: A prospective, case series study was carried out. Twenty-seven diabetic patients without diabetic retinopathy, 24 diabetic patients with mild retinopathy, and 25 normal, age-matched subjects underwent a complete ophthalmological examination and imaging with scanning laser polarimetry for the evaluation of the RNFL. Multivariate analysis was applied in order to investigate the correlation between RNFL and diabetic parameters, such as age, duration of diabetes, insulin therapy, levels of glycosylated hemoglobin; and ocular parameters, such as cup to disc ratio, levels of normal intraocular pressure, and central corneal thickness.
Results: The mean inferior average of RNFL and the temporal-superior-nasal-inferior-temporal standard deviation were statistically significantly lower in both diabetic groups, and the nerve fiber index was higher (P=0.04) compared to the normal group. There was no statistically significant difference between the diabetic groups. The factor analysis showed no significant correlation between the RNFL and the previously mentioned diabetic and ocular parameters.
Conclusion: The existence of diabetes should be seriously considered in evaluating the results of scanning laser polarimetry. Multivariate analysis for RNFL was used for the first time.
Keywords: diabetes, glaucoma, RNFL, SLP
Introduction
Diabetic retinopathy is a major cause of visual impairment worldwide. It is expected that the global prevalence of diabetes mellitus in adults will rise from 171 million in 2000 to 366 million in 2030.1 Diabetic retinopathy is the consequence of microvascular and neural changes. There is strong evidence from good quality randomized controlled trials showing that primary prevention, early detection, and treatment reduce the risk of blindness.2
Evaluation of the retinal nerve fiber layer (RNFL), as a means of assessing optic nerve health, has been a well-established clinical and investigational tool.3 Studies have supported the finding that diabetes mellitus was associated with thinning of the RNFL. Attempts have been made to find correlations between thinning of RNFL and age, sex, duration of diabetes, disease stage, and glycemic control.
The aim of our study was to determine whether type 2 diabetes mellitus, without retinopathy or with mild retinopathy, was associated with thinning of the RNFL. Patients with the disease were compared to normal subjects of the same age and sex, having excluded any predisposing or risk factors for glaucoma. RNFL thickness was measured by scanning laser polarimetry (SLP) using software to make our results comparable to those of previous studies.
Moreover, we analyzed the data to demonstrate whether such impairment of the RNFL correlated with the stage of diabetic retinopathy and other diabetic parameters (insulin therapy, duration of diabetes, age, and glycosylated hemoglobin [HbA1c]) as well as ocular parameters (normal intraocular pressure [IOP], cup to disc [C/D] ratio, and central corneal thickness [CCT]). To our knowledge, this is the first time that multivariate analysis was used for this purpose. Lastly, in the presence of RNFL thinning, we examined whether this finding was more prominent on the upper or lower half of the retina.
Materials and methods
This was a prospective, noninvasive, case series study comprising 51 diabetic patient participants. These patients were selected among diabetics who were attending the Diabetic Retinopathy Clinic (2nd Ophthalmology Department of Attikon University Hospital in Athens, Greece) within a period of 6 months (March 2011 to September 2011).
Selection criteria included the presence of type 2 diabetes mellitus for more than 5 years, either without retinopathy or associated with mild retinopathy. The definition of mild diabetic retinopathy was based on the Early Treatment Diabetic Retinopathy Study (ETDRS) criteria.4 The exclusion criteria included the following:
- Reduced visual acuity <20/40
- Opacity of the refractive media
- IOP >21 mmHg
- Personal or family history of glaucoma or ocular hypertension
- C/D ratio ≥0.3
- AC/D ratio difference between the two eyes >0.2
- Existence of glaucomatous lesions or peripapillary hemorrhage in the optic disc
- Presence of a narrow anterior chamber angle
- Anterior chamber angle with pathological elements, such as anterior synechiae or hyperpigmentation
- Neovascularization of the iris
- Presence of secondary causes of glaucoma, such as pseudoexfoliation syndrome (PEX) or syndrome of pigment dispersion (SPD)
- Presence of macular edema
- Any kind of previous fundus photocoagulation
- Eye fundus diseases, such as branch or central vein occlusion, central retinal artery occlusion, age-related macular disease, macular hole or epiretinal membrane
- History of optic neuropathy
- High myopia
- Previous refractive surgeries.
The control group consisted of 25 nondiabetic (normal) subjects of the same age range and sex as the diabetic patients. The same exclusion criteria were applied to the control group. All normal subjects had no history of diabetes and had undergone at least one blood exam showing normal serum glucose levels (<110 mg/dL) and an HbA1c measurement <6% in the last 6 months.
Ethical approval was obtained from Attikon University Hospital ethics committee. The aims and objectives of our study were explained to all participants in accordance to the Declaration of Helsinki. A written consent was obtained from all patients by the researchers.
Patients’ medical history was recorded, visual acuity was measured with the best possible correction, and IOP was measured with the use of a Goldman applanation tonometer prior to pupil dilatation. All participants underwent ultrasonic corneal pachymetry and gonioscopy using the Zeiss gonioscope (Carl Zeiss Meditec AG, Jenna, Germany). Patients then underwent mydriasis in order to determine the presence and stage of diabetic retinopathy and to detect any exclusion criteria for the study. High quality 45-degree fundus color photography for the evaluation of cup and disc size was performed in all subjects.
Of the 80 diabetic patients who were initially examined, 28 were excluded from our study. Five were excluded due to IOP >21 mmHg or antiglaucomatous therapy (18%), five due to a C/D ratio >0.3 or a difference >0.2 between the two eyes (18%), another five due to PEX or SPD (18%), three due to family history of glaucoma (11%), three due to macular edema (11%), two due to high myopia (7%), two due to previous refractive surgery (7%), two due to branch retinal vein occlusion (7%), and finally, one due to a pathological angle (4%).
Of the 40 normal subjects who were initially examined, 15 were excluded: three due to IOP >21 mmHg or antiglaucomatous treatment (20%), three due to a C/D ratio >0.3 or a difference >0.2 between the two eyes (20%), four due to PEX or SPD (27%), two due to family history of glaucoma (13%), two due to high myopia (13%), and one due to age-related macular disease (7%).
Of the remaining 52 diabetic subjects, 27 showed bilateral normal fundus on the eye fundus examination and, for the purpose of this study, formed the group “diabetics without retinopathy.” The other 25 patients had mild diabetic lesions bilaterally and formed the group “diabetics with mild diabetic retinopathy” according to the ETDRS criteria.4 All 52 participants had HbA1c results obtained within the last 3 months. Twenty-five of the 52 diabetics were under both oral and insulin therapy (13 without retinopathy and 12 with mild retinopathy). The remaining 27 diabetic patients were on oral treatment only.
All participants had their RNFL measured by SLP using GDx VCC software, version 5.5.0 (Carl Zeiss Meditec, Dublin, CA, USA). SLP uses polarized laser light (near-infrared laser of 780 nm), also known as GDx. The laser scans the fundus, building a monochromatic image. The state of polarization of the light is changed (retardation) as it passes through birefringent tissue, ie, the cornea and RNFL. The highly ordered (paralleled) structure of the axons’ microtubules is the source of RNFL birefringence. Corneal birefringence is partly eliminated by a proprietary “corneal compensator”. The amount of retardation of light reflected from the fundus is used as an indirect marker for RNFL thickness.5,6
Three images were taken from each participant, and the one with the highest quality index was chosen for analysis. All of the resulting images had a satisfactory quality index (≥8), with the exception of one diabetic patient with mild bilateral diabetic retinopathy who was on both oral and insulin therapy and had a quality index of 6. He was thus excluded from the study. The following GDx parameters were studied:
- Temporal-superior-nasal-inferior-temporal (TSNIT) average: the average TSNIT RNFL thickness in the calculation circle. The calculation circle is a fixed circle (or more precisely, a fixed size band) centered on the optic nerve head. The band is 0.4 mm wide and has an outer diameter of 3.2 mm and an inner diameter of 2.4 mm.
- Superior average: the average RNFL thickness in the superior 120° region of the circulation circle.
- Inferior average: the average RNFL thickness in the inferior 120° region of the circulation circle.
- TSNIT standard deviation (SD): this number represents the SD of the values contained in the circulation circle. The higher the number, the greater the modulation of the double-hump pattern. In a normal eye, there is a high modulation.
- Inter-eye symmetry: this is the correlation of corresponding points in the TSNIT data for right and left eyes. The closer the ratio is to 1.0, the more symmetric the RNFL.
- Nerve fiber indicator (NFI): the NFI is a measure based on the entire RNFL thickness map and is calculated using an advanced form of neural network, called a support vector machine. It is trained on a large sample of representative healthy and glaucomatous eyes and utilizes information from the entire RNFL thickness map to optimize the discrimination between healthy and glaucomatous eyes. The output of the NFI is a single value that ranges from 1–100, with classification based on the ranges 1–30, normal; 31–50, borderline; and ≥51, abnormal. The NFI indicates the overall integrity of the RNFL.
Statistical analysis
Both eyes of all participants underwent SLP GDx examination. Because statistical analysis required one eye per person, the right eye of each individual was randomly chosen for this purpose. Statistical analyses were performed with the Statistical Package for Social Sciences software (SPSS version 14; IBM Corporation, Armonk, NY, USA). Probability (P)-values of 0.05 were considered statistically significant. Initially, estimation of descriptive statistics (mean value, SD, range) was performed for each of the parameters of each group of subjects. Analysis of variance (ANOVA) was used to assess the differences in the demographic parameters among the three groups. The Tukey’s honestly significant difference test was used to evaluate pairwise differences between groups. The results of the GDx VCC software numerical parameters for the two diabetic groups were compared applying the Mann–Whitney U test.
Furthermore, the relationships between RNFL measurements with age, IOP, CCT, vertical C/D ratio, insulin therapy, and years of diabetes were examined by performing a multivariate factor analysis. Factor analysis is a generic term, which describes a number of mathematical methods designed to analyze interrelationships within a set of variables (R-mode).7 The factors are constructed by a linear transformation of the original variables in a way that reduces the overall complexity of the original numerous medical data. Factor analysis (R-mode) was performed for each group separately. For R-mode factor analysis of this study, a database was constructed with columns containing the demographic features, ocular features, and GDx parameters, and rows containing the patients (eyes). A number of criteria were used to determine the appropriate number of factors to retain, including the scree test8 and the Kaiser–Guttman criterion.9 The Varimax procedure was used for the rotation of the retaining factor loadings by producing as many loadings of near-zero and high in order to achieve maximum dimensionality of the factors.10 For the purposes of interpretation of data, a “high” loading was defined as >0.75 and a “moderate” loading as 0.40–0.75. Thus, variables that presented a rotated loading >0.40 were considered a significant loaded on a factor. Factor analysis is a correlation-oriented method and requires that variables follow normal distributions.7 The Kolmogorov–Smirnov test for normality showed that the data distribution of the examined variables followed the normal distribution (P>0.05) and were suitable for factor analysis application.
To our knowledge, this is the first time that multivariate statistical analysis has been applied to correlate medical and ocular parameters with GDx measurements.
Results
The demographic parameters from 51 patients with diabetes mellitus and 25 normal control subjects are presented in Table 1. There were no significant differences with respect to CCT and C/D ratio among the three groups of subjects or with respect to HbA1c between the two diabetic groups according to ANOVA (P>0.05) Also, age and IOP, that may affect the RNFL thickness, presented no statistical difference among the groups.11,12
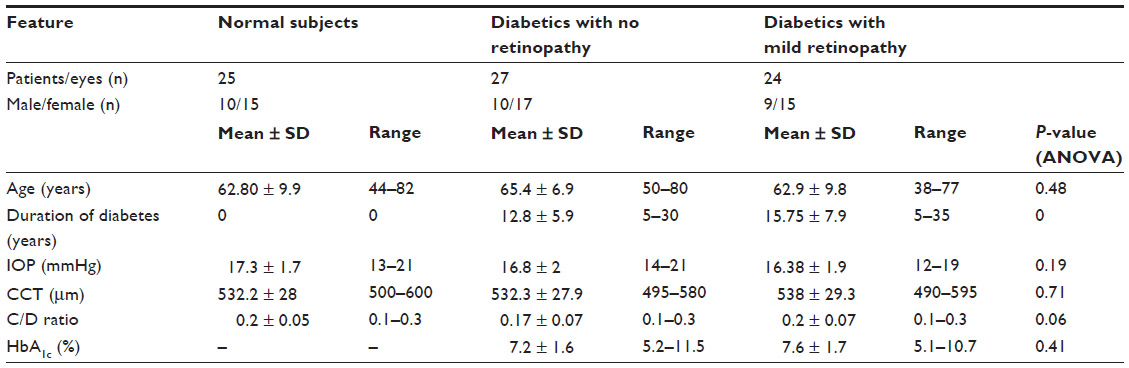 | Table 1 Demographic features of enrolled subjects |
Table 2 shows the comparison of the GDx variables for each group. There was no statistically significant difference between groups with respect to the TSNIT average value (P=0.27, ANOVA) and superior average (P=0.18, ANOVA). Inferior average values were statistically significantly different between the three groups (P=0.017, ANOVA). Subjects in the control group had thicker RNFL in the inferior quadrants compared to the patient group with no retinopathy according to post hoc Tukey’s test for the inferior average (P=0.02). The difference in the inferior average RNFL thickness was smaller between the control group and the group with retinopathy, with low statistical significance following Tukey’s test (P=0.06). TSNIT SD values were higher in the control group than for those of both diabetic groups.
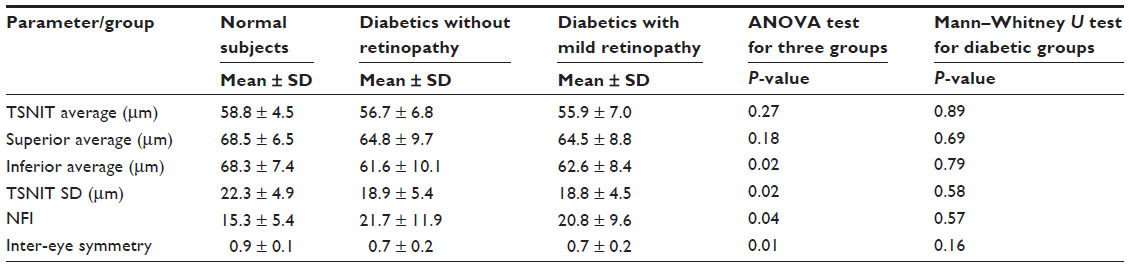 | Table 2 GDx VCC parameters of enrolled subjects |
Higher NFI values were present in the no retinopathy group compared to the normal subjects group according to pairwise differences (P=0.047). Tukey’s test did not detect the higher NFI values in the retinopathy group compared to the normal group with an estimated P-value of 0.109. Tukey’s test was used supplementary to the ANOVA test for the three groups and to the Mann–Whitney U test for the two diabetic groups. Inter-eye symmetry values presented a small but statistically significant (P=0.01, ANOVA) difference between the normal and the two diabetes groups.
There was no statistically significant difference between the GDx VCC parameters of the two diabetic groups (with and without retinopathy) according to the Mann–Whitney U test (P>0.05) (Table 2).
Multivariate analysis
Factor analysis was applied to the dataset of each group separately. For the normal group dataset (ten variables × 25 patients/eyes), R-mode factor analysis was performed, and the most significant four factors were selected. The four factors account for a total of 78.3% of the total variance (Table 3). Communalities are moderate to high (>0.4) for all variables.
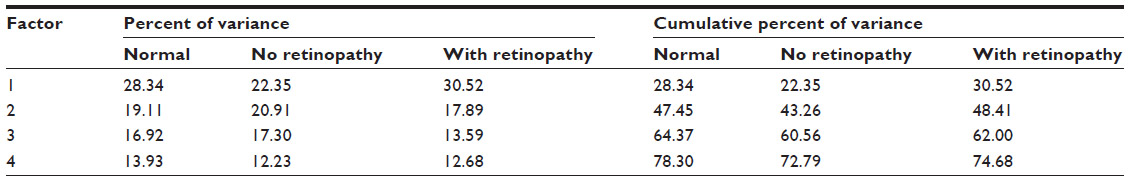 | Table 3 Percentage and cumulative percentage explained by each factor (R-mode) for normal, no retinopathy, and with retinopathy groups |
The first factor (F1) was the most significant factor and explains 28.3% of the total variance (Table 3). F1 shows high positive loading values for TSNIT average, superior and inferior average, and high negative values for NFI (Figure 1).
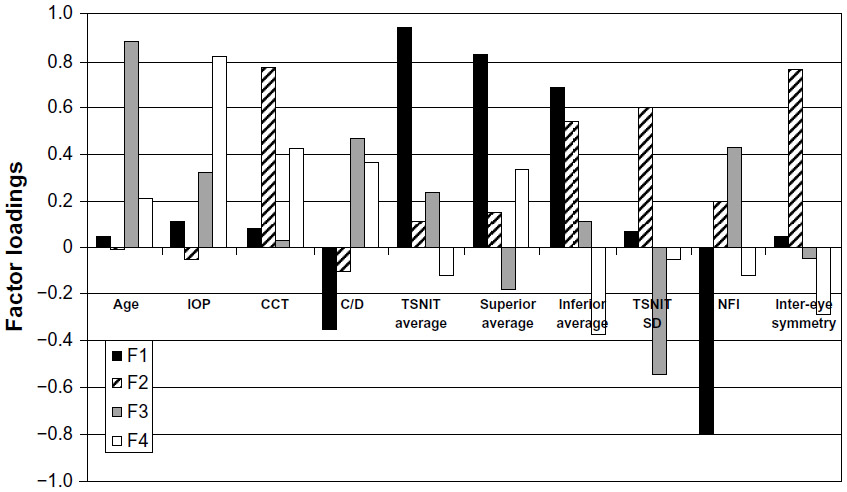 | Figure 1 Varimax rotated factor loadings for the normal group of the four factors. NFI shows negative correlation with TSNIT, superior and inferior average, as it is expected, and shows no relation with other ocular parameters, such as CCT and normal IO |
F1 is considered to represent the GDx parameters of TSNIT average, superior average, inferior average, and NFI, which seem to interrelate. NFI has a negative correlation with TSNIT, superior and inferior average, as is expected, and shows no relation with other ocular parameters, such as CCT and normal IOP.
The second factor (F2) explains the significant proportion of 19.1% of the total variance and has high positive loadings on CCT and inter-eye symmetry and moderately positive loadings on inferior average and TSNIT SD. For normal patients, according to this factor, CCT is related with inter-eye symmetry and some parameters of nerve fiber thickness.
The third factor (F3) explains 16.9% of the total variance and shows high positive loadings on age, moderately positive loadings on C/D ratio and NFI, and moderately negative loadings on TSNIT SD (Figure 1). F3 indicates that higher age and C/D ratio correlates with higher NFI measurements (higher risk for glaucoma) and lower TSNIT SD.
The fourth factor has smaller significance in the multivariate statistical analysis and was not taken into consideration for further conclusions.
R-mode factor analysis carried out on the second group (no retinopathy) dataset (12 variables × 27 patients/eyes) showed a four factor model accounts for the 72.7% of the total variance and explains the variability of almost all variables which have high communalities (>0.6), except for the years of diabetes (0.39).
The F1 explains the largest proportion (22.4%) of the total variance (Table 3). F1 shows high positive loadings on superior average and TSNIT SD, moderately positive loadings on TSNIT, and average and high negative loadings on NFI and age (Figure 2A). This factor expresses that higher age correlates with higher NFI and higher TSNIT SD. Also, F1 groups the GDx parameters which seem to interrelate in this factor.
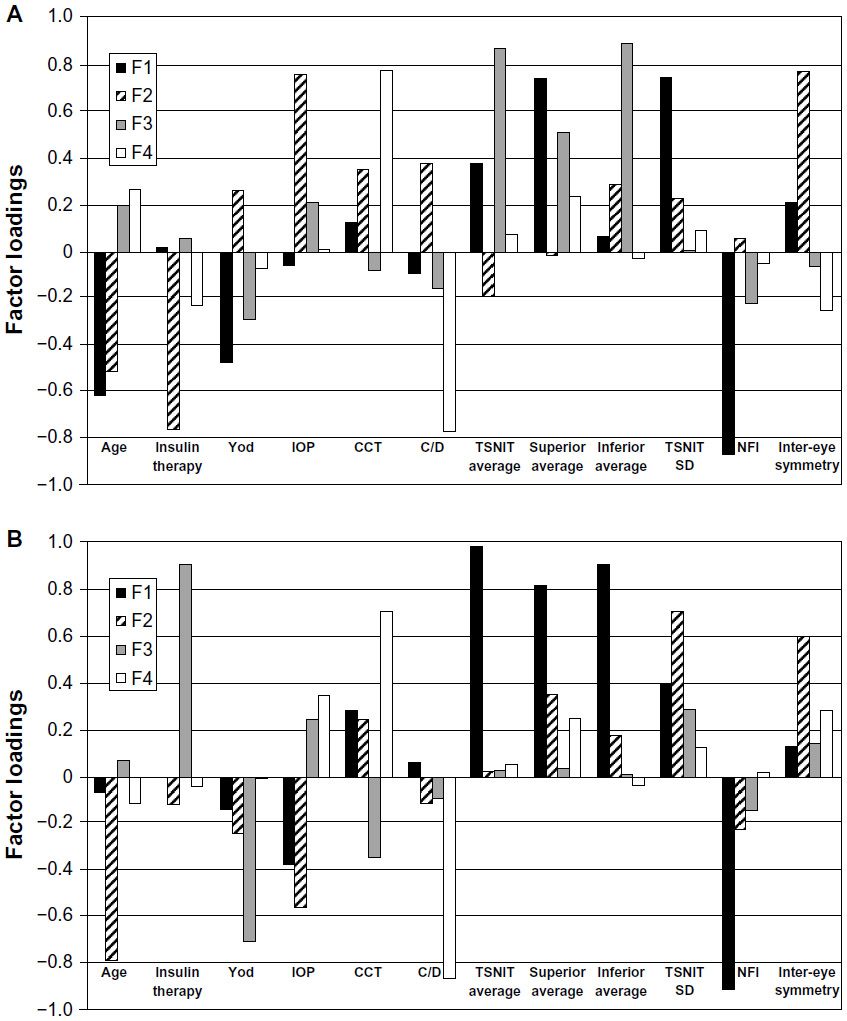 | Figure 2 Varimax rotated factor loadings for the “no retinopathy” group of the four factors (A). Varimax rotated factor loadings for the “with mild retinopathy” group of the four factors (B). The results for F1 of the mild retinopathy group are similar to F1 of the normal group analysis and resample those of the no retinopathy group. |
F2 explains a high proportion (20.9%) of the total variance and has high positive values on IOP and inter-eye symmetry as well as high negative values on insulin therapy and age. This factor demonstrates that the age parameter may also interrelate with IOP values. However, the association of the previous two mentioned parameters, insulin therapy and inter-eye symmetry, does not have a meaningful explanation.
F3 explains a significant proportion of 17.3% of the total variance, and presents high positive loading values for TSNIT, superior and inferior average, and verifies the strong correlation.
The fourth factor has small significance in the multivariate statistical analysis, and was not taken into consideration for further conclusions.
R-mode factor analysis was carried out on the dataset (12 variables × 24 patients/eyes) of the third group (diabetics with mild retinopathy). Four factors were selected and explained 74.7% of the total variance. Communalities are above 0.5 for all variables.
F1 explains the highest percentage of 30.5% of the total variance (Figure 2B) (Table 3). High positive loadings present on TSNIT average, superior average and inferior average, moderately positive loadings on TSNIT SD, and high negative loadings on NFI (Figure 2B). This factor accounts for the GDx parameters of the dataset. The results for F1 of the mild retinopathy group are similar to F1 of the normal group analysis and resample of F1 of the no retinopathy group.
F2 explains a significant proportion (17%) of the total variance and shows high positive loadings on TSNIT SD and inter-eye symmetry and high negative loadings on age and IOP.
The F3 and the fourth factor have small significance in the multivariate statistical analysis and were not taken into consideration for further conclusions.
Factor analysis that was performed on the datasets of the two diabetic groups, including HbA1c measurements, showed no significant correlation between HbA1c and the other parameters.
Discussion
Diabetic retinopathy is manifested as vascular lesions. Lesions include capillary degeneration, leading to altered blood flow, retinal ischemia, retinal hypoxia, and subsequent neovascularization as well as capillary leakage and retinal edema.2 Nevertheless, diabetes mellitus may also alter the function of nonvascular cells. There is increasing evidence that diabetic retinopathy can induce changes to the neural retina, including loss of ganglion cells, horizontal cells, amacrine cells, and photoreceptors.13
Experimental studies in diabetic rats showed evidence of retinal ganglion cell loss or damage.14 In humans, both histological and immunohistochemical studies provided evidence of loss of retinal ganglion cells.15–20
Qualitative photographic evaluation of the RNFL in diabetic patients showed evidence of thinning. The defect was associated with higher levels of retinopathy and advanced age.21 Nonetheless these qualitative methods are difficult to apply in clinical practice and to reproduce for research purposes. Therefore, the objective determination of the RNFL thickness is essential. Determination of RNFL defects using SLP, or GDx, confirmed that thinning is associated with the presence of diabetes mellitus.22–24 The above findings were confirmed with the use of optical coherence tomography.25–29 In our study, we observed thinning of RNFL using SLP. Thus, our results reinforce the outcomes of previous work in the area.
Furthermore, we demonstrated that there was a statistically significant reduction of RNFL in both diabetics without retinopathy and diabetics with mild retinopathy. In other words, we observed that RNFL thinning may possibly precede the detection of clinically visible lesions at the fundus. Besides, diabetes mellitus is characterized by obstruction and disruption of the basic membrane of small blood vessels. It has been hypothesized that the superficial capillary vessels responsible for the perfusion of the nerve fibers and optic nerve head become ischemic. This may explain why there are early disruptions in vision, such as reduction in contrast sensitivity, impaired evoked visual dynamics, and deterioration of visual fields in diabetic patients before vascular lesions are detected at their fundus.30–32
In previous studies, thinning of the RNFL was found to be more prominent in the superior retina;24,27 however, in our study the RNFL defects were more pronounced in the lower half of the retina. This finding is of great importance, as until now, it was supported that lesions of diabetic retinopathy, including microaneurysms and areas of hemorrhage, are more commonly found on the superior half of the retina.33 It is acknowledged that the blood flow per nerve fiber tissue volume is lower in the inferior retina.34 This observation may explain why the RNFL of the inferior retina is more vulnerable to the metabolic stress of diabetes.
In our research, the reduction of RNFL thickness did not differ significantly between the population of diabetics with no diabetic retinopathy and the population of diabetics with evidence of mild retinopathy. Aggravations of RNFL loss are not associated with the exacerbation of diabetic retinopathy, at least throughout its initial stages. This observation contradicts the results of other authors. Ozdek et al22 and Takahashi et al23 demonstrated that RNFL defects were related to the severity of retinopathy. This discrepancy may be the result of the possibility that pericyte deprivation,35 leading to microaneurysm formation and microhemorrhages, should not result in further ischemic damage and subsequent RNFL loss. Further research is therefore needed to clarify this issue.
Factor analysis application on ophthalmological data is a novel approach. To our knowledge, this is the first time that multivariate statistical analysis has been used to correlate medical and ocular parameters with GDx measurements. As shown by the multivariate analysis in this study, the RNFL thickness is independent of CCT, duration of diabetes, use of insulin, and the HbA1c levels. As far as the duration of disease is concerned, our follow-up of these patients may reveal whether this observation (ie, that RNFL loss is not strongly dependent on the duration of diabetes) is verified. One interesting aspect confirmed with multivariate analysis was the fact that the levels of normal IOP in our patients had a positive correlation with the (higher) age of the participants.
The results of NFI measurements were of particular interest. As anticipated, NFI was increased in both diabetic groups, even in the absence of any risk factors for glaucoma. Thus, NFI was found to be raised even when the optic nerve head was normal, without any evidence of glaucomatous changes. It is still debatable whether the presence of diabetes mellitus is an independent risk factor for glaucoma. There have been studies that support the idea that it is not a risk factor for primary open-angle glaucoma,36 and at the same time there is strong evidence that it is.37 More research is necessary to clarify this issue. However, the presence of diabetes should be seriously considered as a parameter in evaluating the results of the SLP.
RNFL thickness in diabetic patients may prove a valuable tool in the assessment and routine monitoring of retinopathy and its associated visual deficits. Nonetheless, it is still premature to advocate the routine measurement of RNFL thickness as a means of detecting early changes in diabetics. Well designed, good quality prospective longitudinal clinical trials on larger populations are therefore needed.
Disclosure
The authors report no conflicts of interest in this work.
References
Epidemiology of severe hypoglucemia in the diabetes control and complications trial. The DCCT Research Group. Am J Med. 1991;90(4):450–459. | |
Ockrim Z, Yorston D. Managing diabetic retinopathy. BMJ. 2010;341:c5400. | |
Skarf B. Retinal nerve fibre layer loss in diabetes mellitus without retinopathy. Br J Ophthalmol. 2002;86(7):709. | |
Grading diabetic retinopathy from stereoscopic color fundus photographs – an extension of the modified Airlie House classification. ETDRS report number 10. Early Treatment Diabetic Retinopathy Study Research Group. Ophthalmology. 1991;98(Suppl 5):786–806. | |
Weinreb RN, Dreher AW, Coleman A, Quigley H, Shaw B, Reiter K. Histopathologic validation of Fourier-ellipsometry measurements of retinal nerve fiber layer thickness. Arch Ophthalmol. 1990;108(4):557–560. | |
Morgan JE, Waldock A, Jeffery G, Cowey A. Retinal nerve fibre layer polarimetry: histological and clinical comparison. Br J Ophthalmol. 1998;82(6):684–690. | |
Reyment RA, Jöreskog KG. Applied Factor Analysis in the Natural Sciences. Cambridge: Cambridge University Press; 1996. | |
Cattell RB. The scree test for the number of factors. Multivariate Behav Res. 1966;1(2):245–276. | |
Kaiser HF. The application of electronic computers to factor analysis. Educ Psychol Meas. 1960;20:141–151. | |
Sharma S. Applied Multivariate Techniques. New York, NY: John Wiley and Sons; 1996. | |
Mitchell P, Hourihan F, Sandbach J, Wang JJ. The relationship between glaucoma and myopia: the Blue Mountains Eye Study. Ophthalmology. 1999;106(10):2010–2015. | |
Balazsi AG, Rootman J, Drance SM, Schulzer M, Douglas GR. The effect of age on the nerve fiber population of the human optic nerve. Am J Ophthalmol. 1984;97(6):760–766. | |
Kern TS, Barber AJ. Retinal ganglion cells in diabetes. J Physiol. 2008;586(Pt 18):4401–4408. | |
Abu-El-Asrar AM, Dralands L, Missotten L, Geboes K. Expression of antiapoptotic and proapoptotic molecules in diabetic retinas. Eye (Lond). 2007;21(2):238–245. | |
Abu-El-Asrar AM, Dralands L, Missotten L, Al-Jadaan IA, Geboes K. Expression of apoptosis markers in the retinas of human subjects with diabetes. Invest Ophthalmol Vis Sci. 2004;45(8):2760–2766. | |
Barber AJ, Lieth E, Khin SA, Antonetti DA, Buchanan AG, Gardner TW. Neural apoptosis in the retina during experimental and human diabetes. Early onset and effect of insulin. J Clin Invest. 1998;102(4):783–791. | |
Bloodworth JM Jr. Diabetic retinopathy. Diabetes. 1962;11:1–22. | |
Kerrigan LA, Zack DJ, Quigley HA, Smith SD, Pease ME. TUNEL-positive ganglion cells in human primary open-angle glaucoma. Arch Ophthalmol. 1997;115(8):1031–1035. | |
Oshitari T, Yamamoto S, Hata N, Roy S. Mitochondria- and caspase-dependent cell death pathway involved in neuronal degeneration in diabetic retinopathy. Br J Ophthalmol. 2008;92(4):552–556. | |
Wolter JR. Diabetic retinopathy. Am J Ophthalmol. 1961;51:1123–1141. | |
Chihara E, Matsuoka T, Ogura Y, Matsumura M. Retinal nerve fiber layer defect as an early manifestation of diabetic retinopathy. Ophthalmology. 1993;100(8):1147–1151. | |
Ozdek S, Lonneville YH, Onol M, Yetkin I, Hasanreisoğlu BB. Assessment of nerve fiber layer in diabetic patients with scanning laser polarimetry. Eye (Lond). 2002;16(6):761–765. | |
Takahashi T, Goto T, Shogi T, Tanito M, Park M, Chihara E. Diabetes-associated retinal nerve fiber damage evaluated with scanning laser polarimetry. Am J Ophthalmol. 2006;142(1):88–94. | |
Lopes de Faria JM, Russ H, Costa VP. Retinal nerve fiber layer loss in patients with type 1 diabetes mellitus without retinopathy. Br J Ophthalmol. 2002;86(7):725–728. | |
Chihara E, Zhang S. [Analysis of diabetic optic neuropathy with a topographic laser scanning system.] Nihon Ganka Gakkai Zasshi. 1998;102(7):431–435. Japanese [with English abstract]. | |
Oshitari T, Hanawa K, Adachi-Usami E. Changes of macular and RNFL thicknesses measured by Stratus OCT in patients with early stage diabetes. Eye (Lond). 2009;23(4):884–889. | |
Sugimoto M, Sasoh M, Ido M, Wakitani Y, Takahashi C, Uji Y. Detection of early diabetic change with optical coherence tomography in type 2 diabetes mellitus patients without retinopathy. Ophthalmologica. 2005;19(6):379–385. | |
Shahidi AM, Sampson GP, Pritchard N, et al. Retinal nerve fibre layer thinning associated with diabetic peripheral neuropathy. Diabet Med. 2012;29(7):106–111. | |
Van Dijk HW, Verbraak FD, Kok PH, et al. Early neurodegeneration in the retina of type 2 diabetic patients. Invest Ophthalmol Vis Sci. 2012;53(6):2715–2719. | |
Várkonyi TT, Petõ T, Dégi R, et al. Impairment of visual evoked potentials: an early central manifestation of diabetic neuropathy? Diabetes Care. 2002;25(9):1661–1662. | |
Greenstein VC, Shapiro A, Zaidi Q, Hood DC. Psychophysical evidence for post-receptoral sensitivity loss in diabetes. Invest Ophthalmol Vis Sci. 1992;33(10):2781–2790. | |
Sokol S, Moskowitz A, Skarf B, Evans R, Molitch M, Senior B. Contrast sensitivity in diabetics with and without background retinopathy. Arch Ophthalmol. 1985;103(1):51–54. | |
Kern TS, Engerman RL. Vascular lesion in diabetes is distributed non-uniformly within the retina. Exp Eye Res. 1995;60(5):545–549. | |
Harris A, Ishii Y, Chung HS, et al. Blood flow per unit retinal nerve fibre tissue volume is lower in the human inferior retina. Br J Ophthalmol. 2003;87(2):184–188. | |
Tilton RG, Hoffman PL, Kilo C, Williamson JR. Pericyte degeneration and basement membrane thickening in skeletal muscle capillaries of human diabetics. Diabetes. 1981;30(4):326–334. | |
Tan GS, Wong TY, Fong CW, Aung T; Singapore Malay Eye Study. Diabetes, metabolic abnormalities, and glaucoma. Arch Ophthalmol. 2009;127(10):1354–1361. | |
Wong VH, Bui BV, Vingrys AJ. Clinical and experimental links between diabetes and glaucoma. Clin Exp Optom. 2011;94(1):4–23. |
 © 2014 The Author(s). This work is published and licensed by Dove Medical Press Limited. The
full terms of this license are available at https://www.dovepress.com/terms.php
and incorporate the Creative Commons Attribution
- Non Commercial (unported, v3.0) License.
By accessing the work you hereby accept the Terms. Non-commercial uses of the work are permitted
without any further permission from Dove Medical Press Limited, provided the work is properly
attributed. For permission for commercial use of this work, please see paragraphs 4.2 and 5 of our Terms.
© 2014 The Author(s). This work is published and licensed by Dove Medical Press Limited. The
full terms of this license are available at https://www.dovepress.com/terms.php
and incorporate the Creative Commons Attribution
- Non Commercial (unported, v3.0) License.
By accessing the work you hereby accept the Terms. Non-commercial uses of the work are permitted
without any further permission from Dove Medical Press Limited, provided the work is properly
attributed. For permission for commercial use of this work, please see paragraphs 4.2 and 5 of our Terms.