Back to Journals » Cancer Management and Research » Volume 14
Comparison of MRI/US Fusion Targeted Biopsy and Systematic Biopsy in Biopsy-Naïve Prostate Patients with Elevated Prostate-Specific Antigen: A Diagnostic Study
Authors Huang C, Huang Y, Pu J, Xi Q, Wei X, Qiu F, Wang X, Zhao X, Guo L, Hou J
Received 22 November 2021
Accepted for publication 14 March 2022
Published 8 April 2022 Volume 2022:14 Pages 1395—1407
DOI https://doi.org/10.2147/CMAR.S350701
Checked for plagiarism Yes
Review by Single anonymous peer review
Peer reviewer comments 2
Editor who approved publication: Dr Kenan Onel
Chen Huang,1,* Yuhua Huang,1,* Jinxian Pu,1 Qilin Xi,1 Xuedong Wei,1 Feng Qiu,1 Ximing Wang,2 Xiaojun Zhao,1 Linchuan Guo,3 Jianquan Hou1
1Department of Urology, The First Affiliated Hospital of Soochow University, Suzhou, 215006, People’s Republic of China; 2Department of Radiology, The First Affiliated Hospital of Soochow University, Suzhou, 215006, People’s Republic of China; 3Department of Pathology, The First Affiliated Hospital of Soochow University, Suzhou, 215006, People’s Republic of China
*These authors contributed equally to this work
Correspondence: Jianquan Hou, Department of Urology, The First Affiliated Hospital of Soochow University, No. 899 Pinghai Road, Suzhou, 215006, People’s Republic of China, Tel/Fax +86 512-67972184, Email [email protected]
Purpose: This study aimed to compare the detection rate of prostate cancer (PCa) between targeted biopsy and systematic biopsy.
Patients and Methods: A total of 671 patients who underwent both targeted biopsy and systematic biopsy were included in this study. The stratified analysis was conducted based on Prostate Imaging Reporting and Data System (PIRADS) scores, region of interest load (ROI-load).
Results: There was no statistical difference in the detection rate of PCa patients between systematic biopsy and targeted biopsy (44.41% vs 45.6%, P> 0.05), while the detection rate of targeted biopsy in clinically significant PCa (csPCa) patients was slightly higher than that of systematic biopsy (40.83% vs 38.15%, P=0.033). Stratified analysis indicated that targeted biopsy was more advantageous in csPCa patients with PIRADS score ≥ 4 and ROI-load > 5%. The comparison of diagnostic sensitivity of systematic biopsy and targeted biopsy demonstrated that targeted biopsy was more sensitive than systematic biopsy to diagnose PCa (Z=2.110, P=0.035) at ROI-load ≤ 5%. In addition, ROI-load may be a better targeted biopsy indicator than ROI diameter for the diagnosis of PCa (Z=2.168, P=0.030).
Conclusion: MRI/US fusion targeted biopsy may be more suitable for PCa detection than systematic biopsy in patients with low ROI-load.
Keywords: multiparametric-MRI, targeted biopsy, prostate cancer, detection
Introduction
Prostate cancer (PCa) has become the second most common cancer and the fifth leading cause of cancer mortality in men worldwide.1 It was estimated that approximately 1.4 million new PCa patients and 375,000 related deaths occurred worldwide in 2020.1 The highest incidences were occurred in Northern and Western Europe, Australia, and Northern America, while the lowest incidence was reported in Asia.1 However, the incidence of PCa in China has been on the rise in recent years, and it is the second most common cancer among Chinese men.2 The timely and accurate diagnosis of PCa has important clinical significance for the treatment and prognosis of the disease.
The diagnosis of PCa relies on prostate biopsy,3 and the transrectal ultrasonography-guided 12-cores systematic prostate biopsy is widely used worldwide.4 However, systematic biopsy may be associated with under-diagnosis of clinically significant (higher-grade) prostate cancers and over-diagnosis of clinically insignificant (low-grade) cancers.5 Multiparametric magnetic resonance imaging (mpMRI) has been involved in the diagnosis of PCa,6,7 and is increasingly used to locate suspicious lesions before biopsy.8 Several studies have shown that the implementation of mpMRI has improved the ability to detect and rule out clinically significant prostate cancer (csPCa).5,9,10 In addition, mpMRI could be used to avoid excessive biopsy when the results were negative,5 while positive results could be used to identify abnormal areas in the prostate during the biopsy.7,11 Some studies have reported the comparison of targeted biopsy and systematic biopsy in the diagnosis of PCa.6,12,13 A multicenter randomized controlled trial conducted by Kasivisvanathan et al indicated that targeted biopsy had advantages over systematic biopsy in the diagnosis of PCa.6 Rouvière et al found that no difference was observed between systematic and targeted biopsy in detecting csPCa.13 However, whether mpMRI targeted biopsy can increase the detection rate of csPCa and avoid the need for systematic biopsy in first-biopsy patients remains controversial. In addition, there were few studies on the best indicators for targeted biopsy.
Here, we aimed to compare the detection rate of targeted biopsy and systematic biopsy in PCa and determine the better indicator of targeted biopsy in the diagnosis of csPCa.
Methods
Study Design and Populations
This study was a retrospective study. A total of 861 patients with an increased level of prostate specific antigen (PAS) or abnormal digital rectal examination (DRE) diagnosis were offered prebiopsy mpMRI from the First Affiliated Hospital of Soochow University between June 2016 and June 2020. After excluded 48 patients with prior biopsy, 67 patients with PSA >100ng/mL, 23 patients disable to undergo MRI examination, and 52 patients with Prostate Imaging Reporting and Data System version 2 (PIRADS) scores of 1, finally, 671 patients were included in this study. All included patients were received transperineal real-time MRI/US fusion targeted biopsy and systematic biopsy. This study was approved by the Institutional Review Board of First Affiliated Hospital of Soochow University (approval number: No.2021 (237)), and conducted in accordance with the Declaration of Helsinki. All participants provided informed consent.
Procedures
MRI Acquisition
All patients were scanned with a 3T MRI scanner (MAGNETOM Skyra; Siemens Healthineers, Erlangen, Germany). The standard spine array coil and 18-channel body array coil were used for signal reception. The obtained images included transverse T1 weighted turbo spin echo (TSE) images and transverse, coronal and sagittal T2 weighted TSE images of the prostate and seminal vesicles. DWI was obtained to calculate an apparent diffusion coefficient using a 2D echo planar imaging sequence with multiple b value acquisitions (0, 100, 800, 1000 and 1500 s/mm2), and applied diffusion-sensitizing along the X, Y and Z axes gradient. DCE was obtained by 3D T1 weighted gradient echo volumetric interpolated breath hold examination, and was on the same plane as the 3D T2W sequence. An intravenous contrast agent (Medtron AG, Saarbruecken, Germany) was administered at 0.1 mmol/kg body weight and 2.5 mL/sec injection rate. Perfusion curves were generated on the Siemens workstation with MR Tissue 4D commercial software (Syngo. via VA20B; Siemens Healthineers).
Prostate Biopsy and Pathology Analysis
Transperineal prostate targeted biopsy and systematic biopsy were performed on all patients. To perform a targeted biopsy, DICOM data of mpMRI images, including T2WI, DWI, ADC and DCE (Figure 1A–D), were imported into the Real-time Virtual Sonogra (RVS) ultrasonography host (Preirus, Hitachi, Japan), and the target lesion was marked as a region of interest (ROI). Through RVS, the MRI images’ marked ROI was displayed in real time on the ultrasonography images. The Ultrasonography and MRI images were matched by sagittal and axial anatomical markers, such as urethral orifices and small prostate cysts (Figure 1E). Following these steps, the urologist performed the targeted biopsy and each ROI was executed on 2 cores biopsy (Figure 1F). After the completion of the targeted biopsy, the RVS was turned off and the same urologist continued performing systematic biopsy (12-core) (Figure 1G). Each specimen was fixed in 10% formalin and sent for pathological analysis.
 |
Figure 1 Patients with region of interest (ROI) in left-middle posterior transitional zone. (A) T2WI sequence; (B) DWI sequence; (C) ADC sequence; (D) DCE sequence; (E) MRI and ultrasonography fusion imaging by RVS; (F) perform targeted biopsy; (G) 12-cores systematic biopsy template. |
Data Collection and Definition
Data of patients were recorded including age, abnormal DRE, total pre-biopsy PSA (tPSA, ng/mL), free PSA (fPSA, ng/mL), prostate volume on mpMRI (mL, volume=0.52×Length×High×Width), PSA density (ng/ml2, PSA density=PSA/prostate volume on mpMRI), PIRADS score (2, 3, 4, 5), International Society of Urological Pathology (ISUP) grade group (benign, GG1, GG2, GG3, GG4, GG5), ROI volume [mL, ROI volume=4/3×π×((ROI largest diameter)/2)^3], ROI-load (ROI-load=ROI volume/prostate volume×100%), ROI location [diffuse, base, middle, apex; peripheral zone (PZ), transitional zone (TZ), central zone (CZ)]. CsPCa was defined as a single biopsy core with a Gleason score of 3+4 (Gleason sum of 7) or greater (ISUP GG≥2).6
Statistical Analysis
Normally distributed measurement data were described as mean ± standard deviation (mean ± SD) and the independent sample t-test was used for comparison between groups; non-normal data were expressed as a median and interquartile range [M (Q1, Q3)] and the Mann–Whitney U rank-sum test was used for comparison between groups. Count data were described by the number and proportion [n (%)] and the comparison between groups was performed by the chi-square test or Fisher’s exact probability method. The comparison of detection rate was conducted by the McNemar test. Stratified analysis was performed based on PIRADS and ROI-load. The Delong test was utilized to compare the sensitivity of the different diagnostic methods.
All statistical tests were the two-sided test and performed by R software version 4.0.2 (R foundation for Statistical Computing, Vienna, Austria), SAS software version 9.4 (SAS Institute Inc., Cary, NC, USA), and SPSS software version 24.0 (IBM, Armonk, NY, USA). P<0.05 was considered to be statistically significant.
Results
Baseline Characteristics of Patients
A total of 671 patients were included in this study (Figure 2), with the mean age was 67.99±8.67 years. There were 334 (46.80%) patients diagnosed with PCa and 286 (42.62%) patients with csPCa. The number of patients diagnosed with PCa and csPCa by systematic biopsy was 298 (44.41%) and 256 (38.15%), while the number of patients diagnosed with PCa and csPCa using targeted biopsy was 306 (45.60%) and 274 (40.83%). The number of PCa and csPCa patients with overlapping systematic and targeted biopsies were 270 (40.24%) and 249 (37.11%), respectively. The median tPSA, fPSA/tPSA, and PSA density of patients were 10.70 (6.85, 18.95) ng/mL, 0.13 (0.09, 0.18), 0.25 (0.15, 0.48) ng/ml2, respectively. The median prostate volume of patients was 41.33 (29.52, 60.76) mL, and the proportion in volume of 25%, 25–75%, and >75% were 24.89% (167 cases), 50.22% (337 cases), and 24.89% (167 cases), respectively. The proportion of patients with PIRADS score of 2, 3, 4, and 5 were 21.76% (146 cases), 25.04% (168 cases), 26.23% (176 cases), and 26.97% (181 cases), respectively. In the terms of ISUP GG, 337 (50.22%) cases were benign, 48 (7.15%) cases were GG1, 100 (14.90%) were GG2, 88 (13.11%) cases were GG3, 46 (6.86%) cases were GG4, and 52 (7.75%) cases were GG5 (Table 1).
 |
Table 1 Clinical Parameters and Biopsy Results |
 |
Figure 2 Flowchart for study inclusion among men with clinical suspicion for prostate cancer. Abbreviations: PSA, prostate specific antigen; DRE, digital rectal examination; MRI, multiparameter magnetic resonance imaging; PIRADS, prostate imaging reporting and data system; US, ultrasonography. |
In patients with PIRADS score ≥ 4 (357 cases), the median ROI volume and ROI-load were 1.77 (0.70, 6.37) mL and 5.25% (1.90, 17.06), respectively. A total of 58 (16.25%) patients developed diffuse prostate, and the number of patients with ROI location of base, middle, and apex was 33 (9.24%), 121 (33.89%), and 145 (40.62%), respectively. When the ROI location was classified by histologic zone, the number of patients in PZ and TZ+CZ was 190 (53.22%) and 109 (30.53%) (Table 2).
 |
Table 2 The ROI Characteristics of Patients with PIRADS≥4 |
Consistency Analysis of Systematic Biopsy and Targeted Biopsy on ISUP Grade
The results of the systematic biopsy showed that the number of patients with ISUP grade of benign, GG1, GG2, GG3, GG4, and GG5 were 373, 37, 86, 76, 32, and 67, respectively, and these results were highly consistent with the total biopsy results in the ISUP grade (kappa=0.891, P<0.001; Table 3). In the targeted biopsy, the number of patients with ISUP grades of benign, GG1, GG2, GG3, GG4, and GG5 were 365, 32, 92, 77, 36, and 69, respectively. The consistency analysis indicated that targeted biopsy was also highly consistent with the total biopsy results (kappa=0.932, P<0.001; Table 4).
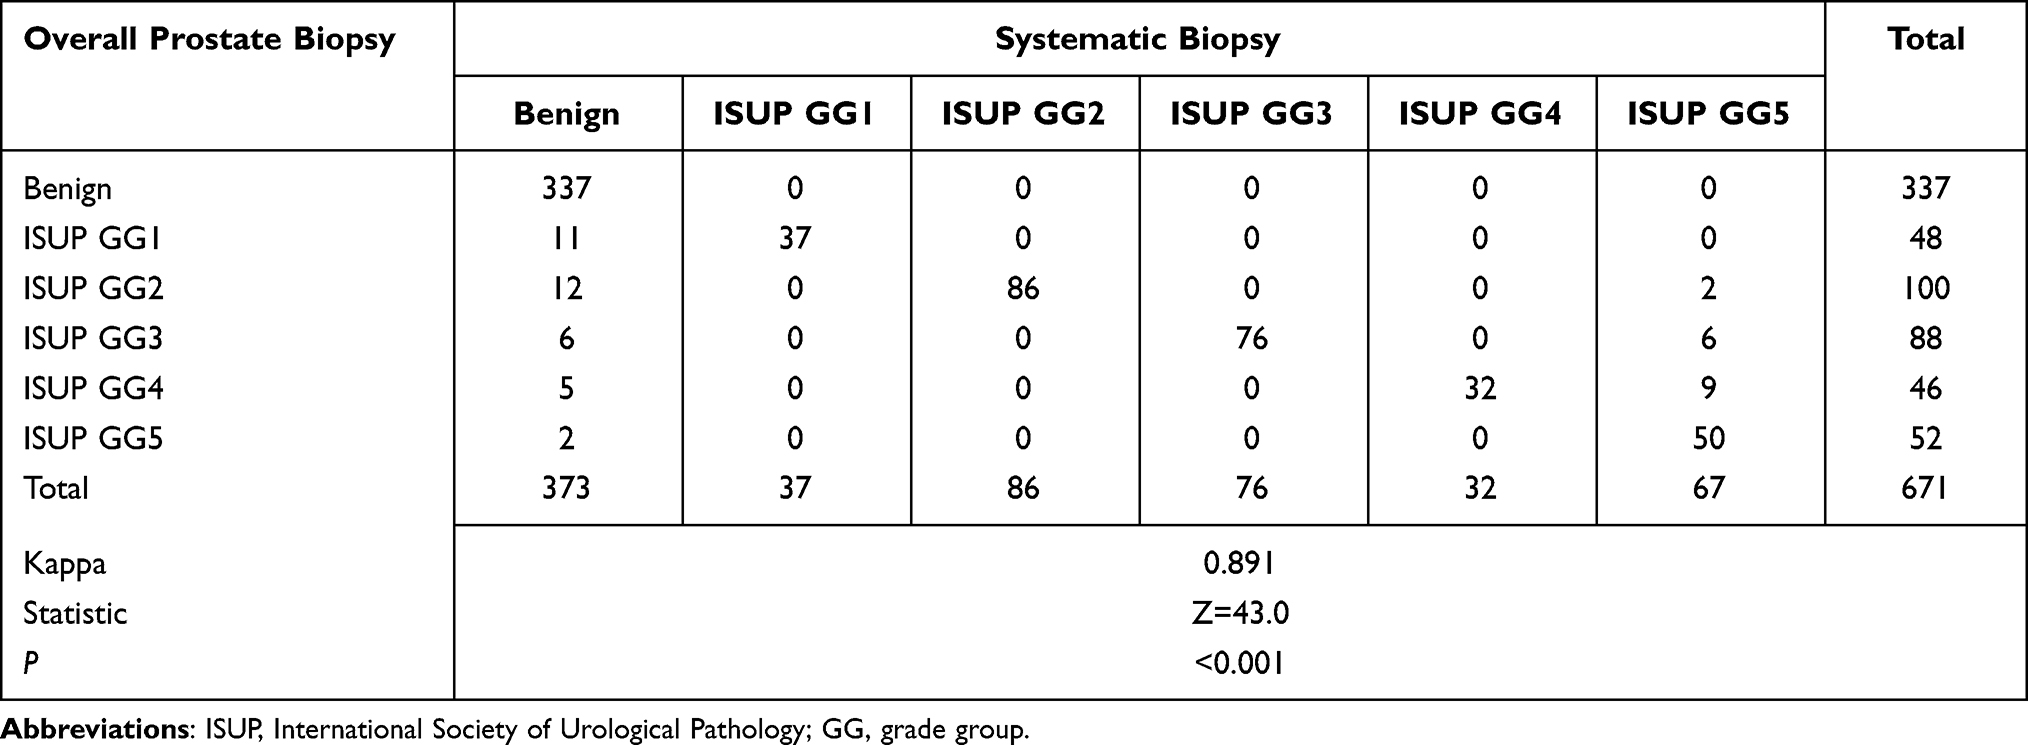 |
Table 3 Distribution of ISUP Grade Group on Systematic Biopsy and Overall Prostate Biopsy |
 |
Table 4 Distribution of ISUP Grade Group on Targeted Biopsy and Overall Prostate Biopsy |
Comparison of ROI-Load and ROI Diameter in Predicting PCa
The difference in prostate volume makes it unreliable to rely solely on the size of the ROI to determine the ease of PCa detection. Therefore, a new indicator ROI-load was used in patients with a PIRADS score ≥ 4. The logistic regression analysis was used to compare the predictions of ROI-load and ROI diameter on PCa and csPCa.
The receiver operator characteristic (ROC) curves of ROI-load and ROI diameter predicted PCa and csPCa were shown in Figure 3. In terms of predicting PCa, the area under the curve (AUC) of ROI-load and ROI diameter was 0.682 (95% CI, 0.631–0.730) and 0.640 (95% CI, 0.588–0.690), respectively. The cutoff value of ROI-load and ROI diameter were >3.01 and >12. According to the results of Delong test, the ROI-load had a better ability to predict PCa than ROI diameter (Z=2.168, P=0.030). The AUC of ROI-load and ROI diameter in predicting csPCa was 0.721 (95% CI, 0.671–0.767) and 0.693 (95% CI, 0.642–0.740), with the cutoff value of >3.07 and >12, respectively. The results of the Delong test indicated that the ROI-load also had a better ability to predict csPCa compared with ROI diameter (Z=1.970, P=0.049). More detailed comparisons were shown in Table 5.
 |
Table 5 The Predictive Performance of ROI-Load and ROI Diameter for Pca and csPCa |
 |
Figure 3 Receiver operating characteristic (ROC) curves and area under the curves (AUC) of ROI-load and ROI diameter for the prediction of prostate cancer (PCa) and clinically significant prostate cancer (csPCa). (A) ROC curves of PCa; (B) ROC curves of csPCa. Abbreviation: ROI, region of interest. |
Comparison the Detection Rate of Systematic Biopsy and Targeted Biopsy
Among the 334 (49.78%) patients diagnosed with PCa, 298 (44.41%) patients were diagnosed by systematic biopsy and 306 (45.60%) patients were diagnosed by targeted biopsy. There were statistical differences in the detection rate between systematic biopsy and total test results, targeted biopsy, and total test results (all P<0.001), but no statistical difference was observed between systematic biopsy and targeted biopsy (P>0.05; Figure 4). A total of 286 (42.62%) patients were diagnosed with csPCa. The number of csPCa patients diagnosed by systematic biopsy and targeted biopsy was 256 (38.15%) and 274 (40.83%), respectively. There were also statistical differences in the detection rate between systematic biopsy and total test results, targeted biopsy and total test results (all P<0.001), and the detection rate of targeted biopsy was higher than that of systematic biopsy (P=0.033; Figure 4). Table 6 shows the sensitivity and specificity of systematic and targeted biopsy for the diagnosis of PCa and csPCa. The sensitivity of systematic and targeted biopsies for the diagnosis of csPCa were 0.913 (95% CI, 0.880–0.946) and 0.958 (95% CI, 0.935–0.981), respectively. The results of the sensitivity comparison indicated that the sensitivity of systematic biopsy and targeted biopsy was not statistically different for diagnosis PCa (Z=1.055, P=0.292), while a statistical difference was observed for diagnosis csPCa (Z=2.197, P=0.028).
 |
Table 6 The Sensitivity and Specificity of Systematic and Targeted Biopsy for the Diagnosis of PCa and csPCa |
 |
Figure 4 Overall PCa and csPCa detection rate of targeted biopsy (TB) and systematic biopsy (SB). *0.01≤P<0.05; ***P<0.001. |
Stratified Based on PIRADS
The number of PCa patients with PIRADS scores <4 and ≥4 was 28 (8.92%) and 306 (85.71%), respectively. In PCa patients with PIRADS score <4, no statistical difference was observed between systematic biopsy and total test results (P>0.05). There were statistical differences in PCa patients with PIRADS score ≥4 between systematic biopsy, targeted biopsy and total test results (P<0.05; Figure 5A). In csPCa patients, the number of patients with PIRADS scores <4 and ≥4 was 17 (5.41%) and 269 (75.35%), respectively. The comparison of the detection rate in csPCa patients using systematic biopsy and targeted biopsy was also consistent with that of PCa patients (Figure 5B).
 |
Figure 5 Detection rate of TB and SB based on prostate imaging reporting and data system (PIRADS) score. (A) PCa detection rates; (B) csPCa detection rates. *0.01≤P<0.05; **0.001≤P<0.01; ***P<0.001. |
Stratified Based on ROI-Load
The number of PCa patients with ROI-load ≤ 5% and > 5% were 136 (78.61%) and 114 (90.48%). In PCa patients with ROI-load ≤ 5%, there were statistical differences between systematic biopsy and total test results, targeted biopsy and total test results (P<0.001). There was no difference between targeted biopsy and total test results in PCa patients with ROI-load > 5% (P>0.05; Figure 6A). In csPCa patients, the number of patients with ROI-load ≤ 5% and > 5% were 110 (63.58%) and 103 (81.75%). No statistical difference was observed between targeted biopsy and total test results (P>0.05; Figure 6B).
 |
Figure 6 Detection rate of TB and SB based on based on region of interest load (ROI-load). (A) PCa detection rates; (B) csPCa detection rates. *0.01≤P<0.05; **0.001≤P<0.01; ***P<0.001. |
Table 7 demonstrates the sensitivity of systematic and targeted biopsies for the diagnosis of PCa and csPCa at different ROI-loads. The sensitivity of systematic and targeted biopsies for the diagnosis of PCa in patients with ROI-load ≤ 5% were 0.816 (95% CI, 0.751–0.881) and 0.904 (95% CI, 0.854–0.954), respectively. Among patients with ROI-load > 5%, the sensitivity of systematic and targeted biopsies for the diagnosis of PCa were 0.947 (95% CI, 0.906–0.988) and 0.974 (95% CI, 0.943–0.999), respectively. Table 8 displays the sensitivity comparison between systematic biopsy and targeted biopsy at different ROI-loads. The results indicated that targeted biopsy was more sensitive for diagnosing PCa (Z=2.110, P=0.035) and csPCa (Z=1.981, P=0.048) than systematic biopsy at ROI-load ≤ 5%. Furthermore, the sensitivity of targeted biopsy for the diagnosis of PCa with ROI-load > 5% was significantly higher than that of overall targeted biopsy (Z=2.720, P=0.007).
 |
Table 7 Sensitivity of Systematic and Targeted Biopsy for the Diagnosis of PCa and csPCa at Different ROI-Loads |
 |
Table 8 Comparison of Sensitivity Between Systematic Biopsy and Targeted Biopsy at Different ROI-Loads |
Discussion
The ideal detection method for PCa should be minimally invasive, less side effects, high recognition rate, and minimize the recognition of clinically meaningless cancers to prevent overtreatment.6 In this study, we compared the detection rate between systematic biopsy and targeted biopsy. The results showed that the detection rate of PCa patients using systematic biopsy and targeted biopsy was not statistically significant, while the detection rate of targeted biopsy was higher than that of systematic biopsy in csPCa patients. ROI-load may be a better indicator for targeted biopsy than ROI diameter. The stratified analysis demonstrated that the detection rate of targeted biopsy was closer to the total detection rate than that of systematic biopsy in csPCa patients with PIRADS score ≥ 4 and ROI-load > 5%. Targeted biopsy was more sensitive for diagnosing PCa and csPCa than systematic biopsy at ROI-load ≤ 5%. In addition, the sensitivity of targeted biopsy for the diagnosis of PCa with ROI-load > 5% was significantly higher than that of overall targeted biopsy.
Whether mpMRI can increase the detection of csPCa and avoid the need for systematic biopsy in patients with the first biopsy remains controversial. Kasivisvanathan et al indicated that the detection of mpMRI targeted biopsy was higher than that of systematic biopsy,6 which supported our results. Leest et al also found that MRI-guided biopsy may prevent half of the men from undergoing a biopsy without affecting the detection of harmful diseases compared to systematic biopsy.14 However, Rouviere et al displayed that although mpMRI targeted biopsy can improve the detection of csPCa, there was no difference between systematic biopsy and targeted biopsy, and targeted biopsy cannot avoid the need for systematic biopsy.13 The controversy of targeted biopsy and systematic biopsy in the diagnosis of csPCa may depend on more research and meta-analysis in the future.
Evidence suggested that PIRADS ≥ 4 was associated with the high specificity and negative predictive value of csPCa, while PIRADS ≤ 3 was only related to 10% of csPCa.15–17 Our results found that the detection rate of csPCa patients with PIRADS ≥ 4 was higher than that of PIRADS < 4 (75.35% vs 5.41%). In addition, PCa and csPCa patients with PIRADS ≥ 4 had a higher detection rate in targeted biopsy than in systematic biopsy. However, systematic biopsy was more conducive to the detection of PCa and csPCa patients with PIRADS < 4, and this result was also consistent with the study by Fujii et.al.18 The main reasons for these results may be related to mpMRI, which has previously been shown to help detect higher-grade PCa, because diffusion-weighted imaging is a surrogate for tissue density and has been shown to be correlated with higher-grade cancer.19 The mpMRI targeted biopsy can accurately detect high PIRADS-based ROIs discovered by MRI, while it cannot improve the detection rate for the atypical ROIs with a PIRADS 2 or 3.
The difference in prostate volume makes it unreliable to rely solely on the size of the ROI to determine the ease of PCa detection.20–22 We have introduced a new indicator ROI-load, and our results showed that ROI-load was a better indicator for PCa and csPCa patient biopsy than ROI-diameter. In addition, the detection rate of targeted biopsy in PCa and csPCa patients with ROI-load > 5% was closer to the total diagnosis rate than that of systematic biopsy. Comparison of the sensitivity of systematic and targeted biopsies for the diagnosis of PCa and csPCa at different ROI-loads indicated that targeted biopsy was more sensitive than systematic biopsy for the diagnosis of PCa and csPCa at ROI-load ≤ 5%, while no statistical difference was observed in the sensitivity between targeted and systematic biopsies in patients with ROI-load > 5%. In clinical practice, we found that patients with a small ROI-load were less likely to puncture the lesion with only a systematic biopsy, and the current study also confirmed this phenomenon. These results suggest that the introduction of ROI-load indicators into targeted biopsy in clinical practice may improve the diagnostic rate, especially for patients with small ROI-load. Since the ROI-load cutoff value of 5% was determined based on the median ROI-load of the patients in the current study, further studies may require multicenter large sample data to determine a more precise ROI-load cutoff value.
This study also has some limitations. First, our study was a single-center retrospective study, and further multi-center prospective studies are needed. Second, the fusion targeted biopsy relies on the interpretation of prostate mpMRI. The same radiologist may have misjudged the PIRADS at different times, and the same urologist’s biopsy technique may improve over time. Third, the definition of csPCa may have not included all clinically significant diseases because ISUP GG1 with high tumor volume load may be significant and IUSP GG2 with low tumor volume load may be insignificant.
Conclusions
The detection rate of systematic biopsy and targeted biopsy was compared. The detection rate of targeted biopsy in csPCa patients was slightly higher than that of systematic biopsy. ROI-load may be a better new indicator for targeted biopsy than ROI diameter. For patients with small ROI-load and low diagnostic sensitivity of systematic biopsy, ROI-load combined with targeted biopsy may achieve a better diagnostic rate. The comparison of targeted biopsy and systematic biopsy in the diagnosis of PCa may depend on multi-center prospective studies and meta-analyses in the future.
Ethics Approval Statement
This study was approved by the Institutional Review Board of First Affiliated Hospital of Soochow University (approval number: No.2021 (237)), and all participants provided informed consent.
Author Contributions
All authors made a significant contribution to the work reported, whether that is in the conception, study design, execution, acquisition of data, analysis and interpretation, or in all these areas; took part in drafting, revising or critically reviewing the article; gave final approval of the version to be published; have agreed on the journal to which the article has been submitted; and agree to be accountable for all aspects of the work. These authors contributed equally to this study and should be considered co-first authors: Chen Huang and Yuhua Huang.
Funding
This work was supported by two grants from the Social Development Programs of Science and Technology Commission Foundation of Jiangsu Province of China (No. BE2020654 and No.BE2020655) and a grant from the General Program of Jiangsu Health Commission (No. H2019040) and a grant from National Key R&D Program of China (No.2017YFC0114303). We thank all colleagues for their support during the data collection and the preparation of this manuscript.
Disclosure
The authors report no conflicts of interest in this work.
References
1. Sung H, Ferlay J, Siegel RL, et al. Global cancer statistics 2020: GLOBOCAN estimates of incidence and mortality worldwide for 36 cancers in 185 countries. CA Cancer J Clin. 2021;71(3):209–249. doi:10.3322/caac.21660
2. Pang C, Guan Y, Li H, Chen W, Zhu G. Urologic cancer in China. Jpn J Clin Oncol. 2016;46(6):497–501. doi:10.1093/jjco/hyw034
3. Taira AV, Merrick GS, Galbreath RW, et al. Performance of transperineal template-guided mapping biopsy in detecting prostate cancer in the initial and repeat biopsy setting. Prostate Cancer Prostatic Dis. 2010;13(1):71–77. doi:10.1038/pcan.2009.42
4. Cooperberg MR, Broering JM, Kantoff PW, Carroll PR. Contemporary trends in low risk prostate cancer: risk assessment and treatment. J Urol. 2007;178(3S):S14–S19. doi:10.1016/j.juro.2007.03.135
5. Ahmed HU, El-Shater Bosaily A, Brown LC, et al. Diagnostic accuracy of multi-parametric MRI and TRUS biopsy in prostate cancer (PROMIS): a paired validating confirmatory study. Lancet. 2017;389(10071):815–822. doi:10.1016/S0140-6736(16)32401-1
6. Kasivisvanathan V, Rannikko AS, Borghi M, et al. MRI-targeted or standard biopsy for prostate-cancer diagnosis. N Engl J Med. 2018;378(378):1767–1777. doi:10.1056/NEJMoa1801993
7. Moore CM, Kasivisvanathan V, Eggener S, et al. Standards of reporting for MRI-targeted biopsy studies (START) of the prostate: recommendations from an International Working Group. Eur Urol. 2013;64(4):544–552. doi:10.1016/j.eururo.2013.03.030
8. Schoots IG, Roobol MJ, Nieboer D, Bangma CH, Steyerberg EW, Hunink MG. Magnetic resonance imaging-targeted biopsy may enhance the diagnostic accuracy of significant prostate cancer detection compared to standard transrectal ultrasound-guided biopsy: a systematic review and meta-analysis. Eur Urol. 2015;68(3):438–450. doi:10.1016/j.eururo.2014.11.037
9. Dickinson L, Ahmed HU, Allen C, et al. Magnetic resonance imaging for the detection, localisation, and characterisation of prostate cancer: recommendations from a European consensus meeting. Eur Urol. 2011;59(4):477–494. doi:10.1016/j.eururo.2010.12.009
10. Weinreb JC, Barentsz JO, Choyke PL, et al. PI-RADS prostate imaging - reporting and data system: 2015, version 2. Eur Urol. 2016;69(1):16–40. doi:10.1016/j.eururo.2015.08.052
11. Rhudd A, McDonald J, Emberton M, Kasivisvanathan V. The role of the multiparametric MRI in the diagnosis of prostate cancer in biopsy-naïve men. Curr Opin Urol. 2017;27(5):488–494. doi:10.1097/MOU.0000000000000415
12. Eklund M, Jäderling F, Discacciati A, et al. MRI-targeted or standard biopsy in prostate cancer screening. N Engl J Med. 2021;385(10):908–920. doi:10.1056/NEJMoa2100852
13. Rouvière O, Puech P, Renard-Penna R, et al. Use of prostate systematic and targeted biopsy on the basis of multiparametric MRI in biopsy-naive patients (MRI-FIRST): a prospective, multicentre, paired diagnostic study. Lancet Oncol. 2019;20(1):100–109. doi:10.1016/S1470-2045(18)30569-2
14. van der Leest M, Cornel E, Israël B, et al. Head-to-head comparison of transrectal ultrasound-guided prostate biopsy versus multiparametric prostate resonance imaging with subsequent magnetic resonance-guided biopsy in biopsy-naïve men with elevated prostate-specific antigen: a large prospective multicenter clinical study. Eur Urol. 2019;75(4):570–578. doi:10.1016/j.eururo.2018.11.023
15. Purysko AS, Bittencourt LK, Bullen JA, Mostardeiro TR, Herts BR, Klein EA. Accuracy and interobserver agreement for prostate imaging reporting and data system, version 2, for the characterization of lesions identified on multiparametric MRI of the prostate. AJR Am J Roentgenol. 2017;209(2):339–349. doi:10.2214/AJR.16.17289
16. Mertan FV, Greer MD, Shih JH, et al. Prospective evaluation of the prostate imaging reporting and data system version 2 for prostate cancer detection. J Urol. 2016;196(3):690–696. doi:10.1016/j.juro.2016.04.057
17. Mathur S, O’Malley ME, Ghai S, et al. Correlation of 3T multiparametric prostate MRI using prostate imaging reporting and data system (PIRADS) version 2 with biopsy as reference standard. Abdom Radiol. 2019;44:252–258.
18. Fujii S, Hayashi T, Honda Y, et al. Magnetic resonance imaging/transrectal ultrasonography fusion targeted prostate biopsy finds more significant prostate cancer in biopsy-naïve Japanese men compared with the standard biopsy. Int J Urol. 2020;27(2):140–146. doi:10.1111/iju.14149
19. Siddiqui MM, Rais-Bahrami S, Turkbey B, et al. Comparison of MR/ultrasound fusion-guided biopsy with ultrasound-guided biopsy for the diagnosis of prostate cancer. JAMA. 2015;313(4):390–397. doi:10.1001/jama.2014.17942
20. Zhu YC, Shan J, Zhang Y, et al. Strain elastography-targeted biopsy: does prostate volume affect prostate cancer detection? Med Sci Monit. 2019;25:8836–8842. doi:10.12659/MSM.917344
21. Stone NN, Crawford ED, Skouteris VM, et al. The ratio of the number of biopsy specimens to prostate volume (biopsy density) greater than 1.5 improves the prostate cancer detection rate in men undergoing transperineal biopsy of the prostate. J Urol. 2019;202(2):264–271. doi:10.1097/JU.0000000000000204
22. Colleselli D, Bektic J, Schaefer G, et al. The influence of prostate volume on prostate cancer detection using a combined approach of contrast-enhanced ultrasonography-targeted and systematic grey-scale biopsy. BJU Int. 2007;100(6):1264–1267. doi:10.1111/j.1464-410X.2007.07174.x
 © 2022 The Author(s). This work is published and licensed by Dove Medical Press Limited. The
full terms of this license are available at https://www.dovepress.com/terms
and incorporate the Creative Commons Attribution
- Non Commercial (unported, 3.0) License.
By accessing the work you hereby accept the Terms. Non-commercial uses of the work are permitted
without any further permission from Dove Medical Press Limited, provided the work is properly
attributed. For permission for commercial use of this work, please see paragraphs 4.2 and 5 of our Terms.
© 2022 The Author(s). This work is published and licensed by Dove Medical Press Limited. The
full terms of this license are available at https://www.dovepress.com/terms
and incorporate the Creative Commons Attribution
- Non Commercial (unported, 3.0) License.
By accessing the work you hereby accept the Terms. Non-commercial uses of the work are permitted
without any further permission from Dove Medical Press Limited, provided the work is properly
attributed. For permission for commercial use of this work, please see paragraphs 4.2 and 5 of our Terms.