Back to Journals » Clinical Ophthalmology » Volume 14
Comparison of Clinical Outcomes Between Intracapsular Implantation and Intrascleral Fixation Using the Same Model of Intraocular Lens
Authors Torii T, Tamaoki A ![]() , Kojima T, Matsuda T, Kaga T, Ichikawa K
, Kojima T, Matsuda T, Kaga T, Ichikawa K ![]()
Received 26 June 2020
Accepted for publication 8 October 2020
Published 17 November 2020 Volume 2020:14 Pages 3965—3974
DOI https://doi.org/10.2147/OPTH.S268126
Checked for plagiarism Yes
Review by Single anonymous peer review
Peer reviewer comments 4
Editor who approved publication: Dr Scott Fraser
Toshiki Torii,1 Akeno Tamaoki,1 Takashi Kojima,1,2 Taisuke Matsuda,1 Tatsushi Kaga,1 Kazuo Ichikawa3
1Department of Ophthalmology, Japan Community Health Care Organization, Chukyo Hospital, Nagoya, Japan; 2Department of Ophthalmology, Keio University School of Medicine, Tokyo, Japan; 3Chukyo Eye Clinic, Nagoya, Japan
Correspondence: Takashi Kojima
Keio University School of Medicine, Shinanomachi 35, Shinjuku-Ku, Tokyo 160-8582, Japan
Tel +81-3-5363-2012
Fax +81-3-5363-3087
Email [email protected]
Purpose: To compare the clinical outcomes of intrascleral intraocular lens (IOL) fixation surgery with those of intracapsular IOL implantation in conventional cataract surgery.
Patients and Methods: Twenty-one eyes of 21 consecutive patients who underwent intrascleral IOL fixation (SF group) and 21 eyes of 21 patients who underwent IOL intracapsular implantation during cataract surgery (IN group) were retrospectively enrolled. For both groups, the same model of IOL was used in all cases. For all cases in the SF group, Yamane’s double-needle technique was performed.
Results: The mean corrected visual acuity (logMAR) after surgery was significantly better in the IN than in the SF group (− 0.063 ± 0.12 vs 0.05 ± 0.14; p = 0.0083). The mean anterior chamber depth after surgery was significantly smaller in the IN than in the SF group (4.65 ± 0.23 mm vs 4.98 ± 0.61 mm; p = 0.0231). The amounts of tilt and decentration were also significantly smaller in the IN group (5.21°± 1.47° and 0.22 ± 0.13 mm, respectively, vs 8.8° ± 3.9° and 0.52 ± 0.35 mm, respectively; p = 0.0003 and p = 0.0007). The mean absolute refractive prediction error was significantly smaller in the IN than in the SF group (0.22 ± 0.17 D vs 0.86 ± 0.59 D; p = 0.0002).
Conclusion: The intrascleral IOL fixation surgery proved to be highly effective. However, its clinical outcomes were slightly inferior to those of IOL intracapsular implantation, and further improvement of this surgical technique may be needed.
Keywords: intrascleral intraocular lens fixation, cataract, visual acuity, refractive prediction error
Introduction
Advances in cataract surgery techniques and devices have enabled patients to gain good uncorrected visual acuity after surgery. For improvement of uncorrected visual acuity, reduction of refractive prediction error is essential. In cases without sufficient support for the lens capsule, intraocular lens (IOL) suture surgery to the ciliary sulcus is widely performed, and various technical improvements have been made to this technique so far.1–6 It also has been reported that IOLs are inserted from a small incision using an injector.7 Although IOL suture surgery is an established technique with long-term stability, intra/postoperative complications, tilt, and decentration of the IOL have been reported after this procedure.5,6
IOL intrascleral fixation, which fixes the IOL haptics into the scleral tunnel, has become a widespread alternative to IOL suture surgery. This procedure was first reported by Gabor et al. in 20078 and has subsequently undergone multiple technical improvements.9–12 Intrascleral fixation does not require complicated suturing techniques, can be performed with a small incision, and is not associated with suture-related complications. It is also reported to involve lessIOL tilt and postoperative astigmatism in comparison with the IOL suture technique.10–12
Due to the longer lifespan in recent years, IOL dislocation may occur due to the deterioration of capsule support over time after cataract surgery, and therefore, the number of cases requiring intrascleral IOL fixation surgery is increasing. In order to improve the accuracy of intrascleral IOL fixation surgery, this study was designed to determine differences between the intrascleral IOL fixation procedure currently performed in our hospital and conventional cataract surgery in terms of visual function and IOL condition.
Moreover, the IOL shows different spherical aberrations depending on the optical design and differences in the postoperative effective lens position. Although several reports have described the refractive prediction error, IOL decentration, and tilt after intrascleral IOL fixation surgery,10–14 data comparing the clinical outcomes of intracapsular IOL implantation in conventional cataract surgery and those of intrascleral IOL fixation using the same model of IOL are limited.
In this study, we evaluated and compared the visual function, refractive prediction error, and IOL conditions between patients subjected to intrascleral IOL fixation surgery and those subjected to intracapsular IOL implantation surgery using the same IOL.
Methods
Patients
A series of consecutive patients who underwent intrascleral IOL fixation surgery at Japan Community Health Care Organization (JCHO) Chukyo Hospital from January 2016 to May 2018 were retrospectively prescreened, and eyes showing ocular abnormalities other than refractive error and weakness of capsular support were excluded. Finally, we enrolled 21 consecutive eyes of 21 patients who underwent intrascleral IOL fixation (SF group). The average age was 75.57 ± 10.10 years.
Similarly, a series of consecutive patients who underwent cataract surgery with intracapsular IOL implantation at Japan Community Health care Organization (JCHO) Chukyo Hospital from September 2015 to July 2019 were retrospectively prescreened, and eyes showing ocular abnormalities other than refractive errors were excluded. Next, after masking the postoperative results, age, axial length, and the average corneal refractive power (K value) were matched to those of the patients in the SF group. Thus, 21 eyes of 21 patients were selected in the intracapsular IOL implantation group (IN group). The average age was 69.71 ± 10.54 years.
The mean IOL power used for surgery was 21.33 ± 3.04 D in the IN group and 21.74 ± 3.33 D in the SF group. Preoperative patient demographic information is shown in Table 1. There were no significant differences in age, axial length, mean keratometric value and corneal high order aberration between the two groups.
 |
Table 1 Preoperative Demographic Information in the Intracapsular and Intrascleral IOL Fixation Groups |
Cataracts were classified according to the World Health Organization classification, and cataract grades were classified using the Emery-Little classification grade (Table 2). The causes of intrascleral IOL fixation are shown in Table 3.
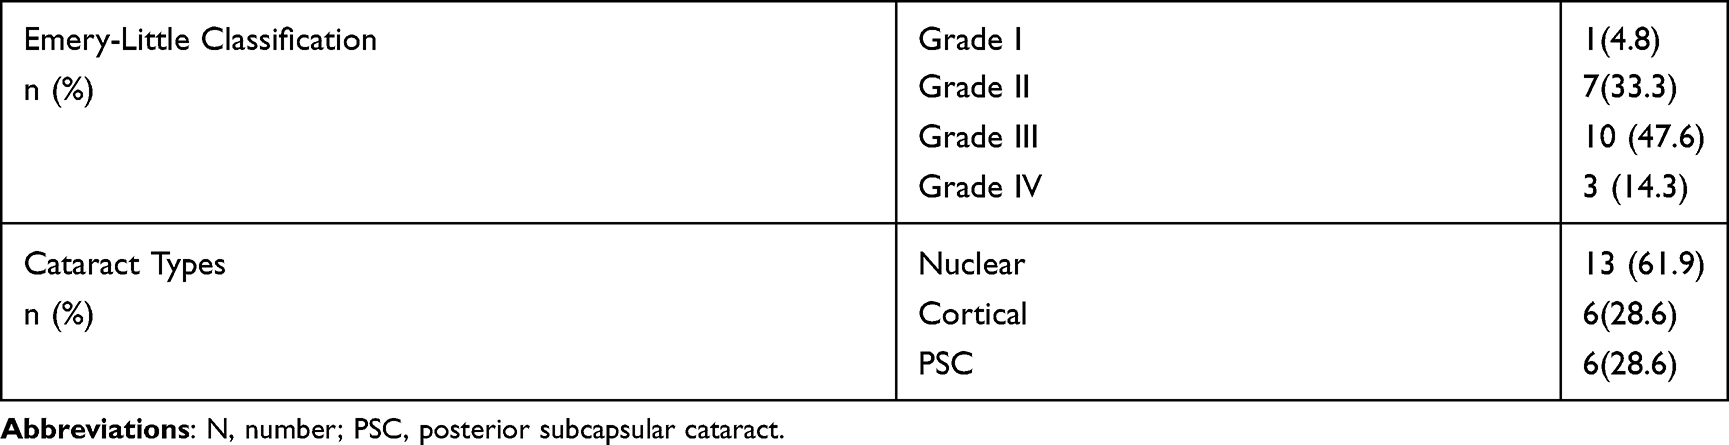 |
Table 2 Patient Cataract Grade and Type in the Intracapsular Fixation Group |
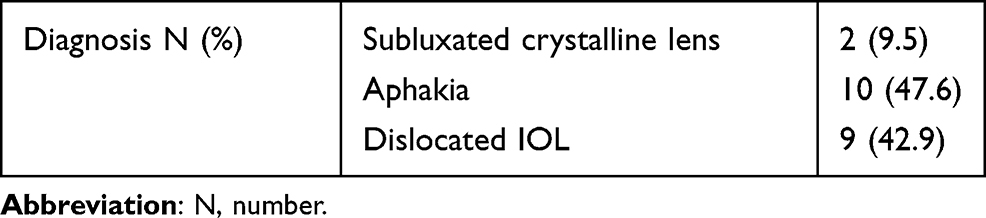 |
Table 3 Preoperative Condition in the Intrascleral IOL Fixation Group |
This study was conducted in accordance with the Declaration of Helsinki, with the approval of the JCHO Chukyo Hospital Ethics Committee (approval number, 2,018,035). The requirement for patient informed consent was waived by the ethics review board, and the opt-out method was approved alternatively.
Main Outcome Measures
The following items were compared between the SF and IN groups: 1) postoperative best-corrected visual acuity (BCVA); 2) postoperative anterior chamber depth (ACD) (distance from the anterior corneal surface to the anterior IOL plane); 3) IOL tilt and decentration; 4) higher-order aberration with a 4-mm analysis diameter; 5) manifest refractive and corneal power parameters; and 6) refractive prediction error at 3 months after surgery (postoperative actual refraction – predicted refraction).
Measurement of ACD and Angle to Angle (ATA) Depth
An anterior segment optical coherence tomography (OCT) device (CASIA 2, Tomey Corporation, Nagoya, Japan) was used for measurement of ATA depth and IOL tilt and decentration. OPD-Scan III (Nidek, Gamagori Japan) was used to perform aberration analysis.
In the SF group, since it was difficult to measure preoperative ACD, we measured the ATA depth, defined as the perpendicular distance between the posterior corneal surface and the intersection point of a line joining both angle recesses on the cross-sectional horizontal image, using anterior segment OCT as an alternative value.
Measurement of IOL Tilt and Decentration Using Anterior Segment OCT
The perpendicular bisector of the line connecting the intersections of the front and back of the lens was defined as the “optical axis of the lens,” while the center of the intersection was defined as “the center of the lens.”15 Tilt was defined as the angle between the vertex normal and lens axis (Figure 1). In the current study, vertex normal was defined as the line connecting the fixation point to the corneal apex. Decentration was defined as the distance from vertex normal to lens center (Figure 1). In tilt and decentration analysis, 3-dimensional analysis was performed based on two 2-dimensional orthogonal surfaces. A swept-source OCT biometer IOLMaster 700 (Carl Zeiss Meditec, Jena, Germany) was used for measuring the axial length and corneal curvature. For both the SF and IN groups, X-70 or NX-70 IOL (Santen Pharmaceutical company, Osaka Japan) were used for all cases. X-70 and NX-70 have exactly the same IOL design, but X-70 is a non-colored IOL, while NX-70 is colored.
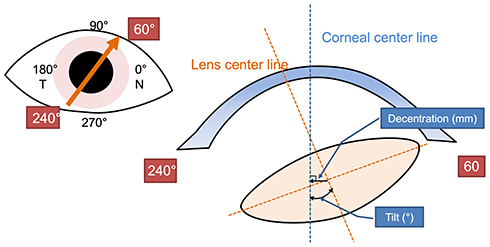 |
Figure 1 Definition of decentration and tilt in anterior segment optical coherence tomography. The yellow dotted line indicates the lens center line. The blue dotted line indicates the corneal center line (vertex normal). |
The IOL calculation was performed using the SRK/T formula. The A-constant was optimized in our hospital, and the value 119.53 was applied in both SF and IN groups.
Surgical Technique for IOL Intrascleral Fixation
According to previous literature,11,12 Yamane’s double-needle technique was performed for all intrascleral IOL fixation surgeries. Two experienced surgeons performed the surgeries (Surgeon A: 13 eyes, Surgeon B: 8 eyes). An angled sclerotomy was made through the conjunctiva using a 30-gauge thin-wall needle (TSK ultra-thin wall needle; Tochigi Seiko, Tochigi, Japan) at 2 mm from the limbs. The IOL was inserted and fixed at the 4- and 10-o’clock positions. The haptics of the IOL were externalized out of the eye with a 30-gauge needle, and the end of the haptics was cauterized using an ophthalmic cautery device (Accu-Temp Cautery, Beaver Visitec, Waltham, MA) to create a flange shape.
Correlation Analyses
First, single-correlation analysis was performed to investigate the factors associated with the refractive prediction error of IOL power calculation. Then, stepwise multiple regression analysis was performed to determine the factors affecting the refractive prediction error. The refractive prediction error was set as the dependent variable, and the following parameters were included as explanatory variables: preoperative axial length, corneal refractive power, postoperative ACD, IOL tilt amount, IOL decentration distance, higher-order aberration, and coma aberration and sagittal aberration (trefoil).
Statistical Analyses
GraphPad Prism (version 5, Graphpad Prism Software Inc.) was used for statistical analyses in this study. For comparison between the two groups, normality was checked. Then, t-test or Mann–Whitney U-test was performed. The chi-squared test was applied to compare the distribution of refractive prediction error between the two groups. SPSS (version 21, IBM) was used for multiple regression analysis. A p value less than 5% was considered to be statistically significant.
Results
Postoperative comparisons of measurements are shown in Table 4.
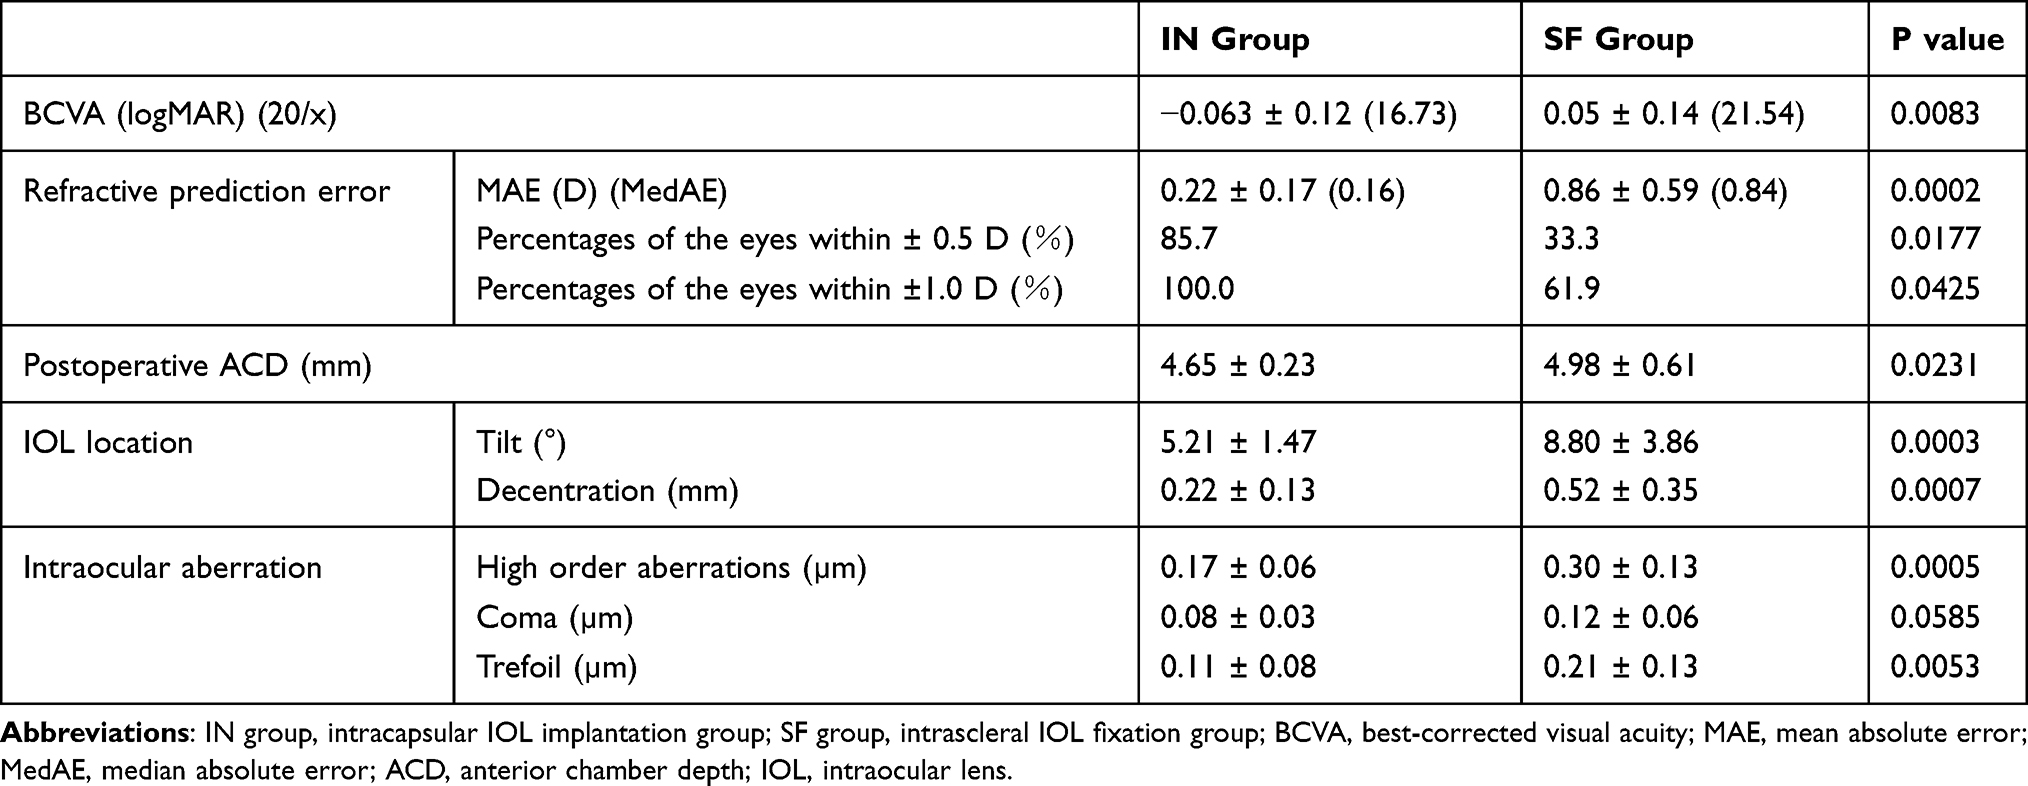 |
Table 4 Comparison of Postoperative Measurement Values Between the Intracapsular and Intrascleral IOL Fixation Groups |
Postoperative BCVA
The mean BCVA at 3 months after surgery was significantly worse in the SF group (0.05 ± 0.14) than in the IN group (−0.063 ± 0.12; p = 0.0083).
Postoperative ATA Distance and ACD
The mean preoperative ATA distance in the IN and SF groups was 3.91 ± 0.17 mm and 4.02 ± 0.34 mm, respectively. There was no significant difference between the two groups (p = 0.1708). In contrast, the mean ACD 3 months after surgery was significantly larger in the SF group (4.98 ± 0.61 mm) than in the IN group (4.65 ± 0.23 mm; p = 0.0231).
IOL Tilt and Decentration
The distribution of IOL tilt is shown in Figure 2, and IOL decentration is shown in Figure 3. In the IN group, the centroid of the decentration in the right eye was −0.042 ± 0.16 in the x-axis and −0.071 ± 0.18 in the y-axis; in the left eye, it was −0.0086 ± 0.16 in the x-axis and 0.049 ± 0.18 in the y-axis. In the SF group, the centroid of the decentration in the right eye was −0.31 ± 0.36 in the x-axis and −0.14 ± 0.26 in the y-axis; in the left eye, it was 0.26 ± 0.36 in the x-axis and −0.082 ± 0.47 in the y-axis.
 |
Figure 2 Distribution of intraocular lens (IOL) tilt. Tilt distribution in the intracapsular IOL implantation group (A) and intrascleral IOL fixation group (B) are shown. Black dots indicate right eyes, while white squares indicate left eyes. |
 |
Figure 3 Distribution of intraocular lens (IOL) decentration. IOL decentration distribution in the intracapsular IOL implantation group (A) and intrascleral IOL fixation group (B) are shown. Black dots indicate right eyes, while white squares indicate left eyes. |
In the IN group, the centroid of the tilt in the right eye was −4.80 ± 1.66 in the x-axis and −2.26 ± 1.20 in the y-axis; in the left eye, it was 4.42 ± 1.12 in the x-axis and −2.14 ± 1.00 in the y-axis. In the SF group, the centroid of the tilt in the right eye was 1.50 ± 5.10 in the x-axis and 1.50 ± 6.26 in the y-axis; in the left eye, it was 3.40 ± 5.55 in the x-axis and1.19 ± 7.71 in the y-axis.
The tilt angle was significantly larger in the SF group (8.8° ± 3.9°) than in the IN group (5.21° ± 1.47 °; p = 0.0003). The decentration of the IOL was significantly larger in the SF group (0.52 ± 0.35 mm) than in the IN group (0.22 ± 0.13 mm; p = 0.0007).
Higher-Order Aberration Within 4-mm Diameter
The preoperative corneal higher-order aberration in the IN and SF groups was 0.21 ± 0.09 µm and 0.31 ± 0.20 µm, respectively. There was no significant difference between the two groups (p = 0.2969; Table 1). The postoperative total, corneal, and intraocular higher-order aberrations were significantly larger in the SF than in the IN group (p = 0.0032, p = 0.0005, and p = 0.0005, respectively).
The postoperative corneal coma aberration was significantly larger in the SF than in the IN group (p = 0.0044), while there were no differences in the postoperative total (p = 0.0552) and intraocular coma aberration (p = 0.0585).
The postoperative total, corneal, and intraocular trefoil were significantly larger in the SF than in the IN group (p = 0.0031, p = 0.0036, and p = 0.0053, respectively).
There were no significant differences between the preoperative and postoperative corneal higher-order aberrations in either of the two groups (IN: p = 0.715; SF: p = 0.181).
Manifest Refractive and Corneal Power Parameters
The comparison of corneal parameters is shown in Table 5. The preoperative corneal astigmatism was significantly larger in the SF group (1.35 ± 0.87 D) than in the IN group (0.60 ± 0.32 D, p = 0.0009). The postoperative corneal astigmatism was also significantly larger in the SF group (1.60 ± 1.08 D vs 0.65 ± 0.29 D; p = 0.0002). In contrast, there was no significant difference between preoperative and postoperative cornel astigmatism in either group (IN: p = 0.4279; SF: p = 0.4064).
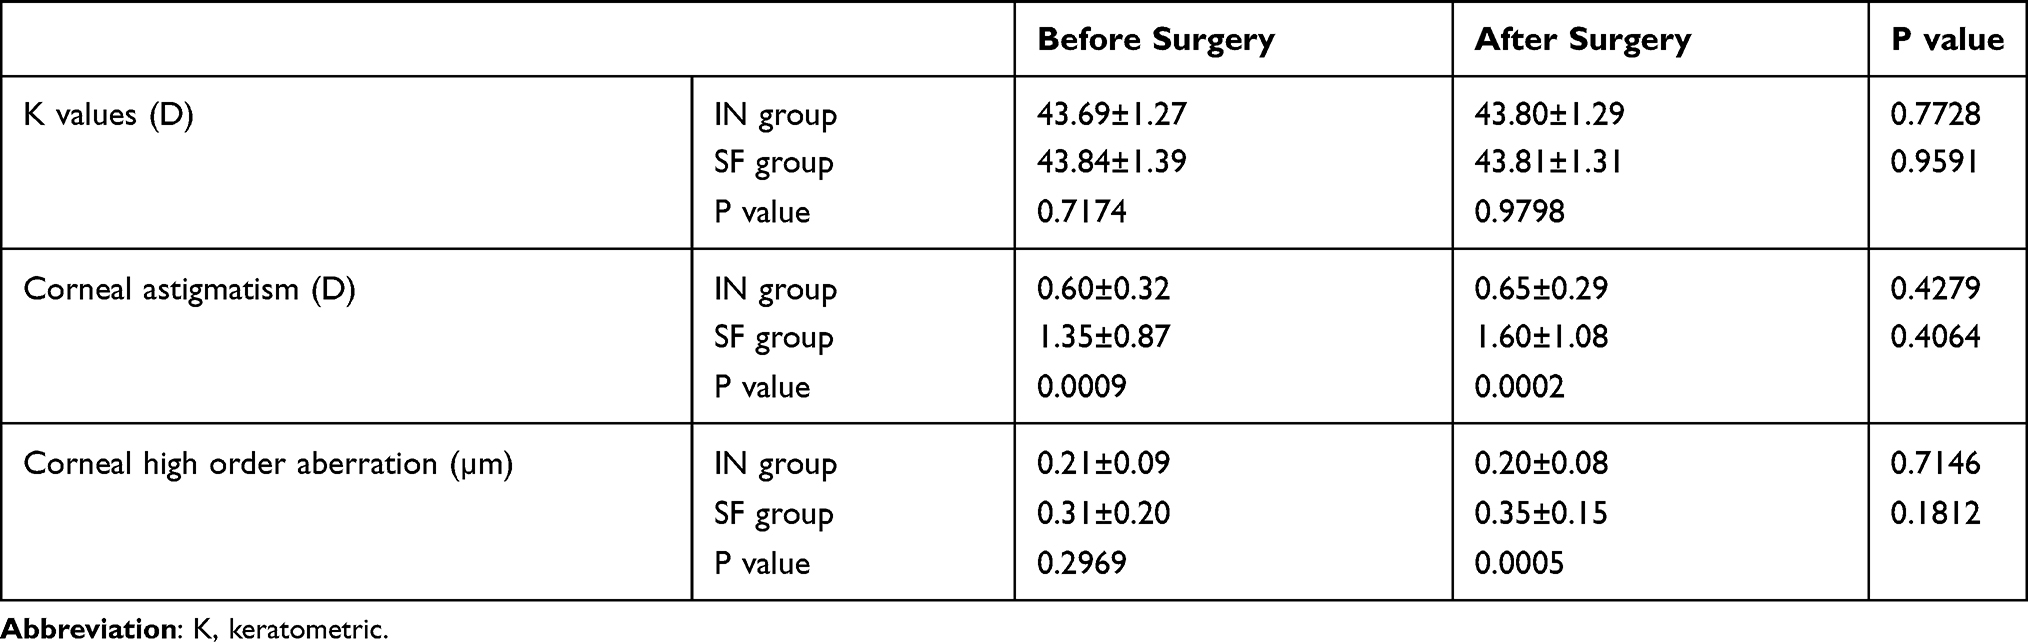 |
Table 5 Comparison of Corneal Parameter (K, Astigmatism, Higher-Order Aberrations) Before and After Surgery Between the Intracapsular and Intrascleral IOL Fixation Groups |
Regarding the mean K value, there were no significant differences between the preoperative and postoperative values in the IN and SF groups (p = 0.7728 and p = 0.9591, respectively).
Regarding the manifest refractive astigmatism, there was no significant difference between the preoperative (0.79 ± 0.56 D) and postoperative value (0.79 ± 0.68 D) in the IN group (p = 1.0000). Similarly, no significant difference was found in the SF group (pre: 1.10 ± 0.79 D, post: 1.64 ± 0.96 D, p = 0.1169). However, the postoperative manifest refractive astigmatism was significantly larger in the SF than in the IN group (1.64 ± 0.96 D vs 0.79 ± 0.68 D, p = 0.0018).
Refractive Prediction Error at 3 Months After Surgery
There was no significant difference in the arithmetic refractive prediction error between the IN and SF groups (0.02 ± 0.29 D vs −0.16 ± 1.05 D, p = 0.4701). The absolute mean refractive prediction error was significantly larger in the SF group [0.86 ± 0.59 D, (median absolute error, MedAE): 0.84 D] than in the IN group (0.22 ± 0.17 D, MedAE: 0.16D; p = 0.0002).
Moreover, fewer cases were accurately predicted within ±0.5 D of the predictive refractive power in the SF than in the IN group [33.3% (7/21 eyes) vs 85.7% (18/21 eyes), p = 0.0177]. Similarly, fewer cases were accurately predicted within ±1.0 D of the predictive refractive power in the SF than in the IN group [61.9% (13/21 eyes) vs 100.0% (21/21 eyes), p = 0.0425].
Single Correlation Between Each Examination Item and Refractive Prediction Error
The factors showing significant correlation with the refractive prediction error were postoperative ACD (R2 = 0.5513, p = 0.0001; Figure 4A), intraocular higher-order aberration (R2 = 0.2486, p = 0.0252; Figure 4B), IOL tilt amount (R2 = 0.296, p = 0.0445; Figure 4C), and intraocular trefoil (R2 = 0.1932, p = 0.026; Figure 4D). In contrast, the refractive prediction error showed no correlation with the IOL decentration (p = 0.3259) and intraocular coma (p = 0.0720). In the IN group, none of the factors correlated with the refractive prediction error.
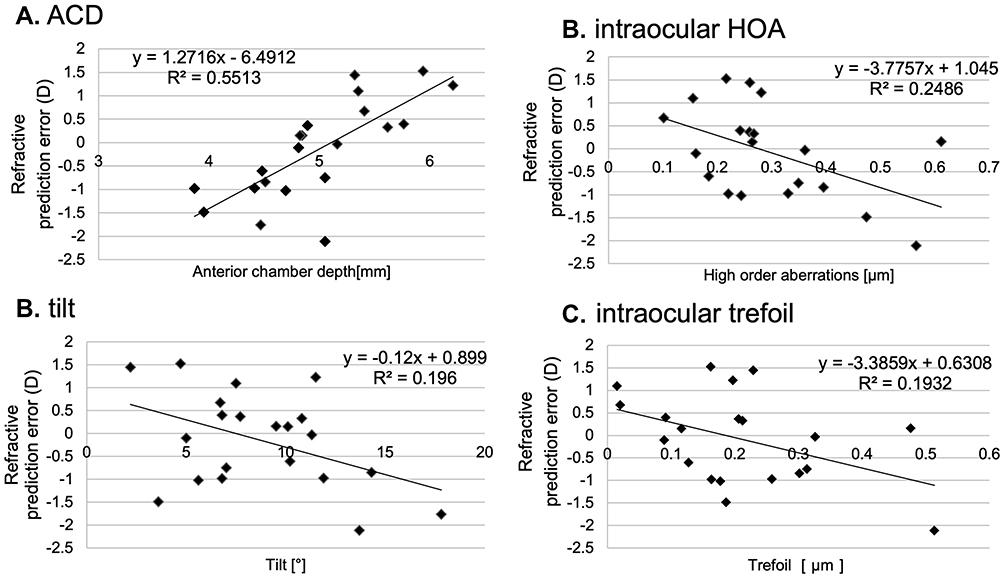 |
Figure 4 Correlation of refractive prediction error with various parameters. (A) Correlation between the refractive prediction error and ACD in the intrascleral IOL fixation group. There was a significant positive correlation between the refractive prediction error and postoperative ACD. Note that the subjective refractive sphere showed a hyperopic shift when the ACD was deeper. (B) Correlation between refractive prediction error and intraocular higher-order aberration in the intrascleral IOL fixation group. There was a significant negative correlation between the refractive prediction error and the intraocular higher-order aberration. Note that the subjective refractive sphere showed a more myopic shift when the higher-order aberration was higher. (C) Correlation between refractive prediction error and tilt amount in the intrascleral IOL fixation group. There was a significant negative correlation between the refractive prediction error and the amount of tilt. Note that the subjective refractive sphere showed a more myopic shift when the tilt was higher. (D) Correlation between refractive prediction error and trefoil in the intrascleral fixation group. There was a significant negative correlation between the refractive prediction error and postoperative trefoil. Note that the subjective refractive sphere showed a more myopic shift when the trefoil was higher. |
Multiple Regression Analysis with Refractive Prediction Error as a Dependent Variable
The explanatory variables selected in the SF group were postoperative ACD (p = 0.000, β = 0.688, partial regression coefficient = 0.760, VIF = 1.018) and intraocular trefoil (p = 0.026, β = −0.349, partial regression coefficient = −0.509, VIF = 1.018).
Discussion
The current study was conducted to clarify the difference in clinical outcomes and IOL condition between intrascleral IOL fixation surgery and general cataract surgery.
In a previous study, the corrected visual acuity after 36 months of NX-70 intrascleral fixation was 0.04 (logMAR), and the postoperative refractive prediction error obtained using the SRK/T formula was −0.21 ± 0.99 D.12 In the current study, the corrected visual acuity (logMAR) at 3 months after surgery was 0.05 ± 0.14, and the postoperative refractive prediction error was −0.16D ± 1.05D, which was comparable to the previously reported findings.
The mean ACD at 3 months after surgery was significantly larger in the SF group (4.98 ± 0.61 mm) than in the IN group (4.65 ± 0.23 mm). This may be due to the length of IOL haptics embedded in the sclera. In addition, when performing sclerotomy, the 30-G needle puncture position may be more than 2 mm away from the limbus.
The amount of tilt was also significantly larger in the SF than in the IN group. The amount of tilt was reported at 3.4° ± 2.5° after intrascleral IOL fixation.12 However, in the present study, it was 5.21° ± 1.47° in the IN group and 8.80° ± 3.86° in the SF group, both of which were larger than the respective values in the previous report. This discrepancy may be attributable to differences in the analysis method of IOL tilt. In the previous report, anterior segment OCT (SS-1000 CASIA; Tomey Corporation, Nagoya, Japan) was used to determine the intraocular lens tilt.12 Specifically, a straight line passing through the iris-corneal angles on either side of the image was marked as a reference line, and the angle between the reference line and the horizontal axis of the IOL was considered as the IOL tilt. The IOL tilt was measured in both the vertical and horizontal planes, and the average value was defined as the mean IOL tilt. In contrast, in this study, we measured the maximum amount of tilt by three-dimensional analysis from two orthogonal planes in 16 slices, using anterior segment OCT. Therefore, the tilt amount determined in the current study cannot be compared with those in previous studies. Further studies using the same analysis method are needed in the future.
In addition, IOLs in both right and left eyes tilted toward the lower lateral side in the IN group. In contrast, in the SF group, IOLs in both eyes tilted in a direction perpendicular to the fixed position of the IOL haptics. This result could be attributable to the fact that in intrascleral IOL fixation surgery, the IOL does not tilt in the direction of the fixed position because the two IOL haptics are fixed at an almost equal distance from the limbus. Thus, the cause of the tilt in the direction perpendicular to the fixed position may be different in the insertion angle between two haptics. The difference in the length of the haptics buried in the sclera may also have an effect.
Further, the decentering distance was significantly larger in the SF than in the IN group. According to a previous study, the modulation transfer function performance decreases when the decentration distance of aspherical IOLs increases.16 The same authors also reported that the IOL modulation transfer function performance decreases significantly when it is greater than 0.4 mm. In the SF group of this study, since the decentration distance was 0.52 ± 0.35 mm, the modulation transfer function performance could be greatly reduced. Therefore, the decentration distance may be one of the causes for worse BCVA in the SF than in the IN group. We speculate that the cause of the increased decentration in the SF group might involve the insertion angle of the 30-G needle puncture, as, depending on this angle, a different load is applied to the IOL haptics. Furthermore, the length of the intrascleral tunnel may vary depending on the insertion angle, which may also affect the IOL decentration. A previous study showed a technique to avoid mechanical stress on IOL haptics.12 According to this report, the haptics were stable when they were fixed inside the sclera at an angle of 20° with respect to the corneal limbus and an angle of 5° with respect to the iris surface. To fix the IOL in the stable position, another report showed that the double-needle stabilizer contributed to reducing the amount of tilt and decentration of the IOL.17 Shortening of the IOL haptics was reported to be effective in patients whose IOL was greatly tilted after intrascleral fixation.18 If the tilt of the IOL can be evaluated with an aberrometer or auto-refractometer during surgery, it may be possible to control any future tilt by adjusting the length of the IOL haptics during surgery. Further studies are needed to compare intracapsular IOL implantation and intrascleral IOL fixation surgery with techniques controlling the 30-G needle insertion angle.
Intraocular higher-order aberrations, coma, and trefoil were significantly larger in the SF than in the IN group. A previous report showed that coma aberration in eyes is significantly higher after IOL suture surgery than after intracapsular IOL implantation.14 Moreover, the authors reported that coma aberration increases as the amount of IOL tilt increases after IOL suture surgery. In the current study, there was no significant difference in intraocular coma aberration between the IN and SF groups. Thus, intrascleral IOL fixation may involve lower coma aberration incidence than does IOL suture surgery.
We examined the correlation between intraocular coma aberration and IOL tilt, but no significant correlation was found (data not shown). In this study, we did not examine coma aberration before surgery and therefore cannot evaluate surgically induced coma aberration by corneal incision. In cases showing IOL dislocation, the IOL often needs to be removed and then re-inserted. Therefore, the size of the corneal incision may vary depending on the case. For evaluating coma aberration associated with intrascleral IOL fixation surgery, corneal incision-related coma aberration and coma aberration due to IOL tilt should be considered. Further multivariate regression analyses with a larger number of cases should be planned to reveal the cause of changes in coma aberration in the future.
The reason why preoperative corneal astigmatism was greater in the SF than in the IN group may be that cataract surgery and vitreous surgery had already been performed before the SF surgery in all but two patients in the SF group. Since there was no difference between preoperative and postoperative corneal astigmatism in this group, the effect of SF on the cornea is considered to be small.
A previous study showed that when the ACD becomes 0.1 mm, the spherical equivalent power shows a 0.14-D hyperopic shift.19 In this study, the postoperative refractive prediction error in the SF group was highly correlated with the postoperative ACD. In addition, we found weak correlations of the postoperative refractive prediction error with intraocular higher-order aberrations, IOL tilt, and intraocular trefoil. In multivariate analysis, postoperative ACD and intraocular trefoil were selected as explanatory variables. Between these two variables, the ACD showed a higher odds ratio, suggesting its control can provide an accurate postoperative refractive value.
There are several limitations to this study. First, the number of cases was small after matching the two groups for specific protocol variables, including the type of IOL, axial length, and K value. Second, multiple surgeons performed intrascleral fixation, and the surgeons’ learning curve can affect the outcomes of intrascleral fixation. Although all surgeons in this study had experience, having performed more than 50 cases of intrascleral fixation surgery, some differences in skill levels among surgeons cannot be excluded.
Moreover, in this study, the ACD and amount of tilt were larger in the SF group than in the IN group. The A-constant used for intrascleral fixation was the same as that used for intracapsular IOL implantation, assuming that the IOL fixation position would also be the same. However, the ACD of eyes subjected to intrascleral IOL fixation was significantly lower than that of eyes subjected to intracapsular IOL fixation. This result suggests that the IOL fixation position was deeper than that expected by intracapsular IOL implantation, which may have led to the hyperopic shift of the predictive refractive error. Therefore, a reduction in the refraction error can be expected by optimizing the A-constant for intrascleral IOL fixation surgery. We thus consider that it might have been necessary to adjust the length of the haptic in order to obtain the same ACD as in the IN group. However, since the effective lens position differs from person to person, the feasibility of techniques for shortening the IOL haptics should be evaluated in a future study. It may also be necessary to develop an IOL power calculation formula suitable for intrascleral fixation.
Conclusion
In this study, we compared intracapsular IOL implantation and intrascleral IOL fixation. Although intrascleral IOL fixation surgery was inferior to IOL intracapsular implantation surgery in terms of refractive prediction error and higher-order aberrations, the difference was small, suggesting that the technique needs to be refined to improve postoperative visual function. Nevertheless, we consider that intrascleral IOL fixation surgery is a highly effective procedure for eyes with insufficient capsular support of IOL. Since there is a paucity of studies comparing this method with IOL suture surgery, additional studies will also be needed to clarify its advantages and disadvantages.
Data Sharing Statement
The Excel data used to support the findings of this study are available as supplemental material Table S1.
Funding
There is no funding to reward.
Disclosure
Ms. Tamaoki reports personal fees from Nidek and Alcon Japan, outside the submitted work. Professor Kojima reports personal fees from Santen pharmaceutical, Otsuka pharmaceutical, STAAR Surgical, and Alcon Japan, outside the submitted work. Dr. Ichikawa reports grants from HOYA, MANI and JFC, grants and personal fees from Alcon, personal fees from Santen Pharmaceutical Co. Ltd, ZEISS, STAAR, Santen, NIDEK, KY CenterVue, Kowa, and Novartis Pharm, and writing fee from Igaku shoin, outside the submitted work; in addition, Dr Ichikawa has a patent, Igaku Shoin with royalties paid. The authors report no other potential conflicts of interest for this work.
References
1. Cowden JW, Hu BV, Girard LJ. A new surgical technique for posterior chamber lens fixation during penetrating keratoplasty in the absence of capsular or zonular support. Cornea. 1988;7(3):231–235. doi:10.1097/00003226-198803000-00010
2. Hu BV, Shin DH, Gibbs KA, Hong YJ. Implantation of posterior chamber lens in the absence of capsular and zonular support. Arch Ophthalmol. 1988;106(3):416–420. doi:10.1001/archopht.1988.01060130442039
3. Stark WJ, Goodman G, Goodman D, Gottsch J. Posterior chamber intraocular lens implantation in the absence of posterior capsular support. Ophthalmic Surg. 1988;19(4):240–243.
4. Lindquist TD, Agapitos PJ, Lindstrom RL, Lane SS, Spigelman AV. Transscleral fixation of posterior chamber intraocular lenses in the absence of capsular support. Ophthalmic Surg. 1989;20(11):769–775.
5. Hayashi K, Hayashi H, Nakao F, Hayashi F. Intraocular lens tilt and decentration, anterior chamber depth, and refractive error after trans-scleral suture fixation surgery. Ophthalmology. 1999;106(5):878–882. doi:10.1016/S0161-6420(99)00504-7
6. Mizuno Y, Sugimoto Y. A comparative study of transscleral suture-fixated and scleral-fixated intraocular lens implantation. Int Ophthalmol. 2019;39(4):839–845. doi:10.1007/s10792-018-0883-5
7. Szurman P, Petermeier K, Jaissle GB, Bartz-Schmidt KU. A new small-incision technique for injector implantation of transsclerally sutured foldable lenses. Ophthalmic Surg Lasers Imaging. 2007;38(1):76–80. doi:10.3928/15428877-20070101-14
8. Gabor SG, Pavlidis MM. Sutureless intrascleral posterior chamber intraocular lens fixation. J Cataract Refract Surg. 2007;33(11):1851–1854. doi:10.1016/j.jcrs.2007.07.013
9. Agarwal A, Kumar DA, Jacob S, Baid C, Agarwal A, Srinivasan S. Fibrin glue-assisted sutureless posterior chamber intraocular lens implantation in eyes with deficient posterior capsules. J Cataract Refract Surg. 2008;34(9):1433–1438. doi:10.1016/j.jcrs.2008.04.040
10. Ohta T, Toshida H, Murakami A. Simplified and safe method of sutureless intrascleral posterior chamber intraocular lens fixation: y-fixation technique. J Cataract Refract Surg. 2014;40(1):2–7. doi:10.1016/j.jcrs.2013.11.003
11. Yamane S, Inoue M, Arakawa A, Kadonosono K. Sutureless 27-gauge needle-guided intrascleral intraocular lens implantation with lamellar scleral dissection. Ophthalmology. 2014;121(1):61–66. doi:10.1016/j.ophtha.2013.08.043
12. Yamane S, Sato S, Maruyama-Inoue M, Kadonosono K. Flanged intrascleral intraocular lens fixation with double-needle technique. Ophthalmology. 2017;124(8):1136–1142. doi:10.1016/j.ophtha.2017.03.036
13. Matsuki N, Inoue M, Itoh Y, Nagamoto T, Hirakata A. Changes in higher-order aberrations of intraocular lenses with intrascleral fixation. Br J Ophthalmol. 2015;99(12):1732–1738. doi:10.1136/bjophthalmol-2015-307106
14. Oshika T, Sugita G, Miyata K, et al. Influence of tilt and decentration of scleral-sutured intraocular lens on ocular higher-order wavefront aberration. Br J Ophthalmol. 2007;91(2):185–188. doi:10.1136/bjo.2006.099945
15. Kimura S, Morizane Y, Shiode Y, et al. Assessment of tilt and decentration of crystalline lens and intraocular lens relative to the corneal topographic axis using anterior segment optical coherence tomography. PLoS One. 2017;12(9):e0184066. doi:10.1371/journal.pone.0184066
16. Holladay JT, Piers PA, Koranyi G, van der Mooren M, Norrby NE. A new intraocular lens design to reduce spherical aberration of pseudophakic eyes. J Refract Surg. 2002;18(6):683–691.
17. Yamane S, Maruyama-Inoue M, Kadonosono K. Needle stabilizer for flanged intraocular lens fixation. Retina. 2019;39(4):801. doi:10.1097/IAE.0000000000002455
18. Kurimori HY, Inoue M, Hirakata A. Adjustments of haptics length for tilted intraocular lens after intrascleral fixation. Am J Ophthalmol Case Rep. 2018;10:180–184. doi:10.1016/j.ajoc.2018.02.025
19. Suto C, Hori S, Fukuyama E, Akura J. Adjusting intraocular lens power for sulcus fixation. J Cataract Refract Surg. 2003;29(10):1913–1917. doi:10.1016/S0886-3350(03)00250-5
 © 2020 The Author(s). This work is published and licensed by Dove Medical Press Limited. The
full terms of this license are available at https://www.dovepress.com/terms
and incorporate the Creative Commons Attribution
- Non Commercial (unported, 3.0) License.
By accessing the work you hereby accept the Terms. Non-commercial uses of the work are permitted
without any further permission from Dove Medical Press Limited, provided the work is properly
attributed. For permission for commercial use of this work, please see paragraphs 4.2 and 5 of our Terms.
© 2020 The Author(s). This work is published and licensed by Dove Medical Press Limited. The
full terms of this license are available at https://www.dovepress.com/terms
and incorporate the Creative Commons Attribution
- Non Commercial (unported, 3.0) License.
By accessing the work you hereby accept the Terms. Non-commercial uses of the work are permitted
without any further permission from Dove Medical Press Limited, provided the work is properly
attributed. For permission for commercial use of this work, please see paragraphs 4.2 and 5 of our Terms.