Back to Journals » Clinical Ophthalmology » Volume 15
Comparison of Autonomous AS-OCT Deep Learning Algorithm and Clinical Dry Eye Tests in Diagnosis of Dry Eye Disease
Authors Chase C, Elsawy A, Eleiwa T ![]() , Ozcan E, Tolba M, Abou Shousha M
, Ozcan E, Tolba M, Abou Shousha M
Received 25 May 2021
Accepted for publication 27 July 2021
Published 21 October 2021 Volume 2021:15 Pages 4281—4289
DOI https://doi.org/10.2147/OPTH.S321764
Checked for plagiarism Yes
Review by Single anonymous peer review
Peer reviewer comments 3
Editor who approved publication: Dr Scott Fraser
Collin Chase,1 Amr Elsawy,2 Taher Eleiwa,3 Eyup Ozcan,4 Mohamed Tolba,2 Mohamed Abou Shousha2
1Morsani College of Medicine, University of South Florida, Tampa, FL, USA; 2Cornea Department, Bascom Palmer Eye Institute, Miller School of Medicine, University of Miami, Miami, FL, USA; 3Department of Ophthalmology, Faculty of Medicine, Benha University, Benha, Egypt; 4Department of Ophthalmology, Net Eye Medical Center, Gaziantep, Turkey
Correspondence: Mohamed Abou Shousha
Cornea Department, Bascom Palmer Eye Institute, Miller School of Medicine, University of Miami, 900 NW 17th Street, Miami, FL, 33136, USA
Tel +1 305-326-6000
Email [email protected]
Objective: To evaluate a deep learning-based method to autonomously detect dry eye disease (DED) in anterior segment optical coherence tomography (AS-OCT) images compared to common clinical dry eye tests.
Methods: In this study, 27,180 AS-OCT images were prospectively collected from 151 eyes of 91 patients. Images were used to train and test the deep learning model. Masked cornea specialist ophthalmologist diagnoses were used as the gold standard. Clinical dry eye tests were performed on patients in the DED group to compare the results of the model. The dry eye tests performed were tear break-up time (TBUT), Schirmer’s test, corneal staining, conjunctival staining, and Ocular Surface Disease Index (OSDI).
Results: Our deep learning model achieved an accuracy of 84.62%, sensitivity of 86.36%, and specificity of 82.35% in the diagnosis of DED. The positive likelihood ratio was 4.89, and the negative likelihood ratio was 0.17. The mean DED probability score was 0.81 ± 0.23 in the DED group and 0.20 ± 0.27 in the healthy group (P < 0.01). The deep learning model accuracy in the diagnosis of DED was significantly better than that of corneal staining, conjunctival staining, and Schirmer’s test (P < 0.05). There was no significant difference between the deep learning diagnostic accuracy and that of the OSDI and TBUT.
Conclusion: Based on preliminary results, reliable autonomous diagnosis of DED with our deep learning model was achieved, when compared with standard dry eye clinical tests that correlated significantly more or similarly to diagnoses made by cornea specialist ophthalmologists.
Keywords: dry eye disease, artificial intelligence, optical coherence tomography
Introduction
With up to 25% of patients seen in ophthalmic clinics presenting with dry eye disease (DED) related symptoms, it is important to be able to accurately and efficiently diagnose to provide proper treatment to patients.1–4 Dry eye disease can lead to a decrease in quality of life, as well as, damage to the eye.5 DED not only matters to the patients affected but also to society when you consider the economic burden of treating DED. The economic burden of DED in the United States has been calculated to cost on average US$3.84 billion annually in direct medical costs and US$55.4 billion annually when including indirect costs and productivity loss.6
Therefore, the diagnosis of DED has become a major research focus for ophthalmologists considering current diagnostic tests are time-consuming, invasive, unreliable, and poorly associated with patient’s symptoms.4,7–9 The Tear Film and Ocular Surface Society Dry Eye Workshop II (TFOS DEWS II) concluded that while there is no gold standard for diagnosis of DED, diagnosis should be based on subjects meeting a series of sensitive thresholds for multiple clinical tests with optimal cutoffs that maximize sensitivities and specificities.10 Current commonly used dry eye diagnostic tests include tear break-up time, ocular surface staining, Schirmer's test, and symptom questionnaires. Other diagnostic tests that are becoming more prevalent in clinic are tear osmolarity, tear film interferometry, ocular surface thermography, and tear film biomarkers.4,8,11 One of the most common tests performed following the patient's history and thorough slit-lamp examination is the Schirmer's test, which has been shown to be inconsistent, invasive, irritating, and affected by the position of the eye.4,12 Moreover, besides the difficulty of generating reproducible, accurate results, the cutoff value for an abnormal finding is not definitive, ranging from <5 mm to <10 mm in the literature.13 With similar problems arising from other dry eye tests commonly administered, it is understandable why dry eye is commonly misdiagnosed and requires further research into diagnostic tools.
Another research area that is receiving global attention is the use of artificial intelligence in medicine to improve diagnostic accuracy and efficiency. Artificial intelligence algorithms using deep learning have been shown to possess the ability to diagnose conditions such as lung cancer, breast cancer, skin cancer, and diabetic retinopathy.14–16 In ophthalmology, artificial intelligence has been developed to predict the likelihood of necessary future keratoplasty intervention based on optical coherence tomography (OCT) images, as well as, keratoconus detection based on OCT images.17,18 Using OCT, studies have shown it is possible to detect DED through quantification of the adhesiveness of the ocular surface, measuring the tear meniscus height, and measuring the tear meniscus volume.4,19 With other recent studies showing that there are features found in the epithelial layer of the cornea prevalent in the DED population, it is reasonable to propose that an automated deep learning algorithm could identify these features and more.14,20 Such an algorithm would have the capability of diagnosing DED regardless of the multifactorial etiology.
Our team has previously developed an autonomous deep learning model that can differentiate between healthy eyes and eyes with DED, keratoconus, or Fuchs’ endothelial dystrophy.21 For this study, our team developed a novel algorithm, from a larger set of data, focused on differentiating healthy eyes and eyes with DED. After development and training, we tested the model on an independent, unseen dataset to further validate its efficacy. We compared the results of the model to results from commonly performed dry eye tests for the dry eye disease group. This is the first study comparing a deep learning algorithm capable of diagnosing DED with standard clinical dry eye tests.
Materials and Methods
This study was approved by the Institutional Review Board of the University of Miami and adhered to the tenets of the Declaration of Helsinki and HIPAA regulations. All relevant ethical guidelines were followed, and written informed consent was obtained from each subject after an explanation of the nature and possible consequences of the study.
Patient Selection
A healthy patient was defined as having no corneal International Classification of Diseases, 10th Revision (ICD-10) diagnosis, no corneal abnormalities, and no clinical signs of dry eye disease described in any of their recorded clinical examination history. For a patient to be considered healthy they also had no abnormal dry eye test results. A patient with dry eye disease was defined as having an ICD-10 diagnosis of dry eye disease (H04.123) by a fellowship-trained American Board of Ophthalmology-certified cornea specialist and confirmation by dry eye tests performed by a study team member (C.C. and E.O.). The ophthalmologists relied on patient history and clinical dry eye tests following the recommendations of the TFOS DEWS II to reach a diagnosis. The ophthalmologists were masked to the results of the deep learning model and dry eye test results performed by a study team member. Patients with a diagnosis of DED by a cornea specialist and abnormal values for at least one of the dry eye tests were used in the training and testing phases.
Exclusion criteria consisted of active bacterial or viral ocular infection, bullous keratopathy, active or chronic allergic, bacterial, or viral infection of the ocular adnexa, refractive surgery in either eye within the last 6 months, using any ocular medication (except lubricants, mydriatics, stain, and topical anesthesia used for study assessments), current punctual occlusions inserted into either the superior lacrimal punctum or inferior lacrimal punctum of either eye, pterygium, or current contact lens wearer. Patients with any corneal ICD-10 diagnosis except dry eye disease were excluded from the study.
Dry Eye Testing
The clinical dry eye tests were performed based on the guidelines recommended by the TFOS DEWS II. Dry eye testing was performed after the OCT image was taken, therefore the staining and use of anesthetics during dry eye testing did not affect the image. The TFOS DEWS II recommends performing tests in a sequence from the least invasive to the most invasive. The dry eye tests performed, in chronological order, were the Ocular Surface Disease Index (OSDI), tear break-up time (TBUT) with fluorescein staining, corneal fluorescein staining using the NEI grading scale, conjunctival lissamine green staining using the NEI grading scale, and 5-minute Schirmer's I test with topical anesthesia. Corneal fluorescein staining was recorded using the NEI staining grid by which a score of 0–3 was assigned to each of the five corneal regions, and a total score from 0 to 15 was obtained by the summation of the five regions. For the conjunctival staining, the NEI staining score of 0–3 was applied to each of the six conjunctival regions, resulting in a total score from 0 to 18. Abnormal TBUT was defined as ≤10 s, abnormal 5-minute Schirmer's I test was defined as ≤5 mm, abnormal corneal and conjunctival staining were defined as a total score >3, and abnormal OSDI score was defined as ≥13.10,22,23 Legend of the cutoff values used can be appreciated in Supplemental Digital Content Table 1.
OCT Image Acquisition
A total of 27,180 AS-OCT images (14,040: DED; 13,140: healthy) were captured from 151 eyes (91 patients) throughout the study. From December 2016 to October 2019 scans were obtained using an HD-OCT (Envisu R2210, Bioptigen, Leica, Buffalo Grove, IL, USA) from patients during their visit to the cornea department of the Bascom Palmer Eye Institute (Figure 1). The device performs 32,000 axial scans per second with an axial resolution of approximately 3 μm. The central corneal scans were obtained using a 6 mm radial scan pattern with 36 cross-sectional images repeated five times (ie 180 in total). The patients were organized based on patient selection criteria into healthy and DED groups. The data was then stripped of all protected health identifiers.
 |
Figure 1 Anterior segment optical coherence tomography of a healthy cornea using an HD-OCT (Envisu R2210, Bioptigen, Leica, Buffalo Grove, IL, USA) collected at the Bascom Palmer Eye Institute. |
Training the Deep Learning Classification Model
Before initiating the training phase, poor-quality images were excluded by trained operators (CC and EO) to prevent the algorithm from learning unrelated features. We accomplished this by removing images that contained any of the following: decentralization, blinking, missing parts of the endothelium or epithelial layers of the cornea, and low signal-to-noise ratio. After cleaning the 20,160 training images (10,080: DED; 10,080: healthy) and removing 2292 images, 17,868 images (9013 DED; 8855: healthy) of the 112 training eyes passed the quality control step. The data was then randomly divided into two disjoint datasets (ie non-overlapping), with 80% of the images assigned to the training group and 20% assigned to the validation group. A flowchart for the distribution of images throughout the training and testing of the deep learning model is provided in Figure 2.
 |
Figure 2 Flowchart of the distribution of images throughout the training and testing of the deep learning model, including the quality control phase and grouping of images within the healthy and dry eye disease groups. |
We used a VGG19 model with the parameters of the model pre-trained on ImageNet dataset for our classification task.24 The VGG19 model consisted of 16 convolutional layers, five maximum pooling layers, three fully connected layers, and a softmax layer. The model was trained using a single GeForce GTX 1080 Ti GPU. We fine-tuned the weights by training the model using our data. We used learning rate of 0.0001, regularization weight of 0.0001 and momentum of 0.9. The image-level classification threshold was set to 0.50. The model was trained until it converged for 10 epochs. We implemented our model using MATLAB 2019b and a deep learning toolbox running on Windows 10 home edition. Training accuracy, validation accuracy, testing accuracy, and cross entropy were used to evaluate the quality of the training process. Cross entropy is a measure of the distance between the true probability distribution and the approximate probability distribution, which the training process aims to minimize.
For visualization of the learned features by the network, we plotted the activation values for different convolutional layers. We performed an occlusion test by repeatedly placing patches in the image at random values and computing the probability of detecting the disease using our network.25
Testing the Deep Learning Classification Model and Dry Eye Test Comparison
The deep learning model analyzes each of the 180 OCT images of a single eye scan independently and assigns a diagnosis of either healthy or dry eye to each image. The deep learning model assigns an overall eye diagnosis based on whether more than 50% of the images (>90 images) were diagnosed as healthy or dry eye.
After training of the model, the remaining 7020 AS-OCT images (3960: DED; 3060: healthy) of 39 eyes (24 patients) were used to test the model. There was no overlap between the training and testing sets; all the images, eyes, and patients included in the testing set were never seen before by the deep learning model. The testing set images were collected after the creation of the model and were included based on the criteria outlined in Patient Selection. Demographics for this dataset are shown in Table 1. The deep learning model automatically calculated a DED probability score of 0 to 1.
 |
Table 1 Demographics |
The results of the deep learning model were compared to each of the individual clinical dry eye test. An abnormal value for each of the dry eye tests outlined in Dry Eye Testing was considered positive for DED.
Statistical Analysis
Microsoft Excel (Redmond, Washington, version 1902) and IBM SPSS statistics (Armonk, New York, version 26) were used for statistical analyses. The Mann–Whitney U-Test was used to calculate significances between the DED group and healthy group. Significances between the deep learning model and the clinical dry eye tests were calculated using McNemar’s test. P-values less than 0.05 were considered statistically significant. Values are presented as means ± standard deviation.
Results
Training
After completion of the training, 5710 iterations, the training accuracy and validation accuracy were 100% and 99.44%, respectively. Cross entropy showed a continuous decrease to a final entropy of 1.1e-5 for the training and 0.017 for the validation (Figure 3).
 |
Figure 3 Training accuracy, validation accuracy, and cross entropy loss function plots during training phase of deep learning model. Training accuracy (performance in percentage) to correctly identify a trained image, validation accuracy (performance in percentage) to correctly identify a nontrained image (A) and cross entropy loss function (B) over 5710 iterations or training steps. |
Visualization using occlusion testing showed that the epithelial layer and tear film were the learned areas of the AS-OCT images that differentiated images with DED from healthy images (Figure 4).
 |
Figure 4 Results of the occlusion testing showing features of the OCT image recognized by the deep learning model. (A) AS-OCT images of a cornea with dry eye disease on the left and a healthy cornea on the right with (B) visualization of the learned features of the deep learning neural network. |
Testing
The mean DED probability score was 0.81 ± 0.23 in the DED group and 0.20 ± 0.27 in the healthy group, which was highly statistically significant (P < 0.01). For the DED group, 19 out of 22 eyes were classified correctly, while for the healthy group, 14 out of 17 eyes were classified correctly. The accuracy of the model in diagnosing DED was 84.62%, with a sensitivity of 86.36%, and a specificity of 82.35%. The positive likelihood ratio was 4.89, and the negative likelihood ratio was 0.17. Raw data for the DED group is shown in Supplemental Digital Content Table 2. Raw data for the healthy group is shown in Supplemental Digital Content Table 3.
Clinical Dry Eye Test Comparisons
Of the 22 DED eyes, the deep learning model and corneal fluorescein staining correctly agreed with the ophthalmologist on 7 eyes (31.82%), while the deep learning model was correct for 12 eyes (54.54%) when corneal fluorescein staining was incorrect and corneal fluorescein staining was correct for 0 eyes (0%) when the deep learning model was incorrect. This difference was highly statistically significant (P < 0.01). The comparison results between the deep learning model and the other clinical dry eye tests are reported in Table 2. A complete analysis of the comparison between the deep learning model and each of the clinical dry tests is shown in Supplemental Digital Content Table 4. The deep learning model’s diagnoses association with the ophthalmologists’ diagnoses was statistically significant when compared to corneal fluorescein staining, conjunctival lissamine green staining, and Schirmer's test diagnoses (P = 0.0015, P = 0.0012, and P = 0.0265, respectively). The difference was not statistically significant when comparing the deep learning model to TBUT and the OSDI (P = 0.1824 and P = 0.2278, respectively).
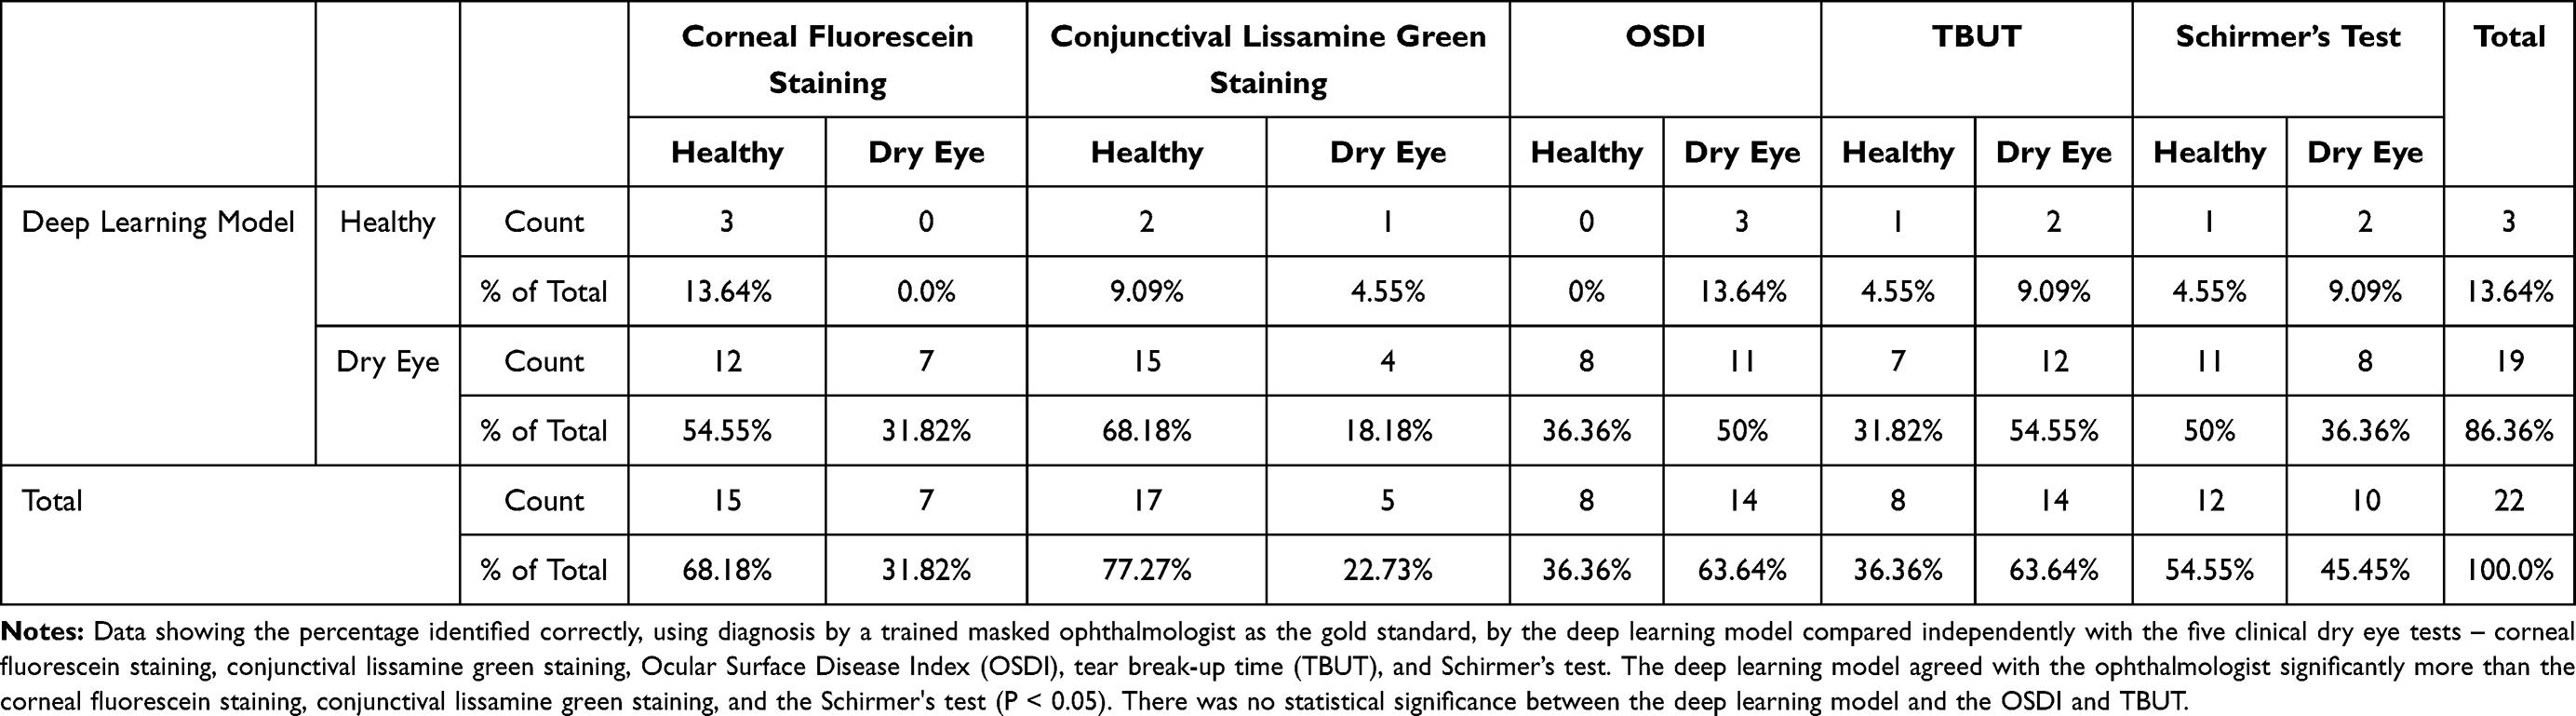 |
Table 2 Results from the Testing Phase |
Discussion
Accurately diagnosing and appropriately managing DED still remains a challenge. To date, several studies have been published evaluating the diagnostic performance of dry eye tests. However, there is no gold standard test for the diagnosis.10 In this preliminary study, our model achieved a sensitivity of 86.36%, a specificity of 82.35%, and accuracy of 84.62% in autonomously distinguishing DED from healthy. Our model used an end-to-end black box, whereas we did not input which features for the algorithm to learn. The deep learning model wasprovided raw AS-OCT images classified as either healthy or DED and was tasked with developing a method for determining features that differentiated the two groups. Our algorithm highlighted the patterns of tear film-corneal epithelium during the occlusion, proving the model was learning the correct differentiating features of the AS-OCT images. Abou Shousha et al demonstrated that an autonomous deep learning model could differentiate between healthy eyes and eyes with DED using AS-OCT images.21 To the best of our knowledge, there is no study in the literature evaluating the accuracy of deep learning-based artificial intelligence algorithms in the diagnosis of DED compared to standard clinical dry eye tests.
Anterior segment OCT (AS-OCT) main advantages include fast, non-contact, in-vivo, and quasi-histological imaging of corneal structures.26,27 With the increasing number of AS-OCT images throughout ophthalmology clinics, deep learning has become an important potential to interpret the big data. AS-OCT and its clinical applications in patients with DED have become one of the major research topics over the past decade. Our model has detected patterns in the corneal epithelium and tear film layer that could be sourced from the damage due to DED as extensively reported in the previous research. In a recent study, it has been reported that a significant correlation exists between the percentage of corneal fluorescein staining area and the percentage of the area of epithelial erosion detected by AS-OCT, in rabbits with experimental dry eye models.28 Abou Shousha et al reported that ultra-high resolution OCT reveals irregularity of epithelial surface, which can be improved after treatment in patients with dry eye.20 Another study by Deinema et al investigated the corneal reflectivity using AS-OCT in patients with DED and healthy subjects. Tear film-corner interface reflectivity has been shown to be higher in eyes with hyperosmolar tears compared to control eyes.29 Other studies involving dry eye and OCT have shown that there is a positive correlation between tear film measurements from OCT and the Schirmer's test, as well as, showing high reproducibility of tear film measurements using OCT.30,31
We found that our deep learning model’s diagnoses correlated with cornea specialist ophthalmologists’ diagnoses more closely or similarly to the results of five of the most common tests for dry eye screening. Our deep learning model agreed with ophthalmologists significantly more than the Schirmer's test, corneal fluorescein staining, and conjunctival lissamine green staining. While the model did agree with more ophthalmologists in our sample than the TBUT and OSDI, the difference was not statistically significant. Although the model did not agree with ophthalmologists significantly more than the OSDI and TBUT, there are several advantages the deep learning model using AS-OCT images has compared to these two tests.
The advantages of the deep learning approach using AS-OCT images to diagnose DED are autonomy, objectivity, quick duration, and the test is non-invasive. The main advantage of AS-OCT devices coupled with deep learning algorithms is that it is an automatic test that can be used by less specialized healthcare professionals. The OSDI is completely subjective since it is a questionnaire, while the TBUT is highly subjective given that the time between the last blink, and the breakdown of the tear film is reliant on the examiner’s impression of when the first dry spot appears. TBUT has been criticized for low reproducibility and high variations in values when retested.4,32,33 Whereas for the reproducibility of AS-OCT scans, Chan et al showed that measurements of the cornea in normal eyes and diseased eyes are highly reproducible using AS-OCT images, and Zhou et al showed reproducibility of tear film measurements with OCT.34,35 Also, the radial AS-OCT scans performed for this study had a duration time of 5 seconds, making it a convenient and quick test to conduct with a deep learning model that can autonomously diagnose. Lastly, an AS-OCT scan is non-invasive and there is no direct contact with the eye, while TBUT is mildly invasive when fluorescein is instilled into the eye, causing some patients discomfort.
While our results are promising, we used a limited dataset to achieve these results, so in future studies, the number of images should be increased to improve the accuracy and reliability. Due to the limited dataset, we were unable to age-match the two groups during the development of the deep learning model. Future studies should include increased sample size, age-matching, incorporate HD-OCT images from different devices, and collect data from multiple centers. Another limitation in our study stems from the lack of a gold standard in dry eye testing, which is a major limitation for dry eye research. Without a gold standard, we had to devise a reasonable way to define the DED group. We chose to define an eye with DED as an ICD-10 diagnosis of DED and one abnormal clinical dry eye test. Based on our results, this method was successful; however, this method could theoretically lead to our classifier misdiagnosing mild DED as healthy. While our model showed accuracy in autonomously diagnosing DED, as of now, it is unable to quantify the disease. Further development of the model will enable it to be able to classify the severity of the DED. The deep learning model was not able to differentiate DED by origin of disease, which is a consideration for further development of the model. While we trained the model on only high-quality images in the training phase, there was no quality control phase implemented during the testing phase, which may have reduced the diagnostic ability of the model. Another consideration for further development of the model includes an autonomous quality control algorithm that would remove poor-quality images when analyzing the 180 cross-sectional images.
In conclusion, AS-OCT devices coupled with autonomous diagnostic algorithms are promising for the interpretation of an increased number of ophthalmologic images. This is the first study using deep learning to diagnose DED and compare the efficacy of commonly used diagnostic tools. With further development and testing, our model potentially may be used as a tool for DED screening programs without supervision from health care providers. To enhance the accuracy of our model, further multi-center studies using larger sample sizes are required.
Author Contributions
All authors contributed to data analysis, drafting or revising the article, have agreed on the journal to which the article will be submitted, gave final approval for the version to be published, and agree to be accountable for all aspects of the work.
Funding
This study was supported by a NEI K23 award (K23EY026118), NEI core center grant to the University of Miami (P30 EY014801), and Research to Prevent Blindness (RPB). The funding organization had no role in the design or conduct of this research.
Disclosure
United States Non-Provisional Patent (Application No. 14/247903) and United States Provisional Patent (Application No. 62/445,106) (MA). United States Non-Provisional Patents (Application No. 8992023 and 61809518), and PCT/US2018/013409 (MAS and AE). Patents and PCT are owned by the University of Miami and licensed to Resolve Ophthalmics, LLC. MAS is an equity holder and sits on the Board of Directors for Resolve Ophthalmics, LLC. CC, AE, TE, EO, and MT have no conflicts of interest to declare.
References
1. O’Brien PD, Collum LMT. Dry eye: diagnosis and current treatment strategies. Curr Allergy Asthma Rep. 2004;4(4):314–319. doi:10.1007/s11882-004-0077-2
2. Moss SE, Klein R, Klein BEK. Prevalence of and risk factors for dry eye syndrome. Arch Ophthalmol. 2000;118(9):1264–1268. doi:10.1001/archopht.118.9.1264
3. Gayton JL. Etiology, prevalence, and treatment of dry eye disease. Clin Ophthalmol. 2009;3:405–412. doi:10.2147/OPTH.S5555
4. Zeev MS-B, Miller DD, Latkany R. Diagnosis of dry eye disease and emerging technologies. Clin Ophthalmol. 2014;8:581–590.
5. Miljanović B, Dana R, Sullivan DA, Schaumberg DA. Impact of dry eye syndrome on vision-related quality of life. Am J Ophthalmol. 2007;143(3):409–15.e2. doi:10.1016/j.ajo.2006.11.060
6. McDonald M, Patel DA, Keith MS, Snedecor SJ. Economic and humanistic burden of dry eye disease in Europe, North America, and Asia: a systematic literature review. Ocul Surf. 2016;14(2):144–167. doi:10.1016/j.jtos.2015.11.002
7. Bron AJ, Tomlinson A, Foulks GN, et al. Rethinking dry eye disease: a perspective on clinical implications. Ocul Surf. 2014;12(2):S1–S31.
8. Pflugfelder SC, Tseng SCG, Sanabria O, et al. Evaluation of subjective assessments and objective diagnostic tests for diagnosing tear-film disorders known to cause ocular irritation. Cornea. 1998;17(1):38. doi:10.1097/00003226-199801000-00007
9. Nichols KK, Nichols JJ, Mitchell GL. The lack of association between signs and symptoms in patients with dry eye disease. Cornea. 2004;23(8):762–770. doi:10.1097/01.ico.0000133997.07144.9e
10. Wolffsohn JS, Arita R, Chalmers R, et al. TFOS DEWS II diagnostic methodology report. Ocul Surf. 2017;15(3):539–574.
11. Sullivan BD, Whitmer D, Nichols KK, et al. An objective approach to dry eye disease severity. Invest Ophthalmol Vis Sci. 2010;51(12):6125–6130. doi:10.1167/iovs.10-5390
12. Nichols KK, Mitchell GL, Zadnik K. The repeatability of clinical measurements of dry eye. Cornea. 2004;23(3):272–285. doi:10.1097/00003226-200404000-00010
13. Danjo Y. Diagnostic usefulness and cutoff value of Schirmer’s I test in the Japanese diagnostic criteria of dry eye. Graefes Arch Clin Exp Ophthalmol. 1997;235(12):761–766. doi:10.1007/BF02332860
14. Hosny A, Parmar C, Quackenbush J, Schwartz LH, Aerts HJWL. Artificial intelligence in radiology. Nat Rev Cancer. 2018;18(8):500–510. doi:10.1038/s41568-018-0016-5
15. Wong TY, Bressler NM. Artificial intelligence with deep learning technology looks into diabetic retinopathy screening. JAMA. 2016;316(22):2366–2367. doi:10.1001/jama.2016.17563
16. Esteva A, Kuprel B, Novoa RA, et al. Dermatologist-level classification of skin cancer with deep neural networks. Nature. 2017;542(7639):115–118. doi:10.1038/nature21056
17. Yousefi S, Takahashi H, Hayashi T, et al. Predicting the likelihood of need for future keratoplasty intervention using artificial intelligence. Ocul Surf. 2020;18(2):320–325. doi:10.1016/j.jtos.2020.02.008
18. Kamiya K, Ayatsuka Y, Kato Y, et al. Keratoconus detection using deep learning of colour-coded maps with anterior segment optical coherence tomography: a diagnostic accuracy study. BMJ Open. 2019;9(9):e031313–e. doi:10.1136/bmjopen-2019-031313
19. Napoli PE, Coronella F, Satta GM, Zucca IA, Fossarello M. A novel OCT technique to measure in vivo the corneal adhesiveness for sodium carboxymethylcellulose in humans and its validity in the diagnosis of dry eye. Invest Ophthalmol Vis Sci. 2014;55(5):3179–3185. doi:10.1167/iovs.13-13613
20. Abou Shousha M, Wang J, Kontadakis G, et al. Corneal epithelial thickness profile in dry-eye disease. Eye. 2019;34(5):915–922.
21. Elsawy A, Eleiwa T, Chase C, et al. Multi-disease deep-learning neural network for the diagnosis of corneal diseases. Am J Ophthalmol. 2021;226:252–261. doi:10.1016/j.ajo.2021.01.018
22. Lemp MA. Report of the National Eye Institute/Industry workshop on clinical trials in dry eyes. Clao J. 1995;21(4):221–232.
23. Schiffman RM, Christianson MD, Jacobsen G, Hirsch JD, Reis BL. Reliability and validity of the ocular surface disease Index. Arch Ophthalmol. 2000;118(5):615–621. doi:10.1001/archopht.118.5.615
24. Simonyan K, Zisserman A. Very deep convolutional networks for large-scale image recognition. arXiv Preprint: arXiv; 2014.
25. Zeiler MD, Fergus R. Visualizing and understanding convolutional networks; 2013.
26. Eleiwa T, Elsawy A, Tolba M, Feuer W, Yoo S, Shousha MA. Diagnostic performance of 3-dimensional thickness of the endothelium–descemet complex in Fuchs’ endothelial cell corneal dystrophy. Ophthalmology. 2020;127(7):874–887.
27. Eleiwa TK, Cook JC, Elsawy AS, et al. Diagnostic performance of three-dimensional endothelium/descemet membrane complex thickness maps in active corneal graft rejection. Am J Ophthalmol. 2020;210:48–58. doi:10.1016/j.ajo.2019.10.022
28. Sher I, Tzameret A, Szalapak AM, et al. Multimodal assessment of corneal erosions using optical coherence tomography and automated grading of fluorescein staining in a rabbit dry eye model. Transl Vis Sci Technol. 2019;8(1):27. doi:10.1167/tvst.8.1.27
29. Deinema LA, Vingrys AJ, Chinnery HR, Downie LE. Optical coherence tomography reveals changes to corneal reflectivity and thickness in individuals with tear hyperosmolarity. Transl Vis Sci Technol. 2017;6(3):6. doi:10.1167/tvst.6.3.6
30. Werkmeister RM, Alex A, Kaya S, et al. Measurement of tear film thickness using ultrahigh-resolution optical coherence tomography. Invest Ophthalmol Vis Sci. 2013;54(8):5578–5583. doi:10.1167/iovs.13-11920
31. Altan-Yaycioglu R, Sizmaz S, Canan H, Coban-Karatas M. Optical coherence tomography for measuring the tear film meniscus: correlation with Schirmer test and tear-film breakup time. Curr Eye Res. 2013;38(7):736–742. doi:10.3109/02713683.2013.774422
32. Savini G, Prabhawasat P, Kojima T, Grueterich M, Espana E, Goto E. The challenge of dry eye diagnosis. Clin Ophthalmol. 2008;2(1):31–55. doi:10.2147/OPTH.S1496
33. Vanley GT, Leopold IH, Gregg TH. Interpretation of tear film breakup. Arch Ophthalmol. 1977;95(3):445–448. doi:10.1001/archopht.1977.04450030087010
34. Chan JB, Yuen LH, Huang EH, et al. Reproducibility of cornea measurements in anterior segment OCT images of normal eyes and eyes with Bullous Keratopathy analyzed with the Zhongshan assessment program. Invest Ophthalmol Vis Sci. 2011;52(12):8884–8890. doi:10.1167/iovs.10-6411
35. Zhou S, Li Y, Lu AT-H, et al. Reproducibility of tear meniscus measurement by Fourier-domain optical coherence tomography: a pilot study. Ophthalmic Surg Lasers Imaging. 2009;40(5):442–447. doi:10.3928/15428877-20090901-01
 © 2021 The Author(s). This work is published and licensed by Dove Medical Press Limited. The
full terms of this license are available at https://www.dovepress.com/terms
and incorporate the Creative Commons Attribution
- Non Commercial (unported, 3.0) License.
By accessing the work you hereby accept the Terms. Non-commercial uses of the work are permitted
without any further permission from Dove Medical Press Limited, provided the work is properly
attributed. For permission for commercial use of this work, please see paragraphs 4.2 and 5 of our Terms.
© 2021 The Author(s). This work is published and licensed by Dove Medical Press Limited. The
full terms of this license are available at https://www.dovepress.com/terms
and incorporate the Creative Commons Attribution
- Non Commercial (unported, 3.0) License.
By accessing the work you hereby accept the Terms. Non-commercial uses of the work are permitted
without any further permission from Dove Medical Press Limited, provided the work is properly
attributed. For permission for commercial use of this work, please see paragraphs 4.2 and 5 of our Terms.