")
Back to Journals » Risk Management and Healthcare Policy » Volume 15
Comparison Between Statistical Model and Machine Learning Methods for Predicting the Risk of Renal Function Decline Using Routine Clinical Data in Health Screening
Authors Cao X, Lin Y, Yang B, Li Y, Zhou J
Received 5 November 2021
Accepted for publication 16 April 2022
Published 26 April 2022 Volume 2022:15 Pages 817—826
DOI https://doi.org/10.2147/RMHP.S346856
Checked for plagiarism Yes
Review by Single anonymous peer review
Peer reviewer comments 2
Editor who approved publication: Professor Mecit Can Emre Simsekler
Xia Cao,1– 3 Yanhui Lin,1– 3 Binfang Yang,1– 3 Ying Li,1– 3 Jiansong Zhou4
1Health Management Center, The Third Xiangya Hospital, Central South University, Changsha, Hunan, People’s Republic of China; 2Health Management Research Center, Central South University, Changsha, Hunan, People’s Republic of China; 3Hunan Chronic Disease Health Management Medical Research Center, Central South University, Changsha, Hunan, People’s Republic of China; 4National Clinical Research Center for Mental Disorders, and Department of Psychiatry, The Second Xiangya Hospital, Central South University, Changsha, Hunan, People’s Republic of China
Correspondence: Jiansong Zhou, National Clinical Research Center for Mental Disorders, and Department of Psychiatry, The Second Xiangya Hospital, Central South University, Changsha, 410011, People’s Republic of China, Tel/Fax +86 073188618573, Email [email protected]
Purpose: Using machine learning method to predict and judge unknown data offers opportunity to improve accuracy by exploring complex interactions between risk factors. Therefore, we evaluate the performance of machine learning (ML) algorithms and to compare them with logistic regression for predicting the risk of renal function decline (RFD) using routine clinical data.
Patients and Methods: This retrospective cohort study includes datasets from 2166 subjects, aged 35– 74 years old, provided by an adult health screening follow-up program between 2010 and 2020. Seven different ML models were considered – random forest, gradient boosting, multilayer perceptron, support vector machine, K-nearest neighbors, adaptive boosting, and decision tree - and were compared with standard logistic regression. There were 24 independent variables, and the baseline estimate glomerular filtration rate (eGFR) was used as the predictive variable.
Results: A total of 2166 participants (mean age 49.2± 11.2 years old, 63.3% males) were enrolled and randomly divided into a training set (n=1732) and a test set (n=434). The area under receiver operating characteristic curve (AUROC) for detecting RFD corresponding to the different models were above 0.85 during the training phase. The gradient boosting algorithms exhibited the best average prediction accuracy (AUROC: 0.914) among all algorithms validated in this study. Based on AUROC, the ML algorithms improved the RFD prediction performance, compared to logistic regression model (AUROC:0.882), except the K-nearest neighbors and decision tree algorithms (AUROC:0.854 and 0.824, respectively). However, the improvement differences with logistic regression were small (less than 4%) and nonsignificant.
Conclusion: Our results indicate that the proposed health screening dataset-based RFD prediction model using ML algorithms is readily applicable, produces validated results. But logistic regression yields as good performance as ML models to predict the risk of RFD with simple clinical predictors.
Keywords: deep learning, chronic kidney disease, algorithm, health examination
Introduction
Globally, chronic kidney disease (CKD) is recognized as a public health challenge and leads to high rates of morbidity, mortality and healthcare expenditure. In 2017, there were 1.2 million people died from CKD and 697.5 million cases of all-stage CKD were recorded, for a global prevalence of 9.1%.1 In 2012, the overall prevalence of CKD was 10.8% in China.2 The growth of noncommunicable diseases under profound societal and environmental changes has shifted the spectrum of CKD in China toward patterns similar to those of developed countries, which have enormous impacts on the Chinese health-care system.3
Early detection and surveillance, which enable its prompt management, comprise the main clinical management strategy. A practical prediction model would allow increased surveillance of at-risk population and reduce surveillance of population who are less likely to develop CKD. Established approaches to CKD risk assessment, such as the equations for predicting risk of incident CKD developed from more than 5 million individuals from 34 multinational cohorts, predict future risk of CKD based on well-established risk factors such as age, gender, estimated glomerular filtration rate (eGFR), history of cardiovascular disease, ever smoker, hypertension, body mass index, and albuminuria concentration.4 These risk factors have recognized associations with CKD and feature within most CKD risk prediction tools (eg, CRONICAS-CKD risk score, Framingham, D:A:D study).5–7
However, current standard disease risk assessment models make an implicit assumption that each risk factor is related in a linear fashion to disease outcomes.8 Studies have been conducted to try to use routinely obtained laboratory tests to predict disease progression.9 Such models may oversimplify the complex relationships between variables, which contain a large number of risk factors with non-linear interaction. Machine learning (ML) methods have gained traction as an alternative approach to standard prediction modelling that may address current limitations, which include notably neural networks, support vector machine, random forest, and gradient boosting machine, and etc. One of the main strengths of these techniques is that they capture nonlinear relationships in the data, as well as interaction between predictors.10–12 In addition, ML may identify latent variables that are unlikely to be observed, but might be inferred from other variables.13
Accordingly, in the present study, we aimed to develop models using ML to predict the renal function decline (RFD) using health screening record data in a retrospective cohort study with moderate sample size and compare the performance of the models developed from ML and the traditional regression technique. Furthermore, we determined the importance of contributing factors related to the RFD prediction performance.
Materials and Methods
Study Population
We conducted analyses in the XY3CKD Follow-up Program, a cohort study of CKD monitoring established by the Health Management Center of the Third Xiangya Hospital in Chinese adults aged 35–74 years.14,15 The baseline study was conducted between 2010 and 2014 on a total of 2762 participants. The follow-up health examinations were conducted ~6 years (6.45 ± 0.82 years) after the baseline visit between 2017 and 2020 on 2166 participants (response rate 78.4% among eligible participants). Ineligible participants included people who died and who failed to complete the follow-up health surveys or questionnaires between baseline and follow-up visit. All eligible participants responded to a standardized interview, and underwent a clinical examination at both baseline and follow-up visits. The research protocol and procedures were approved by the Research Ethics Board (IRB approval number: 2016S077) at the Third Xiangya Hospital, Central South University. The IRB granted a waiver of the requirement to obtain informed consent, given the retrospective study design and the use of medical records from participants whose medical care has been completed. Participants’ clinical and demographic information were anonymized before analysis. This study was conducted in accordance with the Declaration of Helsinki on human research.
Renal Outcome Definitions
Only new cases (incident cases) reported at the follow-up visit were considered. The prevalent cases at baseline were excluded from the analysis. Two outcomes were recognized as RFD: rapid decline of renal function, new-onset CKD, and combined renal outcomes. Rapid decline of renal function was defined as eGFR loss of >3 mL/min/1.73 m2/year.16 New-onset CKD was defined as follow-up eGFR < 60 mL/min/1.73 m2 or positive proteinuria. To avoid participants with minor fluctuations in eGFR that may be due to “noise”, the definition of new-onset CKD also included an annual decrease in eGFR exceeding 1 mL/min/1.73 m2.17 Serum creatinine (Scr) was measured by automatic biochemical analyzer (Hitachi automatic biochemical analyzer, 7600, Japan) in the central laboratory of the Third Xiangya hospital, Central South University. eGFR was calculated based on serum creatinine using CKD-EPI equation.18 Diagnosis of proteinuria was made using a urine dipstick test. Positive proteinuria was considered to be present for a dipstick result of ≥1+, corresponding to a urinary protein level > 30 mg/dL.19
Predictors Considered and Measurements
For the renal outcome, a set of predictors at baseline was considered based on clinical knowledge and evidence-based practice,4,20 including age (continuous), gender (binary), body mass index (BMI, continuous), waist circumference (WC, continuous), smoking status (binary), alcohol consumption (binary), physical inactivity (binary), hypertension (HTN, binary), type 2 diabetes mellitus (T2DM, binary), family history of HTN (binary), family history of T2DM (binary), systolic blood pressure (SBP, continuous), diastolic blood pressure (DBP, continuous), hemoglobin (Hb, continuous), alanine aminotransferase (ALT, continuous), total bilirubin (TBIL, continuous), blood urea nitrogen (BUN, continuous), serum creatinine (Scr, continuous), serum uric acid (SUA, continuous), fasting plasma glucose (FPG, continuous), total cholesterol (TC, continuous), triglycerides (TG, continuous), low-density lipoprotein (LDL-c, continuous), high-density lipoprotein (HDL-c, continuous).
Current smokers were those who had smoked within one year of the survey date and physical inactivity was defined as leisure-time activity less than 4 h weekly and predominantly sedentary work. Current drinkers were those who had drunk alcohol at least 12 times but with an average daily consumption of alcohol ≤ 20 g during the past year. Seated blood pressure was measured by skilled, trained nurses after subjects had rested for 15 min. The average of three readings was recorded. The formula for BMI was weight (kg) divided by height squared (m2) by measurement. Individuals were categorized as normal weight (18.5–23.9 kg/m2), overweight (24–27.9 kg/m2), and obese (≥28 kg/m2) according to the Chinese standard.21 Blood samples and first-void urine samples were collected between 08:00 and 10:00 a.m. after fasting overnight. Using standard hospital assays, the relevant blood biochemical indexes were measured.15 The proportion of missing values was overall low (<2%) and they were handled by Median imputation, a common approach to dealing with missing values in machine-learning algorithms.22 For demographic categorical variables, missing values were given a separate category of `unknown’ in the analyses (Supplemental Table 1).
Architecture of the Renal Function Decline Prediction Model
The architecture of the proposed RFD prediction model is shown in Figure 1. All analysis and model creation were performed in the Python computing environment (Python version 3.6.8; Python Software Foundation, 2019), using the Scikit-learn library (Pedregosa et al, 2011). The details for TRIPOD checklist and data extraction are shown in Supplementary Table 2. Eight different models were considered: logistic regression (LR), random forest (RF), gradient boosting (GB), support vector machine (SVM), K-nearest neighbors (K-NN), adaptive boosting (AB), decision tree (DT), and multilayer perception (MLP). We compared the performance of the models developed from ML and the dichotomy logistic regression. Model performances were assessed using the area under the receiver operating characteristic curve (AUROC), applying five-fold cross-validation to the datasets.
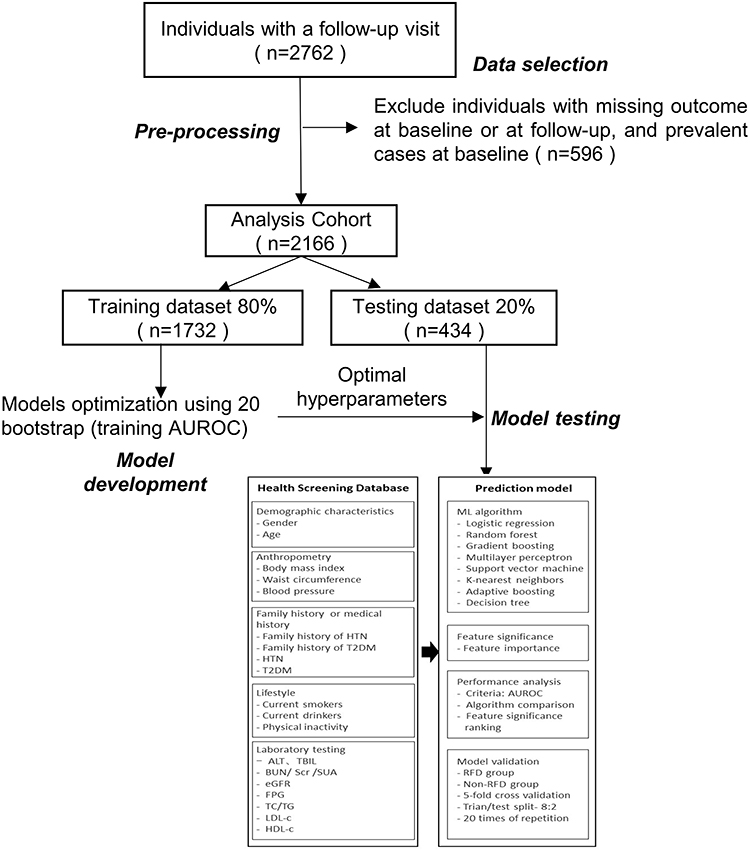 |
Figure 1 Study process and architecture of the RFD prediction model. |
The analysis dataset was randomly split into training (80%) and testing (20%) datasets, stratified on the incidence of the cases (to have the same incidence of cases in the training and testing data sets). To offset any random sampling effect, the model reiterated the same validation 20 times, the minimum number of iterations to produce the same result. Then, each model represented the final performance comparison results in the average score of AUROC values, which were statistically compared by paired DeLong’s test. Twenty-four contributing factors were selected and used to build the renal function decline prediction model, and also to measure the relative feature significance contributing to the performance of the model (Figure 1).
Comparison of Prediction Model Performances
The AUROC with their 95% confidence intervals (CIs), sensitivity and specificity were calculated for performance comparison of the renal function decline prediction model using various ML algorithms. The thresholds for the cutoff were calculated using Youden’s index.23 The calculated AUROC value was selected as the main metric to compare the performance of the prediction models. The testing AUROC values corresponding to the different models were compared using paired Delong’s test.24 To better evaluate the models’ performance, we further compared the AUROC from each resampling calculation based on a paired t-test. P < 0.05 was regarded as significant. We applied the grid search method, supported by the scikit-learn package to select the optimal hyperparameters of the predictive model algorithms.
For each model, a single set of parameters was fitted using re-sampling approach, which were adjusted to obtain the average performance index. As shown in Supplemental Table 4, the technical parameters of the selected prediction models were listed for the optimization of the equations.
Analysis of Contributing Factors Affecting the Prediction Performance
To improve the prediction model’s performance, it is important to make clear which factors contribute the most to the performance of the model. Gradient boosting was used to estimate the variable importance of each predictor and was calculated by feature importance method to rank their relative influence on the risk of onset of cases.25
Statistical Analysis
Continuous variables were expressed as mean ± standard deviation (SD) or median (Q1–Q3, first and third quartiles), according to their Gaussian or non-Gaussian distribution. Categorical variables were expressed as frequencies and percentages. Independent t-tests or Mann–Whitney U-test were used to compare the continuous variables between the RFD and non-RFD groups. Chi-square test or Fisher’s exact test were performed to compare the categorical variables between the groups. All statistical analyses were performed using SPSS 23.0 (IBM Inc., Armonk, NY, USA).
Results
Data Extraction
After exclusion of individuals with missing outcome at baseline or at follow-up, and prevalent cases at baseline, 2166 individuals (male, 63.3%; mean age, 49.2±11.2 years) were included for analyses (Figure 1). The incidences of RFD cases were 24.7% (536/2166) during the 6-year follow-up period. This cohort was then randomly split into an 80% sample of 1732 subjects to train the machine-learning algorithms and the remaining sample of 434 subjects for validation.
Baseline Characteristics of Subjects
There was significantly fewer female than male (84.14% M, 15.86% F) in RFD cases while there was only slightly more male than female in non-RFD cases (56.41% M, 43.59% F). The mean baseline age of RFD subjects was 54.91 years compared to 47.25 years in non-RFD subjects (P < 0.001). Overall, there were no significant differences in the proportion of DM, family history of HTN or DM and in the level of ALT, TBIL, TC and TG between the two groups. Further demographic features and RFD-related factors of both the non-RFD and RFD groups are presented in Table 1.
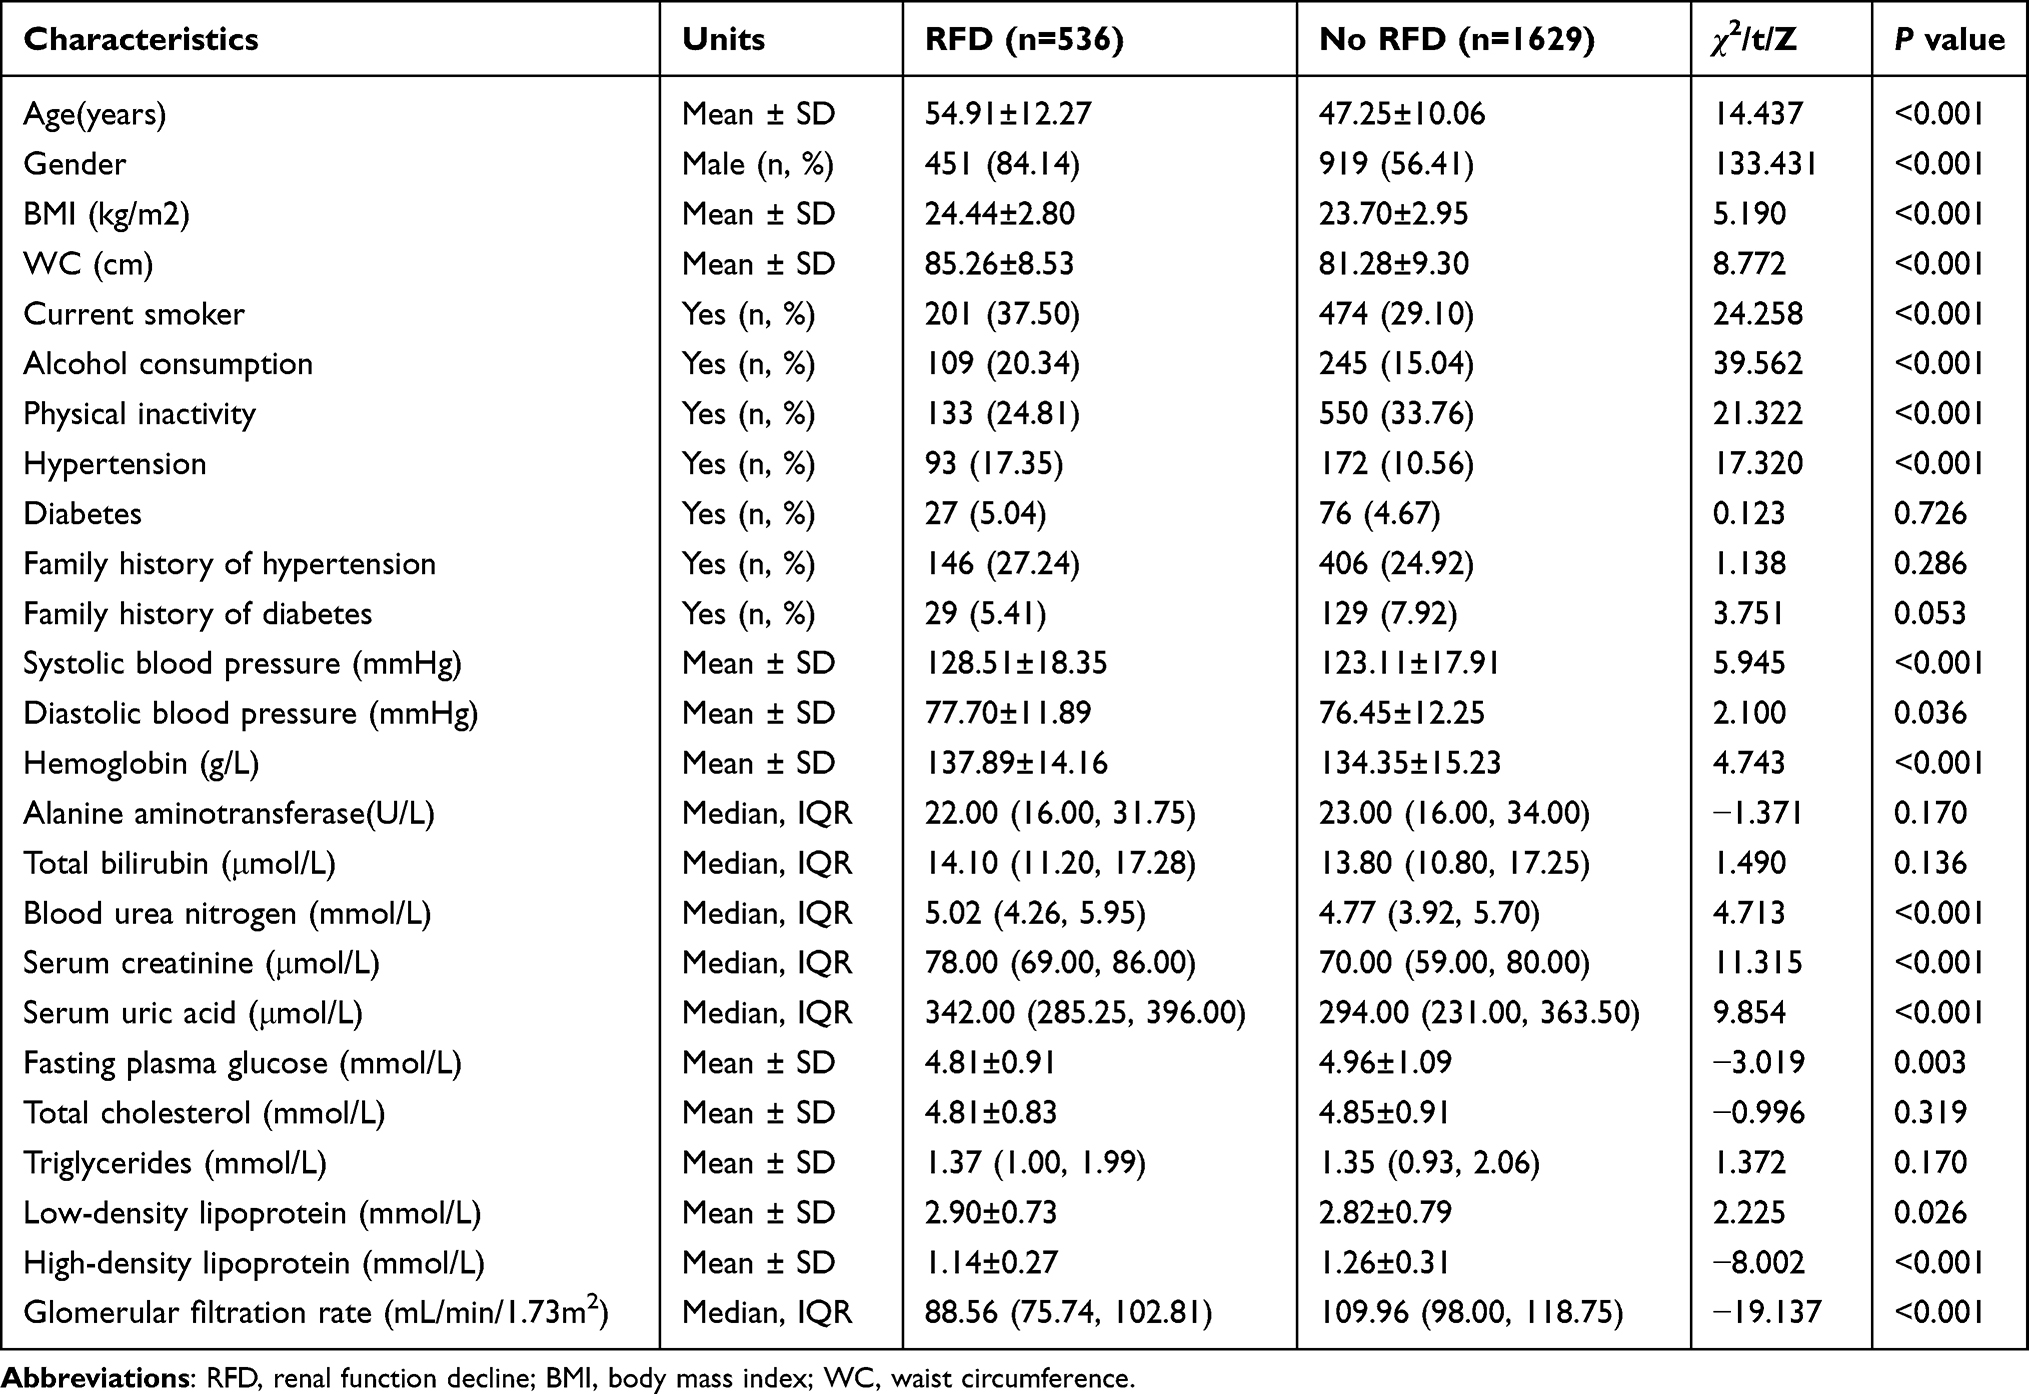 |
Table 1 Characteristics of the Populations at Baseline According to Renal Function Decline (RFD) at Follow-Up (n=2166) |
Comparisons of Prediction Model Performance
To compare the accuracy of the performance of the RFD prediction models, we validated the ML algorithms and logistic regression using 24 contributing factors based on AUROC values (Figure 2, Table 2 and Supplemental Figure 1). The AUROC was calculated both in the training dataset and in the testing dataset. As shown in Figure 2A, most models had AUROC values above 0.90 in the training dataset, but the value of logistic regression was lower (0.89). Table 2 and Figure 2B present the predictive performance in the testing dataset. The logistic regression risk model served as a baseline for comparison (AUROC 0.882, 95% CI 0.878–0.891). Although the testing predictive performance were slightly lower, with mean differences “training – testing” equal to 7.31%, was similar to the training dataset. The gradient boosting reached the best average prediction accuracy among all utilized algorithms (AUROC 0.914, 95% CI 0.853–0.952).
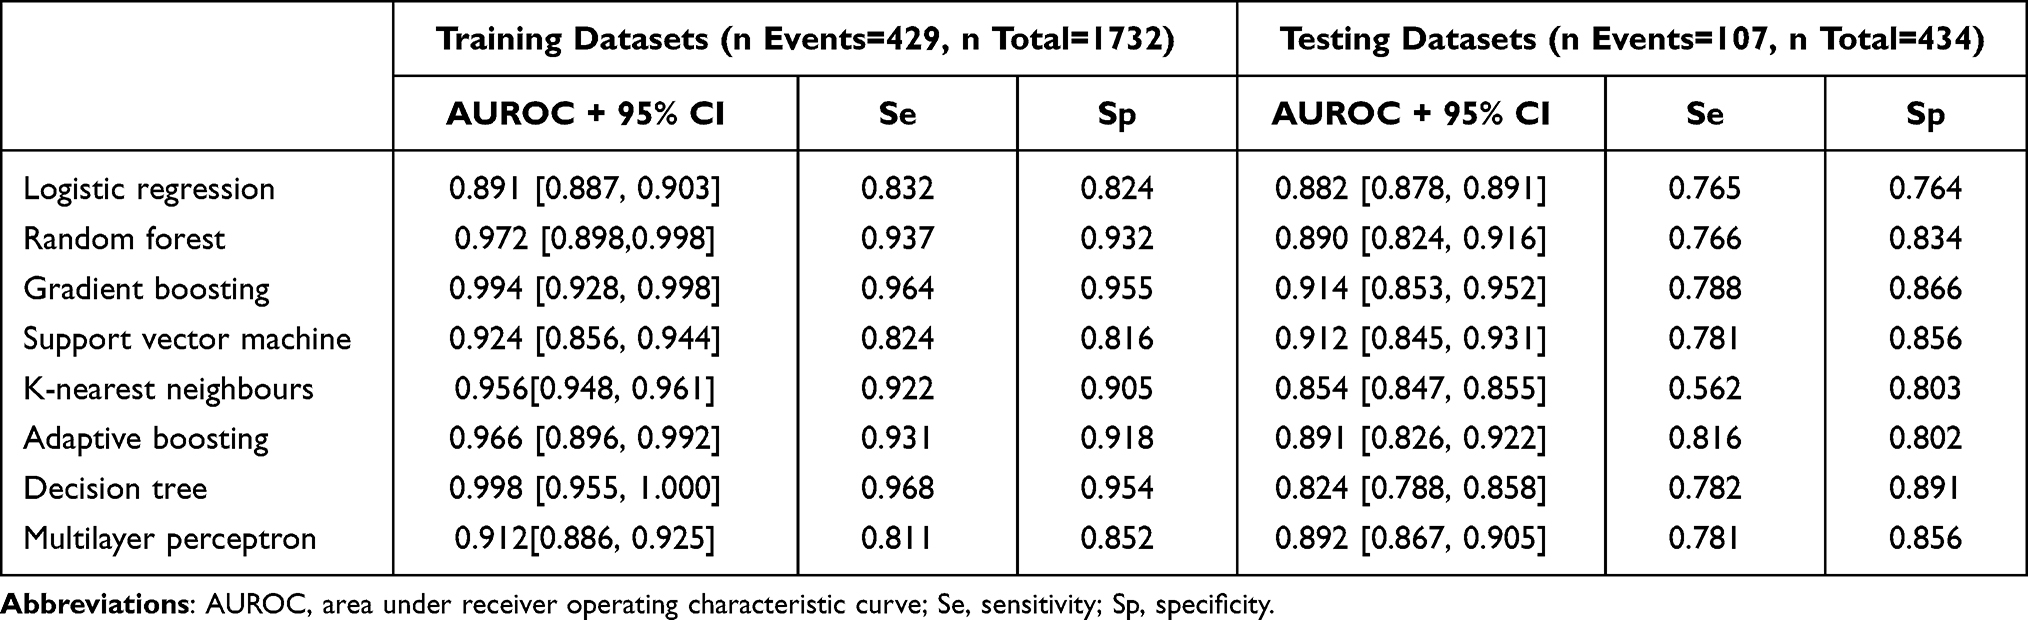 |
Table 2 Predictive Performance Expressed in Area Under Receiver Operating Characteristic Curve, Sensitivity and Specificity, of the Eight Models Considered to Predict Renal Function Decline in the Training and Testing Datasets |
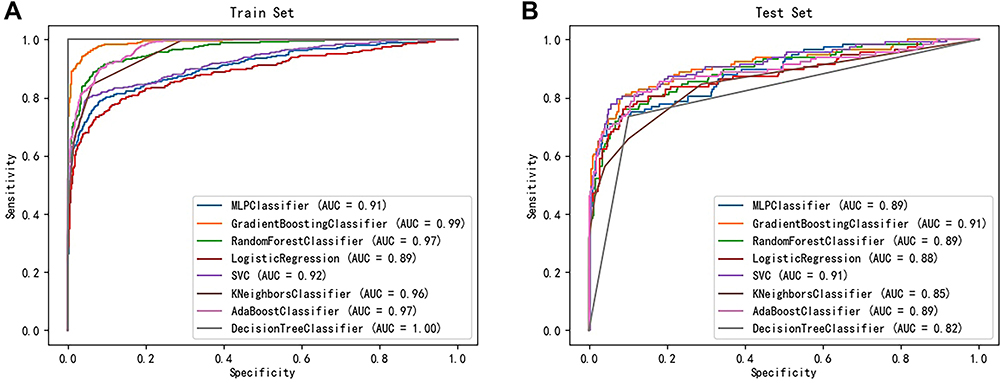 |
Figure 2 Receiver operating characteristics curve of the prediction performance for each algorithm in the training set (A) and testing set (B), respectively. |
We further compared each model based on the AUROC mean and paired t-test (Table 3). Compared to the other models, LG, RF, GB, SVM, AB and MLP showed no statistical significance, implying that these models were similar in terms of their predictive power. Although most of the machine-learning algorithms tested showed a degree of improvements in discrimination compared to the baseline model (from ΔAUROC = 0.9% for RF to ΔAUROC = 3.6% for GB) except for K-NN and DT algorithms, the improvement differences in predictive power compared with LG were small and nonsignificant (P ˃ 0.05).
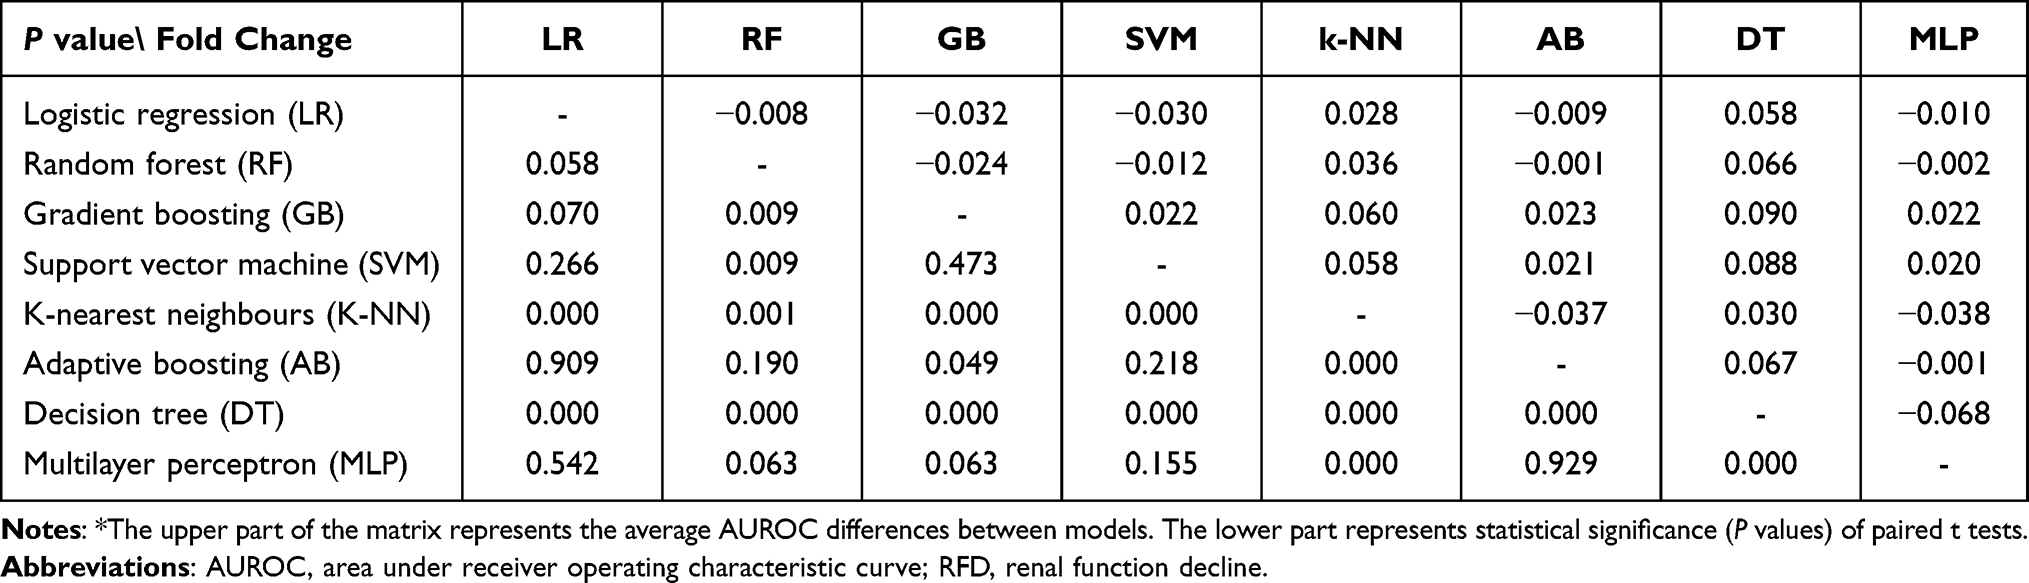 |
Table 3 Comparison of AUROCs of the RFD Prediction Models* |
Contributing Factors for the Prediction Model Performance
The significance of contributing factors analyzed by the feature importance method (gradient boosting-based) are shown in Table 4. Of the 24 variables considered in this study, age was the most important factor contributing to the performance of the RFD prediction model, followed by Scr, SUA, WC, and SBP. The other factors related to medical and behavioral features presented a lower significance of contribution to the prediction performance than the top five factors. Among laboratory findings, hemoglobin level and blood urea nitrogen were found to be in the top 10 factors. Alcohol consumption and current smoking were also included in the top 10 factors. Meanwhile, we analyzed the significance of contributing factors based on logistic regression (Supplemental Table 3). Except for slight differences in ranking of the top 10 predictors between the two algorithms, almost marginal differences were observed.
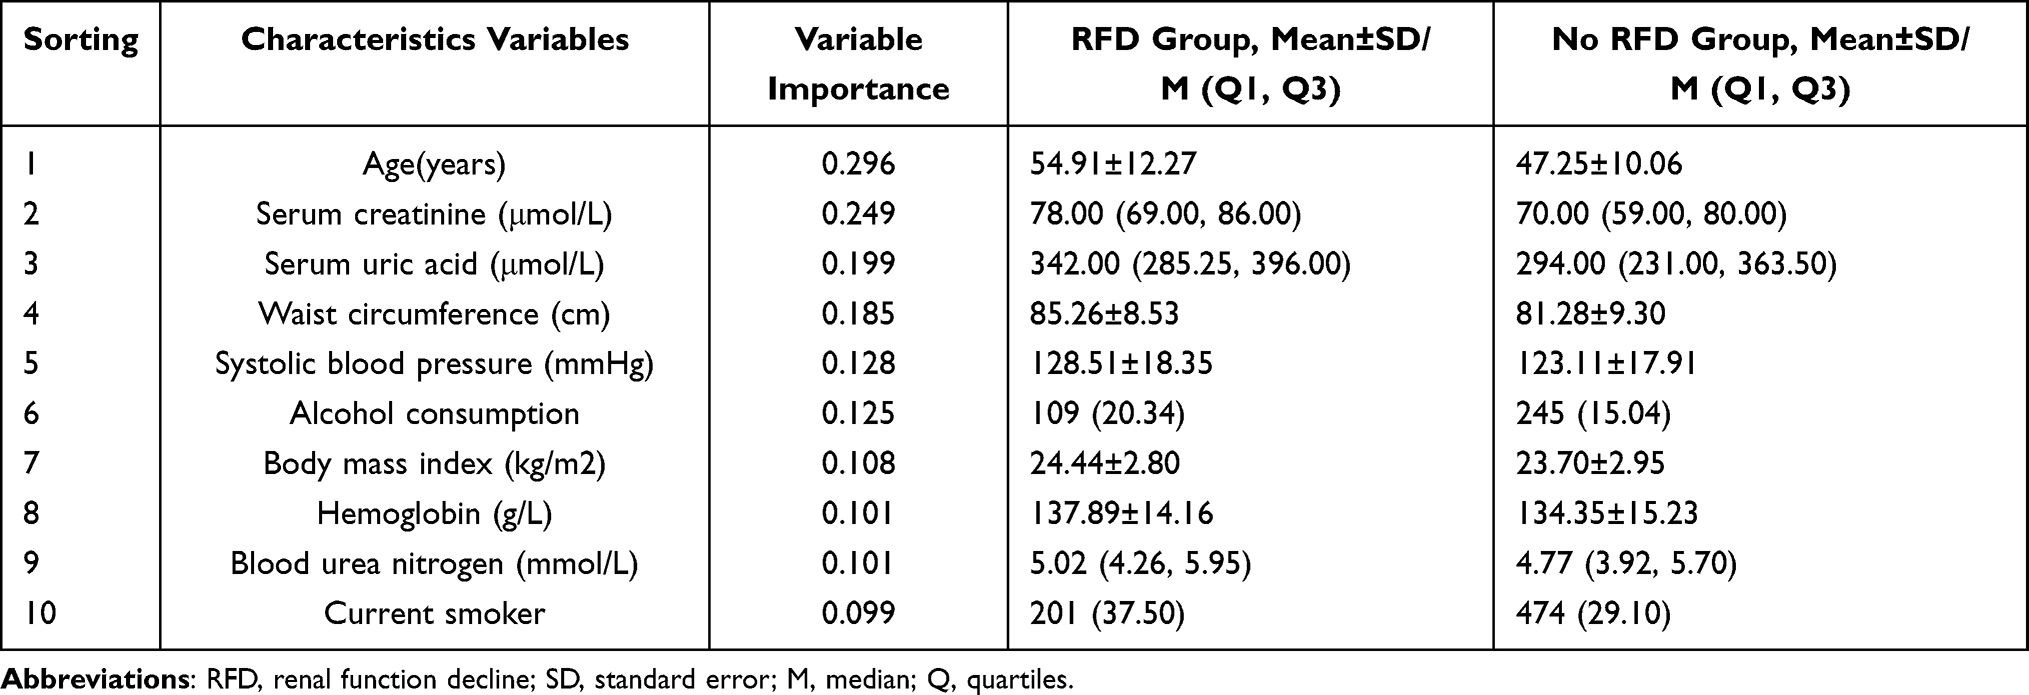 |
Table 4 Top 10 Variables Identified by Feature Importance Listed in Descending Order Based on Gradient Boosting Model and Their Distributions |
Discussion
Early identification of individuals at elevated risk of RFD could improve clinical care through enhanced surveillance and better management of underlying health conditions. In this epidemiological study of moderate sample size, we showed that the proposed health screening dataset-based RFD prediction model using ML algorithms is readily applicable, produces validated results. But logistic regression yields as good performance as ML models to predict the risk of RFD with simple clinical predictors. The training and testing datasets were close in terms of predictive performances, suggesting a low risk of overfitting. The nearly 7.3% difference in the predictive performance (AUROC) between the training and testing datasets might be attributed to differences in running patterns between individuals in each dataset or mainly limited to noise. The gradient boosting performed the best, with predictive accuracy improving by 3.6%. But the improvement differences were small (less than 4%) and nonsignificant (P ˃ 0.05). In accordance with previous studies,10,31 it indicated logistic regression yields as good performance as ML models to predict the risk of RFD with simple clinical predictors. The most influent variables were consistent with prior knowledge or evidence-based practice on CKD and renal impairment.
The primary strength of our study is that because the prediction model was established based only on existing health screening cohort data, we can suggest that easier and more efficient RFD prediction is possible by using ML algorithms. As more and more Chinese urban residents undergo periodic health screening every 1–2 years under medical benefits, it is also easy to acquire the routine data. Therefore, this method reduces additional costs and burdens in collecting baseline data compared to the traditional chronic disease’s prediction models. Moreover, our study also demonstrates application of a series of machine learning algorithms, as well as model evaluation techniques, that are lacking in existing applications of machine-learning to clinical data.26 Our results are consistent with previous studies in more selected populations.27,28 For example, a retrospective cohort study of 4104 renal cell carcinoma (RCC) patients in South Korea found that the application of ML algorithms improves the predictability of acute kidney injury after nephrectomy for RCC, and these models perform better than conventional logistic regression-based models.27
Recently, several studies have applied ML algorithms to predict CKD. Shih et al developed a 5-year CKD risk prediction model using ML models for health examination adults.29 In this study, the C4.5 decision tree algorithm was the best performing model with AUROC 0.788. Their results are similar to ours in that the performance of their predictive model based on ML algorithms was better than that of the statistical model. In a study predicting 1-year CKD risk using deidentified electronic health record data on a retrospective cohort of 14,039 adult patients with type 2 diabetes, they found the gradient boosting model was the best performing model with AUROC 0.83 (95% CI 0.76–0.85).30 These results are similar to ours. The findings of this study were consistent with those of previous reports, including Xiao’s report on the prediction of chronic kidney disease in proteinuria and a prospective multicenter cohort study of individual prediction of CKD in people living with human immunodeficiency virus in the baseline eGFR [32].31 The findings of age and uric acid level (UA) are consistent with previous studies following Mahmood et al and Yu et al32,33 Similarly, Bradshaw et al, Yang et al and Umesawa et al reported that waist circumference (WC), systolic blood pressure (SBP), and current smoking are critical for prediction of RFD.34–36
As mentioned above, the primary purpose of our study is how to predict RFD who are asymptomatic and who only undergo a routine adult health screening simply and effectively. All of these risk factors need to be considered in a comprehensive approach to clinical prevention of CKD to successfully tackle and specifically target the high-risk exposures in the certain population. There is consensus that preclinical management of early CKD will benefit high-risk groups.37 Many of the risk factors that are possibly associated with early CKD awareness, ie, management of obesity, hyperuricemia and hypertension, are interesting and warrant further investigation.
Behavioral factors such as smoking, and alcohol consumption also represented low contribution importance. In general, social, behavioral, and environmental factors had a lower direct influence on CKD compared to medical issues.38 Another notable finding is that gender did not significantly affect the performance of the RFD prediction model, even lower than some behavioral factors. Gender has been known as an important risk factor for CKD, but our results are somewhat in disagreement with this.39 In a previous epidemiologic cohort study,40 the physiological decline of renal function during aging is significantly slower in healthy females than in males (loss of GFR of 1.4 mL/min/1.73 m2 per decade in healthy female kidney donors compared to 8.7 mL/min/1.73 m2 per decade in males, as measured by inulin clearance). Thus, our results reflect these epidemiologic features.
A number of limitations should be considered in evaluating our results. First, because the health screening datasets do not include all detailed clinical data, that is, the details of individual hospital medical records, or clinical datasets, which represent more accurate medical conditions. Nevertheless, it is a limitation that this is not sufficiently considered due to reality factors, otherwise additional key factors for CKD prediction may be included and lead to a more accurate CKD prediction model. Second, it is a single center study, and the subjects of periodic health check-ups population could lead to selection bias. Finally, even though over 2000 subjects were enrolled, our final sample size was relatively small compared to the other aforementioned CKD prediction studies. To build a CKD prediction model that can be applied widely, health screening and clinical datasets from various regions and different ethnicities need to be considered. Further external validation of the prediction models, with updating where necessary is desirable.
Conclusion
We demonstrate that logistic regression yields as good performance as ML models to predict the risk of RFD over ~6 years in an epidemiological study. Another important finding of this study was that the gradient boosting method had the best predictive ability compared to the other six comparison models. We also identified that age, Scr, SUA, WC, and SBP had important impacts on the predictivity of the models, while other predictors, such as TBIL and TG were less important. With the insidious progress of CKD, early detection and effective intervention are the only ways to reduce mortality. Timely risk assessment of CKD and appropriate monitoring in primary care are essential for preventing further kidney function impairment in the high-risk population. In conclusion, this study presents evidence of the applicability of an adult health screening dataset and the robustness of model using ML algorithms for clinical risk assessment of renal function decline. Meanwhile, we suggest that traditional regression models should continue to have a key role in CKD risk prediction. Further studies are needed to confirm this result for different settings and study characteristics.
Acknowledgments
This work was funded by the National Natural Science Foundation of China (71804199), Hunan Provincial Natural Science Foundation of China (2021JJ30037), and Hunan Provincial Health Commission General Fund Project (202215025353). The funding entities had no role in the study design; the collection, analyses, or interpretation of data; the writing of the manuscript; or the decision to publish the results.
Disclosure
The authors report no conflicts of interest in this work.
References
1. Collaboration GBDCKD. Global, regional, and national burden of chronic kidney disease, 1990–2017: a systematic analysis for the Global Burden of Disease Study 2017. Lancet. 2020;395(10225):709–733. doi:10.1016/S0140-6736(20)30045-3
2. Zhang L, Wang F, Wang L, et al. Prevalence of chronic kidney disease in China: a cross-sectional survey. Lancet. 2012;379(9818):815–822. doi:10.1016/S0140-6736(12)60033-6
3. Yang C, Wang H, Zhao X, et al. CKD in China: evolving spectrum and public health implications. Am J Kidney Dis. 2020;76(2):258–264. doi:10.1053/j.ajkd.2019.05.032
4. Nelson RG, Grams ME, Ballew SH, et al. Development of risk prediction equations for incident chronic kidney disease. JAMA. 2019;322(21):2104–2114. doi:10.1001/jama.2019.17379
5. Carrillo-Larco RM, Miranda JJ, Gilman RH, et al. Risk score for first-screening of prevalent undiagnosed chronic kidney disease in Peru: the CRONICAS-CKD risk score. BMC Nephrol. 2017;18(1):343. doi:10.1186/s12882-017-0758-4
6. O’Seaghdha CM, Lyass A, Massaro JM, et al. A risk score for chronic kidney disease in the general population. Am J Med. 2012;125(3):270–277. doi:10.1016/j.amjmed.2011.09.009
7. Mocroft A, Lundgren JD, Ross M, et al. Development and validation of a risk score for chronic kidney disease in HIV infection using prospective cohort data from the D:A:D study. PLoS Med. 2015;12(3):e1001809. doi:10.1371/journal.pmed.1001809
8. Obermeyer Z, Emanuel EJ. Predicting the future - big data, machine learning, and clinical medicine. N Engl J Med. 2016;375(13):1216–1219. doi:10.1056/NEJMp1606181
9. Weng SF, Reps J, Kai J, Garibaldi JM, Qureshi N. Can machine-learning improve cardiovascular risk prediction using routine clinical data? PLoS One. 2017;12(4):e0174944. doi:10.1371/journal.pone.0174944
10. Nusinovici S, Tham YC, Yan MYC, et al. Logistic regression was as good as machine learning for predicting major chronic diseases. J Clin Epidemiol. 2020;122:56–69. doi:10.1016/j.jclinepi.2020.03.002
11. Goldstein BA, Navar AM, Carter RE. Moving beyond regression techniques in cardiovascular risk prediction: applying machine learning to address analytic challenges. Eur Heart J. 2017;38(23):1805–1814. doi:10.1093/eurheartj/ehw302
12. Senders JT, Staples PC, Karhade AV, et al. Machine learning and neurosurgical outcome prediction: a systematic review. World Neurosurg. 2018;109:476–486 e471. doi:10.1016/j.wneu.2017.09.149
13. Berglund E, Lytsy P, Westerling R. Adherence to and beliefs in lipid-lowering medical treatments: a structural equation modeling approach including the necessity-concern framework. Patient Educ Couns. 2013;91(1):105–112. doi:10.1016/j.pec.2012.11.001
14. Cao X, Zhou JS, Yuan H, Wu LX, Chen ZH. Chronic kidney disease among overweight and obesity with and without metabolic syndrome in an urban Chinese cohort. BMC Nephrol. 2015;16:16. doi:10.1186/s12882-015-0009-5
15. Cao X, Wu LX, Chen ZH. The association between elevated serum uric acid level and an increased risk of renal function decline in a health checkup cohort in China. Int Urol Nephrol. 2018;50(3):517–525. doi:10.1007/s11255-017-1732-6
16. Cheng HT, Huang JW, Chiang CK, Yen CJ, Hung KY, Wu KD. Metabolic syndrome and insulin resistance as risk factors for development of chronic kidney disease and rapid decline in renal function in elderly. J Clin Endocr Metab. 2012;97(4):1268–1276. doi:10.1210/jc.2011-2658
17. Madero M, Peralta C, Katz R, et al. Association of arterial rigidity with incident kidney disease and kidney function decline: the Health ABC study. Clin J Am Soc Nephrol. 2013;8(3):424–433. doi:10.2215/CJN.07900812
18. Levey AS, Stevens LA, Schmid CH, et al. A new equation to estimate glomerular filtration rate. Ann Intern Med. 2009;150(9):604–612. doi:10.7326/0003-4819-150-9-200905050-00006
19. Krishnan E. Interaction of inflammation, hyperuricemia, and the prevalence of hypertension among adults free of metabolic syndrome: NHANES 2009–2010. J Am Heart Assoc. 2014;3(2). doi:10.1161/JAHA.113.000157
20. Webster AC, Nagler EV, Morton RL, Masson P. Chronic kidney disease. Lancet. 2017;389(10075):1238–1252. doi:10.1016/S0140-6736(16)32064-5
21. Qin Y, Melse-Boonstra A, Pan XQ, et al. Anemia in relation to body mass index and waist circumference among Chinese women. Nutr J. 2013;12:12. doi:10.1186/1475-2891-12-12
22. Jerez JM, Molina I, Garcia-Laencina PJ, et al. Missing data imputation using statistical and machine learning methods in a real breast cancer problem. Artif Intell Med. 2010;50(2):105–115. doi:10.1016/j.artmed.2010.05.002
23. Youden WJ. Index for rating diagnostic tests. Cancer. 1950;3(1):32–35.
24. DeLong ER, DeLong DM, Clarke-Pearson DL. Comparing the areas under two or more correlated receiver operating characteristic curves: a nonparametric approach. Biometrics. 1988;44(3):837–845. doi:10.2307/2531595
25. Chen X, Huang L, Xie D, Zhao Q. EGBMMDA: extreme gradient boosting machine for MiRNA-disease association prediction. Cell Death Dis. 2018;9(1):3. doi:10.1038/s41419-017-0003-x
26. Waljee AK, Higgins PD, Singal AG. A primer on predictive models. Clin Transl Gastroenterol. 2014;5:e44. doi:10.1038/ctg.2013.19
27. Lee Y, Ryu J, Kang MW, et al. Machine learning-based prediction of acute kidney injury after nephrectomy in patients with renal cell carcinoma. Sci Rep. 2021;11(1):15704. doi:10.1038/s41598-021-95019-1
28. Koyner JL, Carey KA, Edelson DP, Churpek MM. The development of a machine learning inpatient acute kidney injury prediction model. Crit Care Med. 2018;46(7):1070–1077. doi:10.1097/CCM.0000000000003123
29. Shih CC, Lu CJ, Chen GD, Chang CC. Risk prediction for early chronic kidney disease: results from an adult health examination program of 19,270 individuals. Int J Environ Res Public Health. 2020;17(14):4973. doi:10.3390/ijerph17144973
30. Song X, Waitman LR, Yu AS, Robbins DC, Hu Y, Liu M. Longitudinal risk prediction of chronic kidney disease in diabetic patients using a temporal-enhanced gradient boosting machine: retrospective cohort study. JMIR Med Inform. 2020;8(1):e15510. doi:10.2196/15510
31. Xiao J, Ding R, Xu X, et al. Comparison and development of machine learning tools in the prediction of chronic kidney disease progression. J Transl Med. 2019;17(1):119. doi:10.1186/s12967-019-1860-0
32. Mahmood U, Healy HG, Kark A, et al. Spectrum (characteristics) of patients with chronic kidney disease (CKD) with increasing age in a major metropolitan renal service. BMC Nephrol. 2017;18(1):372. doi:10.1186/s12882-017-0781-5
33. Yu CS, Lin CH, Lin YJ, et al. Clustering heatmap for visualizing and exploring complex and high-dimensional data related to chronic kidney disease. J Clin Med. 2020;9(2):403. doi:10.3390/jcm9020403
34. Bradshaw C, Kondal D, Montez-Rath ME, et al. Early detection of chronic kidney disease in low-income and middle-income countries: development and validation of a point-of-care screening strategy for India. BMJ Glob Health. 2019;4(5):e001644. doi:10.1136/bmjgh-2019-001644
35. Yang L, Chu TK, Lian J, et al. Individualised risk prediction model for new-onset, progression and regression of chronic kidney disease in a retrospective cohort of patients with type 2 diabetes under primary care in Hong Kong. BMJ Open. 2020;10(7):e035308. doi:10.1136/bmjopen-2019-035308
36. Umesawa M, Sairenchi T, Haruyama Y, et al. Validity of a risk prediction equation for CKD after 10 years of follow-up in a Japanese population: the Ibaraki prefectural health study. Am J Kidney Dis. 2018;71(6):842–850. doi:10.1053/j.ajkd.2017.09.013
37. Levin A, Tonelli M, Bonventre J, et al. Global kidney health 2017 and beyond: a roadmap for closing gaps in care, research, and policy. Lancet. 2017;390(10105):1888–1917. doi:10.1016/S0140-6736(17)30788-2
38. Dienemann T, Fujii N, Orlandi P, et al. International network of chronic kidney disease cohort studies (iNET-CKD): a global network of chronic kidney disease cohorts. BMC Nephrol. 2016;17(1):121. doi:10.1186/s12882-016-0335-2
39. Sederholm Lawesson S, Alfredsson J, Szummer K, Fredrikson M, Swahn E. Prevalence and prognostic impact of chronic kidney disease in STEMI from a gender perspective: data from the SWEDEHEART register, a large Swedish prospective cohort. BMJ Open. 2015;5(6):e008188. doi:10.1136/bmjopen-2015-008188
40. Berg UB. Differences in decline in GFR with age between males and females. Reference data on clearances of inulin and PAH in potential kidney donors. Nephrol Dial Transplant. 2006;21(9):2577–2582. doi:10.1093/ndt/gfl227
 © 2022 The Author(s). This work is published and licensed by Dove Medical Press Limited. The full terms of this license are available at https://www.dovepress.com/terms.php and incorporate the Creative Commons Attribution - Non Commercial (unported, v3.0) License.
By accessing the work you hereby accept the Terms. Non-commercial uses of the work are permitted without any further permission from Dove Medical Press Limited, provided the work is properly attributed. For permission for commercial use of this work, please see paragraphs 4.2 and 5 of our Terms.
© 2022 The Author(s). This work is published and licensed by Dove Medical Press Limited. The full terms of this license are available at https://www.dovepress.com/terms.php and incorporate the Creative Commons Attribution - Non Commercial (unported, v3.0) License.
By accessing the work you hereby accept the Terms. Non-commercial uses of the work are permitted without any further permission from Dove Medical Press Limited, provided the work is properly attributed. For permission for commercial use of this work, please see paragraphs 4.2 and 5 of our Terms.