Back to Journals » Clinical Epidemiology » Volume 12
Comparing the Performance of Charlson and Elixhauser Comorbidity Indices to Predict In-Hospital Mortality Among a Chinese Population
Authors Cai M ![]() , Liu E, Zhang R, Lin X
, Liu E, Zhang R, Lin X ![]() , Rigdon SE, Qian Z, Belue R
, Rigdon SE, Qian Z, Belue R ![]() , Chang JJ
, Chang JJ
Received 9 December 2019
Accepted for publication 3 March 2020
Published 18 March 2020 Volume 2020:12 Pages 307—316
DOI https://doi.org/10.2147/CLEP.S241610
Checked for plagiarism Yes
Review by Single anonymous peer review
Peer reviewer comments 2
Editor who approved publication: Professor Vera Ehrenstein
Miao Cai,1 Echu Liu,2 Ruihua Zhang,3 Xiaojun Lin,4,5 Steven E Rigdon,1 Zhengmin Qian,1 Rhonda Belue,2 Jen-Jen Chang1
1Department of Epidemiology and Biostatistics, College for Public Health and Social Justice, Saint Louis University, Saint Louis, MO, 63104, USA; 2Department of Health Management and Policy, College for Public Health and Social Justice, Saint Louis University, Saint Louis, MO, 63104, USA; 3School of Management, Chengdu University of Traditional Chinese Medicine, Chengdu 610075, Sichuan, People’s Republic of China; 4West China School of Public Health and West China Fourth Hospital, Sichuan University, Chengdu 610041, Sichuan, People’s Republic of China; 5West China Research Center for Rural Health Development, Sichuan University, Chengdu 610041, Sichuan, People’s Republic of China
Correspondence: Ruihua Zhang
School of Management, Chengdu University of Traditional Chinese Medicine, 1166 Liutaidadao, Chengdu 610075, Sichuan, People’s Republic of China
Email [email protected]
Objective: Earlier comorbidity measures have been developed or validated using the North American population. This study aims to compare five Charlson or Elixhauser comorbidity indices to predict in-hospital mortality using a large electronic medical record database from Shanxi, China.
Methods: Using the primary diagnosis code and surgery procedure codes, we identified four hospitalized patient cohorts, hospitalized between 2013 and 2017, in Shanxi, China, as follows: congestive heart failure (CHF, n=41,577), chronic renal failure (CRF, n=40,419), diabetes (n=171,355), and percutaneous coronary intervention (PCI, n=39,097). We used logistic regression models and c-statistics to evaluate the in-hospital mortality predictive performance of two multiple comorbidity indicator variables developed by Charlson in 1987 and Elixhauser in 1998 and three single numeric scores by Quan in 2011, van Walraven in 2009, and Moore 2017.
Results: Elixhauser comorbidity indicator variables had consistently higher c-statistics (0.824, 0.843, 0.904, 0.853) than all other four comorbidity measures, across all four disease cohorts. Moore’s comorbidity score outperformed the other two score systems in CHF, CRF, and diabetes cohorts (c-statistics: 0.776, 0.832, 0.869), while van Walraven’s score outperformed all others among PCI patients (c-statistics: 0.827).
Conclusion: Elixhauser comorbidity indicator variables are recommended, when applied to large Chinese electronic medical record databases, while Moore’s score system is appropriate for relatively small databases.
Keywords: comorbidity, Charlson, Elixhauser, administrative data, China
Introduction
There is a growing trend of and interest in conducting health service and outcome research based on administrative medical databases.1 Administrative data are routinely collected in hospitals, clinics, pharmacies or other healthcare institutions.2 Given that administrative data tend to be large in volume and accessible and provide detailed service utilization information, an increasing number of researchers have been using them to perform cost-effectiveness analysis, risk adjustment, and predict mortality and health outcomes.3–6
In health outcome research, comorbidities or coexisting medical conditions are one of the most critical factors to adjust.7,8 The Charlson Comorbidity Index (CCI) and the Elixhauser Comorbidity Index (ECI) are the two best-known indices in the field of patient risk adjustment and outcome prediction.9,10 The CCI was originally developed in 1987 by Charlson et al,9 who reviewed the inpatient hospital charts of 559 medical patients at New York Hospital, along with their 1-year mortality, ultimately defining 17 comorbidities and associated weights, to estimate the mortality risk. In 1998, Elixhauser et al10 developed a more comprehensive index, of 30 comorbidity measures, by examining a large administrative data of 1,779,167 patients from California. However, the two comorbidity indices were not widely adopted by researchers until 2005, when Quan et al11 proposed the coding algorithms to define and differentiate between the Charlson comorbidities and Elixhauser comorbidities for administrative databases. The study by Quan et al11 allowed researchers to calculate CCIs and ECIs based on administrative databases using either the International Classification of Diseases, 9th Revision, Clinical Modification (ICD-9-CM) or the International Classification of Disease and Related Health Problems, 10th Revision (ICD-10). Following the development of CCI and ECI, combined comorbidity indices have also been developed to combine the CCI and ECI. Although a few studies suggest that combined indices have better predictive performance than the CCI and ECI among North American populations, combined indices are relatively new and much less used than the CCI and ECI.12,13
Comorbidities vary by population characteristics and diseases and have negative effects on patient outcomes, particularly in mortality and readmission percent prediction.14 Since the original development of these two indices, they have been updated by various researchers and applied to different populations.15–17 In 2011, Quan et al15 updated the CCI weights using Canadian data and validated them on data from Australia, Canada, France, Japan, New Zealand and Switzerland. However, their results were based on data in 2008, which may be outdated and not as suggestive as they once were. In addition, they validated only one version of CCI and failed to benchmark the performance of multiple widely used CCIs and ECIs. In 2009 and 2017, van Walraven et al16 and Moore et al17 developed two weighting systems for ECI, based on Canadian and American administrative data, respectively. These comorbidity scores have been adopted by various epidemiological studies all over the world.18–20 Nevertheless, only a few studies have validated or compared the use of these comorbidity indices on non-Caucasian populations, and none of these studies were based on any Chinese populations.13–15,21–23
The large volume of patients in China, together with fast-developing health information systems, furnishes a promising opportunity to enlighten healthcare practice and policy-making based on real-world evidence.24–27 Although a growing number of researchers are applying the American-population-based CCI and ECI to a Chinese population, there is no evidence of cross-population generalizability of these comorbidity indices using Chinese administrative data.28–31 Therefore, this study aims to evaluate the predictive accuracy of five commonly used indices in in-hospital mortalities of four disease cohorts based on a large administrative database in Shanxi, China. The five indices include two from the Charlson comorbidity system: the 17 comorbidity indicator variable system by Charlson et al9 in 1987 and the single numeric score updated by Quan et al15 in 2011, and the Elixhauser comorbidity system: the 30 comorbidity indicator variable system by Elixhauser et al10 in 1998, the single numeric score developed by van Walraven et al16 in 2009, and the single numeric score developed by Moore et al17 in 2017.
Materials and Methods
Study Sample
This study used de-identified electronic medical records (EMR) data from the hospital discharge database in Shanxi, China between January 2013 and December 2017. The database included the following information of each patient: demographic characteristics (age, gender and marital status), a primary diagnosis and its ICD-10-CM code, up to 10 secondary diagnoses and their ICD-10-CM codes, up to 7 medical procedures and their ICD-9 procedure codes, and patients’ outcomes (medical costs and discharge outcomes). The ICD-10-CM system in the Chinese EMR database follows international standards, but the last two decimal places may reflect minor changes that have been adapted to encompass local specialized diseases. The study has been approved by the Institutional Review Board (IRB) at Sichuan University, China. Since de-identified data were used in this study, patient consent to review their medical records was not required by the IRB.
Since the predictive abilities of CCI and ECI can vary across different patient outcomes, this study follows the guidelines of Li et al14 and targets four disease cohorts, including 1) congestive heart failure (CHF), 2) chronic renal failure (CRF), 3) diabetes, and 4) patients who underwent a percutaneous coronary intervention (PCI). CHF patients were identified if their main diagnosis code (ICD-10-CM) contained “I11.0”, “I13.0”, “I13.2”, “I50”. CRF was identified if their main diagnosis codes contained “N18”, and type 2 diabetes patients were identified by “E11.9”. PCI patients were identified if any of their seven procedure codes contained “00.66”, “36.01”, “36.02” or “36.05”. Patients with missing values on gender or age, and those younger than 18 years of age, were excluded from this study. In total, 41,577 CHF patients, 40,419 CRF patients, 171,355 patients with type 2 diabetes, and 39,097 PCI patients were included in this study.
The Outcome and Comorbidities
The primary outcome in this study was in-hospital mortality, defined as all-cause death during the period of hospitalization.13 Similar studies have used 30-day mortality, 1-year mortality or unplanned readmission as the outcomes.9,13,17 However, thirty-day mortality was not available in the Chinese EMR systems at the time of this study. Additionally, readmissions can be identified using the patient’s unique identifier, but the Chinese EMR system, as specified by the former Ministry of Health, did not formulate a way of distinguishing between planned and unplanned readmission.
We used the package “icd” in the statistical environment R to estimate the CCIs and ECIs in this study.32 The package used Quan’s ICD-10 coding algorithms to define Charlson and Elixhauser comorbidity binary variables.11 We did not use the official software package, developed by the Agency for Healthcare Research and Quality, to calculate the Elixhauser index since most of its codes had three decimal places. The Chinese ICD-10 coding system has minor adjustments on the second and third decimal places to local specific diseases. Therefore, this software is not applicable to Chinese electronic medical records. Apart from using the 17 and 30 comorbidity binary variables proposed by Charlson et al9 and Elixhauser et al,10 this study also used three widely used weighting systems that combine comorbidities into single numeric values: 1) Quan’s updated CCI,15 which ranges from 0 to 24, 2) van Walraven’s ECI,16 which ranges from −19 to 89, and 3) Moore’s ECI,17 which ranges from −32 to 99. Higher score on any of these three measures indicates a greater disease burden and a higher probability of having in-hospital mortality.
Statistical Analysis
We calculated the frequencies of the Charlson and Elixhauser comorbidity variables, using ICD-10-CM secondary diagnoses for each disease cohort. Then, we fitted five logistic regression models using Charlson comorbidities, Elixhauser comorbidities and the three numeric scores (listed above) for each patient cohort. The outcome variables in these models are a binary indicator of whether in-hospital death occurred to the patient or not. Each model also included variables such as sex, age, marital status, occupation, length of stay, and hospital levels as covariates. These variables have been conventionally used as covariates to adjust for patient outcomes when a large administrative data set is applied. Biological sex was coded as a binary variable, with the male as the reference group. Age was categorized as 18–45 (reference group), 46–65, 65–75, greater than 75. Marital status was divided into married (reference group), unmarried, widowed, divorced and other. Occupation was categorized as working as a farmer (reference group), jobless, in a private or a public institution, retired and other. Length of stay was categorized into four quartiles with the first quartile as the reference, and hospital level was divided into tertiary and secondary. Tertiary hospitals in China are large national or provincial comprehensive hospitals that provide high-quality specialist services, while secondary hospitals are regional hospitals that provide care for general and less-complicated diseases.28
For each of the four cohorts in this study, we estimated six models with different sets of explanatory variables to predict in-hospital mortality: (1) the baseline model that includes age, gender, marital status, occupation, length of stay, and hospital level (socio-demographic variable sets), and no comorbidity variable is used in this baseline model, (2) baseline model with the Quan comorbidity score,15 (3) baseline model with the van Walraven comorbidity score,16 (4) baseline model with the Moore comorbidity score,17 (5) baseline model with the 17 Charlson comorbidity indicator variables,9 (6) baseline model with the 30 Elixhauser comorbidity indicator variables.10
The concordance statistics, which are often called c-statistics, are a measure of goodness of fit for the logistic regression model. It is equivalent to the area under a receiver operating characteristic (ROC) curve and ranges from 0.5 to 1. The ROC curve illustrates the relationship between the rate of false positives and true positives when selecting the cut-off values for predicting the dichotomous outcomes (in-hospital death in this case). Higher values indicate a better prediction model. We computed c-statistic values to benchmark the predictive performance of these models. 95% confidence intervals (CIs) were computed using 1000 bootstrap replicates for each model. All data cleaning, statistical modeling, and visualization were conducted in the statistical environment R 3.4.1.33
Results
Table 1 shows the descriptive statistics of patient demographics, covariates, and three numeric comorbidity scores stratified by patient outcomes. Overall, the four patient cohorts had a very low in-hospital mortality rate, with CHF patients having the highest percentage (0.85%) and PCI patients with the lowest percentage (0.03%). CHF patients tended to be older (39.1% older than 75 years of age), had a higher percentage of people who were widowed (6.2%) and farmers (51.4%). By contrast, CRF patients were more likely to be younger (27.4% in the 18–45 age group). PCI patients were much more likely to be hospitalized in tertiary hospitals (97.7%), where most of the high-tech medical equipment was located.
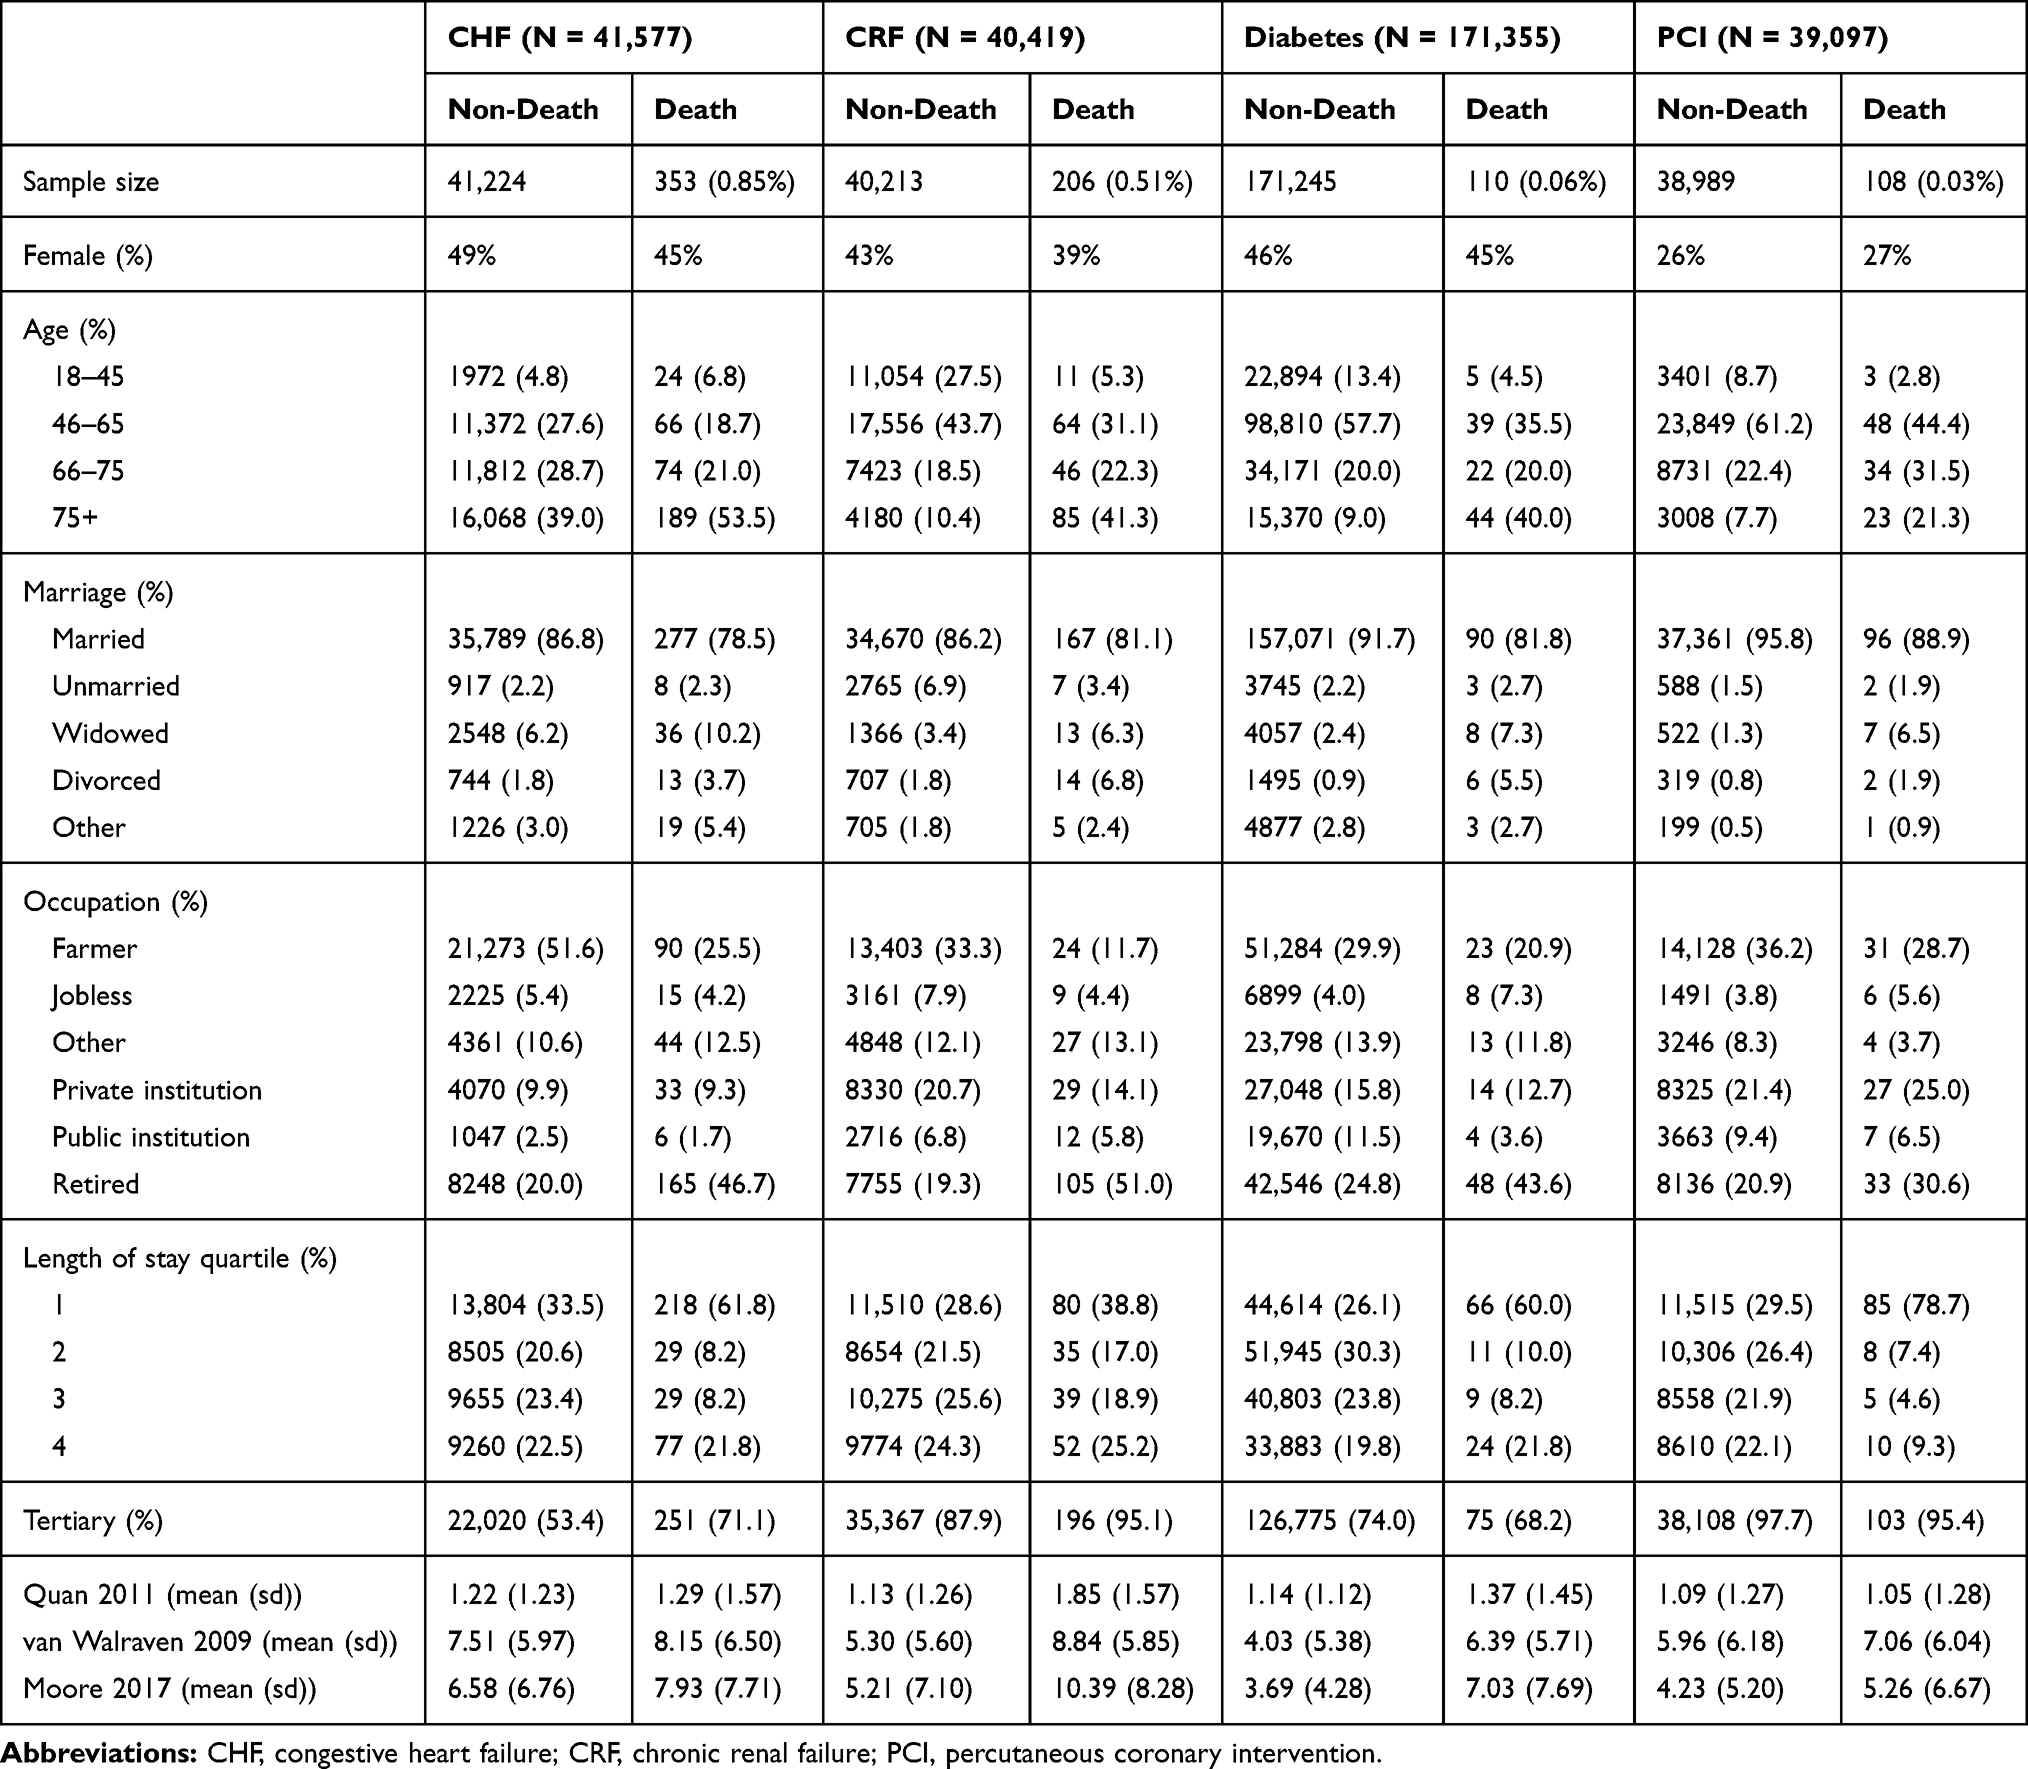 |
Table 1 Characteristics of the Study Sample Stratified by the Outcome Variable |
Table 1 also demonstrates differences in characteristics between dead and alive patients across the four cohorts. Compared with patients who stayed alive during hospitalization, patients who died were older, more likely to be widowed, divorced, retired, and had a lower length of stay in hospitals. The mean values of the van Walraven16 and Moore17 score were significantly different between dead and alive patients across the four cohorts. It merits attention that the CCI, updated by Quan et al,15 showed very little variation across and within the four disease cohorts, indicated by similar means and small standard deviations. Relative to Quan’s CCI,15 the other two numeric scores (ECI by van Walraven16 and Moore17) demonstrates much more within- and across-group variations.
The frequency and percent of the 17 Charlson comorbidities and 30 Elixhauser comorbidities are presented in Table 2. It is worth noting here that some comorbidities were very rare, such as acquired immunodeficiency syndrome (AIDS), alcohol and drug use, consistent with those reported in Li et al.14 A fair amount of variation in comorbidity proportions can be observed from Table 2 across the four patient cohorts.
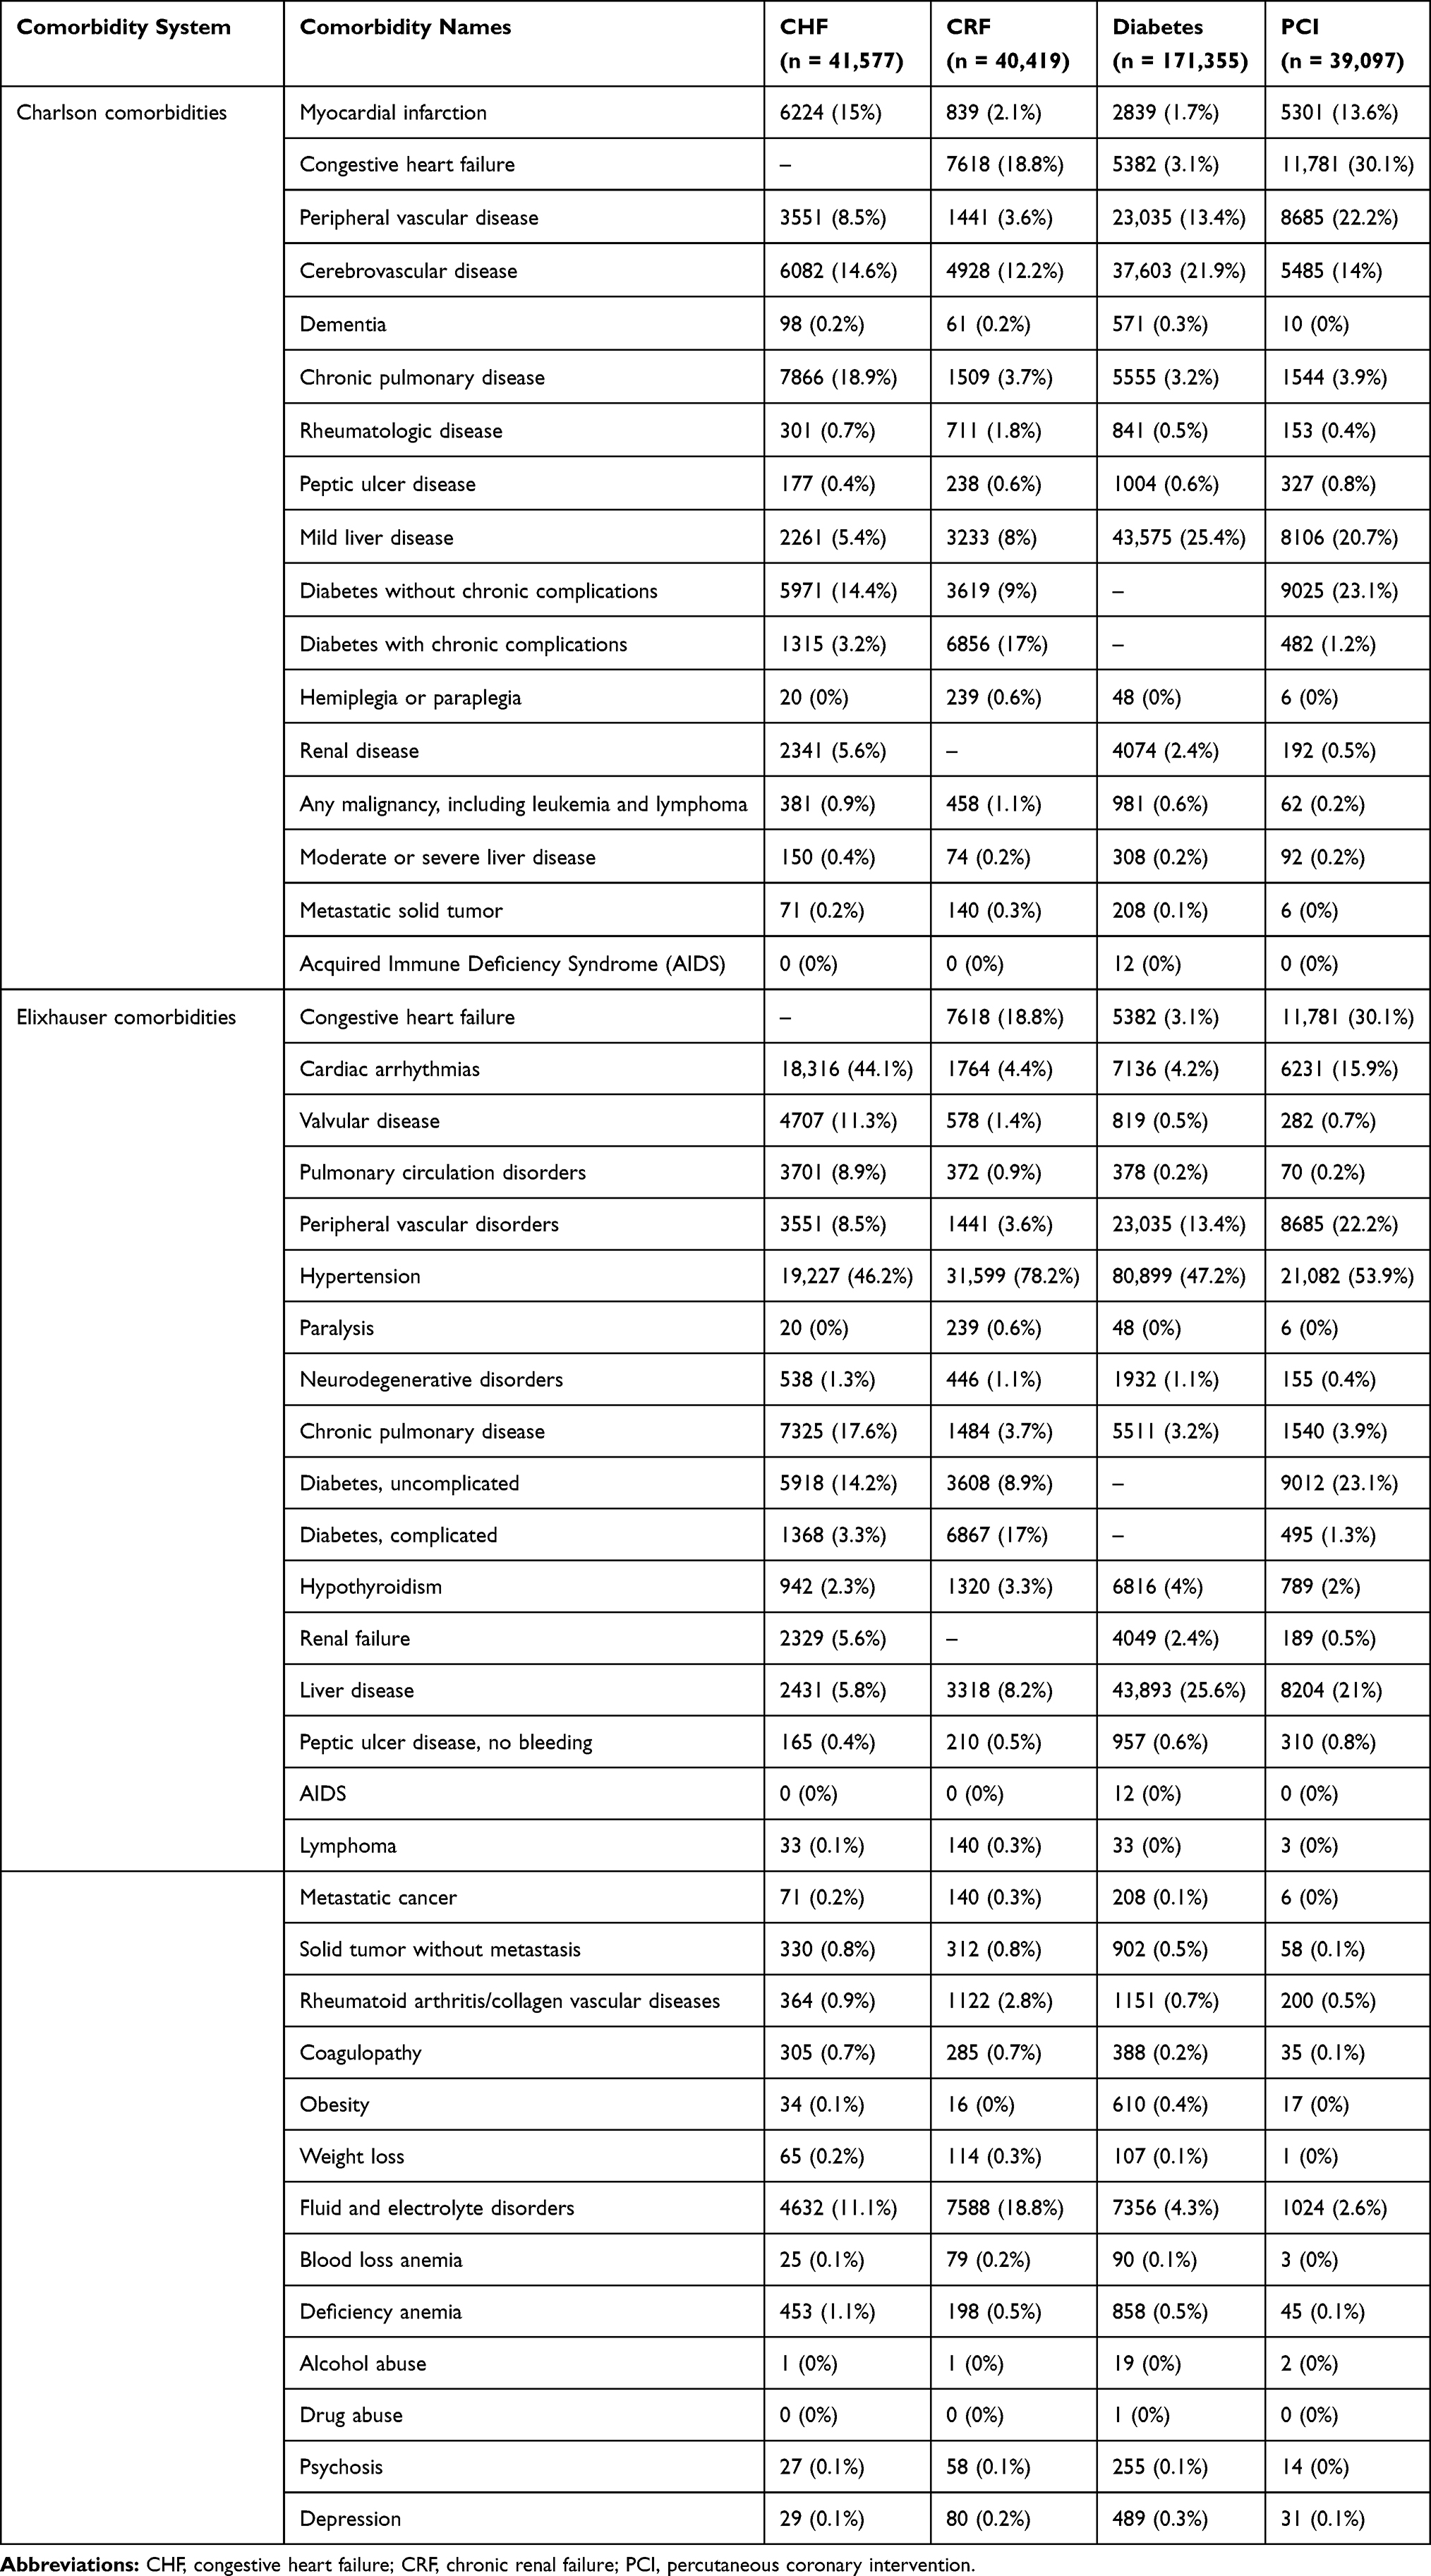 |
Table 2 The Frequency and Percent of Each Comorbidity in Charlson and Elixhauser Comorbidity Systems |
The c-statistics of these regression models are shown in Table 3 and Figure 1. The predictive performance of the three numeric comorbidity scores demonstrated different and inconsistent patterns over the four disease cohorts in our sample. The Charlson and Elixhauser comorbidity indicator variable sets, together with the covariates, consistently had higher predictive ability than the baseline and all three numeric score models. Among the three comorbidity scores, the ECI updated by Moore and his colleagues in 2017 outperformed the other two scores (Quan 2011 and van Walraven 2017), except for PCI patients, among which the van Walraven ECI in 2009 outstripped the Moore 2017 ECI. The comorbidity measures, together with sociodemographic variables, generally had the best predictive ability in the diabetes patient cohorts, followed by CRF and PCI cohorts, while they performed the worse among the CHF patient cohort.
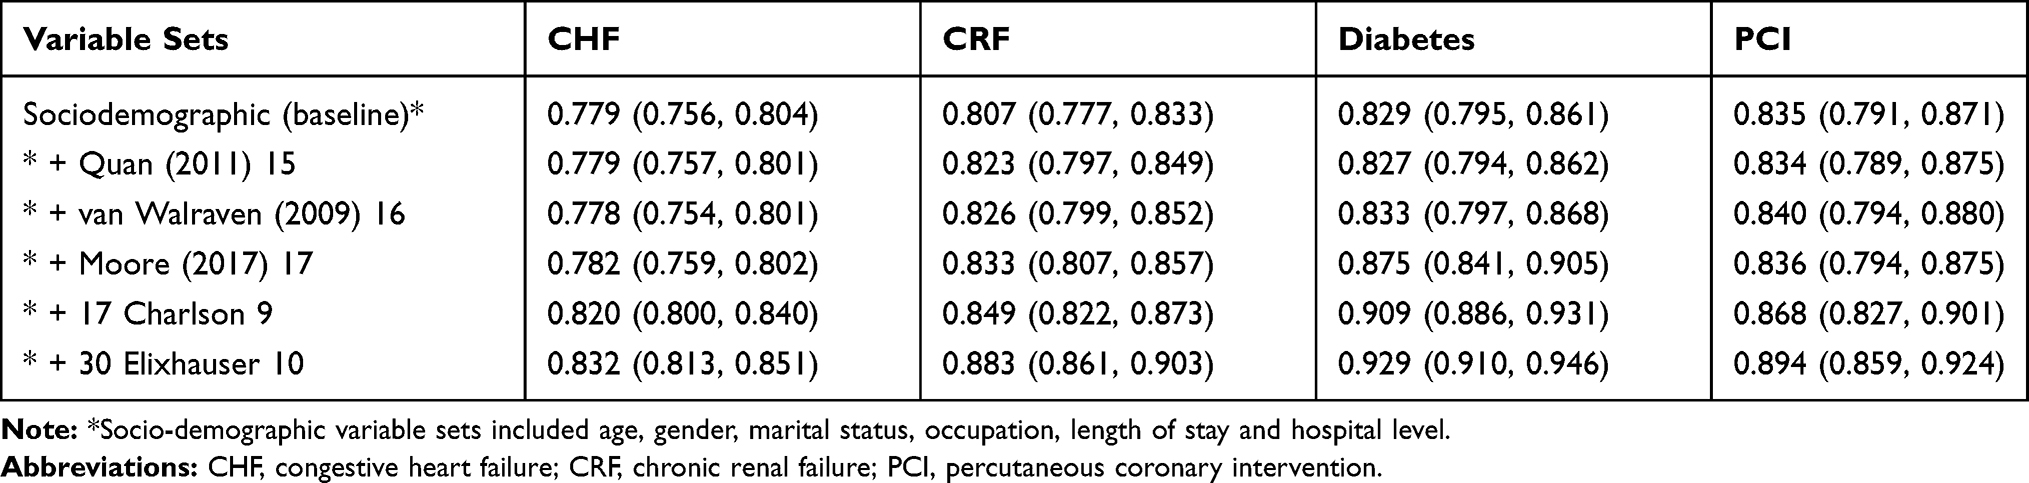 |
Table 3 c-Statistics for Each Model Across Four Disease Cohorts |
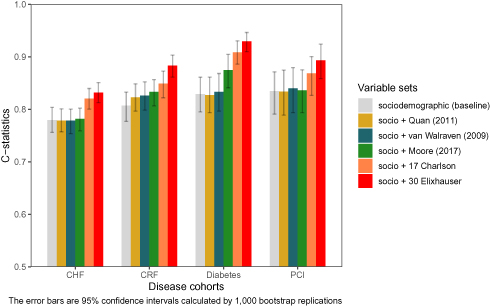 |
Figure 1 Comparison of c-statistics among different variable sets. |
Discussion
This study compared the performance of five commonly applied comorbidity indices in predicting in-hospital mortality of four disease cohorts based on a homogeneous Chinese population. The results can serve as a guideline for choosing comorbidity indices when performing risk adjustment based on Chinese administrative data in mortality research.
To the best of our knowledge, this is the first study that compares the predictive accuracy of widely recognized comorbidity indices among the Chinese population. Our findings have two major implications. First, using 31 Elixhauser comorbidity indicator variables, instead of relying on combined numeric scores, can generate the largest predictive power, given a sufficiently large sample size. This is consistent with the study performed by Quan et al.15 Second, when the sample size is relatively small, researchers may be concerned about overfitting and non-convergence problems for Charlson or Elixhauser comorbidity indicator variables since they include 17 and 30 comorbidity dummy variables in the regression model.16 In that case, our results suggest that the single numeric score by Moore et al17 in 2017 generally had the highest predictive accuracy, relative to the other two numeric score indices.
Prior to this study, we expected that the Charlson comorbidity score updated by Quan et al15 in 2011 would demonstrate higher predictive accuracy, relative to the other two numeric scores, as they included a Japanese population and asserted an external validity among an Asian population.15 However, the Quan 2011 comorbidity score did not perform as well as the other two comorbidity numeric scores, based on our sample. For the diabetes disease and PCI cohorts, the Quan comorbidity score,15 together with sociodemographic variables, did not even produce a higher c-statistic than those using these sociodemographic variables alone. This indicates that the comorbidity score updated by Quan et al15 in 2011 may not be generalizable to the Chinese population, despite its inclusion of another Asian population (ie, the Japanese population).
Compared with the single cohort in Moore’s paper,17 our four cohorts have more variation in patient demographic variables. The CHF cohort includes more elderly patients, while the other three cohorts include more young patients. The prevalence of most comorbidities in this study is comparable to those in van Walraven’s paper,16 but some comorbidities (AIDS, alcohol abuse, and drug abuse) have a very low frequency. Alcohol and drug abuse is often not considered as a medical symptom or diagnosis in China, which may be attributable to doctors’ coding habits. Underestimating the prevalence of these three comorbidities may result in weaker predicting performance since these variables are indicative of patient outcome. Given the difference in patient characteristics and comorbidity distributions across cohorts, the c-statistics in this study can be better or worse compared to the previous studies.15–17 For example, our models have higher c-statistics than those in Moore’s study: the c-statistics for the Elixhauser indicator variable model are 0.824, 0.875, 0.923, and 0.879 in our cohorts, while the value is 0.805 in a similar study by Moore et al.17
EMR data quality is crucial for risk adjustment, patient outcome prediction, and hospital performance profiling. Prior validation studies of comorbidity scores, using administrative databases, examined the accuracy of disease coding. In the electronic medical record system in Shanxi, China, doctors fill out the name of diagnosis, surgery, and their corresponding codes. The department of medical records conducted data quality control and verified a 5% random sample of all patient records every month. Those medical records with incomplete information, miscoding, or logical errors were returned to the physicians and these physicians were subsequently retrained. Despite the aforementioned measures to improve EMR data quality, there have been no formal studies assessing the accuracy of data as Hsia et al did.34,35 Hsia et al suggested a potential concern related to overcoding for reimbursement claim but it does not apply to administrative data from China because the Chinese health care is still a fee-for-service-based system.
The other issue about data quality is the number of secondary diagnoses in this Shanxi database. The administrative database in other countries normally has over 15 secondary diagnoses,15 and the National Inpatient Sample (NIS) provided by the Healthcare Cost and Utilization Project (HCUP) in the United States offers over 30 diagnoses.36 By contrast, the Shanxi EMR database only provides one primary diagnosis and up to 10 secondary diagnoses, based on a formulation developed by the former Ministry of Health in China.37 This could lead to an underestimation of comorbidities. Some patients in this study can have more than 10 comorbidities, but those comorbidities may not all be recorded. Therefore, this may have resulted in residual confounding in our study findings. The low frequency of some comorbidities, such as acquired immunodeficiency syndrome (AIDS), alcohol and drugs, also merits discussion. Despite its low prevalence of HIV/AIDS in our study sample, the HIV/AIDS diagnosis was accompanied by a routine blood test upon admission to the hospital. For drug and alcohol abuse, we would expect extremely low frequency in our sample since these two comorbidities are rarer in the Chinese population, relative to the North American population.38 As reported by the World Health Organization, the average yearly alcohol consumption in China was 6.7 L/person (2.2 L for women, 10.9 L for men), compared to 9.2 L/person (4.9 L for women, 13.6 L for men) in the United States.38 Nonetheless, these low-frequency comorbidities corroborated with findings from Li et al.14
This study should be interpreted with caution because there are several limitations. First, we had no follow-up data on patients’ outcomes. The mortality percent in our study may be underestimated because terminally ill Chinese patients with little hope of recovery tend to withdraw from hospitals, either for reasons related to cultural habits or financial affordability.39,40 Another limitation is the representativeness or external validity of our sample. Since there is no publicly available nationwide inpatient sample in China like the NIS, researchers interested in Chinese EMR must rely on their collaboration and connection with a given local health administration agency to gain access to the data. Although the National Health and Family Planning Commission in China holds a Nationwide Hospital Discharge Database, which routinely collects EMR data from most secondary and tertiary hospitals,41 its use and access are highly restricted to a limited number of researchers. Third, since this is an observational study that relies on secondary data, it is subject to potential information bias and residual confounding caused by inaccurate coding, unobserved patient or hospital characteristics.
Conclusions
The large population and rapid development of an electronic medical record system provide a unique opportunity to inform healthcare practice and policymaking. Our study suggests that Elixhauser comorbidity indicator variables should be used when a large Chinese electronic medical record database is available since they have the best predictive performance among the five indices, while Moore’s score system is more appropriate when only a relatively small database can be accessed. Besides, Moore’s score system can be more intuitive and informative in characterizing the comorbidity distribution of the population. Results from this work serve as a reference for researchers in China when they select comorbidity measures for health outcome prediction and risk adjustment. Besides, the results may also be informative to researchers who are interested in those electronic medical record databases with a high number of Chinese patients.
Acknowledgments
The authors thank the Health and Family Planning Commission in Shanxi, China for providing us with the data used in this study.
Disclosure
The authors report no conflicts of interest in this work.
References
1. Vlasschaert MEO, Bejaimal SAD, Hackam DG, et al. Validity of administrative database coding for kidney disease: a systematic review. Am J Kidney Dis. 2011;57(1):29–43. doi:10.1053/j.ajkd.2010.08.031
2. Hashimoto RE, Brodt ED, Skelly AC, Dettori JR. Administrative database studies: goldmine or goose chase? Evid Based Spine Care J. 2014;5(02):074–076. doi:10.1055/s-00000165
3. Li P, Xie C, Pollard T, et al. Promoting secondary analysis of electronic medical records in China: summary of the PLAGH-MIT critical data conference and health datathon. JMIR Med Inform. 2017;5(4):e43. doi:10.2196/medinform.7380
4. Frankovich J, Longhurst CA, Sutherland SM. Evidence-based medicine in the EMR era. N Engl J Med. 2011;365(19):1758–1759. doi:10.1056/NEJMp1108726
5. Van Poucke S, Thomeer M, Heath J, Vukicevic M. Are randomized controlled trials the (g) old standard? From clinical intelligence to prescriptive analytics. J Med Internet Res. 2016;18(7):e185. doi:10.2196/jmir.5549
6. Guller U, Hervey S, Purves H, et al. Laparoscopic versus open appendectomy: outcomes comparison based on a large administrative database. Ann Surg. 2004;239(1):43. doi:10.1097/01.sla.0000103071.35986.c1
7. Sharabiani MTA, Aylin P, Bottle A. Systematic review of comorbidity indices for administrative data. Med Care. 2012;50(12):1109–1118. doi:10.1097/MLR.0b013e31825f64d0
8. Yurkovich M, Antonio Avina-Zubieta J, Thomas J, Gorenchtein M, Lacaille D. A systematic review identifies valid comorbidity indices derived from administrative health data. J Clin Epidemiol. 2015;68(1):3–14. doi:10.1016/j.jclinepi.2014.09.010
9. Charlson ME, Pompei P, Ales KL, MacKenzie CR. A new method of classifying prognostic comorbidity in longitudinal studies: development and validation. J Chronic Dis. 1987;40(5):373–383. doi:10.1016/0021-9681(87)90171-8
10. Elixhauser A, Steiner C, Robert Harris D, Coffey RM. Comorbidity measures for use with administrative data. Med Care. 1998;36(1):8–27. doi:10.1097/00005650-199801000-00004
11. Quan H, Sundararajan V, Halfon P, et al. Coding algorithms for defining comorbidities in ICD-9-CM and ICD-10 administrative data. Med Care. 2005;43(11):1130–1139. doi:10.1097/01.mlr.0000182534.19832.83
12. Gagne JJ, Glynn RJ, Avorn J, Levin R, Schneeweiss S. A combined comorbidity score predicted mortality in elderly patients better than existing scores. J Clin Epidemiol. 2011;64(7):749–759. doi:10.1016/j.jclinepi.2010.10.004
13. Simard M, Sirois C, Candas B. Validation of the combined comorbidity index of Charlson and Elixhauser to predict 30-day mortality across ICD-9 and ICD-10. Med Care. 2018;56(5):441–447. doi:10.1097/MLR.0000000000000905
14. Li B, Evans D, Faris P, Dean S, Quan H. Risk adjustment performance of Charlson and Elixhauser comorbidities in ICD-9 and ICD-10 administrative databases. BMC Health Serv Res. 2008;8(1):12. doi:10.1186/1472-6963-8-12
15. Quan H, Bing L, Couris CM, et al. Updating and validating the Charlson comorbidity index and score for risk adjustment in hospital discharge abstracts using data from 6 countries. Am J Epidemiol. 2011;173(6):676–682. doi:10.1093/aje/kwq433
16. van Walraven C, Austin PC, Jennings A, Quan H, Forster AJ. A modification of the Elixhauser comorbidity measures into a point system for hospital death using administrative data. Med Care. 2009;47(6):626–633. doi:10.1097/MLR.0b013e31819432e5
17. Moore BJ, White S, Washington R, Coenen N, Elixhauser A. Identifying increased risk of readmission and in-hospital mortality using hospital administrative data. Med Care. 2017;55(7):698–705. doi:10.1097/MLR.0000000000000735
18. Schmidt M, Jacobsen JB, Lash TL, Bøtker HE, Sørensen HT. 25 year trends in first time hospitalisation for acute myocardial infarction, subsequent short and long term mortality, and the prognostic impact of sex and comorbidity: a Danish nationwide cohort study. BMJ. 2012;344:e356. doi:10.1136/bmj.e356
19. Wright JD, Ananth CV, Lewin SN, et al. Robotically assisted vs laparoscopic hysterectomy among women with benign gynecologic disease. J Am Med Assoc. 2013;309(7):689–698. doi:10.1001/jama.2013.186
20. O’neal WT, Sandesara PB, Kelli HM, Venkatesh S, Soliman EZ. Urban-rural differences in mortality for atrial fibrillation hospitalizations in the United States. Heart Rhythm. 2018;15(2):175–179. doi:10.1016/j.hrthm.2017.10.019
21. Quail JM, Lix LM, Osman BA, Teare GF. Comparing comorbidity measures for predicting mortality and hospitalization in three population-based cohorts. BMC Health Serv Res. 2011;11(1):146. doi:10.1186/1472-6963-11-146
22. Gutacker N, Bloor K, Cookson R. Comparing the performance of the Charlson/Deyo and Elixhauser comorbidity measures across five European countries and three conditions. Eur J Public Health. 2015;25(suppl_1):15–20. doi:10.1093/eurpub/cku221
23. Kimura T, Nishimura T, Sugitani T. Validation of Charlson comorbidity index in Japanese hospital-based administrative data. In: Pharmacoepidemiology and Drug Safety. Vol. 26. 111 River St, Hoboken 07030-5774, NJ USA: Wiley; 2017:205–206.
24. Lin X, Cai M, Tao H, et al. Insurance status, inhospital mortality and length of stay in hospitalised patients in Shanxi, China: a cross-sectional study. BMJ Open. 2017;7(7):e015884. doi:10.1136/bmjopen-2017-015884
25. Cai M, Liu E, Tao H, et al. Does a medical consortium influence health outcomes of hospitalized cancer patients? An integrated care model in Shanxi, China. Int J Integr Care. 2018;18(2). doi:10.5334/ijic.3588
26. Sun X, Tan J, Tang L, Guo JJ, Xinling X. Real world evidence: experience and lessons from China. BMJ. 2018;360:j5262. doi:10.1136/bmj.j5262
27. Zhang L, Wang H, Li Q, Zhao M-H, Zhan Q-M. Big data and medical research in China. BMJ. 2018;360:j5910. doi:10.1136/bmj.j5910
28. Cai M, Liu E, Tao H, Qian Z, Lin X, Cheng Z. Does level of hospital matter? A study of mortality of acute myocardial infarction patients in Shanxi, China. Am J Med Qual. 2018;33(2):185–192. doi:10.1177/1062860617708608
29. Wang X, Zeng F, Jin W-S, et al. Comorbidity burden of patients with Parkinson’s disease and Parkinsonism between 2003 and 2012: a multicentre, nationwide, retrospective study in China. Sci Rep. 2017;7(1):1671. doi:10.1038/s41598-017-01795-0
30. Zhang Y, Du M, Chang Y, Chen L-A, Zhang Q. Incidence, clinical characteristics, and outcomes of nosocomial enterococcus spp. bloodstream infections in a tertiary-care hospital in Beijing, China: a four-year retrospective study. Antimicrob Resist Infect Control. 2017;6(1):73. doi:10.1186/s13756-017-0231-y
31. Cai M, Liu E, Li W. Rural versus urban patients: benchmarking the outcomes of patients with acute myocardial infarction in Shanxi, China from 2013 to 2017. Int J Environ Res Public Health. 2018;15(9):1930. doi:10.3390/ijerph15091930
32. Wasey JO; R Core Team. ICD: comorbidity calculations and tools for ICD-9 and ICD-10 codes. R package version 4.0.6; 2019.
33. R Core Team. R: A Language and Environment for Statistical Computing. Vienna, Austria: R Foundation for Statistical Computing; 2019.
34. Hsia DC, Mark Krushat W, Fagan AB, Tebbutt JA, Kusserow RP. Accuracy of diagnostic coding for Medicare patients under the prospective-payment system. N Engl J Med. 1988;318(6):352–355. doi:10.1056/NEJM198802113180604
35. Hsia DC. Medicare reimbursement accuracy under the prospective payment system, 1985 to 1988. JAMA. 1992;268(7):896–899. doi:10.1001/jama.1992.03490070078046
36. Rockville M. The healthcare cost and utilization project: an overview. Eff Clin Pract. 2002;5(3):143–151.
37. National Health and Family Planning Commission of the People’s Republic of China. The Notice on Revising the First Page of Hospitalized Patient Records by Ministry of Health; 2011.
38. Liangpunsakul S, Haber P, McCaughan GW. Alcoholic liver disease in Asia, Europe, and North America. Gastroenterology. 2016;150(8):1786–1797. doi:10.1053/j.gastro.2016.02.043
39. Li J, Li X, Wang Q, et al.; China PEACE Collaborative Group. ST-segment elevation myocardial infarction in China from 2001 to 2011 (the China PEACE-retrospective acute myocardial infarction study): a retrospective analysis of hospital data. Lancet. 2015;385(9966):441–451. doi:10.1016/S0140-6736(14)60921-1.
40. Jiang L, Krumholz HM, Li X, Li J, Hu S. Achieving best outcomes for patients with cardiovascular disease in China by enhancing the quality of medical care and establishing a learning health-care system. Lancet. 2015;386(10002):1493–1505. doi:10.1016/S0140-6736(15)00343-8
41. Chen H, Shi L, Xue M, et al. Geographic variations in in-hospital mortality and use of percutaneous coronary intervention following acute myocardial infarction in China: a nationwide cross-sectional analysis. J Am Heart Assoc. 2018;7(8):e008131. doi:10.1161/JAHA.117.008131
 © 2020 The Author(s). This work is published and licensed by Dove Medical Press Limited. The
full terms of this license are available at https://www.dovepress.com/terms
and incorporate the Creative Commons Attribution
- Non Commercial (unported, 3.0) License.
By accessing the work you hereby accept the Terms. Non-commercial uses of the work are permitted
without any further permission from Dove Medical Press Limited, provided the work is properly
attributed. For permission for commercial use of this work, please see paragraphs 4.2 and 5 of our Terms.
© 2020 The Author(s). This work is published and licensed by Dove Medical Press Limited. The
full terms of this license are available at https://www.dovepress.com/terms
and incorporate the Creative Commons Attribution
- Non Commercial (unported, 3.0) License.
By accessing the work you hereby accept the Terms. Non-commercial uses of the work are permitted
without any further permission from Dove Medical Press Limited, provided the work is properly
attributed. For permission for commercial use of this work, please see paragraphs 4.2 and 5 of our Terms.