Back to Journals » International Journal of General Medicine » Volume 18
Comparing Different Contrast Injection Methods for Multislice Spiral CT Imaging in Triple-Rule-Out Examinations: A Study on Acute Chest Pain Patients
Authors Meng Y ![]() , Li F, Gu Y
, Li F, Gu Y ![]() , Zhou Y, Zhang Y, Liu Y, Miao Z
, Zhou Y, Zhang Y, Liu Y, Miao Z
Received 8 November 2024
Accepted for publication 16 February 2025
Published 5 March 2025 Volume 2025:18 Pages 1231—1246
DOI https://doi.org/10.2147/IJGM.S496454
Checked for plagiarism Yes
Review by Single anonymous peer review
Peer reviewer comments 3
Editor who approved publication: Dr Woon-Man Kung
Yue Meng,1,* Fang Li,2,* Yan Gu,1 Ying Zhou,1 Yonggang Zhang,1 Yongbao Liu,1 Zhongchang Miao1
1Department of Imaging, Lianyungang First People’s Hospital, Lianyungang, Jiangsu, People’s Republic of China; 2Department of Nursing, Lianyungang Second People’s Hospital, Lianyungang, Jiangsu, People’s Republic of China
*These authors contributed equally to this work
Correspondence: Zhongchang Miao, Department of Imaging, Lianyungang First People’s Hospital, 1st Floor, Building 2, Gaoxin District, No. 6 East Zhenhua Road, Haizhou District, Lianyungang, Jiangsu, People’s Republic of China, Tel +86-18961326819, Email [email protected]
Introduction: The traditional injection method of contrast media (CM) has limitations in terms of volume and imaging quality. Choosing the optimal CM injection method is crucial for ensuring high-quality images and accurate diagnosis in triple-rule-out computed tomography angiography (TRO-CTA). This study aims to investigate the application value of combining region of interest (ROI) with CM injection method alterations in TRO-CTA.
Methods: A total of 596 patients with chest pain, chest tightness, and dyspnea as the primary clinical symptoms, underwent TRO-CTA examinations based on their clinical symptoms and test indicators. These patients were randomly assigned to one of three groups: the traditional group, the modified group, and the high-pitch helical scan (FLASH) group. Key parameters, including computed tomography (CT) values, vascular filling contrast numbers, image noise, signal-to-noise ratio, contrast noise ratio, image scores, CM volume, CM injection rate, radiation dose of the aorta, pulmonary artery, and coronary artery, were systematically compared across the three groups.
Results: The CM volume and radiation doses were significantly higher in the traditional group compared to the other groups (P < 0.05). CT values for the aorta and coronary artery in the traditional group were higher than those in the modified and FLASH group, while CT values for the pulmonary artery were lower in the traditional group compared to the modified and FLASH groups (ALL P-value for traditional group versus FLASH group, P-value for modified group versus traditional group < 0.05, P-value for modified group versus FLASH group > 0.05).
Conclusion: The combination of the modified CM injection method and FLASH scanning mode reduces the required CM volume by nearly 30 mL and significantly decreases radiation dose exposure during the examination. This approach shows valuable potential for improving both the safety and effectiveness of TRO-CTA, with significant implications for clinical practice.
Keywords: triple-rule-out computed tomography angiography, chest pain, contrast injection methods
Introduction
With the continuous improvement of living standards, increased oil intake, and mounting life pressures, the age of patients with chest pain induced by smoking, drinking, staying up late, and sedentary habits has significantly decreased.1 Acute chest pain is one of the most common emergency symptoms, accounting for 5–20%2 of total emergency patient cases. It is characterized by sudden onset and high risk, necessitating early diagnosis and treatment to reduce mortality. Clinically, pulmonary embolism (PE), characterized by chest pain, chest tightness, and dyspnea, is often accompanied by aortic dissection (AD) and acute coronary syndrome (ACS), collectively referred to as triple-rule-out (TRO).3–5
Numerous studies on TRO-computed tomography angiography (CTA) examinations, such as advancements in computed tomography (CT) scanning parameters and image post-processing techniques, have substantially improved TRO diagnosis rates.6 Dual-source CT, with its advantages of a large scanning range, rapid scanning speed, high temporal and spatial resolution, and low radiation doses, making it highly suitable for emergency chest pain patients undergoing triple-rule-out computed tomography angiography (TRO-CTA) examinations.7 However, r, despite its benefits, traditional contrast media (CM) injection methods, such as bolus injection, suffer from drawbacks, including high volumes and suboptimal image quality, which can impact diagnostic performance.8
The selection of an appropriate CM injection method is pivotal in ensuring optimal image quality and diagnostic accuracy in CTA.9 Various CM injection methods are available, such as bolus injection and continuous infusion, each offering distinct advantages and limitations.10,11 Bolus injections, for example, are commonly used for dynamic imaging and rapid contrast enhancement, but can result in uneven enhancement or artifacts if not timed precisely. Continuous infusion, on the other hand, allows for more consistent contrast levels but may not be ideal for all clinical scenarios.
Given the evolving landscape of medical imaging technology, it is essential to evaluate and compare various injection techniques to identify the most effective approach for enhancing image acquisition and interpretation. The method of injection has a direct impact on factors such as contrast enhancement, spatial resolution, and the ability to visualize dynamic vascular perfusion, all of which are crucial for accurate diagnosis. Additionally, the choice of scanning mode—whether single-phase or multiphase—can influence the visualization of vascular structures, further affecting diagnostic outcomes.12,13
Therefore, this study aims to provide valuable insights into the most effective CM strategies for TRO-CTA, ultimately enhancing patient outcomes in emergency clinical settings. This study compares two different CM injection methods and two distinct scanning modes in the context of TRO-CTA. By analyzing data differences in these examinations, the study explores the clinical feasibility of a modified CM injection approach. Unlike existing literature, this study specifically focuses on directly comparing these two CM injection methods for TRO-CTA, particularly in patients presenting with acute chest pain.
Methods
Study Date
Data were collected from the Chest Pain Center of Lianyungang First People’s Hospital between December 2020 and December 2022. A total of 648 patients with chest pain, chest tightness, and dyspnea as their primary clinical manifestations and corresponding lab test indicators highly suggestive of TRO chest pain underwent TRO-CTA examination. Inclusion criteria were: (1) acute chest pain patients with high clinical suspicion of ACS, PE, and/or AD, who could undergo TRO-CTA examination in a relatively stationary state, characterized by minimal movement or shifting in relation to the examination table as a frame of reference; (2) patients aged 18 years and older. Exclusion criteria included: (1) patients with severe internal diseases, such as poor heart, liver, and kidney function (serum creatinine > 177 μmol/L) or malignant tumors; (2) patients with a history of iodine allergy; (3) patients with severe coronary artery calcification (calcium score > 400) or metal stent or cardiac pacemaker implantation; (4) body mass index (BMI) < 17 kg/m2 or BMI > 24 kg/m2; (5) inability to undergo X-ray exposure (eg, pregnancy or preparation for pregnancy); (6) vascular variation or hemodynamic changes due to disease detected during the examination; (7) presence of arrhythmia or inability to cooperate with breathing training. According to the inclusion criteria, eight patients with severe coronary artery calcification or coronary stent implantation, two patients with cardiac pacemaker implantation, 20 patients unable to cooperate with breathing due to chest pain, 10 patients with arrhythmia or premature beat, and 12 patients with a vascular variation or hemodynamic changes due to disease were excluded. Finally, 596 patients were enrolled, including 380 males (64%) and 216 females (36%), ranging in age from 30 to 94 years. Patients were divided into traditional, modified, and high-pitch helical scan (FLASH) groups based on different CM injection methods and scanning methods. The traditional and modified groups used retrospective electrocardiogram (ECG) gated scanning mode, with the traditional and modified CM injection protocols employed in the traditional and modified groups, respectively. The modified CM injection protocol was applied in both the modified and FLASH groups, but retrospective electrocardiogram-gated spiral scan and FLASH scan modes were utilized, respectively. The traditional group comprised 200 patients, the modified group 192 patients, and the FLASH group 204 patients. The flowchart of the enrollment process in this study is shown in Figure 1. All patients in the three groups were examined by the same radiographer and provided informed consent before the examination. This study received approval from the Ethics Committee of Lianyungang First People’s Hospital.
 |
Figure 1 The flowchart of the enrollment process in this study. |
Pre-Scan Preparation
All three groups underwent TRO-CTA examination using a SOMATOM Definition Flash second-generation dual-source CT scanner manufactured by Siemens. Patients were positioned supine on the examination table with their feet towards the CT scanner and their arms raised to the sides of their head. If the patient’s heart rate was below 85 beats/min, no medication was required; if the heart rate was between 85 and 100 beats/min, metoprolol tartrate tablets (25 mg) were administered; if the heart rate exceeded 100 beats/min, the dose was increased to 50 mg. TRO-CTA examination could not be performed until the heart rate was below 85 beats/min. One nitroglycerin tablet (0.5 mg) or two sprays of nitroglycerin spray (0.4 mg/spray) will be administered sublingually one minute before scanning. The heart rate was monitored using a Siemens electrocardiogram, and a 20G Y-type venous catheter was inserted into the median cubital vein by a nurse to establish venous access. CM injection was performed using a high-pressure syringe from Irich Medical and iopamidol injection (Euvexin, iodine concentration of 370 mgI/mL, 100 mL/bottle) produced by Bayer Schering Pharma AG of Germany. The CM injection scheme is presented in Table 1.
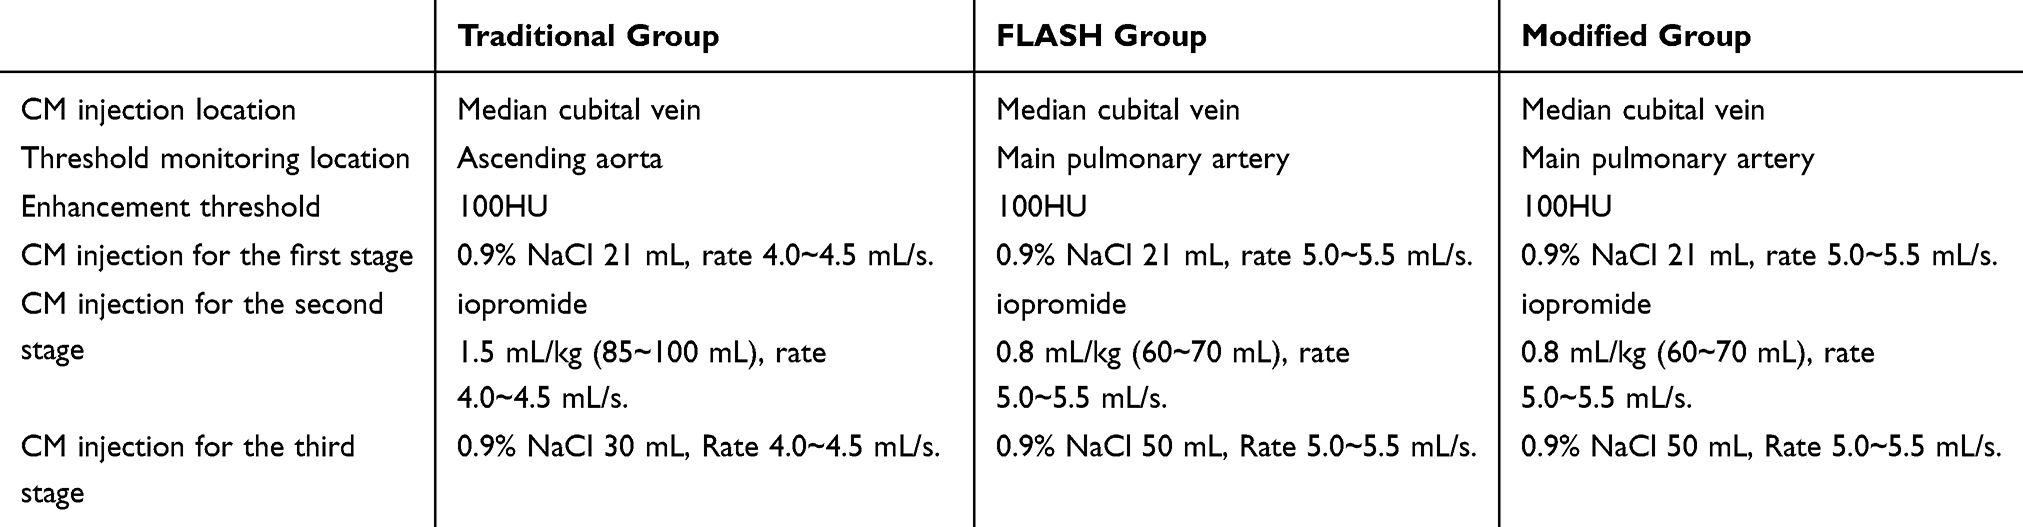 |
Table 1 Contrast Injection Scheme |
Setting of Scanning Parameters
The scanning range extended from 2 centimeter (cm) below the bronchial bifurcation prominences to 2 cm below the diaphragm for the coronary arteries, encompassing both sides of the heart border shadow.14 The pulmonary arteries and aorta spanned from 1 cm above the aortic arch to approximately 2 cm below the diaphragm. The scanning conditions included a tube voltage of 120 kV, tube current automatically modulated (600–1200 mA), and an X-ray tube rotation speed of 0.28 s/rotation. Monitoring points were set in the ascending aorta, the main pulmonary artery, and the main pulmonary artery for the traditional, modified, and FLASH groups, respectively, using automatic monitoring-triggered enhanced scanning. CT values at the monitoring points were assessed every second, starting 6 seconds after CM injection. When CT values at the monitoring points reached 100 hU, delay scanning times of 6 seconds, 8 seconds, and 9 seconds were set for the traditional, modified, and FLASH groups, respectively. Patients were instructed to hold their breath before scanning commenced. The CM dosages for the three groups were calculated separately. The scanning direction was set from head to foot. In the retrospective ECG-triggered spiral CT scanning mode, the tube rotation speed was 0.27 seconds, the pitch was 0.2–0.35, the reconstructed slice thickness was 0.625 mm, and the scanning interval was 0.625 mm.15 In the FLASH scanning mode, spiral scanning was performed with a large pitch of 3.4, a reconstructed slice thickness of 0.75 mm, and a layer spacing of 0.5 mm. In the reconstructed field of view (FOV), the typical FOV size for the pulmonary artery and aorta was 400–450 mm, and for the cardiac coronary artery, 250–300 mm. The FOV size was adjusted according to the patient’s chest and heart dimensions, and the region of interest was placed at the center of the reconstruction with a smaller FOV, ensuring maximized image spatial resolution improvement in the 512×512 matrix image.
Image Quality Analysis
All scan data were uploaded to the Picture Archiving and Communication System (PACS) and the Siemens dual-source workstation using the maximum intensity projection (MIP), multiple planar reconstruction (MPR), curved planar reconstruction (CPR), and volume rendering (VR) for reconstructing coronary arteries, pulmonary arteries, and the aorta.
Image quality analysis and blind assessment were conducted by three associate chief physicians specialized in chest imaging diagnosis using a 5-point scale. The coronary arteries were divided into 10 segments for observation according to the “American Heart Association Coronary Artery Improvement Segmental Method”.16 The aorta was divided into the ascending aorta, aortic arch, and descending aorta for observation, following the DeBakey classification of aortic dissection.17 The pulmonary artery was divided into 27 segments, considering the central and peripheral pulmonary arteries. The maximum region of interest (ROI) was selected to measure and calculate the CT values, image noise, signal-to-noise ratio (SNR), and contrast noise ratio (CNR) for the aortic root, main pulmonary artery, left pulmonary trunk, right pulmonary artery trunk, right coronary artery, left coronary artery trunk, anterior descending branch, and circumflex branch in patients from the three groups, while avoiding vascular wall calcification and image artifacts.
The standard deviation (SD) of CT measurements for target blood vessels at the detection level was interpreted as representing image noise, while concurrently measuring both the CT values and SD of back muscles at the same detection level. The corresponding SNR and CNR were calculated according to SNR = CT value/SD and CNR = (vascular CT value - muscle CT value)/muscle CT value. In cases of inconsistent results, the three associate chief physicians resolved the discrepancies through discussion and reached a unified diagnostic standard.
Three associate chief physicians specializing in thoracic imaging conducted image quality assessment using a 5-point scale.18 Image quality criteria were as follows: 5 points: Images displayed continuous main vessel lumens of the pulmonary artery, aorta, and coronary artery, with clear vessel walls and good contrast with surrounding tissues, free of motion artifacts. 4 points: Images displayed continuous main vessel lumens of the pulmonary artery, aorta, and coronary artery, with slightly blurred vessel wall boundaries but better contrast with surrounding tissues, accompanied by minor motion artifacts not affecting image reconstruction. 3 points: Images displayed continuous main vessel lumens of the pulmonary artery, aorta, and coronary artery, with segmental fuzzy vessel wall boundaries, obvious motion artifacts, and poor contrast with surrounding tissues. However, careful identification did not affect image diagnosis. 2 points: Images displayed discontinuous lumens in some vessels of the pulmonary artery, aorta, and coronary artery, with blurred vessel walls, poor contrast with surrounding tissues, obvious motion artifacts, step artifacts, and difficult diagnosis. 1 point: Images displayed dislocated and discontinuous main vessel lumens of the pulmonary artery, aorta, and coronary artery, with unclear vascular walls and indistinguishable from surrounding tissues, exhibiting severe motion artifacts that could not be identified and diagnosed. An image score of ≥ 3 was considered to meet image diagnostic criteria.19
The effective dose (ED) was calculated using the formula: ED = k* dose length product (DLP) (mSv/(mGy·cm)), where k = 0.014 is the chest conversion factor,20 and DLP is the Dose Length Product, which can be read directly from the machine’s scanning sequence.
Statistical Analysis
Data from the modified, traditional, and FLASH groups were analyzed using SPSS 23.0 software. Measurement data with normal distribution were expressed as mean ± SD, while non-normally distributed data were presented as nonparametric variables, using median and interquartile range. Counting data were described as frequencies or percentages. The chi-square test was used for pairwise comparisons between groups, while Fisher’s exact probability method was employed in cases where the sample sizes were small or when expected cell frequencies were low. A P-value < 0.05 was considered statistically significant.
Result
Comparative Analysis of Clinical Data and Examination Parameters
No significant statistical differences were observed among the three groups in terms of age, BMI, heart rate, and other clinical basic data (all P > 0.05). However, there were statistical differences among the groups regarding examination parameters such as contrast dosage, flow rate, and radiation dose (all P < 0.05), as shown in Figure 2A–G.
 |
Figure 2 Patient clinical data and CM injection information. (A–G) Shows the comparison of age, body mass index (BMI), contrast media (CM) volume, CM flow rate, heart rate, dose length product (DLP), effective dose (ED) and other parameters of patients across the three groups, respectively. |
Objective Evaluation of Patient Images
Statistically significant differences were found in the CT values of the aorta, main pulmonary artery, right pulmonary artery, left pulmonary artery, right coronary artery, anterior descending branch, and circumflex branch (P < 0.05). The CT values of ascending thoracic aorta (AA), right pulmonary artery (RCA), left main coronary artery (LM), left anterior descending (LAD), and left circumflex artery (LCX) in the traditional group were higher than those in the modified group and FLASH group. The CT values of AA, RCA, LM, LAD, and LCX in the FLASH group were significantly higher than those in the modified group, with a statistically significant difference (P-value for modified group versus traditional group (P_mo-tr) < 0.05, P-value for modified group versus FLASH group (P_mo-F) < 0.05, P-value for traditional group versus FLASH group (P_tr-F) < 0.05). The CT values of left pulmonary artery (LPA), right pulmonary artery (RPA) and pulmonary artery root in the modified group and FLASH group were significantly higher than those in the traditional group, with a statistically significant difference (P_mo-tr = P_tr-F = 0.000 < 0.05). The CT values of the pulmonary trunk, RPA, and LPA between the modified group and FLASH group were statistically significant (P_mo-F < 0.05, P_mo-tr < 0.05), as shown in Figure 3A–H. No statistical significance was observed in image noise, CNR, and SNR among the three groups (P > 0.05), as shown in Figures 4A–H, 5A–H and 6A–H.
 |
Figure 3 Comparison of CT values in the three groups. (A–H) Shows the comparison CT values of aorta ascendens, right pulmonary artery (RCA), left main coronary artery (LM), left anterior descending (LAD), left circumflex artery (LCX), left pulmonary artery (LPA), right pulmonary artery (RPA) and pulmonary artery root across the three groups. |
 |
Figure 4 Comparison of image noise in the three groups. (A–H) Shows the comparison of image noise levels in aorta ascendens, main pulmonary artery, right pulmonary artery (RPA), left pulmonary artery (LPA), right pulmonary artery (RCA), left main coronary artery (LM), left anterior descending (LAD) and left circumflex artery (LCX) across the three groups. |
 |
Figure 5 Comparison of CNR in the three groups. (A–H) Shows the comparison of contrast noise ratio (CNR) in aorta ascendens, right pulmonary artery (RCA), left main coronary artery (LM), left anterior descending (LAD) and left circumflex artery (LCX), left pulmonary artery (LPA), right pulmonary artery (RPA) and pulmonary artery root across the three groups. |
 |
Figure 6 Comparison of SNR in the three groups. (A–H) Shows the comparison of signal-to-noise ratio (SNR) in aorta ascendens, right pulmonary artery (RCA), left main coronary artery (LM), left anterior descending (LAD) and left circumflex artery (LCX), left pulmonary artery (LPA), right pulmonary artery (RPA) and pulmonary artery root across the three groups. |
Subjective Evaluation of Patient Images
The theoretical number of coronary segments in the traditional, modified, and FLASH groups was 2000, 1920, and 2040, respectively, while the actual number of visible coronary segments was 1894, 1650, and 1876, respectively. The theoretical number of pulmonary artery segments in the three groups was 5400, 5184, and 5508, respectively, while the actual number of visible artery segments was 4918, 4136, and 4244, respectively. The theoretical number of aortic artery segments in the three groups was 600, 576, and 612, respectively, while the actual number of visible artery segments was 576, 504, and 588, as shown in Figure 7A–I.
 |
Figure 7 Comparison of the number of target vessel development segments in the three groups. (A–I) Shows presents the comparison of the number of target vessel development segments in the total coronary artery count, as well as in the right pulmonary artery (RCA), left main coronary artery (LM), left anterior descending artery (LAD), left circumflex artery (LCX), left pulmonary artery (LPA), right pulmonary artery (RPA), total pulmonary artery count, and aorta ascendens across the three groups. |
The images of the three groups were evaluated using the five-point method. The scores of AA, RCA, LM, LAD, and LCX in the traditional group were higher than those in the modified group and FLASH group, with a statistically significant difference (all P < 0.05). However, no significant difference was found in AA, RCA, LM, LAD, and LCX scores between the modified and FLASH groups (all P > 0.05). The scores of the pulmonary trunk, RPA, and LPA in the modified and FLASH groups were higher than those in the traditional group, with a statistically significant difference (all P < 0.05). No significant difference was observed in pulmonary trunk, RPA, and LPA scores between the modified group and FLASH group (all P > 0.05).
The total scores for the traditional, modified, and FLASH groups were 4.31 ± 0.22, 4.68 ± 1.77, and 4.68 ± 1.76, respectively. The total score of the traditional group was significantly higher than that of the modified group and the FLASH group (P_mo-tr = 0.000 < 0.05 < 0.01). However, there was no statistical significance in the total score between the modified group and the FLASH group (P_mo-F = 0.876 > 0.05), as shown in Figure 8A–H.
 |
Figure 8 Comparison of image scores in the three groups. (A–H) Shows the comparison of image scores in aorta ascendens, right pulmonary artery (RCA), left main coronary artery (LM), left anterior descending (LAD) and left circumflex artery (LCX), left pulmonary artery (LPA), right pulmonary artery (RPA) and main pulmonary artery across the three groups. |
Although the CT values of the aorta in the modified group and FLASH group were lower than those in the traditional group, both groups could accurately identify the disease and met the imaging diagnostic criteria. The CT values of the pulmonary artery in the modified group and FLASH group were significantly higher than those in the traditional group. While the results of the two groups met the imaging diagnostic criteria, the modified group could significantly improve the diagnosis rate of Grade 3–4 pulmonary artery minor branch embolism. The residual amount of contrast in the superior vena cava in the FLASH group was significantly lower than that in the traditional group and the modified group, which greatly reduced the X-ray hardening artifacts caused by the residual CM in the superior vena cava and improved the image quality (as shown in Figure 9A–I).
 |
Figure 9 A 48-year-old man in the traditional group presenting with an aortic aneurysm combined with an aortic dissection (solid red arrow), as depicted in panels (A, D and G). A 54-year-old male in the modified group exhibiting aortic dissection (solid white arrow), as illustrated in panels (B, E and H). A 49-year-old male in the FLASH group displaying multiple calcifications of the aortic wall (red hollow arrow), as shown in panels (C, F and I). |
The stenosis rate of the LAD in the traditional group was as high as 90% (at the red solid arrow), while the stenosis rate of the LAD in the FLASH group was 40% (at the red hollow arrow) with calcification of the vascular wall near the LAD. Although the coronary CT values of the modified group and the FLASH group were lower than those of the traditional group, the images of the three patients all met the diagnostic criteria. The number of coronary artery segments visible and image quality evaluation were essentially the same (as shown in Figure 9B, C, E, F, H and I).
Discussion
In this study, we comprehensively compared the individualized application effects of various injection methods of CM, ROI monitoring sites, distinct scanning modes, and varying flow rates and volumes of CM in TRO-CTA imaging among the traditional, modified, and FLASH groups. It is evident from the examination results that the reconstructed images satisfy clinical diagnostic requirements, given that the examination machine, scanning parameters, CM type, and post-recombination processing software are constant.
The scanning method involved monitoring the CT value at the root of the ascending aorta; when it reached 100 hU, the scan was automatically triggered with a 6-second delay. However, this method exhibited limitations, such as insufficient CM filling in the vessel and a low CT value of 250 to 300 hU. The injection time of CM in the modified and FLASH groups was 12–14 seconds, while the injection time of normal saline was 10 seconds. The scanning method involved monitoring the CT value in the pulmonary artery root. Upon reaching a CT value of 100 hU at the monitoring points the scanning time for the modified and FLASH groups was 6–8 seconds earlier than that of the traditional group. This led to a superior filling effect of CM in the distal branch of the pulmonary artery compared to the traditional method, effectively displaying the grade 3–4 small branches of the pulmonary artery and enabling diagnosticians to detect small pulmonary embolisms easily. The CT value of the pulmonary artery ranged from approximately 350 hU to 480 hU. By increasing the injection rate of CM, the time difference between the peak CT values of CM in the pulmonary artery and the aorta was shortened. Despite the aorta and coronary artery being in the early arterial phase, CT values of approximately 300–400 hU still met the imaging diagnostic criteria. In the second stage, the CM volume was 0.8 mL/kg for both the modified and FLASH groups and 1.1 mL/kg for the traditional group. In the third stage, the 0.9% NaCl volume was 50 mL for both the modified and FLASH groups and 30 mL for the traditional group. Consequently, the total amount of fluid administered to the patients was similar across groups. However, the volume of CM in the modified group and FLASH group was 60 ~ 70 mL, which was nearly 30 mL less than that of the traditional method using 85 ~ 100 mL.
The results demonstrated that the volume of CM in the traditional group was larger than that in the modified and FLASH groups, and its flow rate was slightly slower. CT values of the coronary artery, aorta, and its branches in the traditional group were significantly higher than those in the modified and FLASH groups, while CT values of the pulmonary artery and its branches were significantly lower. Notably, the CT values of all three component images met the diagnostic criteria (aortic and coronary CT values ≥ 300 hU, pulmonary artery CT values ≥ 250 HU).21–24 Additionally, the volume of CM in the modified and FLASH groups was reduced by nearly 30 mL compared to the traditional group. The radiation dose generated by the FLASH scanning mode in the FLASH group was significantly lower than that produced by the retrospective electrocardiogram-gated spiral scanning mode in the traditional and modified groups. There were no significant differences in the number of vascular development segments, image noise, SNR, and CNR among the three groups in TRO-CTA imaging. The total scores of the traditional, modified, and FLASH groups were 4.31 ± 0.22, 4.68 ± 1.77, and 4.68 ± 1.76, respectively, satisfying the basic requirements for image diagnosis (score ≥ 3).19 In conclusion, combining the CM injection method with the ROI monitoring point location can significantly reduce the CM volume while lowering the risk of toxic and side effects, all while ensuring that image quality meets diagnostic standards. The retrospective electrocardiogram-gated spiral scanning mode, which employs image data from 4 to 6 cardiac cycles, has a longer examination time and higher radiation dose, which can result in staggered artifacts due to patients’ inability to hold their breath and make vascular reconstruction impossible. In contrast, the second-generation dual-source CT’s FLASH scanning mode utilizes a 3.4 large-pitch scanning approach, shortening the examination time to 0.28 seconds.25 While the FLASH scanning mode with the modified CM injection method only collects image data from patients within a relatively fixed cardiac cycle and cannot be retrospectively reconstructed, it greatly improves the success rate of data acquisition for 4 to 6 cardiac cycles when compared to the retrospective electrocardiogram-gated spiral scan mode. This improvement, along with the further reduction of CM volume and radiation dose, plays a pivotal role in the development of TRO-CTA “double low scan”.26
More and more studies explored methods to improve the quality of chest CT scan images. Pritpal Singh et al published two papers proposing advanced methods for the early detection and segmentation of COVID-19 using chest CT scan images. One presented the FFQOAK method, which combined K-means clustering (KMC) and a fast forward quantum optimization algorithm (FFQOA) for accurate segmentation. It achieved high performance in detecting infected regions, outperforming existing methods in terms of mean squared error, peak signal-to-noise ratio, Jaccard similarity, and correlation coefficient.27 The other paper introduced the ADMFCA algorithm, based on ambiguous set theory, to improve clustering of noisy and low-resolution CT images. By categorizing pixel values as true, false, or ambiguous, it enhanced clustering accuracy. Tested on 40 CT scan images, ADMFCA outperformed five other clustering methods, demonstrating its effectiveness for early COVID-19 detection. Both studies emphasized the role of innovative algorithms in enhancing the precision of medical image analysis for COVID-19 diagnosis.28
Different rates of CM injection were employed in the traditional, modified, and FLASH groups, which also influenced the pain at the injection site and the probability of CM extravasation. In this study, CM was injected at 4.0–4.5 mL/s and 5.0–5.5 mL/s, respectively. No significant differences were observed in patients’ perceptions of pressure and pain at the injection site, and no CM extravasation occurred in any of the three groups after CM injection, suggesting that the modified CM injection rate did not significantly affect the patients’ sensory experience or the imaging process. After injecting a high concentration of CM, the patient’s blood viscosity inevitably increases, and the blood flow velocity slows down, which is conducive to improving image clarity.29
According to literature reports, injecting normal saline following the administration of CM can push the remaining CM in the duct and peripheral vein into the great vessels, thereby reducing the radial artifact caused by the remaining large amount of CM in the superior vena cava and more effectively utilizing the CM for great vessel imaging.30 Consequently, the third phase of saline injection is crucial. Moreover, Cademartiri31 conducted two experimental groups: the first group injected 140 mL of CM at a rate of 4 mL/s, and the second group injected 140 mL of CM at a rate of 4 mL/s, followed by 40 mL of normal saline at the same rate. Both groups used the same CM, injection rate, and total fluid injection volume. Ultimately, the pulmonary artery, coronary artery, and aorta met the diagnostic requirements in both groups; however, the first group exhibited radial artifacts due to the large amount of remaining CM in the superior vena cava, which severely interfered with coronary artery imaging. Furthermore, no significant difference was observed in the CM content in the coronary arteries and aorta between the two groups. In the second group, the injection of normal saline effectively extended the CM in the tube, thereby reducing the volume of CM, minimizing the risk of renal dysfunction and other reactions induced by CM, and alleviating some financial burden for patients. Thus, the Phase III injection regimen in this study holds substantial clinical value.
In the modified and FLASH groups, residual CM was fully injected into the vein using 0.9% NaCl 50 mL in the third stage, effectively reducing hardening artifacts caused by residual excess CM in the superior vena cava while achieving optimal filling of the pulmonary artery. Additionally, kidney toxicity and other allergic reactions associated with CM were significantly reduced. The toxic and side effects of CM have been linked to allergic predispositions, serious cardiovascular diseases, liver and kidney diseases, respiratory diseases, long-term use of beta-blockers, calcium antagonists, metformin, and iodine allergies, among other factors.
A small amount of CM was employed to clearly display the coronary artery, pulmonary artery, and aorta, ensuring the results met diagnostic imaging requirements. This facilitated the detection of significant lesions in the coronary arteries, aorta, and pulmonary arteries of patients with acute chest pain, substantially reducing patient mortality.32 The positive rates of coronary artery, aorta, and pulmonary artery lesions were 52%, 48%, and 46% in the traditional, modified, and FLASH groups, respectively. Nearly half of the chest pain cases are caused by acute pneumonia, acute pleurisy, pneumothorax, pleural effusion, costochondritis, digestive tract ulcers, acute pancreatitis, reflux esophagitis, acute pulmonary edema, diffuse pulmonary hemorrhage, acute infectious bronchitis, allergic bronchiolitis, and acute pericarditis. The positive rate of patients in the three groups was nearly identical, and the CT values and scores of target vessels after recombination aligned with imaging diagnostic criteria, not affecting disease diagnosis. No significant adverse reactions to CM were observed in any of the three groups in this study. The aforementioned research results demonstrate that in TRO-CTA imaging, there are no significant differences in imaging effects and CM safety between the traditional, modified, and FLASH groups. The FLASH group utilizes the original FLASH prospective gated large-pitch spiral scanning mode of the second-generation dual-source CT, completing the entire scan in less than one second.33 This “freezing technology” substantially shortens scanning time, significantly reduces CM volume and radiation dose, and lays the foundation for the realization of the “double low scanning” technology in TRO-CTA.
Numerous studies in the literature have investigated CM injection methods in TRO-CTA examinations, with all of them placing the monitoring point in the aorta and automatically delaying scanning by 5–6 seconds once the CT value of the monitoring point reaches 100HU. Otherwise, the pulmonary artery’s imaging quality cannot be guaranteed. In this study, by increasing the CM injection rate and rapidly injecting it into the aorta and coronary artery while the pulmonary artery is well-filled, early arterial images are captured. This approach allows for the use of a smaller CM amount in a shorter time, resulting in excellent pulmonary artery visualization while still meeting the diagnostic requirements for the aorta and coronary artery.
Limitations of this study include the small sample size of TRO-CTA examinations in the three groups, necessitating further verification with a larger sample size. Patients’ image quality may vary due to differences in age, gender, cardiovascular circulation function, respiration, heart rate, and other factors. The study focuses on the Siemens dual-source second-generation spiral CT, and the CM injection method may not be suitable for all CT models. Patients with arrhythmia and those unable to cooperate with breathing training were not included in the study, limiting patient selection. Additionally, it’s worth further exploring how to match these different contrast injection and imaging methods to chest pain patients with various clinical scenarios. However, due to the retrospective nature of this study and the lack of comprehensive data on these specific conditions in the available medical records, we were unable to conduct this match. Future studies should focus on developing tailored approaches for more precise diagnosis and treatment of chest pain.
Conclusions
The study found no significant differences in image noise, SNR, CNR, the number of developing segments, or image score among the traditional, modified, and FLASH groups. However, the modified CM injection method improved diagnostic image quality by reconstructing pulmonary artery, aorta, and coronary artery images that met diagnostic criteria, with key factors including ROI monitoring site selection and injection methods. Compared to the traditional group, the modified approach reduced CM volume by approximately 30 mL, leading to lower renal toxicity, fewer side effects, and decreased patient mortality. Additionally, the FLASH group’s scanning mode maintained image quality while reducing CM volume and radiation dose. Ultimately, the modified CM injection method enhanced pulmonary imaging and is recommended for clinical use. This approach not only improves image quality but also has significant implications for patient safety, reducing both the required CM volume and the associated risks during TRO-CTA examinations.
In conclusion, adopting the modified CM injection method combined with the FLASH scanning mode provides a promising strategy to improve the diagnostic effectiveness and safety of TRO-CTA, offering substantial benefits to clinical practice.
Data Sharing Statement
The data that support the findings of this study are available from the corresponding author upon reasonable request.
Ethics Declarations
This study was designed in accordance with the Declaration of Helsinki. This study received approval from the Ethics Committee of Lianyungang First People’s Hospital (approval number: KY-20211217001-01).
Consent for Participate
All patients in the three groups were examined by the same radiographer and provided informed consent before the examination.
Acknowledgments
No funds, grants, or other support was received for this study. The abstract of this paper was presented at the 20th Imaging Technology Academic Conference of Jiangsu Medical Association as a poster presentation.
Author Contributions
All authors made a significant contribution to the work reported, whether that is in the conception, study design, execution, acquisition of data, analysis and interpretation, or in all these areas; took part in drafting, revising or critically reviewing the article; gave final approval of the version to be published; have agreed on the journal to which the article has been submitted; and agree to be accountable for all aspects of the work.
Disclosure
The authors declare no competing interests in this work.
References
1. Galea N, Bellu R, Catapano F, et al. Coronary computed tomography angiography in acute chest pain: a sustainable model with remote support. Eur J Radiol. 2022;151:110277. doi:10.1016/j.ejrad.2022.110277
2. Fischer AM, van Assen M, Schoepf UJ, et al. Non-invasive fractional flow reserve (FFR(CT)) in the evaluation of acute chest pain - Concepts and first experiences. Eur J Radiol. 2021;138:109633. doi:10.1016/j.ejrad.2021.109633
3. Russo V, Sportoletti C, Scalas G, et al. The triple rule out CT in acute chest pain: a challenge for emergency radiologists? Emerg Radiol. 2021;28:735–742. doi:10.1007/s10140-021-01911-8
4. Kukla P, Długopolski R, Krupa E, et al. How often pulmonary embolism mimics acute coronary syndrome? Kardiol Pol. 2011;69:235–240.
5. Volvovitch D, Ram E, Cohen H, Kogan A, Sternik L, Raanani E. Acute pulmonary embolism following acute type A aortic dissection in a patient with COVID-19. J Card Surg. 2021;36:1566–1568. doi:10.1111/jocs.15389
6. Takx RA, Wichmann JL, Otani K, et al. Downstream testing and cost-effectiveness of triple-rule-out CTA in acute chest pain. Eur Heart J. 2017;38. doi:10.1093/eurheartj/ehx502.2273
7. Liu LP, Shapira N, Sahbaee P, et al. Consistency of spectral results in cardiac dual-source photon-counting CT. Sci Rep. 2023;13:14895. doi:10.1038/s41598-023-41969-7
8. Oda S, Utsunomiya D, Nakaura T, et al. Basic concepts of contrast injection protocols for coronary computed tomography angiography. Curr Cardiol Rev. 2019;15:24–29. doi:10.2174/1573403x14666180918102031
9. Eijsvoogel NG, Hendriks BMF, Willigers JL, et al. Personalization of injection protocols to the individual patient’s blood volume and automated tube voltage selection (ATVS) in coronary CTA. PLoS One. 2018;13:e0203682. doi:10.1371/journal.pone.0203682
10. Kuersten B, Nahar T, Vannan MA. Methods of contrast administration for myocardial perfusion imaging: continuous infusion versus bolus injection. Am J Cardiol. 2002;90:35J–37J. doi:10.1016/s0002-9149(02)02946-6
11. Shah BN, Senior R. Bolus injection or continuous infusion for the assessment of myocardial blood flow during perfusion stress echocardiography? Eur Heart J Cardiovasc Imaging. 2012;13:118. doi:10.1093/ejechocard/jer279
12. Bhargava A, Monteagudo B, Kushwaha P, et al. VascuViz: a multimodality and multiscale imaging and visualization pipeline for vascular systems biology. Nat Methods. 2022;19:242–254. doi:10.1038/s41592-021-01363-5
13. Won JH, Jeon Y, Rosenberg JK, Yoon S, Rubin GD, Napel S. Uncluttered single-image visualization of vascular structures using GPU and integer programming. IEEE Trans Vis Comput Graph. 2013;19:81–93. doi:10.1109/TVCG.2012.25
14. Wang K, Wang X, Zheng S, Li C, Jin L, Li M. Dedicated CCTA followed by high-pitch scanning versus TRO-CT for contrast media and radiation dose reduction: a retrospective study. Diagnostics. 2022;12:2647. doi:10.3390/diagnostics12112647
15. Monica MP, Merkely B, Szilveszter B, Drobni ZD, Maurovich-Horvat P. Computed tomographic angiography for risk stratification in patients with acute chest pain - the triple rule-out concept in the emergency department. Curr Med Imaging Rev. 2020;16:98–110. doi:10.2174/1573405614666180604095120
16. Kotecha D, Garcia-Guimaraes M, Premawardhana D, et al. Risks and benefits of percutaneous coronary intervention in spontaneous coronary artery dissection. Heart. 2021;107:1398–1406. doi:10.1136/heartjnl-2020-318914
17. Takx RAP, Vliegenthart R, Schoepf UJ, et al. Prognostic value of CT-derived left atrial and left ventricular measures in patients with acute chest pain. Eur J Radiol. 2017;86:163–168. doi:10.1016/j.ejrad.2016.11.013
18. Halpern EJ, Levin DC, Zhang S, Takakuwa KM. Comparison of image quality and arterial enhancement with a dedicated coronary CTA protocol versus a triple rule-out coronary CTA protocol. Acad Radiol. 2009;16:1039–1048. doi:10.1016/j.acra.2009.03.013
19. Wong DT, Soh SY, Ko BS, et al. Superior CT coronary angiography image quality at lower radiation exposure with second generation 320-detector row CT in patients with elevated heart rate: a comparison with first generation 320-detector row CT. Cardiovasc Diagn Ther. 2014;4:299–306. doi:10.3978/j.issn.2223-3652.2014.08.05
20. Trattner S, Halliburton S, Thompson CM, et al. Cardiac-specific conversion factors to estimate radiation effective dose from dose-length product in computed tomography. JACC Cardiovasc Imaging. 2018;11:64–74. doi:10.1016/j.jcmg.2017.06.006
21. Angelillis M, Costa G, De Backer O, et al. Threshold for calcium volume evaluation in patients with aortic valve stenosis: correlation with Agatston score. J Cardiovasc Med. 2021;22:496–502. doi:10.2459/jcm.0000000000001145
22. De Santis D, Caruso D, Schoepf UJ, et al. Contrast media injection protocol optimization for dual-energy coronary CT angiography: results from a circulation phantom. Eur Radiol. 2018;28:3473–3481. doi:10.1007/s00330-018-5308-3
23. Chen M, Mattar G, Abdulkarim JA. Computed tomography pulmonary angiography using a 20% reduction in contrast medium dose delivered in a multiphasic injection. World J Radiol. 2017;9:143–147. doi:10.4329/wjr.v9.i3.143
24. Kim C, Lee CW, Hong GS, et al. Assessment of pulmonary arterial enhancement on CT pulmonary angiography using a leg vein for contrast media administration. Medicine. 2017;96:e9099. doi:10.1097/md.0000000000009099
25. Thai WE, Wai B, Lin K, et al. Pulmonary venous anatomy imaging with low-dose, prospectively ECG-triggered, high-pitch 128-slice dual-source computed tomography. Circ Arrhythm Electrophysiol. 2012;5:521–530. doi:10.1161/circep.111.968313
26. Takx RAP, Wichmann JL, Otani K, et al. In-hospital cost comparison of triple-rule-out computed tomography angiography versus standard of care in patients with acute chest pain. J Thorac Imaging. 2020;35:198–203. doi:10.1097/rti.0000000000000474
27. Singh P, Bose SS. A quantum-clustering optimization method for COVID-19 CT scan image segmentation. Expert Syst Appl. 2021;15:115637. doi:10.1016/j.eswa.2021.115637
28. Singh P, Bose SS. Ambiguous D-means fusion clustering algorithm based on ambiguous set theory: special application in clustering of CT scan images of COVID-19. Knowl Based Syst. 2021;14:107432. doi:10.1016/j.knosys.2021.107432
29. Kulkarni NS. Long-term risks are similar for CTA and invasive coronary angiography as initial diagnostic strategy for stable chest pain. Am Fam Physician. 2022;106:720.
30. Muroga K, Hatcho A, Otsuka T, Fukuzawa A, Tsukimata T, Kawamura C. [Assessment of the effects of administering a saline solution flush after contrast medium injection using different injection durations and flush methods]. Nihon Hoshasen Gijutsu Gakkai Zasshi. 2012;68:711–719. Danish. doi:10.6009/jjrt.2012_jsrt_68.6.711
31. Cademartiri F, Mollet NR, van der Lugt A, et al. Intravenous contrast material administration at helical 16-detector row CT coronary angiography: effect of iodine concentration on vascular attenuation. Radiology. 2005;236:661–665. doi:10.1148/radiol.2362040468
32. Chae B, Ahn S, Ryoo SM, et al. Performance analysis considering endpoints for three accelerated diagnostic protocols for chest pain. Am J Emerg Med. 2023;64:51–56. doi:10.1016/j.ajem.2022.11.020
33. Smettei OA, Sayed S, A MAH, Alharbi F, Abazid RM. Ultra-fast, low dose high-pitch (FLASH) versus prospectively-gated coronary computed tomography angiography: comparison of image quality and patient radiation exposure. J Saudi Heart Assoc. 2018;30:165–171. doi:10.1016/j.jsha.2017.11.001
 © 2025 The Author(s). This work is published and licensed by Dove Medical Press Limited. The
full terms of this license are available at https://www.dovepress.com/terms
and incorporate the Creative Commons Attribution
- Non Commercial (unported, 3.0) License.
By accessing the work you hereby accept the Terms. Non-commercial uses of the work are permitted
without any further permission from Dove Medical Press Limited, provided the work is properly
attributed. For permission for commercial use of this work, please see paragraphs 4.2 and 5 of our Terms.
© 2025 The Author(s). This work is published and licensed by Dove Medical Press Limited. The
full terms of this license are available at https://www.dovepress.com/terms
and incorporate the Creative Commons Attribution
- Non Commercial (unported, 3.0) License.
By accessing the work you hereby accept the Terms. Non-commercial uses of the work are permitted
without any further permission from Dove Medical Press Limited, provided the work is properly
attributed. For permission for commercial use of this work, please see paragraphs 4.2 and 5 of our Terms.