Back to Journals » Diabetes, Metabolic Syndrome and Obesity » Volume 18
Comparative Predictive Value of the TyG Index and UHR for Lower Extremity Artery Disease in Type 2 Diabetes: A Retrospective Analysis
Authors Shao C ![]() , Fei C, Gu M, Zha X, Li J, Zheng D, Wang D, Wang Y, Hu X
, Fei C, Gu M, Zha X, Li J, Zheng D, Wang D, Wang Y, Hu X
Received 30 September 2024
Accepted for publication 18 April 2025
Published 29 April 2025 Volume 2025:18 Pages 1341—1351
DOI https://doi.org/10.2147/DMSO.S496727
Checked for plagiarism Yes
Review by Single anonymous peer review
Peer reviewer comments 2
Editor who approved publication: Professor Jae Woong Sull
Chen Shao,1 Chengzhi Fei,2 Mingxue Gu,1 Xiujing Zha,1 Juan Li,1 Delu Zheng,1 Diwen Wang,1 Yanqiu Wang,1 Xiaolei Hu3
1Department of Endocrinology, The Second Affiliated Hospital of Bengbu Medical University, Bengbu, 233000, People’s Republic of China; 2Department of Nephrology, The Second Affiliated Hospital of Bengbu Medical University, Bengbu, 233000, People’s Republic of China; 3Department of Endocrinology, The First Affiliated Hospital of Bengbu Medical University, Bengbu, 233000, People’s Republic of China
Correspondence: Yanqiu Wang, Email [email protected] Xiaolei Hu, Email [email protected]
Objective: To compare the predictive value of triglyceride glucose index (TyG) and the ratio of serum uric acid (SUA) to high-density lipoprotein cholesterol (HDL-C) (UHR) for lower extremity atherosclerotic disease (LEAD) in type 2 diabetes (T2DM) patients.
Methods: 303 patients with T2DM were divided into LEAD group (n=192) and non-LEAD group (n=111) based on the results of lower extremity vascular color Doppler ultrasound. All patients were divided into a training set and a validation set at a 7:3 ratio. In the training set, Least absolute shrinkage and selection operator (LASSO) regression was applied to screen for predictive factors of LEAD, and a multivariate logistic regression model was constructed to analyze the predictive factors, with a nomogram being plotted. The discriminative ability and calibration of the model were evaluated using the receiver operating characteristic (ROC) curve area under the curve (AUC) and calibration curves in both the training and validation sets. Decision curve analysis (DCA) was used to evaluate the clinical net benefit.
Results: The variables selected by the LASSO regression included age, pulse pressure difference (PP), TyG, and UHR. The multivariate logistic regression model indicated that age, PP, TyG, and UHR were predictive factors for LEAD in T2DM patients (P< 0.05). ROC curve analysis suggested that the discriminatory ability was in the following order: the nomogram model (AUC=0.872), TyG (AUC=0.751), and UHR (AUC=0.709), which were greater than that of age and PP. TyG and UHR cut-off values were 9.836 and 216.248, respectively. The specificities of TyG and UHR were 0.760 and 0.547, and the sensitivities were 0.629 and 0.807, respectively. The calibration curve showed the model’s predictions matched actual conditions. DCA verified the model’s clinical benefit.
Conclusion: Both TyG and UHR have good predictive value and are suitable for screening LEAD in T2DM patients.
Keywords: type 2 diabetes, lower extremity atherosclerotic disease, triglyceride glucose index
Introduction
Type 2 Diabetes Mellitus (T2DM) can lead to a range of complications, among of which diabetic vascular disease is the most prevalent. Lower extremity atherosclerotic disease (LEAD), characterized by the buildup of fatty deposits in peripheral blood vessels (atherosclerosis), results in the progressive narrowing of the lower extremity arteries, representing the primary manifestation of peripheral arterial disease (PAD).1 LEAD is considered one of the common chronic complications of T2DM, becoming a significant public health concern, with its prevalence spreading globally in an epidemic pattern, impacting over 200 million individuals.2 In China, the incidence rate among T2DM patients reaches 21.2%,3 making it a substantial contributor to diabetic foot ulcers. However, the early manifestations of LEAD are not significant, and when it progresses to the terminal stage, it mainly relies on amputation treatment, seriously affecting the quality of life of patients. It is worth noting that 80% of people with diabetes globally live in low- and middle-income countries where many diagnostic tools are not readily available.4 Therefore, finding simple and reliable early predictive indicators is crucial for improving the prognosis of LEAD.
The TyG index is a composite indicator that can be performed by calculating the levels of routine fasting triglyceride (TG) and fasting blood glucose (FBG) in serum biochemistry. Recent studies have suggested that it is related to metabolic syndrome, coronary heart disease, and stroke occurrence.5–7 The ratio of serum uric acid (SUA) to high-density lipoprotein cholesterol (HDL-C) (UHR), another clinically easily obtainable indicator, as a new metabolic and inflammatory index, has a good predictive value in evaluating microvascular lesions in T2DM and metabolically related fatty liver diseases.8 It has been proposed to use the UHR as an efficient method for diagnosing cardiovascular diseases (CVD) risk in non-diabetic subjects in preclinical stages.9 Given that LEAD and CVD share common pathogenic mechanisms. Furthermore, whether TyG or UHR, both are inexpensive and clinically easily obtainable clinical indicators. The research on their correlation with LEAD is still quite limited.
Thus, this study integrates TyG and UHR, two readily accessible indicators, to assess the correlation between TyG, UHR, and LEAD in patients with T2DM. It aims to explore the predictive value of both indicators for LEAD among T2DM patients, with the hope of identifying early predictive markers for LEAD in this patient population.
Subjects
In this study, 303 patients with T2DM who were hospitalized in the Department of Endocrinology of the Second Affiliated Hospital of Bengbu Medical University from January 2023 to December 2023 were selected, all of them met the diagnostic and classification criteria of the Chinese Guidelines for Type 2 Diabetes Prevention and Treatment (2020 edition).10 Exclusion criteria included history of hypothalamus and pituitary disease, thyroid disease; patients with diabetic acute complications, severe liver and kidney dysfunction; patients in acute infection, surgery and stress states such as malignancy, patients with gout and recent use of drugs that affect uric acid levels and lipid-lowering drugs (such as diuretics, hydrochloric acid drugs, hyaluronic acid drugs, sodium bicarbonate, statins, beta-blockers, etc); patients with acute cerebral infarction, acute myocardial infarction, pregnancy or lactation. The work described has been carried out in accordance with The Code of Ethics of the World Medical Association (Declaration of Helsinki) for experiments involving Humans, which has been approved by the hospital’s ethics committee (Ethical approval number [2023]269). All patients signed informed consent for the clinical study before being included in this research. All patients underwent color ultrasound examination of lower extremity arteries to record the number, echo, shape and size of plaques, and to examine the intima-media thickness (IMT) of bilateral common femoral arteries, superficial femoral arteries, popliteal arteries, anterior and posterior tibial arteries. According to the Guidelines for Vascular Ultrasound Examination,11 IMT <1.0 mm is defined as normal, while 1.0 mm ≤ IMT ≤ 1.5 mm is defined as thickening. Plaques are defined as local arterial wall thickening ≥ 1.5 mm. According to the Chinese Guidelines for Prevention and Treatment of Diabetic Foot (2019 edition),12 patients with endothelial thickening and plaque formation suggested by color ultrasound of lower extremity arteries are included in the LEAD group, while patients with normal intima thickness suggested by color ultrasound of lower extremity arteries are included in the non-LEAD group. All patients were divided into training sets and validation sets in a 7:3 ratio.
Methods
Collected all general information of the study subjects, including gender, age, disease duration, height, weight, body mass index (BMI), systolic blood pressure (SBP), diastolic blood pressure (DBP), pulse pressure (PP), history of hypertension, smoking, and drinking history, etc. All patients were instructed to abstain from water and food for 8–10 hours after dinner the night before. On the second day, venous blood was drawn in the early morning to test for fasting blood glucose (FBG), triglycerides (TG), total cholesterol (TC), high-density lipoprotein cholesterol (HDL-C), low-density lipoprotein cholesterol (LDL-C), serum uric acid (SUA), serum creatinine (Scr), and glycosylated hemoglobin (HbA1c), etc. Based on the above test results, the SUA/HDL-C (UHR) ratio and TyG = ln [triglycerides (mg/dL) × fasting blood glucose (mg/dL)/2] were calculated and recorded, and TyG × BMI was obtained by multiplying TyG and BMI.
Statistical Analysis
Statistical analysis was performed using SPSS 26.0 software (version 21; IBM Corp, Armonk, NY, USA). Normally distributed measurement data were expressed as mean  , and an independent sample t-test was used to compare the two groups. Count data were expressed as n (%) and the χ2 test was used. Spearman correlation analysis was used to analyze the correlation between UHR, TyG, and LEAD. Statistical analysis software R 4.4.1 (http://www.r-project.org) was used. In training sets, LASSO regression was used to screen predictive factors for LEAD occurrence and a multivariate logistic regression model was constructed to analyze predictive factors, also a nomogram was drawn. LASSO regression, accomplishes variable selection and complexity adjustment by formulating an optimization objective function that includes a penalty term. It is a regularization method used for linear regression.13 As the penalty coefficient λ increases, more and more variable coefficients are continuously compressed until they become zero, thereby achieving feature selection and retaining the most important features for the target variable. Compared to ordinary linear regression and ridge regression, LASSO regression can effectively avoid overfitting through regularization, enhance the model’s generalization ability, and has a stronger feature selection capability.14 In training sets and validation sets, the area under the receiver operating characteristic curve (AUC) and calibration curve were used to evaluate the discrimination and calibration of the nomogram. Additionally, decision curve analysis (DCA) was used to evaluate the clinical net benefit. The DeLong test was used to compare the differences between ROC curves. A P-value of less than 0.05 was considered statistically significant.
Results
Comparison of General Clinical Data and Biochemical Indicators
In the final analysis, there were 192 cases in the LEAD group and 111 cases in the non-LEAD group. The age of patients in the LEAD group was (61.16±11.55) years, and the duration of disease was (8.84±7.05) years. The age of patients in the non-LEAD group was (54.95±11.31) years, and the duration of disease was (6.02±5.57) years. The age and duration of disease in the LEAD group were significantly greater than those in the non-LEAD group (P<0.05). The proportion of male patients, smokers, patients with a history of cerebral infarction, and patients with diabetes treated with injectable drugs in the LEAD group were significantly higher than those in the non-LEAD group (P<0.05). The pulse pressure (PP), fasting blood glucose (FBG), serum uric acid (SUA), triglyceride (TG), TyG, and UHR in patients in the LEAD group were significantly higher than those in the non-LEAD group (P<0.05) (Table 1). All patients were divided into training sets and validation sets in a ratio of 7:3. The general clinical data and comparison of various indicators in the training set (n=215) and the validation set (n=88) were shown in Supplemental Table 1.
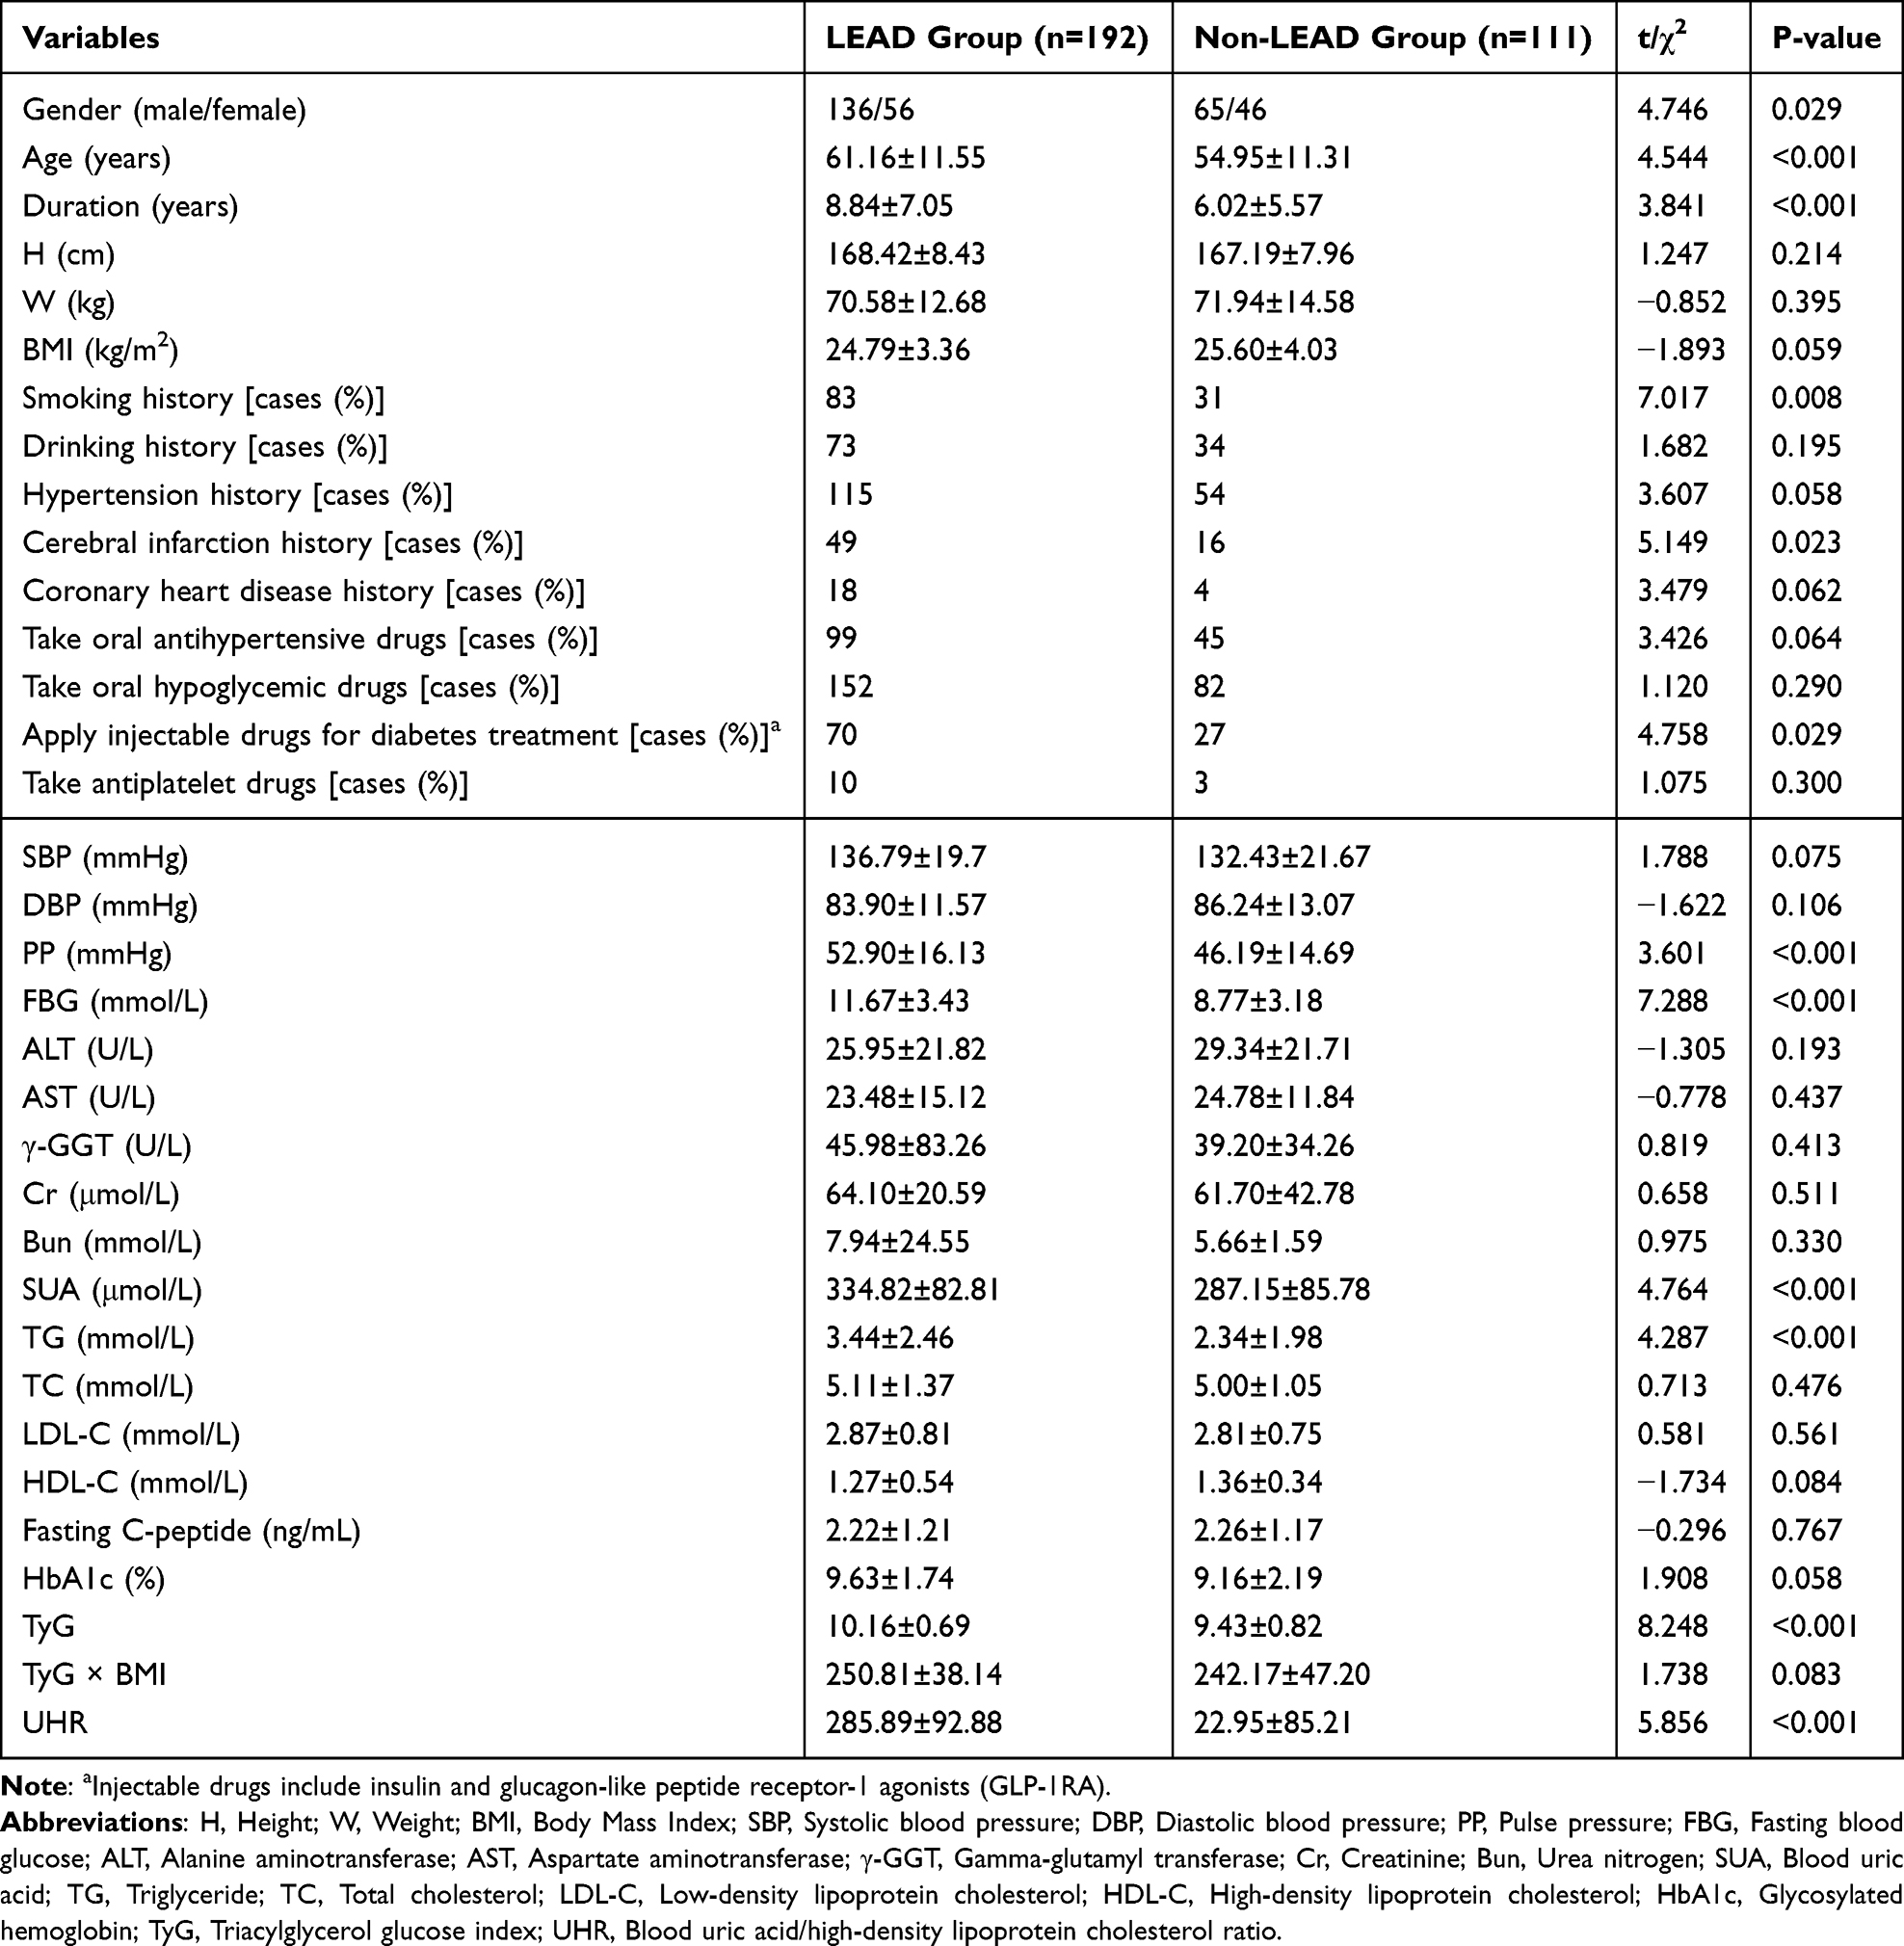 |
Table 1 General Clinical Data and Comparison of Various Indicators |
Spearman Analysis of the Correlation Between LEAD and Various Indicators
Spearman analysis suggested that age, duration of disease, PP, FBG, SUA, TG, TyG, and UHR were positively correlated with LEAD. Females were negatively correlated with LEAD. The correlation coefficients for TyG and UHR were 0.414, 95% confidence interval (95% CI) [0.312, 0.507] (P<0.001) and 0.337 (P<0.001), 95% CI [0.227, 0.433], respectively (Supplemental Table 2).
LASSO Regression Screening of Risk Factors Affecting LEAD in T2DM Patients
In this study, LASSO regression was used to identify feature factors. LASSO regression was used in the training sets with LEAD as the dependent variable and all 34 variables in Table 1 included. As λ was gradually compressed to 0, the optimal subset was screened out, consisting of four factors: TyG, UHR, PP and Age (Figure 1A). This study selected the maximum penalty coefficient λ=0.098 within one standard deviation of the mean square error to obtain the optimal model. We took factors as feature variables and perform cross-validation (Figure 1B), with the results indicating that the model had a good fit. The model performance is evaluated through the Hosmer-Lemeshow test (P=0.053, χ²≈15.23). The model calibration is well performed.
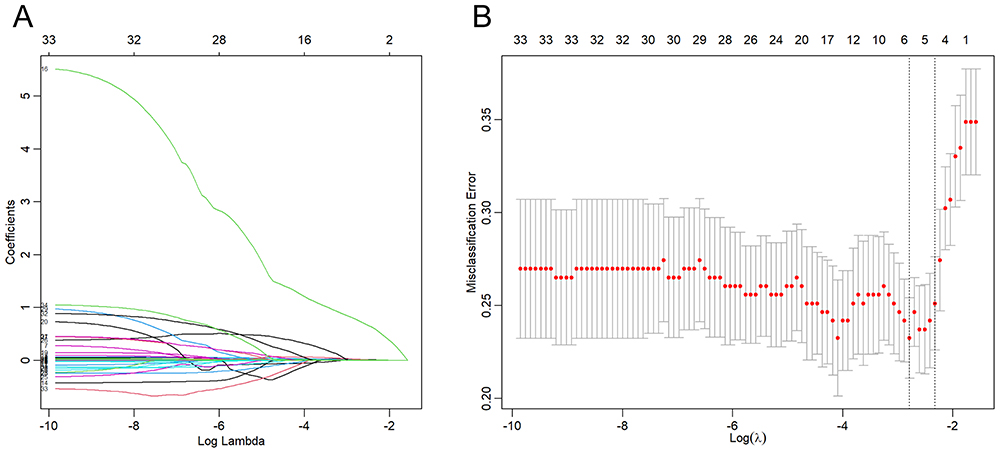 |
Figure 1 (A) LASSO regression coefficient path diagram. As the parameter λ increases, the punishment intensity increases, and the regression coefficients (ie, the values on the vertical axis) of the 34 variables gradually compress to zero until all of them are zero. (B) LASSO regression cross-validation. The x-axis is log(λ) and the y-axis is a mean square error. The optimal penalty coefficient is selected using 10-fold cross-validation and minimization criteria. The left dashed line in the figure represents the λ value when the mean square error is minimized; the right dashed line represents the maximum λ value within one standard deviation of the mean square error. |
Multifactorial Logistic Regression to Build a Predictive Model
In the training sets, four variables selected by LASSO regression were used as independent variables, and the occurrence of LEAD was taken as the dependent variable to build a multivariate logistic regression model and draw a nomogram. In the nomogram, score the corresponding value of PP, Age, TyG and UHR, and add up all the scores to get a total score. Draw a vertical line down from the total score, and the corresponding probability value is the probability of LEAD occurrence in T2DM patients (Figure 2). The results suggested that age, PP, UHR and TyG were predictive factors for the occurrence of LEAD in T2DM patients (P<0.05) (Table 2).
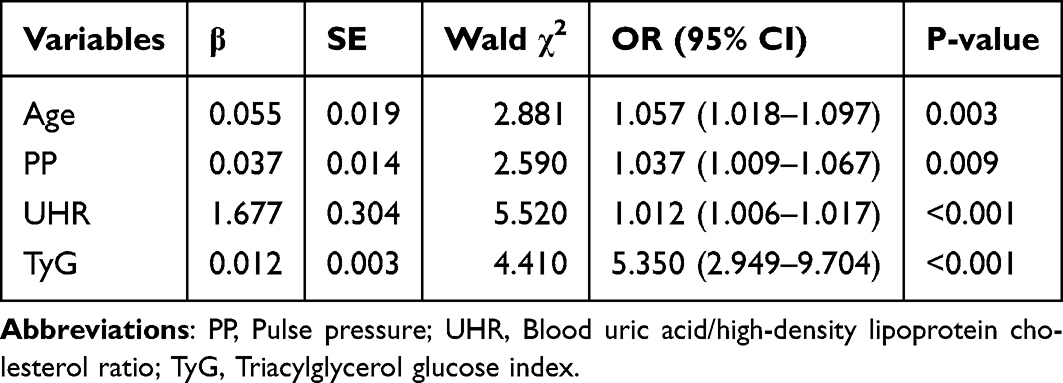 |
Table 2 Parameters of Each Variable in the Logistic Regression Model |
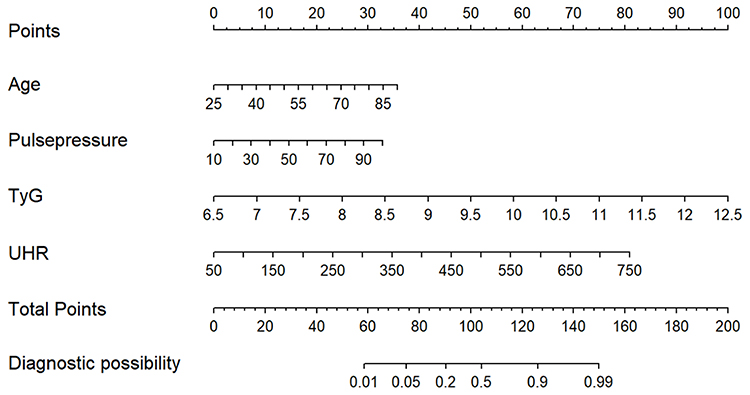 |
Figure 2 The nomogram of the LEAD prediction model. Score the corresponding value of PP, Age, TyG and UHR, and add up all the scores to get a total score. Draw a vertical line down from the total score, and the corresponding probability value is the probability of LEAD occurrence in T2DM patients. |
Examination of Predictive Efficacy of Prediction Model for LEAD in T2DM Patients
ROC Curve
The discrimination of the model was evaluated by the ROC curve, with an AUC of 0.872 (0.824–0.921) for the training sets and an AUC of 0.838 (0.751–0.925) for the validation sets, the Delong test suggested that the AUC of the training set and validation set had good consistency (P=0.496) (Figure 3). The nomogram model had the best predictive value compared to individual indicators, with a specificity of 0.947 and a sensitivity of 0.650, and a Youden index of 0.597. Among the individual variables included, TyG (AUC=0.751) and UHR (AUC=0.709) had better predictive value than age and PP. The specificity and sensitivity of TyG were 0.760 and 0.629, respectively, while those of UHR were 0.647 and 0.807, respectively. The Youden index for TyG was 0.389, and for UHR, it was 0.354. The cut-off values of TyG and UHR were 9.836 and 216.848, respectively (Table 3). The Delong test indicated that there was no significant difference in the AUC between TyG and UHR (P=0.417).
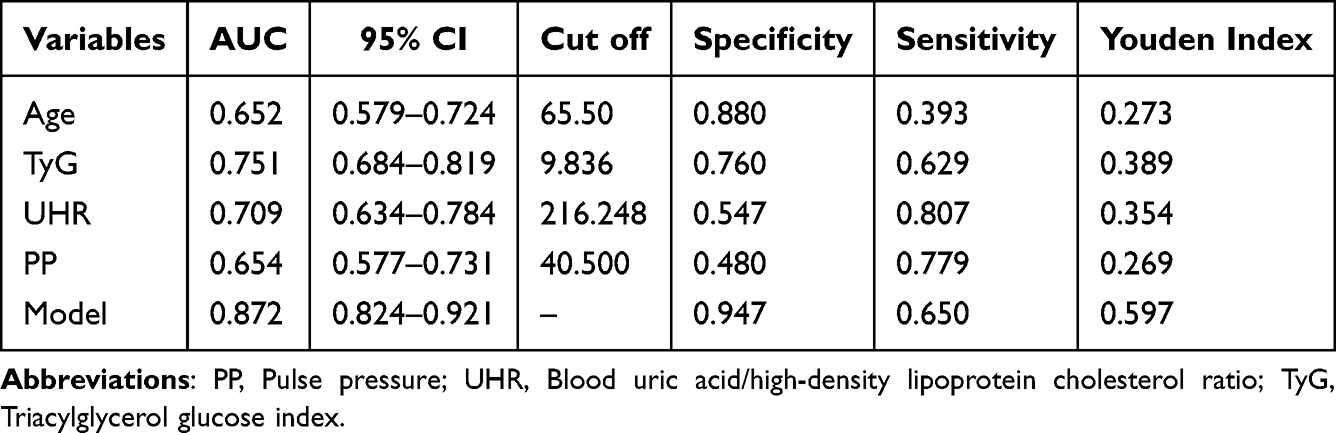 |
Table 3 Prediction Efficiency of the Model and Each Indicator for LEAD |
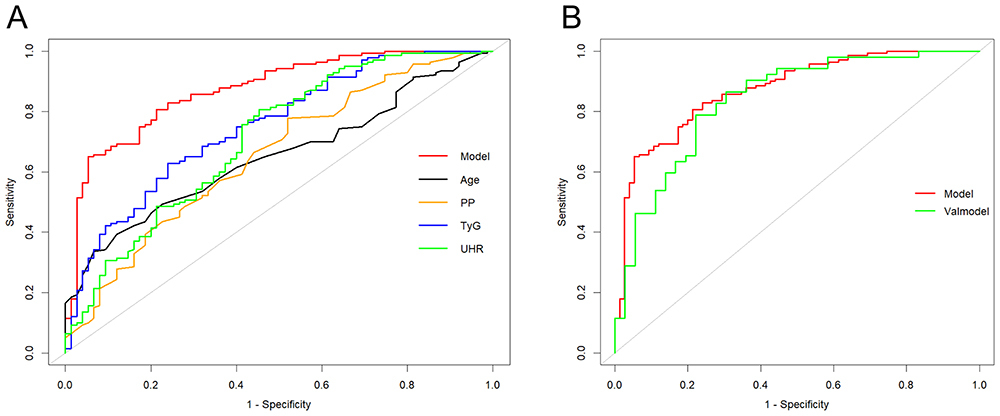 |
Figure 3 ROC curve verifies the discrimination of LEAD prediction model. (A) The ROC curve of the model and each index in the training sets. (B) The comparison of ROC curves between the training sets (model) and the validation sets. |
Calibration Curve
The prediction curves and actual fitting curves in the training set and validation set had a consistent trend with strong consistency, indicating that the model had good consistency between the predicted probability of LEAD occurrence in T2DM patients and the actual occurrence probability (Figure 4).
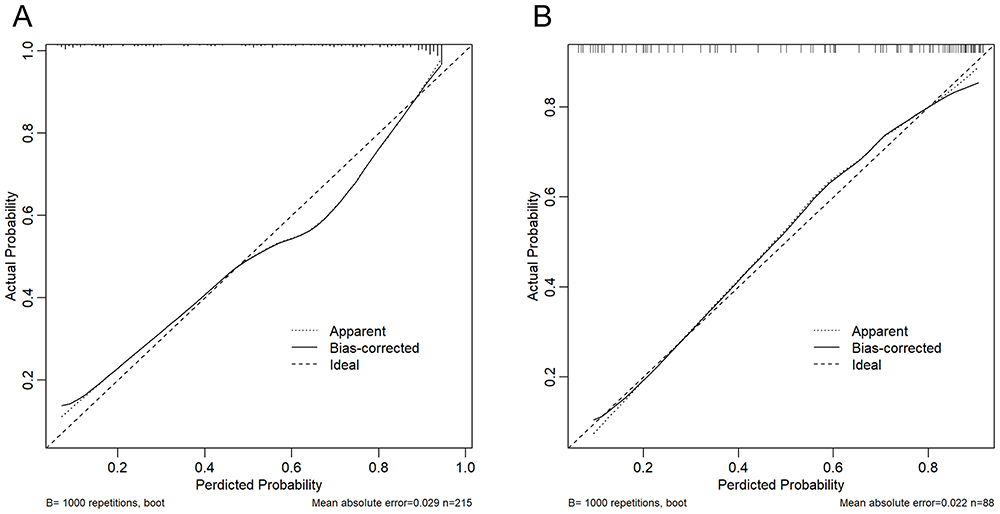 |
Figure 4 Calibration curve to verify the calibration accuracy of the LEAD model. (A) Calibration curve of the training sets. (B) Calibration curve of the validation sets. |
Decision Curve
The clinical benefit of the model was evaluated through DCA. The net benefit rate obtained by using the prediction model in both the training sets and the validation sets were higher than that of all patients without intervention or all patients with intervention (Figure 5).
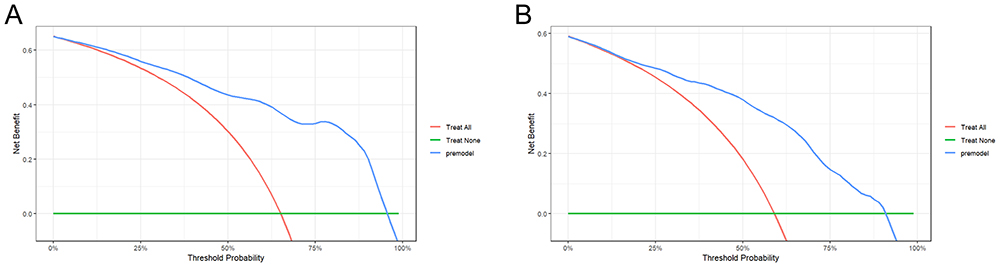 |
Figure 5 Decision Curve to verify the clinical net benefit of LEAD model. (A) The DCA curve of the training sets. (B) The DCA curve of the validation sets. |
Discussion
In this study, we assessed the correlation between TyG, UHR and LEAD, constructed a nomogram model, and evaluated the model’s predictive efficacy, accuracy, and clinical benefit. Regarding predictive efficacy, the model exhibits the highest predictive value. Among the individual indicators within the model, both TyG and UHR demonstrate good predictive value and are suitable for screening LEAD in T2DM patients, particularly in resource-limited primary hospitals.
LEAD is one of the most important causes of disability and death in patients with diabetes and a major public health problem with a heavy burden on society.15 What’s worse, 80% of the world’s diabetes patients live in low-income and middle-income countries, where many diagnostic tools are not easily accessible.4 In China, the rate of missed diagnosis is as high as 55.7%.3 LEAD can increase the risk of cardiovascular disease and mortality,16 but it has not received enough attention in clinical practice. A study conducted in the United States suggests that even 51% of clinicians ignore the screening of peripheral vascular diseases.17 Subsequently, the current status of LEAD treatments remains concerning. A study evaluating the drug treatment rate of peripheral vascular disease in high-risk patients in China suggests that among hospitalized patients over 50 years old with two or more cardiovascular event risk factors, the treatment rate of coronary artery disease (CAD) is 55.9%, while the treatment rate of patients with peripheral vascular disease is only 21.6%, which is far lower than that of patients with CAD.18 Therefore, the discovery of a straightforward screening tool is imperative for enhancing the current state of LEAD. Currently diabetes with LEAD lacks serological indicators. In this study, we explored and established a concise nomogram model for predicting the risk of LEAD in patients with T2DM. We find that the model exhibits high accuracy and predictive ability. In clinical practice, clinicians can add the corresponding scores of various risk factors (Age, PP, TyG, and UHR) on the nomogram, and based on the total score, determine the risk of LEAD in patients with T2DM. This aids in the clinical assessment of the patient’s condition, facilitates early identification of high-risk patients for LEAD in T2DM by doctors, and helps in formulating diagnostic and treatment measures. Furthermore, the significance of our study lies in the inclusion of serological indicators that are clinically more accessible and have predictive value, thus reducing the inconvenience for patients of waiting for ultrasound examinations. Secondly, vascular ultrasound examinations require a certain level of skill from the ultrasound technicians, which may not be widespread at the primary care level. If we can screen patients who need further ultrasound examinations through our model, this could potentially alleviate the burden on both patients and clinical doctors. We have conducted internal validation to confirm the predictive value of the model, which can be used as a screening tool for LEAD in T2DM patients and provide clues for further assessment of LEAD. Our study suggests that LEAD patients are older, have a larger PP differences, and have higher TyG and UHR than those in non-LEAD patients. Age and PP differences are independently identified as significant risk factors for cardiovascular events, and firmly established as contributors to the development of atherosclerosis-related diseases.19–21 Our study is consistent with this, and the cut-off values for predicting LEAD for age and PP are 65.5 years and 40.5 mmHg respectively.
Previous studies suggest22,23 that some serum markers such as advanced glycation end products and transcriptomics are associated with LEAD in T2DM, but these markers are not widely available and are not easily accessible. In recent years, various composite indicators have been used to assess diabetic foot and lower limb vascular lesions, such as the evaluation value of red fine sedimentation rate / albumin and C reactive protein / albumin ratio in diabetic foot infection, and the good predictive value of atherogenic index of plasma (AIP) for associated osteomyelitis in patients with diabetic foot.24,25 The TyG included in this study which can be performed by calculating the levels of routine fasting triglyceride and fasting blood glucose in serum biochemistry, is currently considered a simple and reliable tool for assessing insulin resistance. The increase of FBG can promote oxidative stress response, and induce the formation of free radicals, reactive oxygen species, and advanced glycation end products through various biochemical pathways, leading to the occurrence and development of vascular inflammation, insulin resistance, impaired insulin secretion, and endothelial dysfunction, which in turn increases the risk of atherosclerosis.26–28 It is worth noting that HbA1c, an indicator reflecting blood glucose, was not finally included in the model, which may be related to the long duration and large fluctuations of blood glucose in LEAD group patients. The increase of TG and the decrease of HDL-C level are related to the development of T2DM. These lipid abnormalities in atherosclerosis often occur years before T2DM, indicating that changes in lipoprotein metabolism are early events in the development of beta cell dysfunction.29 This study observed the differences in FBG and TG between the LEAD group and the non-LEAD group during univariate analysis, which is consistent with previous studies. However, the predictive factors we finally included are the composite index TyG calculated from fasting blood glucose and triglyceride, indicating that the composite index has more predictive value. Its possible mechanism is that TyG is superior to homeostasis model of assessment for insulin resistence index (HOMA-IR) in evaluating insulin resistance (IR).30 IR is a significant feature of T2DM, which can lead to disorders in glucose metabolism. This, in turn, causes lipotoxicity and subsequently results in endothelial cell dysfunction.31 Endothelial dysfunction encompasses reduced bioavailability of nitric oxide, increased oxidative stress, heightened expression of pro-inflammatory and pro-thrombotic factors, and abnormal vascular reactivity. Collectively, these factors contribute to the progression of atherosclerosis.32 Moreover, various mechanisms, including the release of inflammatory factors, inactivation of nitric oxide, activation of the sympathetic nervous system and the renin-angiotensin-aldosterone system, as well as platelet activation, can all lead to vascular dysfunction. Ultimately, this dysfunction results in a series of cardiovascular diseases.33 Experimental studies are imperative to validate these mechanisms. In recent years, the predictive value of the TyG index in cardiovascular and cerebrovascular diseases has been confirmed.34–38 Wang et al demonstrated the potential of TyG to predict the severity of coronary heart disease, which is more prominent in patients with pre-diabetes.39 Che et al found that an elevated TyG index is a predictor of CVD occurrence in European populations.37 In addition, a high TyG index is associated with increased cardiovascular mortality in high-risk CVD populations, suggesting the significance of the TyG index in the primary prevention of CVD.36 TyG is closely related to stroke and can be used as an independent predictor of stroke onset and progression in hospitalized patients.34,35 This study confirmed that TyG has good predictive value for LEAD in patients with T2DM, with an AUC of 0.751 and a cut-off value of 9.836, which is similar to previous studies.40,41 However, A study suggested that TyG combined with obesity-related indicators had a higher predictive value for LEAD, with the AUC of TyG being only 0.583. In our study, the AUC for TyG was 0.751, which is higher than the value reported in that study. This is related to the differences in the selected sample characteristics.42 In addition, a study conducted in China suggests that the increase in TyG × BMI level is related to in stroke incidence.43 Since LEAD shares certain commonalities in pathological mechanisms with arterial thrombotic diseases such as CAD and cerebrovascular diseases, we also analyzed the correlation between TyG × BMI and LEAD. The results showed that TyG is related to LEAD, but no correlation between TyG × BMI and LEAD was observed. This may be related to the long duration of diabetes in LEAD patients included in our study. As the progression of diabetes occurs, the decline in the patient’s pancreatic function leads to weight loss. Therefore, the decrease in BMI offset the effects of changes in TyG.
SUA is a product of purine metabolism in the human body. High levels of SUA promote oxidative stress and exacerbate inflammatory reactions, is associated with diabetic kidney disease (DKD) and carotid atherosclerosis.44,45 HDL-C molecules can prevent monocyte migration and further eliminate oxidized cholesterol in endothelial cells, thereby exerting anti-inflammatory and antioxidant effects.46 A recent study has shown that under conditions of chronic inflammation and oxidative stress (such as diabetes), the reverse cholesterol uptake mediated by HDL-C will be significantly impaired.47 Therefore, HDL-C is considered a protective factor for vascular complications. Combining the above effects of SUA and HDL-C, the ratio of the two, UHR, may increase the burden of inflammation and further predict LEAD by reflecting insulin sensitivity. However, its underlying mechanisms require more basic research to confirm. Studies have shown that in patients with T2DM, UHR is related to blood glucose control level, metabolic syndrome, DKD, and diabetic peripheral neuropathy.48–51 There are few studies on UHR in LEAD, so we analyzed the correlation between UHR and LEAD and found that it was positively correlated with LEAD. Further studies suggested that UHR had a good predictive value for LEAD in patients with T2DM, which also reflected the role of chronic inflammation in LEAD.
Nevertheless, it is crucial to acknowledge the limitations of our current study, which is a single-center retrospective analysis with a limited sample size. And given the limitations of the sample size in this study, no corresponding subgroup analysis was performed. Consequently, drawing definitive conclusions regarding causality remains challenging. This study lacks external validation. Large-scale prospective cohort studies are warranted to validate the predictive value of this model for LEAD in T2DM patients.
Conclusion
In this study, we explored and established a concise nomogram model for predicting the risk of LEAD in T2DM patients. In clinical practice, clinicians can screen high-risk populations for LEAD among T2DM patients using this nomogram model, leading to further assessment and intervention measures, thereby improving the prognosis of these patients. Among the individual indicators within the model, both TyG and UHR demonstrate good predictive value, and are suitable for screening LEAD in T2DM patients, particularly in resource-limited primary hospitals.
Ethics Approval and Consent to Participate
Ethical approval was provided by the Medical Ethics Committee of Bengbu Medical University (Ethical approval number [2023]269). All patients signed informed consent for the clinical study before being included in this research.
Funding
This study was supported by the Natural Science Projects of Bengbu Medical College (Grant No. 2022byzd088), the Anhui Province scientific research planning project (Grant No. 2024AH051285) and the Scientific Research Program of Anhui Provincial Health Commission (Grant No. AHWJ2023BAc10028).
Disclosure
The authors declare that there are no personal, financial, commercial, or academic conflicts of interest for this work.
References
1. Creager MA, Belkin M, Belkin M, et al. Writing Committee to Develop Clinical Data Standards for Peripheral Atherosclerotic Vascular Disease. 2012 ACCF/AHA/ACR/SCAI/SIR/STS/SVM/SVN/SVS key data elements and definitions for peripheral atherosclerotic vascular disease: a report of the American College of Cardiology Foundation/American Heart Association Task Force on Clinical Data Standards (Writing Committee to Develop Clinical Data Standards for Peripheral Atherosclerotic Vascular Disease). Circulation. 2012;125(2):395–467. doi:10.1161/CIR.0b013e31823299a1
2. Fowkes FG, Rudan D, Rudan I, et al. Comparison of global estimates of prevalence and risk factors for peripheral artery disease in 2000 and 2010: a systematic review and analysis. Lancet. 2013;382(9901):1329–1340. doi:10.1016/S0140-6736(13)61249-0
3. Zhang X, Ran X, Xu Z, et al. Epidemiological characteristics of lower extremity arterial disease in Chinese diabetes patients at high risk: a prospective, multicenter, cross-sectional study. J Diabetes Complications. 2018;32(2):150–156. doi:10.1016/j.jdiacomp.2017.10.003
4. Monteiro-Soares M, Russell D, Boyko EJ, et al. Guidelines on the classification of diabetic foot ulcers (IWGDF 2019). Diabetes Metab Res Rev. 2020;36(Suppl 1):e3273. doi:10.1002/dmrr.3273
5. Huang Y, Li Z, Yin X. Long-term survival in stroke patients: insights into triglyceride-glucose body mass index from ICU data. Cardiovasc Diabetol. 2024;23(1):137. doi:10.1186/s12933-024-02231-0
6. Liang D, Liu C, Wang Y. The association between triglyceride-glucose index and the likelihood of cardiovascular disease in the U.S. population of older adults aged >/= 60 years: a population-based study. Cardiovasc Diabetol. 2024;23(1):151. doi:10.1186/s12933-024-02248-5
7. Wei X, Min Y, Song G, Ye X, Liu L. Association between triglyceride-glucose related indices with the all-cause and cause-specific mortality among the population with metabolic syndrome. Cardiovasc Diabetol. 2024;23(1):134. doi:10.1186/s12933-024-02215-0
8. Zhu W, Liang A, Shi P, et al. Higher serum uric acid to HDL-cholesterol ratio is associated with onset of non-alcoholic fatty liver disease in a non-obese Chinese population with normal blood lipid levels. BMC Gastroenterol. 2022;22(1):196. doi:10.1186/s12876-022-02263-4
9. Park B, Jung DH, Lee YJ. Predictive value of serum uric acid to HDL cholesterol ratio for incident ischemic heart disease in non-diabetic Koreans. Biomedicines. 2022;10(6):1422. doi:10.3390/biomedicines10061422
10. Chinese Diabetes Society. Chinese guidelines for prevention and treatment of type 2 diabetes mellitus (2020 edition). Chin J Diabetes. 2021;13(4):315–409.
11. Chinese Medical Doctor Association Ultrasound Physicians Branch. Guidelines for Vascular Ultrasound Examination. Chin J Ultrasound Med. 2009;18(10):911–920.
12. Chinese Diabetes Society CMAIDB, Chinese Medical Association Tissue Repair and Regeneration Branch. Chinese guidelines for prevention and treatment of diabetic foot. Chin J Diabetes. 2019;11(4):238–247.
13. Mullah MAS, Hanley JA, Benedetti A. LASSO type penalized spline regression for binary data. BMC Med Res Methodol. 2021;21(1):83. doi:10.1186/s12874-021-01234-9
14. Ogutu JO, Schulz-Streeck T, Piepho HP. Genomic selection using regularized linear regression models: ridge regression, lasso, elastic net and their extensions. BMC Proc. 2012;6(Suppl 2):S10. doi:10.1186/1753-6561-6-S2-S10
15. Schaper NC, van Netten JJ, Apelqvist J, et al. Practical Guidelines on the prevention and management of diabetic foot disease (IWGDF 2019 update). Diabetes Metab Res Rev. 2020;36(Suppl 1):e3266. doi:10.1002/dmrr.3266
16. Welten GM, Schouten O, Hoeks SE, et al. Long-term prognosis of patients with peripheral arterial disease: a comparison in patients with coronary artery disease. J Am Coll Cardiol. 2008;51(16):1588–1596. doi:10.1016/j.jacc.2007.11.077
17. Hirsch AT, Criqui MH, Treat-Jacobson D, et al. Peripheral arterial disease detection, awareness, and treatment in primary care. JAMA. 2001;286(11):1317–1324. doi:10.1001/jama.286.11.1317
18. Del Brutto OH, Mera RM, Sedler MJ, et al. The relationship between high pulse pressure and low Ankle-Brachial Index. Potential utility in screening for peripheral artery disease in population-based studies. High Blood Press Cardiovasc Prev. 2015;22(3):275–280. doi:10.1007/s40292-015-0103-6
19. Fujita H, Matsuoka S, Awazu M. White-coat and reverse white-coat effects correlate with 24-h pulse pressure and systolic blood pressure variability in children and young adults. Pediatr Cardiol. 2016;37(2):345–352. doi:10.1007/s00246-015-1283-5
20. Qin T, Jiang H, Jiao Y, et al. Ambulatory arterial stiffness index correlates with ambulatory pulse pressure but not dipping status in patients with grade 1/grade 2 essential hypertension. J Int Med Res. 2014;42(6):1323–1334. doi:10.1177/0300060514548288
21. Hasimu B, Li J, Yu J, et al. Evaluation of medical treatment for peripheral arterial disease in Chinese high-risk patients. Circ J. 2007;71(1):95–99. doi:10.1253/circj.71.95
22. Zeng G, Jin YZ, Huang Y, et al. Transcriptomic analysis of type 2 diabetes mellitus combined with lower extremity atherosclerotic occlusive disease. Diabetes Metab Syndr Obes. 2024;17:997–1011. doi:10.2147/DMSO.S432698
23. Ying L, Shen Y, Zhang Y, et al. Association of advanced glycation end products with lower-extremity atherosclerotic disease in type 2 diabetes mellitus. Front Cardiovasc Med. 2021;8:696156. doi:10.3389/fcvm.2021.696156
24. Coye TL, Suludere MA, Kang GE, et al. The infected diabetes-related foot: comparison of erythrocyte sedementation rate/albumin and C-reactive protein/albumin ratios with erythrocyte sedimentation rate and C-reactive protein to differentiate bone and soft tissue infections. Wound Repair Regen. 2023;31(6):738–744. doi:10.1111/wrr.13121
25. Flores-Escobar S, Lopez-Moral M, Garcia-Madrid M, Alvaro-Afonso FJ, Tardaguila-Garcia A, Lazaro-Martinez JL. Diagnostic performance of atherogenic index of plasma for predicting diabetic foot osteomyelitis with peripheral artery disease. J Clin Med. 2024;13(7):1934. doi:10.3390/jcm13071934
26. Papachristoforou E, Lambadiari V, Maratou E, Makrilakis K. Association of glycemic indices (Hyperglycemia, Glucose Variability, and Hypoglycemia) with oxidative stress and diabetic complications. J Diabetes Res. 2020;2020:7489795. doi:10.1155/2020/7489795
27. Hansson GK, Hermansson A. The immune system in atherosclerosis. Nat Immunol. 2011;12(3):204–212. doi:10.1038/ni.2001
28. Son SM, Whalin MK, Harrison DG, Taylor WR, Griendling KK. Oxidative stress and diabetic vascular complications. Curr Diab Rep. 2004;4(4):247–252. doi:10.1007/s11892-004-0075-8
29. Simental-Mendia LE, Rodriguez-Moran M, Guerrero-Romero F. The product of fasting glucose and triglycerides as surrogate for identifying insulin resistance in apparently healthy subjects. Metab Syndr Relat Disord. 2008;6(4):299–304. doi:10.1089/met.2008.0034
30. Simental-Mendia LE, Gamboa-Gomez CI, Aradillas-Garcia C, Rodriguez-Moran M, Guerrero-Romero F. The triglyceride and glucose index is a useful biomarker to recognize glucose disorders in apparently healthy children and adolescents. Eur J Pediatr. 2020;179(6):953–958. doi:10.1007/s00431-020-03570-2
31. Nogueira MDA, Braga RAM, Manios Y, et al. New indices in predicting cardiometabolic risk and its relation to endothelial dysfunction in adolescents: the HELENA study. Nutr Metab Cardiovasc Dis. 2023;33(5):1037–1048. doi:10.1016/j.numecd.2023.01.015
32. Wang X, Shen Y, Shang M, Liu X, Munn LL. Endothelial mechanobiology in atherosclerosis. Cardiovasc Res. 2023;119(8):1656–1675. doi:10.1093/cvr/cvad076
33. Dang K, Wang X, Hu J, et al. The association between triglyceride-glucose index and its combination with obesity indicators and cardiovascular disease: NHANES 2003–2018. Cardiovasc Diabetol. 2024;23(1):8. doi:10.1186/s12933-023-02115-9
34. Yang Y, Huang X, Wang Y, et al. The impact of triglyceride-glucose index on ischemic stroke: a systematic review and meta-analysis. Cardiovasc Diabetol. 2023;22(1):2. doi:10.1186/s12933-022-01732-0
35. Huang Q, Yin L, Liu Z, et al. Association of novel lipid indicators with the risk of stroke among participants in Central China: a population-based prospective study. Front Endocrinol. 2023;14:1266552. doi:10.3389/fendo.2023.1266552
36. Cai XL, Xiang YF, Chen XF, et al. Prognostic value of triglyceride glucose index in population at high cardiovascular disease risk. Cardiovasc Diabetol. 2023;22(1):198. doi:10.1186/s12933-023-01924-2
37. Che B, Zhong C, Zhang R, et al. Triglyceride-glucose index and triglyceride to high-density lipoprotein cholesterol ratio as potential cardiovascular disease risk factors: an analysis of UK biobank data. Cardiovasc Diabetol. 2023;22(1):34. doi:10.1186/s12933-023-01762-2
38. Wang X, Xu W, Song Q, et al. Association between the triglyceride-glucose index and severity of coronary artery disease. Cardiovasc Diabetol. 2022;21(1):168. doi:10.1186/s12933-022-01606-5
39. Lee JW, Lim NK, Park HY. The product of fasting plasma glucose and triglycerides improves risk prediction of type 2 diabetes in middle-aged Koreans. BMC Endocr Disord. 2018;18(1):33. doi:10.1186/s12902-018-0259-x
40. Ning P, Zeng J, Feng Q, Chen M, Cao H. Triglyceride-glucose index as a predictor of lower extremity arterial disease in patients with diabetes: a hospitalized population retrospective study. Ann Vasc Surg. 2024;98:173–181. doi:10.1016/j.avsg.2023.08.013
41. Pala AA, Urcun YS. Relationship of triglyceride-glucose index with chronic limb-threatening ischemia in lower extremity peripheral artery disease. Vascular. 2022;30(3):455–462. doi:10.1177/17085381211018332
42. Miao Y, Wang Y, Wang Y, Yan P, Chen Z, Wan Q. The association between triglyceride-glucose index and its combination with obesity indicators and lower extremity peripheral artery disease in patients with type 2 diabetes mellitus: a cross-sectional study. Diabetes Metab Syndr Obes. 2024;17:2607–2617. doi:10.2147/DMSO.S469692
43. Shao Y, Hu H, Li Q, Cao C, Liu D, Han Y. Link between triglyceride-glucose-body mass index and future stroke risk in middle-aged and elderly Chinese: a nationwide prospective cohort study. Cardiovasc Diabetol. 2024;23(1):81. doi:10.1186/s12933-024-02165-7
44. Singh K, Kumar P, Joshi A, et al. Study of association of serum uric acid with albuminuria and carotid atherosclerosis in type 2 diabetes mellitus patients. J Family Med Prim Care. 2019;8(12):4027–4031. doi:10.4103/jfmpc.jfmpc_777_19
45. Ji P, Zhu J, Feng J, et al. Serum uric acid levels and diabetic kidney disease in patients with type 2 diabetes mellitus: a dose-response meta-analysis. Prim Care Diabetes. 2022;16(3):457–465. doi:10.1016/j.pcd.2022.03.003
46. Oltulu R, Katipoglu Z, Gundogan AO, Mirza E, Belviranli S. Evaluation of inflammatory biomarkers in patients with keratoconus. Eur J Ophthalmol. 2022;32(1):154–159. doi:10.1177/11206721211000644
47. Acikgoz N, Kurtoglu E, Yagmur J, Kapicioglu Y, Cansel M, Ermis N. Elevated monocyte to high-density lipoprotein cholesterol ratio and endothelial dysfunction in Behcet disease. Angiology. 2018;69(1):65–70. doi:10.1177/0003319717704748
48. Aktas G, Kocak MZ, Bilgin S, Atak BM, Duman TT, Kurtkulagi O. Uric acid to HDL cholesterol ratio is a strong predictor of diabetic control in men with type 2 diabetes mellitus. Aging Male. 2020;23(5):1098–1102. doi:10.1080/13685538.2019.1678126
49. Uzeli U, Dogan AG. The relationship between diabetic neuropathy and uric acid/high-density lipoprotein ratio in patients with type-2 diabetes mellitus. Cureus. 2023;15(9):e45151. doi:10.7759/cureus.45151
50. Cheng Y, Zhang H, Zheng H, et al. Association between serum uric acid/HDL-cholesterol ratio and chronic kidney disease: a cross-sectional study based on a health check-up population. BMJ Open. 2022;12(12):e066243. doi:10.1136/bmjopen-2022-066243
51. Yazdi F, Baghaei MH, Baniasad A, Naghibzadeh-Tahami A, Najafipour H, Gozashti MH. Investigating the relationship between serum uric acid to high-density lipoprotein ratio and metabolic syndrome. Endocrinol Diabetes Metab. 2022;5(1):e00311. doi:10.1002/edm2.311
 © 2025 The Author(s). This work is published and licensed by Dove Medical Press Limited. The
full terms of this license are available at https://www.dovepress.com/terms
and incorporate the Creative Commons Attribution
- Non Commercial (unported, 4.0) License.
By accessing the work you hereby accept the Terms. Non-commercial uses of the work are permitted
without any further permission from Dove Medical Press Limited, provided the work is properly
attributed. For permission for commercial use of this work, please see paragraphs 4.2 and 5 of our Terms.
© 2025 The Author(s). This work is published and licensed by Dove Medical Press Limited. The
full terms of this license are available at https://www.dovepress.com/terms
and incorporate the Creative Commons Attribution
- Non Commercial (unported, 4.0) License.
By accessing the work you hereby accept the Terms. Non-commercial uses of the work are permitted
without any further permission from Dove Medical Press Limited, provided the work is properly
attributed. For permission for commercial use of this work, please see paragraphs 4.2 and 5 of our Terms.