Back to Journals » Clinical Ophthalmology » Volume 18
Comparative Evaluation of Fundus Image Interpretation Accuracy in Glaucoma Screening Among Different Physician Groups
Authors Wada-Koike C, Terauchi R ![]() , Fukai K, Sano K, Nishijima E, Komatsu K, Ito K, Kato T
, Fukai K, Sano K, Nishijima E, Komatsu K, Ito K, Kato T ![]() , Tatemichi M, Kabata Y
, Tatemichi M, Kabata Y ![]() , Nakano T
, Nakano T ![]()
Received 6 December 2023
Accepted for publication 19 February 2024
Published 27 February 2024 Volume 2024:18 Pages 583—589
DOI https://doi.org/10.2147/OPTH.S453663
Checked for plagiarism Yes
Review by Single anonymous peer review
Peer reviewer comments 4
Editor who approved publication: Dr Scott Fraser
Chiharu Wada-Koike,1,* Ryo Terauchi,1,* Kota Fukai,2 Kei Sano,1 Euido Nishijima,1 Koji Komatsu,1 Kyoko Ito,3 Tomohiro Kato,3 Masayuki Tatemichi,2 Yoshiaki Kabata,4,* Tadashi Nakano1
1Department of Ophthalmology, The Jikei University School of Medicine, Tokyo, Japan; 2Department of Preventive Medicine, Tokai University School of Medicine, Isehara, Japan; 3Centre for Preventive Medicine, The Jikei University School of Medicine, Tokyo, Japan; 4Department of Ophthalmology, Jikei University School of Medicine, Daisan Hospital, Tokyo, Japan
*These authors contributed equally to this work
Correspondence: Yoshiaki Kabata, Department of Ophthalmology, Jikei University School of Medicine, Daisan Hospital, 4-11-1 Izumihontyou, Komae-si, Tokyo, 125-8506, Japan, Tel +81 3 3480 1151, Fax +81 3 3480 5700, Email [email protected]
Purpose: To examine the variability in glaucoma screening using fundus images among physicians, including non-ophthalmologists.
Patients and Methods: Sixty-nine eyes from 69 patients, including 25 eyes with glaucoma, were included from the Jikei University Hospital from July 2019 to December 2022. Fundus images were captured using TRC-NW8 (Topcon Corporation, Tokyo, Japan), and were interpreted by 10 non-ophthalmologists, 10 non-specialist ophthalmologists, and 9 specialists for diagnostic accuracy. We analyzed differences in diagnostic accuracy among the three groups. Sensitivity, specificity, positive predictive value (PPV), negative predictive value (NPV), and Kappa coefficient were compared, using the Kruskal–Wallis test followed by a post hoc Dunn’s test.
Results: The sensitivity and specificity were 0.22 and 0.92 for non-ophthalmologists, 0.49 and 0.83 for non-specialist ophthalmologists, and 0.68 and 0.87 for specialists, respectively. Both specialists and non-specialist ophthalmologists showed significantly higher sensitivity than non-ophthalmologists (Dunn’s test, P< 0.001 and P=0.031). There was no significant difference in specificity among the three groups (Kruskal–Wallis test, P=0.086). The PPV did not differ significantly between the groups (Kruskal–Wallis test, P=0.108), while the NPV was significantly higher in specialists compared to non-ophthalmologists (Dunn’s test, P< 0.001). Specialists also had a significantly higher Kappa coefficient than non-ophthalmologists and non-specialist ophthalmologists (Dunn’s test, P< 0.001 and P=0.024).
Conclusion: Diagnostic accuracy varied significantly based on the physician’s background.
Keywords: glaucoma, fundus images, sensitivity, specificity, health checkup
A Letter to the Editor has been published for this article.
A Response to Letter by Mr Sadeghi has been published for this article.
Introduction
Glaucoma is the second leading cause of blindness worldwide.1 The total number of global glaucoma cases is estimated to rise to 111.8 million in 2040.2 Glaucomatous visual field defects are often difficult to recognize in the early stages, and they are irreversible. Therefore, the early detection and treatment of glaucoma are crucial for effective management.
In a significant epidemiological study on glaucoma conducted in Japan in 2004, the Tajimi Study, the undiagnosed rate of glaucoma was approximately 90%.3 In a survey conducted in 2020, the undiagnosed rate of glaucoma remained high at 78%, indicating a persistent challenge in the early detection of the disease.4
Japan has a unique health checkup system that is conducted on a large scale across the country.5–7 These checkups aim not only for the early detection and treatment of various diseases but also for preventing the diseases themselves. Fundus photography is included as part of these health checkups.7 It has the potential to identify early-stage glaucoma effectively.4
However, identifying early-stage glaucomatous alterations using fundus photography is challenging. Optic disc changes and other retinal structural alterations associated with early-stage glaucoma are often subtle, leading to physician assessment variability. In addition, the presence of cataracts, corneal opacities, or high myopia can further complicate the interpreting fundus photographs. In Japan, it is considered preferable for the interpretation of fundus examinations conducted during health checkups to be carried out by ophthalmologists. However, the reality is that many of these assessments are often performed by physicians who have no experience in ophthalmic practice. Collectively, these factors contribute to potential variability in the diagnostic accuracy of fundus examinations. While concerns about the differences in interpretative accuracy between ophthalmologists and non-ophthalmologists have existed for years, no reports have conclusively verified this possibility.
This study verified whether the accuracy of glaucoma determination varies with the backgrounds of interpreting physicians including non-ophthalmologists. In countries like Japan, where non-ophthalmologists are involved in glaucoma screening, it is imperative to ascertain the level of accuracy with which these practitioners can evaluate fundus images. Previous reports have highlighted a variance in accuracy among ophthalmologists utilizing fundus photography for glaucoma assessment;8–10 yet these studies exclusively focused on ophthalmologists, leaving the evaluation of non-ophthalmologists who routinely interpret fundus images unexplored. We anticipate that the findings of this study will clearly delineate the obstacles inherent in glaucoma screening and spur further research aimed at refining the accuracy of glaucoma screening techniques.
Materials and Methods
This study was approved by the ethics committee of the Jikei University School of Medicine. The study design was in accordance with the tenets of the Declaration of Helsinki. Informed consent was obtained from all patients using an opt-out method.
We retrospectively included patients with glaucoma or other ophthalmic diseases who visited the Jikei University School of Medicine between July 2019 and December 2022. Among these patients, individuals who underwent fundus imaging were randomly selected, and their fundus images were reviewed. For the inclusion of glaucomatous eyes, we selected cases in which any of the following could be identified in the fundus photographs: glaucomatous optic disc cupping, retinal nerve fiber layer defect, optic disc hemorrhage, rim notching, and thinning. Cases in which fundus images were unclear owing to lens opacification or other causes that hindered glaucoma determination were excluded. Individuals with ophthalmic diseases other than glaucoma and those without abnormal findings in the fundus were also included in this study. Fundus images were captured using TRC-NW8 (Topcon Corporation, Tokyo, Japan) at an angle of coverage of 45°.
The criteria for diagnosing glaucoma were based on those proposed in a previous study.3 The evaluation included the presence of glaucomatous optic neuropathy and visual field defects consistent with optic nerve changes. Glaucomatous optic neuropathy was diagnosed when (1) the vertical cup-to-disc ratio of the optic nerve head was 0.7 or more, (2) the rim-to-disc ratio at the superior portion (11- to 1-o’clock positions) or the inferior portion (5- to 7-o’clock positions) was 0.1 or less, (3) the difference in the vertical cup-to-disc ratio was 0.2 or more between both eyes, or (4) retinal nerve fiber layer defects were found. Visual field sensitivity was assessed using the Humphrey Visual Field Analyzer (Carl Zeiss Meditec) 30–2 Swedish interactive threshold algorithm standard program. According to the Anderson-Patella criteria, a glaucomatous visual field defect was diagnosed when (1) the glaucoma hemifield test results were outside normal limits; (2) pattern deviation probability plots in the upper or lower hemifield showed a cluster of three or more non-edge contiguous points with a sensitivity of less than 5%, of which at least one point had a probability of less than 1%; or (3) a pattern standard deviation outside the 95% normal confidence limits was noted.
Twenty-nine physicians participated in the image interpretation. The first group consisted of physicians from the Centre for Preventive Medicine of the Jikei University School of Medicine, none of whom were ophthalmologists. Invitations were extended to all eligible physicians within the centre, leading to the participation of ten physicians. They routinely perform glaucoma assessments based on the results of fundus examinations at facilities conducting health checkups. The second group included 10 non-specialist ophthalmologists from the Department of Ophthalmology of the Jikei University School of Medicine, who practiced ophthalmology but had not yet obtained a specialized certification from the Japanese Ophthalmological Society. From among 24 physicians, ten were randomly selected. After explaining this study, all ophthalmologists consented to participate. Lastly, the third group comprised nine certified ophthalmology specialists who had obtained the specialized certification, a process requiring a minimum of five years of clinical experience in ophthalmology. Out of 15 specialist ophthalmologists, ten were randomly selected, and nine who agreed to participate were included in the study. In Japan, obtaining a specialist certification in ophthalmology requires five years of clinical experience, and nearly all ophthalmologists who meet this requirement obtain the certification. Consequently, there is an inevitable difference in years of clinical experience between the groups of non-specialist and specialist ophthalmologists.
Each physician performed an image interpretation task using the same laptop model, Extensa15 EX215-52-A78U (Acer Japan Corporation, Tokyo, Japan). During the evaluation process, only fundus photographs were provided to the physicians without any additional clinical information such as age, sex, or ophthalmic history. They were required to perform interpretation tasks in a manner consistent with their regular clinical practice with the stipulation that consulting textbooks, guidelines, or other reference materials was prohibited. Diagnoses were based on 26 abnormal findings defined in the Ophthalmic Examination Grading Manual of the Japanese Society of Ningen Dock. Glaucoma was defined by the presence of glaucomatous optic disc cupping, retinal nerve fiber layer defects, optic disc hemorrhage, or glaucomatous changes in the optic nerve.
Continuous variables are presented as mean ± standard deviation to describe the background characteristics. We analyzed whether there were differences in diagnostic accuracy among three groups: non-ophthalmologists, non-specialist ophthalmologists, and specialists. Based on the diagnostic results, we calculated the sensitivity, specificity, positive predictive value (PPV), negative predictive value (NPV), and Kappa coefficient for each group. The Kappa statistic is scaled such that a value of 0 indicates agreement equivalent to chance, whereas a value of 1 indicates perfect agreement. The interpretation of Kappa values followed Landis and Koch’s classifications, which are 0.0–0.20 as slight, 0.21–0.40 as fair, 0.41–0.60 as moderate, 0.61–0.80 as substantial, and 0.81–1.00 as almost perfect.11 These metrics were compared among the three groups. Initially, a Kruskal–Wallis test was conducted to determine if significant differences existed among the groups. If significant differences were identified using the Kruskal–Wallis test, a post hoc Dunn’s test was performed to identify which groups differed. Sensitivity and specificity were visualized using boxplots with the measured values of individual physicians overlaid to assess the variability in performance among individual physicians. Alpha was set at 0.05, and all p-values were two-sided. All statistical analyses were performed using R software (version 4.2.1; http://r-project.org).
Results
The characteristics of the physicians interpreted fundus images by groups (non-ophthalmologists, non-specialist ophthalmologists, and specialists) are shown in Table 1. The years of their experience with medical practice were 27.4 ± 11.1, 4.2 ± 1.3, and 13.9 ± 5.4 years, respectively, while the years of their experience with fundus interpretation were 11.0 ± 6.5, 2.2 ± 1.3, and 11.7 ± 5.6 years, respectively.
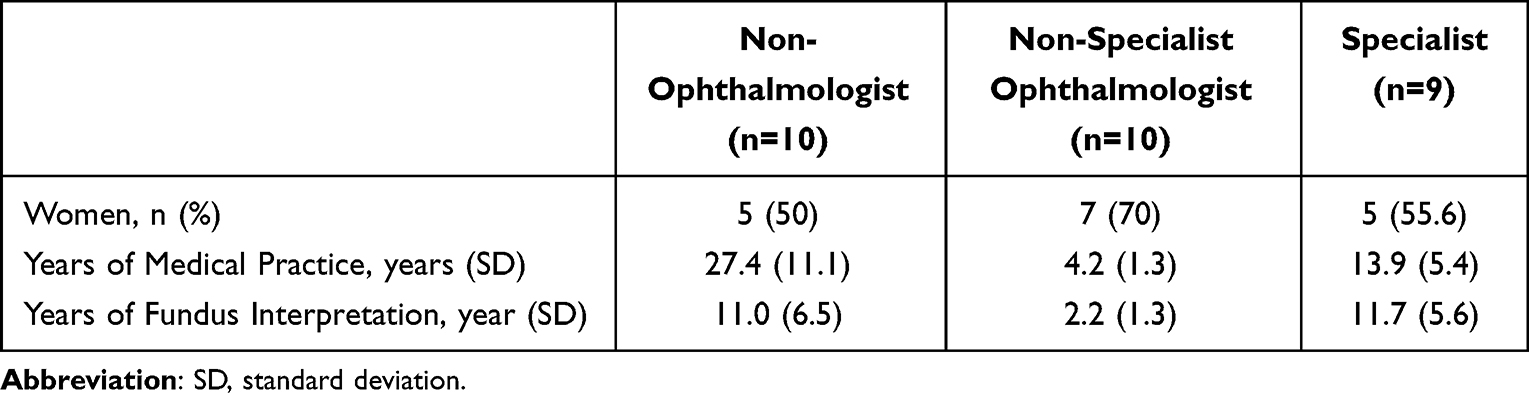 |
Table 1 Characteristics of Physicians Who Interpreted Fundus Images (N=29) |
The characteristics of the 69 eyes of 69 patients that were selected for fundus image interpretation are shown in Table 2. Among these, 25 eyes were identified as glaucomatous (60.9 ± 7.5 years), while 44 were non-glaucomatous (59.5 ± 14.9 years). In 25 eyes with glaucoma, the average mean deviation value was recorded at −3.1 ± 4.2 dB.
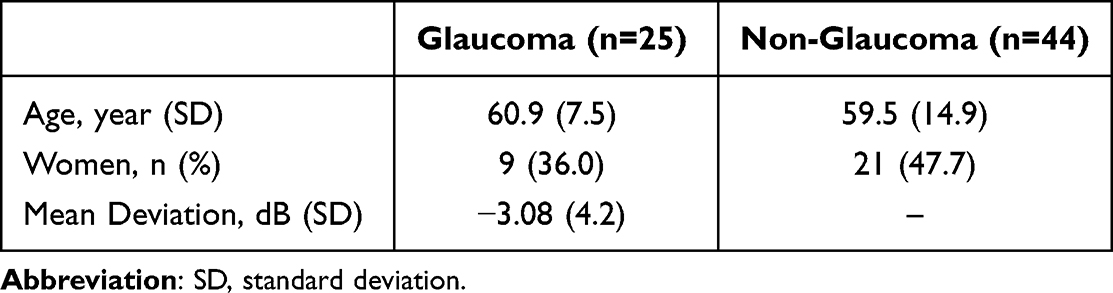 |
Table 2 Characteristics of Patients Selected for Fundus Image Interpretation (N=69) |
The diagnostic accuracy metrics among the three groups are shown in Table 3 and Figure 1. The sensitivity was 0.22 ± 0.14 for non-ophthalmologists, 0.49 ± 0.24 for non-specialist ophthalmologists, and 0.68 ± 0.14 for specialists. In the comparative analysis among the three groups, both specialist and non-specialist ophthalmologists demonstrated significantly higher sensitivity compared to non-ophthalmologists, as indicated by Dunn’s test (P<0.001 for specialists and P=0.031 for non-specialist ophthalmologists).
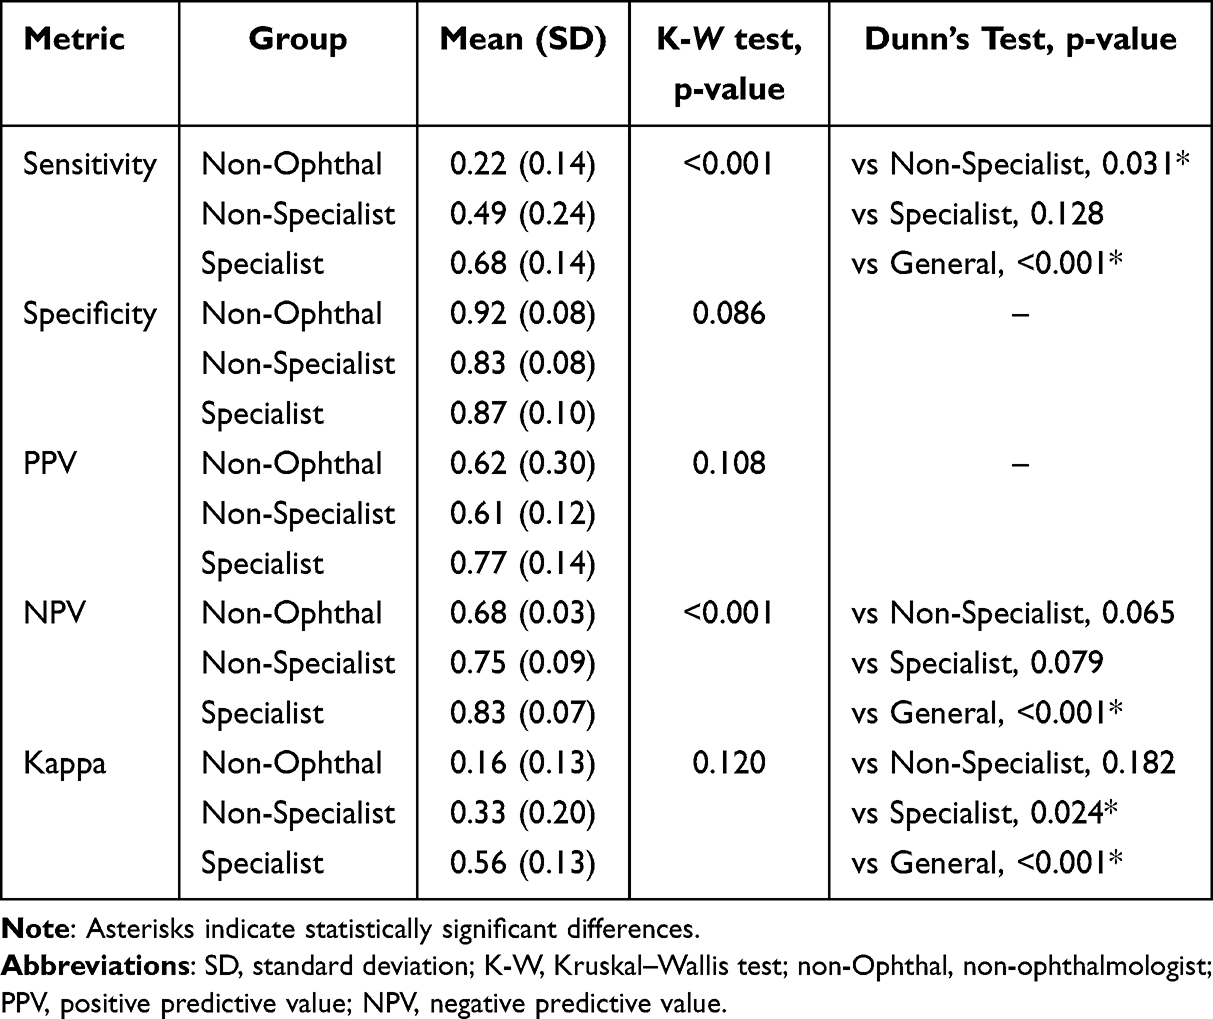 |
Table 3 Comparison of Diagnostic Accuracy Metrics Among Three Groups |
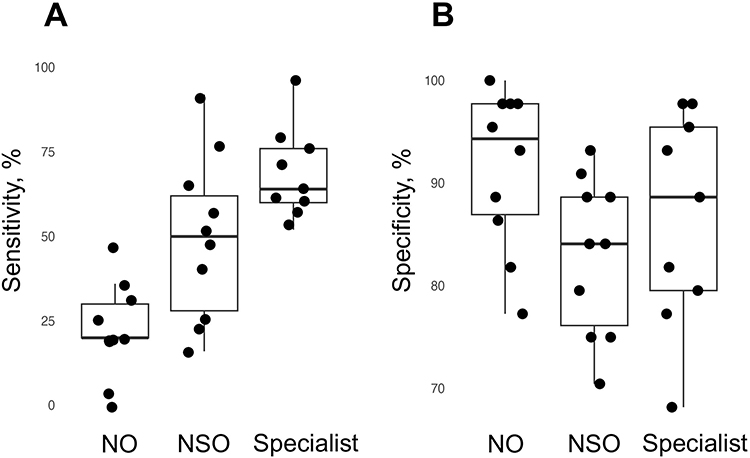 |
Figure 1 Sensitivity and specificity distribution among three groups. Sensitivity (A) and specificity (B) are presented using boxplots for three groups: non-ophthalmologists, non-specialist ophthalmologists, and specialists. Individual physicians’ measured values for sensitivity or specificity are plotted on the boxplots for enhanced visualization. NO and NSO denote non-ophthalmologists and non-specialist ophthalmologists, respectively. Abbreviations: NO, non-ophthalmologist; NSO, non-specialist ophthalmologist. |
The specificity was 0.92 ± 0.08 for non-ophthalmologists, 0.83 ± 0.08 for non-specialist ophthalmologists, and 0.87 ± 0.10 for specialists, respectively. There were no significant differences in specificity among the three groups, as determined by the Kruskal–Wallis test (P=0.086).
The PPV tended to be higher for specialists than those for non-specialist ophthalmologists and non-ophthalmologists, although the difference was not significant (Kruskal–Wallis test, P=0.108). The NPV showed a descending trend from specialists, non-specialist ophthalmologists, to non-ophthalmologists, with specialists having a significantly higher NPV than that of non-ophthalmologists (Dunn’s test, P<0.001).
The Kappa coefficients were 0.16 ± 0.13 for non-ophthalmologists, 0.33 ± 0.20 for non-specialist ophthalmologists, and 0.56 ± 0.13 for specialists, respectively. Specialists exhibited a significantly higher Kappa compared to both non-ophthalmologists and non-specialist ophthalmologists, as demonstrated by Dunn’s test (P<0.001 for non-ophthalmologists and P=0.024 for non-specialist ophthalmologists, respectively).
Discussion
This study investigated whether the accuracy of fundus image interpretation varied among physicians. Sixty-nine eyes (25 glaucomatous eyes and 44 non-glaucomatous eyes) were evaluated by 29 physicians. The results demonstrated that specialists had significantly higher sensitivity than that of non-specialist ophthalmologists and non-ophthalmologists. The three groups did not differ significantly in terms of specificity. Evaluation of the kappa coefficients indicated that non-ophthalmologists showed only slight agreement in their interpretations, and even specialists reached only a moderate level of agreement. These results suggest limitations in glaucoma screening through fundus images.
The years of experience in fundus image interpretation were comparable between non-ophthalmologists and specialists, and were longer than those of non-specialist ophthalmologists. However, non-ophthalmologists exhibited lower sensitivity than those of less experienced non-specialist ophthalmologists. This suggests that experience alone may not be sufficient to enhance diagnostic sensitivity, and that specialized ophthalmic knowledge plays a crucial role in accurately detecting glaucomatous findings. Furthermore, although no significant difference in specificity was observed among the three groups, a trend toward higher specificity in the order of non-ophthalmologists, specialists, and non-specialist ophthalmologists was observed. The higher specificity of non-ophthalmologists could be attributed to their tendency to categorize many cases as normal, regardless of whether they were glaucomatous or non-glaucomatous, thus inherently elevating specificity. Specialists adept at accurately identifying glaucomatous eyes while also accurately recognizing normal eyes tended to have higher specificity than that of non-specialist ophthalmologists.
This study demonstrated significant variability in the accuracy of glaucoma diagnosis depending on the interpreter’s background, notably among non-ophthalmologists whose readings were not consistently accurate, missing even advanced cases of disc cupping and apparent retinal nerve fiber layer defect. Examining the kappa values, non-ophthalmologists showed a kappa coefficient of 0.16, indicating only slight agreement and reflecting a considerably low level of consistency in their assessments. Joseph et al 12 reported that trained non-ophthalmologists could determine diabetic retinopathy and diabetic macular oedema with a good level of accuracy comparable to that of ophthalmologists, suggesting that leveraging non-ophthalmologists could enhance the efficiency of diabetic retinopathy diagnosis using fundus images. For glaucoma screening as well, verifying whether providing appropriate training in image interpretation improves diagnostic outcomes may be warranted. The ten non-ophthalmologists in this study routinely interpret the results of ophthalmic examinations conducted during health checkups, yet they have never had the opportunity to receive professional guidance from ophthalmologists. They have individually sought to improve their skills, including studying through literature related to fundus images. The establishment of educational systems related to health checkups led by national bodies or societies might be necessary.
Differences in reading accuracy were evident not only between ophthalmologists and non-ophthalmologists but also within groups with similar attributes. Among non-specialist ophthalmologists, the kappa value was 0.33, indicating a fair level of agreement, while specialists exhibited a kappa value of 0.56, suggesting a moderate agreement. These findings imply that even among ophthalmologists equipped with specialized knowledge and experience, producing consistent diagnostic outcomes can be challenging. This suggests there may be inherent limitations to relying solely on fundus image examinations for glaucoma screening. In this study, the average Mean Deviation value for the 25 glaucomatous eyes was −3.08 dB, indicating a predominance of early-stage glaucoma, where detecting glaucomatous changes can be challenging. This might contribute to the variability in the interpretation results. To address the challenges identified, establishing a remote interpretation support system accessible to specialist ophthalmologists and building an AI-assisted diagnostic system13 might be effective methods to mitigate variability in reading accuracy. Additionally, incorporating new ophthalmic examinations such as optical coherence tomography (OCT)10,14 and visual field perimeters7,15,16 might elevate the overall accuracy of image interpretation.
In this study, the sensitivity and specificity of specialists were 0.68 and 0.87, respectively, which could not be considered satisfactory in terms of diagnostic accuracy. Although all glaucomatous eyes in this study exhibited some glaucomatous changes in fundus images, this study included cases of early-stage glaucoma with subtle fundus findings, as well as cases with high myopia, making it challenging to discern glaucomatous changes. These challenging cases lower the overall diagnostic performance. Further research is required to determine the extent to which the progression of glaucoma and the degree of myopia affect diagnostic accuracy.
The variation in sensitivity seemed smaller among specialists than it was among the other two groups, whereas specificity showed similar variability across all groups. Within the specialist and non-specialist ophthalmologist groups, some physicians exhibited high sensitivity but low specificity. This pattern, potentially arising from an overemphasis on identifying all glaucoma cases, led to fewer missed glaucoma findings, and thus higher sensitivity, at the cost of mislabeling normal fundi with disc cupping, resulting in lower specificity. Even ophthalmologists who are well-versed in glaucoma management need to be cautious to avoid this pitfall.
This study is unique in its investigation of fundus image interpretation accuracy, extending its scope to include non-ophthalmologists. Unlike existing research that focused solely on ophthalmologists, incorporating non-ophthalmologists who regularly interpret fundus images in settings like health checkups significantly broadens the research field. This new perspective aims to deepen the understanding of glaucoma screening and encourage further research towards optimizing diagnostic techniques. This study had two limitations. The diagnostic accuracy of the physicians in this study did not predict accuracy in actual clinical settings. Twenty-five out of 69 eyes (36.2%) were diagnosed with glaucoma, significantly exceeding the prevalence of glaucoma in the Japanese population. Patients with optic media opacities or small pupils that hindered fundus visualization were excluded, which also contributes to the reason why the fundus images used in this study does not fully align with real clinical settings. Additionally, several instances of early-stage glaucoma with subtle findings and cases in which myopia hindered the diagnosis of glaucoma were included, which might have lowered the overall diagnostic performance. This study was designed solely to compare the diagnostic accuracy among physicians. Another limitation was the small sample size. Estimating the sample size for Cohen’s kappa yielded a value of 105 (with a null hypothesis value for kappa = 0.7, expected kappa = 0.85, expected value for evaluator 1 = 0.36, and expected value for evaluator 2 = 0.36). Considering these figures, the sample size of 69 in this study seems insufficient. Additionally, the high ratio of non-glaucomatous eyes may have complicated the comparison of specificity among the three groups. Each group of physicians comprised either nine or 10 members, which was also considered insufficient for statistically analyzing the diagnostic accuracy between the groups.
Conclusion
This study highlighted that the diagnostic accuracy significantly varied based on the physician’s background. The number of years of interpretation experience had little relevance to the diagnostic accuracy, suggesting that the accumulation of specialized knowledge in ophthalmology could augment glaucoma screening proficiency. Previous research suggests that even non-ophthalmologists can accurately assess fundus images at a good level if provided with the right learning opportunities, highlighting the need to develop proper educational systems in glaucoma screening. Our results shed light on the challenges faced in glaucoma screening and lay a foundation for future endeavors to enhance diagnostic accuracy.
Acknowledgments
We would like to thank all the physicians who provided their expertise in the interpretation of fundus image examinations.
Disclosures
The authors have made the following disclosure: R.T., E.N.: grant - Carl Zeiss, outside the submitted work. T.Na.: grants - Crewt Medical Systems, Kyowa Medical, Kuribara Medical Instruments, Tomey, MSD, Pfizer, Alcon Japan, NIDEK, AMO Japan, Bayer, IOL Medical, All Nippon Airway, Japan Airlines Nitto Medic, Nikon; grants and personal fees - Kowa, Otsuka Pharmaceutical, Senju Pharmaceutical, Santen Pharmaceutical, Carl Zeiss, outside the submitted work. The other authors report that they have no conflicts of interest in this work.
Funding
This work was supported by the Ministry of Health, Labor and Welfare (MHLW) Sciences Research Grant (Comprehensive Research on Life-Style Related Diseases including Cardiovascular Diseases and Diabetes Mellitus, 20FA1021, PI: Dr. Takashi WADA).
References
1. Resnikoff S, Pascolini D, Etya’ale D, et al. Global data on visual impairment in the year 2002. Bull World Health Organ. 2004;82(11):844–851.
2. Tham YC, Li X, Wong TY, Quigley HA, Aung T, Cheng CY. Global prevalence of glaucoma and projections of glaucoma burden through 2040: a systematic review and meta-analysis. Ophthalmology. 2014;121(11):2081–2090. doi:10.1016/j.ophtha.2014.05.013
3. Iwase A, Suzuki Y, Araie M, et al. The prevalence of primary open-angle glaucoma in Japanese: the Tajimi Study. Ophthalmology. 2004;111(9):1641–1648. doi:10.1016/j.ophtha.2004.03.029
4. Yamada M, Hiratsuka Y, Nakano T, et al. Detection of glaucoma and other vision-threatening ocular diseases in the population recruited at specific health checkups in Japan. Clin Epidemiol. 2020;12:1381–1388. doi:10.2147/clep.S273016
5. Ikeda N, Saito E, Kondo N, et al. What has made the population of Japan healthy? Lancet. 2011;378(9796):1094–1105. doi:10.1016/s0140-6736(11)61055-6
6. Terauchi R, Wada T, Fukai K, et al. Age-related changes in intraocular pressure: japan ningen dock study. J Glaucoma. 2022;31(12):927–934. doi:10.1097/ijg.0000000000002115
7. Terauchi R, Wada T, Ogawa S, et al. FDT perimetry for glaucoma detection in comprehensive health checkup service. J Ophthalmol. 2020;2020:4687398. doi:10.1155/2020/4687398
8. Abrams LS, Scott IU, Spaeth GL, Quigley HA, Varma R. Agreement among optometrists, ophthalmologists, and residents in evaluating the optic disc for glaucoma. Ophthalmology. 1994;101(10):1662–1667. doi:10.1016/s0161-6420(94)31118-3
9. Rossetto JD, Melo Jr LAS, Campos MS, Tavares IM. Agreement on the evaluation of glaucomatous optic nerve head findings by ophthalmology residents and a glaucoma specialist. Clin Ophthalmol. 2017;11:1281–1284. doi:10.2147/opth.S140225
10. Watanabe T, Hiratsuka Y, Kita Y, et al. Combining optical coherence tomography and fundus photography to improve glaucoma screening. Diagnostics. 2022;12(5):1.
11. Landis JR, Koch GG. The measurement of observer agreement for categorical data. Biometrics. 1977;33(1):159–174. doi:10.2307/2529310
12. Joseph S, Rajan RP, Sundar B, Venkatachalam S, Kempen JH, Kim R. Validation of diagnostic accuracy of retinal image grading by trained non-ophthalmologist grader for detecting diabetic retinopathy and diabetic macular edema. Eye. 2023;37(8):1577–1582. doi:10.1038/s41433-022-02190-4
13. Coan LJ, Williams BM, Krishna Adithya V, et al. Automatic detection of glaucoma via fundus imaging and artificial intelligence: a review. Surv Ophthalmol. 2023;68(1):17–41. doi:10.1016/j.survophthal.2022.08.005
14. Fukai K, Terauchi R, Noro T, et al. Real-time risk score for glaucoma mass screening by spectral domain optical coherence tomography: development and validation. Transl Vis Sci Technol. 2022;11(8):8. doi:10.1167/tvst.11.8.8
15. Tatemichi M, Nakano T. Performance of glaucoma mass screening with only a visual field test using frequency-doubling technology perimetry. Am J Ophthalmol. 2002;134(4):529–537. doi:10.1016/s0002-9394(02)01684-7
16. Arai K, Nishijima E, Ogawa S, et al. A novel visual field screening program for glaucoma with a head-mounted perimeter. J Glaucoma. 2023;32(6):520–525. doi:10.1097/ijg.0000000000002199
 © 2024 The Author(s). This work is published and licensed by Dove Medical Press Limited. The
full terms of this license are available at https://www.dovepress.com/terms
and incorporate the Creative Commons Attribution
- Non Commercial (unported, 3.0) License.
By accessing the work you hereby accept the Terms. Non-commercial uses of the work are permitted
without any further permission from Dove Medical Press Limited, provided the work is properly
attributed. For permission for commercial use of this work, please see paragraphs 4.2 and 5 of our Terms.
© 2024 The Author(s). This work is published and licensed by Dove Medical Press Limited. The
full terms of this license are available at https://www.dovepress.com/terms
and incorporate the Creative Commons Attribution
- Non Commercial (unported, 3.0) License.
By accessing the work you hereby accept the Terms. Non-commercial uses of the work are permitted
without any further permission from Dove Medical Press Limited, provided the work is properly
attributed. For permission for commercial use of this work, please see paragraphs 4.2 and 5 of our Terms.