Back to Journals » Clinical, Cosmetic and Investigational Dentistry » Volume 14
Comparative Evaluation of Bulk-Fill Composite Resins: Knoop Microhardness, Diametral Tensile Strength and Degree of Conversion
Authors Strini BS, Marques JFL ![]() , Pereira R
, Pereira R ![]() , Sobral-Souza DF
, Sobral-Souza DF ![]() , Pecorari VGA
, Pecorari VGA ![]() , Liporoni PCS
, Liporoni PCS ![]() , Aguiar FHB
, Aguiar FHB ![]()
Received 26 May 2022
Accepted for publication 21 July 2022
Published 4 August 2022 Volume 2022:14 Pages 225—233
DOI https://doi.org/10.2147/CCIDE.S376195
Checked for plagiarism Yes
Review by Single anonymous peer review
Peer reviewer comments 3
Editor who approved publication: Professor Christopher E. Okunseri
Bruna Scarcello Strini,1 Joyce Figueiredo de Lima Marques,1 Renata Pereira,1 Danielle Ferreira Sobral-Souza,2 Vanessa Gallego Arias Pecorari,3 Priscila Christiane Suzy Liporoni,4 Flávio Henrique Baggio Aguiar1
1Department of Restorative Dentistry, Piracicaba Dental School, University of Campinas, Piracicaba, SP, Brazil; 2Dental School, Federal University of Mato Grosso do Sul, Campo Grande, MS, Brazil; 3Department of Biostatistics, Piracicaba Dental School, University of Campinas, Piracicaba, SP, Brazil; 4Department of Restorative Dentistry, University of Taubate, Taubaté, SP, Brazil
Correspondence: Joyce Figueiredo de Lima Marques, Department of Restorative Dentistry, Piracicaba Dental School, University of Campinas, Av. Limeira, 901, Piracicaba, SP, 13414-903, Brazil, Tel +55 19 2106-5337 ; +55 84 99966-8539, Fax +55 19 3421-0144, Email [email protected]
Purpose: Bulk-fill composite resins were developed to reduce time and facilitate the restorative procedure. However, considering their recent introduction on the market and the new formulations, their performance still requires evaluation. This study aimed to evaluate Knoop microhardness (KHN), diametral tensile strength (DTS) and degree of conversion (DC) of three Bulk-Fill composite resins and a conventional one.
Materials and Methods: Sixty samples (n = 15; 8 mm ø x 4 mm height) were confectioned using a mold. Filtek Bulk-Fill (FBF), Tetric N-Ceram Bulk-Fill (TNC) and SonicFill 2 (SF2) were placed in 4 mm increments, and Filtek Z350 (FZ350) was placed in 2 mm increments. The KHN of top and bottom surfaces were tested using Knoop Hardness tester at 10 gf/10s. The DTS was tested under compressive load at 1.0 mm/min. The DC was measured by Fourier Transform Infrared (FTIR) spectroscopy. Differences in DTS and DC were analyzed by ANOVA and Tukey post hoc test. For KHN, Kruskal–Wallis and Wilcoxon tests were performed at α = 0.05.
Results: Top surfaces of all composite resins had higher KHN than bottom surfaces. At top and bottom surfaces, FZ350 showed higher KHN than TNC and SF2. The highest DTS was obtained by FBF, followed by FZ350 and SF2. The highest DC was obtained by SF2, the lowest one was obtained by FBF.
Conclusion: From Bulk-Fill composite resins, FBF presented the best KHN and DTS results. The SF2 showed the best DC. Further studies are required to ensure whether these differences can negatively influence the behavior of in vivo restorations.
Keywords: composite resins, Bulk-Fill, FTIR, hardness, tensile strength
Introduction
Composite resins are the most currently used restorative material mainly due to their excellent aesthetic properties and possibility of adhesion to teeth, which results in less invasive cavity preparations.1 When light-activation is performed, this material suffers a volumetric shrinkage that can compromise the marginal integrity of the restoration and consequently its clinical longevity.2,3 For this reason, it has been recommended to place conventional composite resins in increments of 2 mm to reduce the adverse effects of the polymerization stress.4 However, this well-known technique is considered highly sensitive and time-consuming.5 Thereby, to reduce the conventional composite resin shrinkage stress, decrease clinical time and facilitate material handling, the Bulk-Fill composite resins were developed.1,6
According to manufacturers, they can be light-cured with up to 5mm of material in the cavity, without compromise of their physical properties. This polymerization with a greater amount of material is possible due to the changes made in the compositions of the Bulk-Fill composite resins. Among the proposed modifications, (1) the use of fluid materials was applied, with lower load content, (2) as well as different types of particles, to improve light transmission in deep layers, (3) the use of more efficient initiators, (4) and improvements in the monomer system that promises greater stress relief during polymerization.7 Commercial examples of Bulk-Fill composite resins that possess some of these technologies are: Filtek One Bulk-Fill (3M-Oral Care) and Tetric N-Ceram (Ivoclar-Vivadent).
Systematic review and meta-analyzes have shown that Bulk-Fill composite resins have better or similar performance to the conventional ones.8–10 However, their introduction on the market is recent, and new formulations have been developed that require further investigation, such as the SonicFill 2 (Kavo-Kerr). According to the manufacturers, this composite resin “is based on the award-winning performance of its predecessor” (Technical Profile SonicFill 2), the SonicFill. Nevertheless, the manufacturers do not make clear what changes in its composition were made, and to the best of our knowledge, there are few studies evaluating the SonicFill 2.
In view of the popularization and increased commercialization of Bulk-Fill composite resins, it is necessary to evaluate their performance in both clinical and laboratorial studies. Among in vitro tests commonly used to simulate the forces that affect the tooth-restoration complex during chewing, the microhardness test is one of the most used because it can predict whether the restorative material will resist wear.11 This analysis is indirectly related to the degree of conversion and studies have shown that both tests show results with lower values according to depth, that is, with increments of composite resin in greater thickness,12,13 as occurs in Bulk-Fill composite resins. The diametral tensile strength test, on the other hand, shows the capacity of the composite resin to withstand compression loads, such as, for example, occlusal loads that generate tensile stresses without fracturing.14
Thus, the objective of this study was to evaluate and compare the degree of conversion (DC), microhardness (KHN) and diametral tensile strength (DTS) of 3 commercial Bulk-Fill composite resins (SonicFill 2, Filtek Bulk-Fill, Tetric N-Ceram) and 1 conventional one (Filtek Z350). The null hypothesis tested is that there would be no difference between them.
Materials and Methods
For this study, sixty samples (n = 15) of composite resin were made. The conventional resin composite Filtek Z350 (FZ350) was considered as the control group, while Bulk-Fill resin composites, such as Filtek Bulk-Fill (FBF), Tetric N-Ceram Bulk-Fill (TNC) and SonicFill 2 (SF2), as the experimental ones. The materials tested and their composition are described in Table 1.
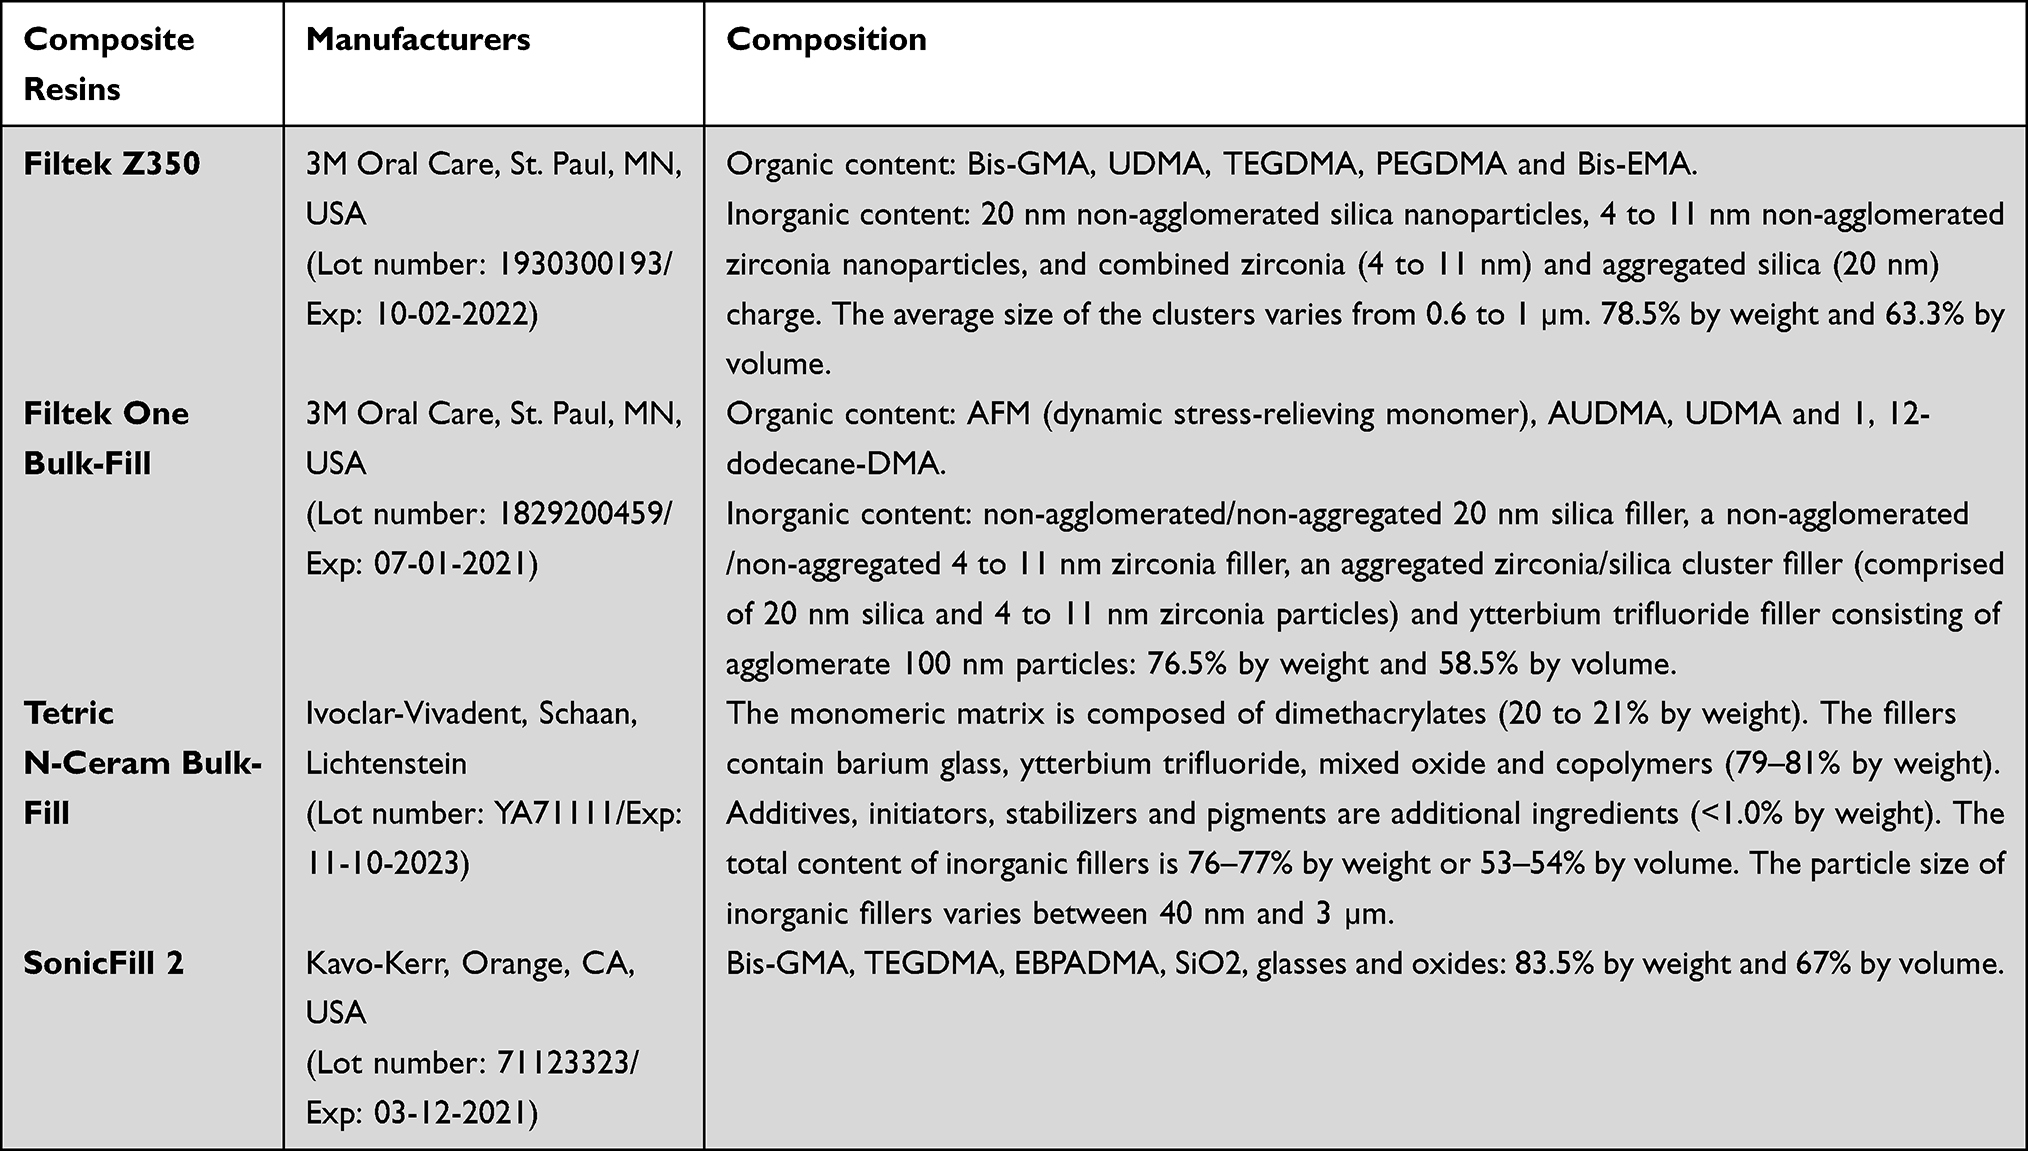 |
Table 1 Materials Used, Their Composition and Manufacturers |
Samples Preparation
For sample preparation, a silicon mold of 8 mm of internal diameter and 4mm of height was used. The materials were inserted into the mold using two methods, according to the type of composite resin: for the conventional one, by increments of 2 mm following the incremental technique, and for Bulk-Fill resin composites, in single increments of 4 mm thick. A handpiece provided by the manufacturer was used to insert the SF2, which according to them, sonically activates the material and decreases its viscosity at the insertion time. All the materials were tested with the A1 shade. Each increment was light cured according to the time recommended by the manufacturer for each composite resin (20s for FBF, SF2 and FZ350, and 10s for TNC), using a 3rd generation LED (VALO Ultradent Products Inc., South Jordan, UT, USA) in its standard output mode. The distance of the tip device to the mold surface was standardized to approximately 1 mm with the aid of a holder. After filling the matrix, a polyester strip was placed over the composite resin with light pressure, and a glass plate was placed over the strip for 10 seconds to obtain a flat and even surface prior the light curing. The power of the device (1.000 ± 9.2 mW/cm2) was verified during all experiments with a potentiometer. Then, the samples were removed from the mold and dry stored at 37 ± 1°C for 24 h in a light shelter.
The top and bottom of all samples were then polished by the same operator using 1200 and 4000-grit silicon carbide (SiC) abrasive papers (CarbiMet Abrasive Discs, Buehler, Lake Bluff, IL). After polishing with each grit, the samples were cleaned with distilled water in an ultrasonic vat (Sonica, SoltecS.il Co., Milano, Italy) for 5 minutes to remove any debris on the surface. The schematic representation of sample preparation is shown in Figure 1.
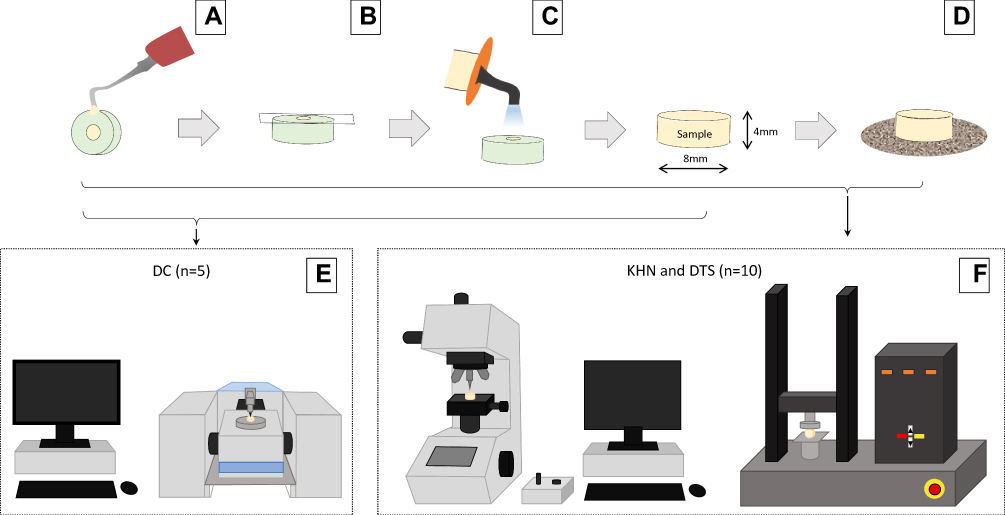 |
Figure 1 Samples preparation and their respective analysis. Notes: (A) Insertion of the composite in the silicon mold. (B) Flattening the composite with polyester strip and glass plate for 10s. (C) Sample light curing. (D) Polishing with 1200 and 400-grit silicon carbide (SiC) abrasive papers. (E) Degree of conversion test. (F) Knoop microhardness and diametral tensile strength tests. |
Surface Microhardness
The microhardness readings (n = 10) were performed on the top and bottom surfaces of each sample using the Future Tech FM-ARS surface microhardness machine (Future-Tech Corp., Tokyo, Japan) with a Knoop diamond indenter under a 10 g for 10s. Five measurements were made on the surface of each sample by the same operator, one at the sample center and the other four at a distance of ~100 µm from the central location. The average of these five measurements was considered as the final Knoop microhardness (KHN) value.
Diametral Tensile Strength
For the DTS test, the same samples (n = 10) of microhardness were used. A digital caliper (Mitutoyo, Tokyo, Japan) was used to measure the sample dimensions and ensure that the diameter was twice its height, as recommended by ADA No. 27 for this analysis.15 After this verification, each sample was positioned on its side between the parallel plates of the Universal Mechanical Testing Machine (Instron, 4411, Canton, MA, England). A continuously load cell of 5.000 N was applied at a crosshead speed of 1 mm/min until fracture. The data obtained were then applied to the formula: DTS = 2F/πdh, where DTS = diametral tensile strength value (MPa); F = applied force to failure (N); d = diameter of the sample (mm); h = height of the sample (mm).
Degree of Conversion
The DC of bottom surfaces (n = 5) was obtained by Fourier Transformed Infrared Spectroscopy (FTIR – Spectrum 100 FTIR/ATR; Perkin Elmer, Waltham, MA, USA). All spectra were obtained in 650–4000 cm−1 with 32 scans and 4 cm−1 resolutions. Baseline correction was performed in region between 1590 and 1660 cm-1. The percentage of unreacted carbon–carbon double bonds (C=C) was determined from the ratio of absorbance intensities of aliphatic vinyl bonds of methacrylate C=C (peak at 1638 cm−1) against the internal standard (aromatic bisphenol C=C, peak at 1608 cm−1) for non-polymerized and polymerized composite resin. The non-polymerized composite resin was used as a reference. The DC was determined by the following formula:  , where R = ratio by band height at 1638 cm−1/band height at 1608 cm−1.
Statistical Analyses
The exploratory analyzes was performed to verify the assumptions of a parametric analysis. The normality of errors was analyzed by the Shapiro–Wilks test and homogeneity of variance was analyzed using Levene’s test. The DTS and DC data presented normal distribution (p = 0.402, p = 0.191, respectively) and homoscedasticity (p = 0.144, p = 0.094, respectively). After exploratory analyses, the DTS and DC data were submitted to One-way ANOVA and Tukey’s test. As KHN did not presented homoscedasticity (p = 0.038), the non-parametric Kruskal–Wallis’s test was used for the comparison between groups, and Wilcoxon, for the comparison between the analyzed surfaces (top and base). All the statistical analyzes were performed in SPSS 25 Software (IBM SPSS Statistics 25 Corp) at the significant level of 0.05.
Results
The statistical analyzes for the DTS (p < 0.001) and DC (p < 0.001) revealed that there was a significant difference between the groups, and for the KHN values it was possible to identify that there was a difference between the groups (p < 0.001) and between the analyzed surfaces (top and bottom) (p = 0.021).
The results for KHN demonstrated that the values of the top surface of the samples were statistically higher when compared to the values of the bottom surface, for all groups. In addition, FZ350 group showed higher KHN values than TNC and SF2 in both top and bottom surfaces. The FBF group, in turn, was statistically similar to all groups (Table 2).
 |
Table 2 Median (Minimum-Maximum) of KHN Values in Different Groups and Different Surfaces (Top and Bottom) |
The results for DTS showed that the FBF group presented higher values of resistance to diametral traction when compared to the other groups. On the other hand, the FZ350 group showed statistically higher values when compared to the SF2 group. The TNC group, on the other hand, presented statistically similar values both to the FZ350 group and to the SF2 group (Table 3).
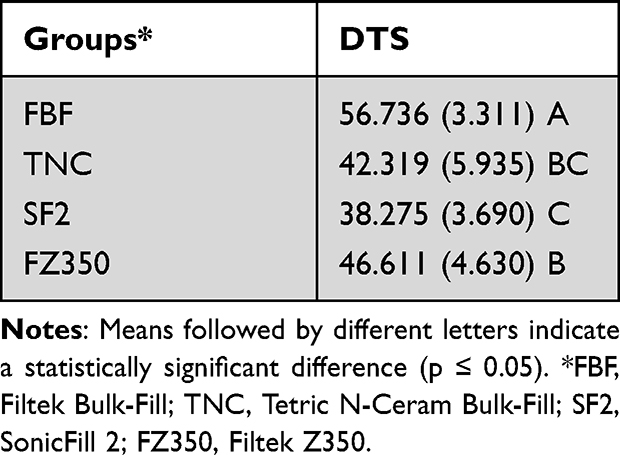 |
Table 3 Means (Standard Deviation) of the DTS (MPa) in the Different Groups |
The results for DC, in turn, demonstrated that the SF2 group showed the highest values, being statistically superior to all other groups. In contrast, the FBF group showed the lowest DC, being statistically lower than all other groups. The TNC and FZ350 groups were statistically similar to each other (Table 4).
 |
Table 4 Means (Standard Deviation) of the DC (%) in the Different Groups |
Discussion
The decision of which composite resin to use during a certain restorative procedure must consider its mechanical properties, in order to obtain an increase in the longevity of the restoration.16,17 In this context, the evaluation of material properties in vitro becomes essential because it simulates the ability of this material to resist the stress suffered in the oral environment without fracturing or suffering wear.4,14 In this study, the microhardness (top and bottom), the degree of conversion (base), and the diametral tensile strength of 3 commercial Bulk-Fill composite resins compared to 1 conventional composite resin were evaluated. According to the results, the null hypothesis tested that there would be no difference between the properties of composite resins was rejected.
As the results for KHN showed, the values of the top surface of all groups were statistically higher than the values of the bottom surface. Regardless of the composite resin evaluated, the irradiance that reaches the bottom surfaces is affected for both the increase of distance to the guide tip of the light-curing unit and light scattering by the filler particles and resinous matrix.18 It is well understood that the irradiance is inversely proportional to the distance of the light-curing unit guide tip19 and that light penetrates the composite resin layer and is partially absorbed, partially scattered by fillers and other constituents, respectively.20,21
The conventional resin composite FZ350 specifically showed the highest values of KHN both at the top and at the bottom surfaces, when compared to the other resin composites. Its composition comprises nano-agglomerates of fillers (nanoclusters), which due to its characteristics, allow a better distribution and a larger amount of particles in the resin matrix, improving its mechanical properties.22 Furthermore, the high hardness, characteristic of the zirconia particles incorporated in the composition of many 3M composite resins,5,23 may also have contributed to this outcome. Bahbishi et al evaluated color stability and microhardness of Bulk-Fill composite resins, and also found that all of them had lower microhardness values when compared to FZ350.1 One should also consider that, unlike Bulk-Fill composite resins, FZ350 was built-up in two increments of 2 mm. As already mentioned, the penetration of light through an increment during curing is a complex phenomenon dependent on many factors, such as type and size of filler, light source, as well as the difference of refractive index between fillers and monomers.20,24 With such number of factors in the path, it is likely that light penetration decreases as the thickness of composite resin increases.20,25 Thus, the microhardness result presented by FZ350 is also possibly due to the fact that its increment was smaller than the increments of the Bulk-Fill composite resins.
Such features may further justify the DTS values of FZ350, which were higher than SF2 (p < 0.001), and the DC ones, which were higher than FBF (p < 0.001). The smaller increment might have led to improve of DC and consequently increase of mechanical strength (DTS). Yet, possible void incorporation during the filling through incremental technique explains the reason why FZ350 presented lower DTS than FBF.26 During DTS test the voids may have acted as areas of sample fracture origin; unlike FBF, which despite having a constitution of filler particles largely similar to FZ350, once it was inserted in single increment, presented higher values of DTS.
The FBF is also manufactured by 3M and as previously mentioned, is composed of nanoparticles of fillers (nanoclusters), including zirconia ones, which even in lower amount (58.5 vol%) when compared to FZ350 (63.3 vol%), might have played a role in this composite resin performance.27 This composition characteristic, added to the fact that it is a single fill composite resin, which practically nullifies the chances of incorporating bubbles during the insertion of the material in the matrix cavity, may justify why this composite resin presented the highest values for DTS, as well as top and bottom KHN values similar to those of the FZ350. Similarly, Pereira et al reported similar performance of FBF and FZ350.21 However, despite what we expected for the results of the DC, this composite resin showed the lowest values. This finding can be understood by the nature of its organic matrix. Among the modifications proposed by the manufacturer, different monomers were developed and incorporated into its composition, such as the high molecular weight aromatic dimethacrylate (AUDMA), capable of increasing the rigidity of the polymer chain formed.28 On the one hand, a more rigid chain increases the resistance of the material,29 which may also have contributed to the higher values of DTS. On the other hand, it decreases the number of reactive groups on the organic matrix and hinders their mobility during the polymerization reaction. Thus, one can understand a low DC value for this composite resin at the bottom of the samples, as also demonstrated by Habib and Waly (2018).30
However, not necessarily lower values of DC at the bottom of the samples imply unacceptable clinical performance,31 since it has been shown that more important than the amount of conversion of carbon double bonds into single bonds, is the quality of these bonds, that is, the degree of cross-linking;23 and this cannot be measured by FTIR, since this is a quantitative analysis. The degree of crosslinking of this composite resin, in turn, can be compensated by other monomers incorporated in its composition: the additional fragmentation monomer (AFM), which can cleave, relaxing the polymerization stresses that are generated during the formation of the chain, and still react by forming other cross bonds due to the free radical generated by the break;28 and the UDMA monomer, which has the presence of imino groups (-NH-) in its structure, responsible for the characteristic chain transfer reactions, which provide an alternative path for the polymerization.5
As observed in the results, the TNC and SF2 composite resins showed the lowest values of both KHN and DTS tests. The TNC composite resin has prepolymer particles (isofillers) in its composition, which, due to its resinous nature, presents lower modulus of elasticity. This lower modulus of elasticity causes worsening on stress distribution, which makes the material more susceptible to deformations.32 This fact could explain the lower KHN and DTS values of TNC.13,33 Also, this composite resin showed DC values below those of SF2 (p < 0.001). According to the manufacturers, besides camphorquinone, an alternative photoinitiator known as Ivocerin was added to this composite resin to provide better light-curing and consequently better DC. However, as inferred by the present study and proved by previous ones,13,33 this additional photoinitiator did not provide higher DC for this composite resin when compared to others. This may be associated with low penetration in the resinous matrix of the violet light (between 380 and 450nm), capable of activating the Ivocerin, for two different reasons: the first, due to the short wavelength of this light, that restricts the action of the additional photoinitiator only to the most superficial layers of the composite resin;33 and second, due to the composite resin filler content. Although from all composite resins tested TNC presents the lowest amount of fillers, the size of particle reaches up to 3 µm. As well elucidated by Emami et al, the higher the particle size, the higher the chance of absorption changes, so more likely to occur light scattering.20
The SF2 composite resin, on the other hand, is a reformulation of its predecessor SonicFill. According to the manufacturer, the modifications of its composition have improved the composite resin performance. However, to the best of our knowledge, few in vitro studies1,34–36 and no in vivo studies have been found so far evaluating SF2 properties. Yet, one may note that the composite resin line-up remained presenting high filler content (81.3 wt%). If, on the one hand, it can be inferred that the high filler content could improve the composite resin’s mechanical properties, on the other hand, such feature, added to the composite resin’s low translucency, already pointed out by its predecessor, could also hinder the transmission of light through the material and result in inefficient DC, especially in deeper layers.13,21,30 Conversely, our study showed the lowest KHN and DTS, but the highest DC values for SF2. Indeed, the reason for the SF2 KHN and DTS results may lie in the composite resin sonic activation feature and monomer content. The use of sonic activation to place the material into the cavity, as recommended by the manufacturer, may in fact result in voids development.1 This happens because when the composite resin portion that comes out of the tip, more flowable, reaches the portion that has already been inserted in the cavity, more dense, the difference in consistency between them prevents a perfect adaptation of the increment. Hence, the chance of crack development and bulk fracture is increased, as already demonstrated in another study.37
Regarding its monomer content, SF2 contains TEGDMA. Although its exact quantity is not informed by the manufacturer, a previous study highlighted the elution of TEGDMA from SF2 in comparison to other Bulk-Fill composite resins,36 indicating that the monomer content is not low. TEGDMA have two functional terminal methacrylate groups similar to Bis-GMA. The difference is that there is a linear chain between the groups, decreasing its viscosity.38 The lesser viscosity may reduce the composite resin’s mechanical properties,38 which could further explain our KHN and DTS findings. Nonetheless, the low viscosity of this monomer favors the movement of reactive species responsible for both initiation and propagation of the polymerization reaction, yielding higher conversion degree values.34 The temperature generated by sonic activation might also have played a role in the DC values obtained by SF2. As suggested by Garoushi et al, one may speculate that the increase of temperature during the material application through activation by sonic energy can increase the composite resin’s DC in two ways: directly, by increasing the mobility of free radicals during the formation of polymer chain, and indirectly, by reducing the composite resin’s viscosity.13
As noted, the differences in composition of the Bulk-Fill composite resins tested influenced in different physical and mechanical behaviors among them. In this in vitro study, properties were evaluated separately. However, the behavior in function of a restoration and its longevity will depend, as far as the material is concerned, on a sum between the characteristics of the resin matrix and that of the filler particles.39 Thus, the importance of in vitro studies consists to be the first level of evidence to assess the quality of new commercially available materials. However, only controlled and randomized clinical studies will confirm its effectiveness and permanence in the market.
Conclusions
Differences in the composition of the evaluated Bulk-Fill composite resins resulted in different results for the in vitro analyzes performed. From Bulk-Fill composite resins, FBF presented the best KHN and DTS results. The SF2 showed the best DC. However, it remains need to know whether these differences can negatively influence the behavior of in vivo restorations. Accordingly, more clinical studies should be carried out in long term.
Acknowledgments
The authors are grateful to the Department of Pediatric Dentistry, Piracicaba Dental School, UNICAMP, for providing the use of the digital Knoop hardness measuring instrument, to the Department of Restorative Dentistry (Dental Materials Area), Piracicaba dental School, UNICAMP, for providing the use of the Universal Mechanical Testing Machine and to Department of Restorative Dentistry, University of Taubate, for providing the use of FTIR.
Funding
This research was supported by the Institutional Scientific Initiation Scholarship Program (PIBIC/UNICAMP) and Conselho Nacional de Desenvolvimento Científico e Tecnológico - Brazil (CNPq) - 148542/2019-0.
Disclosure
Bruna Scarcello Strini, Joyce Figueiredo de Lima Marques and Renata Pereira report grants from PIBIC/UNICAMP, during the conduct of the study. The authors report no conflicts of interest in this work.
References
1. Bahbishi N, Mzain W, Badeed B, Nassar HM. Color stability and microhardness of Bulk-Fill composite materials after exposure to common beverages. Materials. 2020;13(3):787. doi:10.3390/ma13030787
2. Marí LG, Gil AC, Puy CL. In vitro evaluation of microleakage in Class II composite restorations: high-viscosity bulk-fill vs conventional composites. Dent Mater J. 2019;38(5):721–727. doi:10.4012/dmj.2018-160
3. Sampaio CS, Fernández Arias J, Atria PJ, et al. Volumetric polymerization shrinkage and its comparison to internal adaptation in bulk fill and conventional composites: a μCT and OCT in vitro analysis. Dent Mater. 2019;3:1–8.
4. Karacolak G, Turkun LS, Boyacioglu H, Ferracane JL. Influence of increment thickness on radiant energy and microhardness of bulk-fill resin composites. Dent Mater J. 2018;37(2):206–213.
5. Pereira R, Giorgi MCC, Lins RBE, et al. Physical and photoelastic properties of bulk-fill and conventional composites. Clin Cosmet Investig Dent. 2018;10:287–296. doi:10.2147/CCIDE.S184660
6. Tauböck T, Thomas A, Garoushi S, Vallittu P, Shinya A, Lassila L. Bulk-fill resin composites: an update. Swiss Dent J. 2016;126:812–813.
7. Pfeifer CS. Polymer-based direct filling materials. Dent Clin North AM. 2017;61:733–750. doi:10.1016/j.cden.2017.06.002
8. Cidreira Boaro LC, Pereira Lopes D, de Souza ASC, et al. Clinical performance and chemical-physical properties of bulk fill composites resin —a systematic review and meta-analysis. Dent Mater. 2019;35(10):e249–64. doi:10.1016/j.dental.2019.07.007
9. Veloso SRM, Lemos CAA, de Moraes SLD, et al. Clinical performance of bulk-fill and conventional resin composite restorations in posterior teeth: a systematic review and meta-analysis. Clin Oral Invest. 2019;23:221–233. doi:10.1007/s00784-018-2429-7
10. Arbildo-Vega HI, Lapinska B, Panda S, Lamas-Lara C, Khan AS, Lukomska-Szymanska M. Clinical effectiveness of bulk-fill and conventional resin composite restorations: systematic review and meta-analysis. Polymers. 2020;12(8):1786. doi:10.3390/polym12081786
11. Benetti AR, Peutzfeldt A, Asmussen E, Pallesen U, Franco EB. Influence of curing rate on softening in ethanol, degree of conversion, and wear of resin composite. Am J Dent. 2011;24(2):115–118.
12. Durner J, Schrickel K, Watts DC, Ilie N. Determination of homologous distributions of bisEMA dimethacrylates in bulk-fill resin-composites by GC-MS. Dent Mater. 2015;31:473–480. doi:10.1016/j.dental.2015.02.006
13. Garoushi S, Vallitu P, Shinya A, Lassila L. Influence of increment thickness on light transmission, degree of conversion and micro hardness of bulk-fill composites. Odontology. 2016;104(3):291–297. doi:10.1007/s10266-015-0227-0
14. American Dental Association Certification Programs of The Council on dental materials, Intruments and Equipaments. American National Standard Institution/American Dental Association Specification 27 for direct filling resins. Chicago: American National Standards Institution. American Dental Association; 1977.
15. Aguiar FHB, Braceiro ATB, Ambrosano GMB, Lovadino JR. Hardness and diametral tensile strength of a hybrid composite resin polymerized with different modes and immersed in ethanol or distilled water media. Dent Mater. 2005;21:1098–1103. doi:10.1016/j.dental.2004.11.010
16. Baracco B, Perdigão J, Cabrera E, Giráldez I, Ceballos L. Clinical evaluation of a low-shrinkage composite in posterior restorations: one-year results. Oper Dent. 2012;37(2):117–129. doi:10.2341/11-179-C
17. Demarco FF, Corrêa MB, Cenci MS, Moraes RR, Opdam NJ. Longevity of posterior composite restorations: not only a matter of materials. Dent Mater. 2012;28(1):87–101. doi:10.1016/j.dental.2011.09.003
18. Catelan A, Araújo LSN, Silveira BCM, et al. Impacto f the distance of light curing on the degree of conversion and microhardness of a composite resin. Acta Odontol Scand. 2015;73(4):298–301. doi:10.3109/00016357.2014.946965
19. Rueggeberg FA, Giannini M, Arrais CAG, Price RBT. Light curing in dentistry and clinical implications: a literature review. Braz Oral Res. 2017;31(suppl 1):64–91. doi:10.1590/1807-3107bor-2017.vol31.0061
20. Emami N, Sjödahl M, Söderholm KJ. How filler properties, filler fraction, sample thickness and light source affect light attenuation in particulate filled resin composites. Dent Mater. 2005;21(8):721–730. doi:10.1016/j.dental.2005.01.002
21. Pereira R, Lima DANL, Giorgi MCC, Marchi GM, Aguiar FHB. Evaluation of bond strength, nanoleakage, and marginal adaptation of bulk-fill composites submitted to thermomechanical aging. J Adhes Dent. 2019;21(3):255–264. doi:10.3290/j.jad.a42547
22. Technical profile Filtek Z350 XT Universal Restorative System, 3M-ESPE. Available from: http://multimedia.3m.com/mws/media/656233O/perfil-tecnico-filtek-z350-xt.pdf.
23. Ferretti MA, Lins RBE, Soares MGC, Pinto LJH, Martins LRM, Aguiar FHB. Characterization of low-cost Brazilian resin composites submitted to tooth brushing. Braz Oral Res. 2020;35:1–12.
24. Son SA, Park JK, Seo DG, Ko CC, Kwon YH. How light attenuation and filler content affect the microhardness and polymerization shrinkage and translucency of bulk-fill composites? Clin Oral Investig. 2017;21(2):559–565. doi:10.1007/s00784-016-1920-2.
25. Aguiar FH, Andrade KR, Leite Lima DA, Ambrosano GM, Lovadino JR. Influence of light curing and sample thickness on microhardness of a composite resin. Clin Cosmet Investig Dent. 2009;1:21–25. doi:10.2147/ccide.s4863
26. Van Ende A, De Munck J, Lise DP, Van Meerbeek B. Bulk-Fill composites: a review of the current literature. J Adhes Dent. 2017;19:95–109. doi:10.3290/j.jad.a38141
27. Eweis AH, Yap AU, Yahya NA. Comparison of flexural properties of Bulk-fill restorative/flowable composites and their conventional counterparts. Oper Dent. 2020;45(1):41–51. doi:10.2341/18-133-L
28. Technical profile FiltekOne Bulk Fill restorative, 3M-ESPE. Available from: https://multimedia.3m.com/mws/media/1509317O/filtek-one-bulk-fill-technical-profile.pdf.
29. Elshazly TM, Bourauel C, Aboushelib MN, Sherief DI, El-Korashy DI. The polymerization efficiency of a bulk-fill composite based on matrix-modification technology. Restor Dent Endod. 2020;45(3):e32. doi:10.5395/rde.2020.45.e32
30. Habib A, Waly GH. Degree of conversion and class II cavity microleakage of different bulk-fill composites places with different restorative techniques. Fut Dent J. 2018;4:231–238. doi:10.1016/j.fdj.2018.06.003
31. Tamareselvy K, Rueggeberg FA. Dynamic mechanical analysis of two crosslinked systems. Dent Mater. 1994;10:290–297. doi:10.1016/0109-5641(94)90036-1
32. Rizzante FAP, Mondelli RFL, Furuse AY, Borges AFS, Mendonça G, Ishikiriama SK. Shrinkage stress and elastic modulus assessment of bulk-fill composites. J Appl Oral Sci. 2019;27:e20180132. doi:10.1590/1678-7757-2018-0132
33. Fronza BM, Rueggeber FA, Braga RR, et al. Monomer conversion, microhardness, internal marginal adaptation, and shrinkage stress of bulk-fill resin composites. Dent Mater. 2015;31(12):1542–1551. doi:10.1016/j.dental.2015.10.001
34. Moharan LM, El-Hoshy AZ, Abou-Elemeim K. The effect of different insertion techniques on the depth of cure and Vickers surface microhardness of two bulk-fill resin composite materials. J Clin Exp Dent. 2017;9(2):e266–71. doi:10.4317/jced.53356
35. Rocha MG, Oliveira DCRS, Correa IC, et al. Light-emitting diode beam profile and spectral output influence on the degree of conversion of Bulk Fill composites. Oper Dent. 2017;42(4):418–427. doi:10.2341/16-164-L
36. Karadas M, Hatipoğlu Ö, Er H, Turumtay EA. Influence of different light-curing units on monomer elution from bulk fill composites. J Adhes Sci Tech. 2018;33(1):2631–2646. doi:10.1080/01694243.2018.1499320
37. Hirata R, Pacheco RR, Caceres E, et al. Effect of sonic resin composite delivery on void formation assessed by micro-computed tomography. Oper Dent. 2018;43(2):144–150. doi:10.2341/16-331-L
38. Pratap B, Gupta RK, Bhardwaj B, Nag M. Resin based restorative dental materials: characteristics and future perspectives. Jpn Dent Sci Rev. 2019;55(1):126–138. doi:10.1016/j.jdsr.2019.09.004
39. Alger MSM. Polymer Science Dictionary.
 © 2022 The Author(s). This work is published and licensed by Dove Medical Press Limited. The
full terms of this license are available at https://www.dovepress.com/terms
and incorporate the Creative Commons Attribution
- Non Commercial (unported, 3.0) License.
By accessing the work you hereby accept the Terms. Non-commercial uses of the work are permitted
without any further permission from Dove Medical Press Limited, provided the work is properly
attributed. For permission for commercial use of this work, please see paragraphs 4.2 and 5 of our Terms.
© 2022 The Author(s). This work is published and licensed by Dove Medical Press Limited. The
full terms of this license are available at https://www.dovepress.com/terms
and incorporate the Creative Commons Attribution
- Non Commercial (unported, 3.0) License.
By accessing the work you hereby accept the Terms. Non-commercial uses of the work are permitted
without any further permission from Dove Medical Press Limited, provided the work is properly
attributed. For permission for commercial use of this work, please see paragraphs 4.2 and 5 of our Terms.