Back to Journals » Infection and Drug Resistance » Volume 14
Comparative Assessment of Different PCR-Based Typing Methods of Pseudomonas aeruginosa Isolates
Authors Abdel-Rhman SH ![]() , Rizk DE
, Rizk DE ![]()
Received 23 December 2020
Accepted for publication 20 February 2021
Published 17 March 2021 Volume 2021:14 Pages 1019—1035
DOI https://doi.org/10.2147/IDR.S298838
Checked for plagiarism Yes
Review by Single anonymous peer review
Peer reviewer comments 5
Editor who approved publication: Dr Sahil Khanna
Shaymaa H Abdel-Rhman, 1, 2 Dina E Rizk 1
1Department of Microbiology and Immunology, Faculty of Pharmacy, Mansoura University, Mansoura, Egypt; 2Department of Pharmaceutics and Pharmaceutical Biotechnology, Faculty of Pharmacy, Taibah University, AlMadinah Al Munawwarah, Saudi Arabia
Correspondence: Dina E Rizk
Microbiology & Immunology Department, Faculty of Pharmacy, Mansoura University, Mansoura, 35516, Egypt
Tel +201002605440
Fax +20502247496
Email [email protected]
Introduction: Pseudomonas aeruginosa is one of the important causes of nosocomial infections. Analyzing the diversity of these isolates is important to control the diseases caused by them. Studies of molecular epidemiology depend on the application of typing methods.
Purpose: This study aims to assess the performance of PCR- based typing techniques (RAPD, ribotyping, tDNA, and ERIC) in determining the genetic diversity of 44 P. aeruginosa urinary isolates.
Methods: Performance parameters were analyzed for each of the tested methods. The banding pattern was assessed by calculating polymorphism, genotypic gene diversity and the effective multiplex ratio. Moreover, strain diversity, typeability, and discriminatory power were used to measure the efficiency of typing methods. The congruence among typing methods was calculated by Rand’s and Wallace coefficients.
Results: P-640 among RAPD primers and Ribo-2 among ribotyping primers were more informative as they gave high strain diversity, the highest number of clusters, and highest discriminatory power (ISD=70.45%, 29 clusters at 70% cutoff, DI=0.97 and ISD=75%, 25 clusters at 70% cutoff DI=0.969, respectively). Comparison of typing methods showed that RAPD-PCR gave the highest mean percent polymorphism per assay (76.85%) followed by ERIC-PCR. ERIC-PCR outperformed in most marker parameters; highest mean number of alleles, number of monomorphic bands per assay unit, mean genotypic gene diversity, effective multiplex ratio, and assay efficiency index. Calculated congruence revealed that individual methods demonstrate moderate to poor predictive power. Interestingly, this power increased by combining data obtained from another method.
Conclusion: RAPD primer (P-640) had more discrimination power followed by ribo-2 and ERIC. The performance and predictive power of typing methods can be improved by combining data obtained from different methods as ERIC+OPA-02 and ERIC+P-640 combinations gave complete typeability and discrimination of isolates. ERIC, ERIC+OPA-02, and ERIC+P-640 combinations can provide finer discrimination and classification of P. aeruginosa strains than the other tested methods.
Keywords: P. aeruginosa, PCR-based molecular typing, discrimination power, typeability, congruence
Introduction
P. aeruginosa is a Gram-negative bacillus. It is one of the most important Gram-negative bacteria causing nosocomial infections. In most cases, it is resistant to antibiotics and associated with a high mortality rate. It represents around 10% of urinary tract infections and accounts for about 35% of mortality due to bacteremia.1,2
Bacterial strain typing is significant for diagnosis, treatment, and epidemiological surveillance of bacterial infections.3 Bacterial typing can be divided into conventional epidemiological typing and DNA-based typing methods. Conventional epidemiological typing methods include antibiogram, phage typing, and serotyping.4 While DNA-based typing methods include many techniques as restriction endonucleases of genomic and plasmid DNA, southern hybridization, pulsed gel electrophoresis (PFGE), PCR-based methods for plasmid and chromosomal profiling, microarray, and the last revolution, whole-genome sequencing.5,6
PCR-based typing relies on the amplification of a tiny amount of specific DNA sequence. It includes different methods: PCR-RFLP, PCR-ribotyping, randomly amplified polymorphic DNA (RAPD), repetitive extragenic palindromic (Rep)-PCR, enterobacterial repetitive intergenic consensus (ERIC)-PCR, and PCR sequencing.7
RAPD is known as arbitrary primed PCR (AP-PCR) as it amplifies ambiguous regions of the genome. The primers used are short in length (about 10 bp). The discrimination power of RAPD depends on the number and sequence of the primers used and the amplification conditions.8
ERIC-PCR fingerprinting targets highly conserved central inverted repeats of 126 bp located in extragenic regions of bacterial genomes. The position of these regions differs between species and strains, so they are considered genetic markers,5,9 ERIC-PCR is an advantageous and fast method; thus it is paralleled with other PCR techniques.6
PCR-ribotyping is a technique used to detect polymorphism in intergenic regions of rRNA or tRNA. Intergenic spacer regions (ISRs) are exposed to inferior evolutionary pressure and thus demonstrate broader genetic variations that hang on the number and type of tRNA genes between 23S and 16S sequences. Two PCR-based methods are used for identifying these ISRs. The first method; PCR-ribotyping which is used for identification and discrimination between bacterial strains and species utilizing primers that amplify the sequences between 16S and 23S genes. The second technique is tDNA-PCR which amplifies intergenic spacers between tRNA genes. These genes are conserved and present in several copies along the bacterial genome. Besides, they are grouped and disconnected by spacers whose length and sequences are subjected to great variation.10
Assessment of the efficiency of the typing method depends on several factors such as typeability and discrimination. Typeability is simply the percentage of bacterial isolates that can be positively typed by the typing marker.11 The discriminatory power of a typing method can be estimated by the number of types obtained by this method and their relative frequencies.12 It can be expressed by discrimination index (DI) which can be defined as the probability that two random isolates from the test population are distinguished into different typing groups.5,11,12
An important characteristic for an ideal marker is high polymorphism with consistent distribution within the genome. In addition, it should give an adequate resolution of genetic differences. The efficiency of molecular markers can be evaluated in assessing genetic diversity by measuring various parameters. The number of total alleles, allele range, % polymorphism, effective multiplex ratio, assay efficiency index (AEI), and index of strain diversity are performance parameters that can estimate the discriminatory power of the typing methods.13 Welsh and McClelland show that comparing polymorphisms in genomic fingerprints can distinguish strains.14
The correspondence between typing methods can be assessed quantitatively by calculating two coefficients, Rand (R) and Wallace (W) coefficients. They are used to explore the concordance between typing methods. The value of the W coefficient indicates the probability that two strains are classified as the same type by either of the two methods. This indicates that results obtained by one method can be predicted by the other method.15
The present work aims to compare the efficiency of different PCR-based typing methods (RAPD, ribotyping, tDNA, and ERIC) to discriminate between strains of P. aeruginosa isolated from UTIs. Moreover, the concordance of different typing methods and their combinations was evaluated.
Materials and Methods
Bacterial Isolates
Forty-four P. aeruginosa isolates were cultured from urine samples obtained from patients at Urology and Nephrology Center, Mansoura University, Egypt.
Isolates were selected based on their colony morphology on Pseudomonas isolation agar (Oxoid). All isolates were confirmed as P. aeruginosa using the VITEK 2 system (bioMerieux, Marcy I’Etoile, France) using P. aeruginosa (Schroeter) Migula (ATCC 27853) as a quality control strain. Confirmed isolates were stored at −80°C for further studies.
This research was approved by the ethics committee of the faculty of Pharmacy, Mansoura University (code 2020–127). Isolates were a part of the routine hospital laboratory procedure.
Isolation of Bacterial DNA
Genomic DNA was obtained by the modified boiling method of Englen and Kelley.16 Briefly, pure bacterial colonies were mixed with 100µL DNase/RNase‐free water and the suspension was held at 95 ͦ C for 10 min. The lysate was centrifuged and transferred to a new Eppendorf and used as a template DNA.
PCR-Based Typing
RAPD typing was carried out using six primers: D-10514,17,18 D-14306,17 OP-13,19,20 P-640,16,21 OPA-02,22 and AP3.23,24 PCR ribotyping was done using three sets of universal primers: Ribo-1,25 Ribo-2,26 and Ribo-3.10 ERIC-PCR-reaction was performed using the sequences ERIC1 and ERIC2.27 The tDNA-PCR amplified ISRs between the tRNA genes using the conserved primers T5A and T3B.10 The primers’ sequences were illustrated in Table 1. All primers were obtained from Invitrogen (Thermo Scientific). The amplifications were performed in the thermocycler machine (Model TC96K, AccuLab®, USA). The temperature profile and the PCR conditions were conducted as described previously for each primer. The PCR products of all typing methods were electrophoresed in 1.5% agarose gel with the DNA molecular weight marker (GeneRuler 100 bp Plus DNA Ladder, Thermo Scientific) and visualized in a gel documentation system (Model Gel Doc 1.4, 1189; AccuLab®). DNA fingerprints were recorded and compared visually.
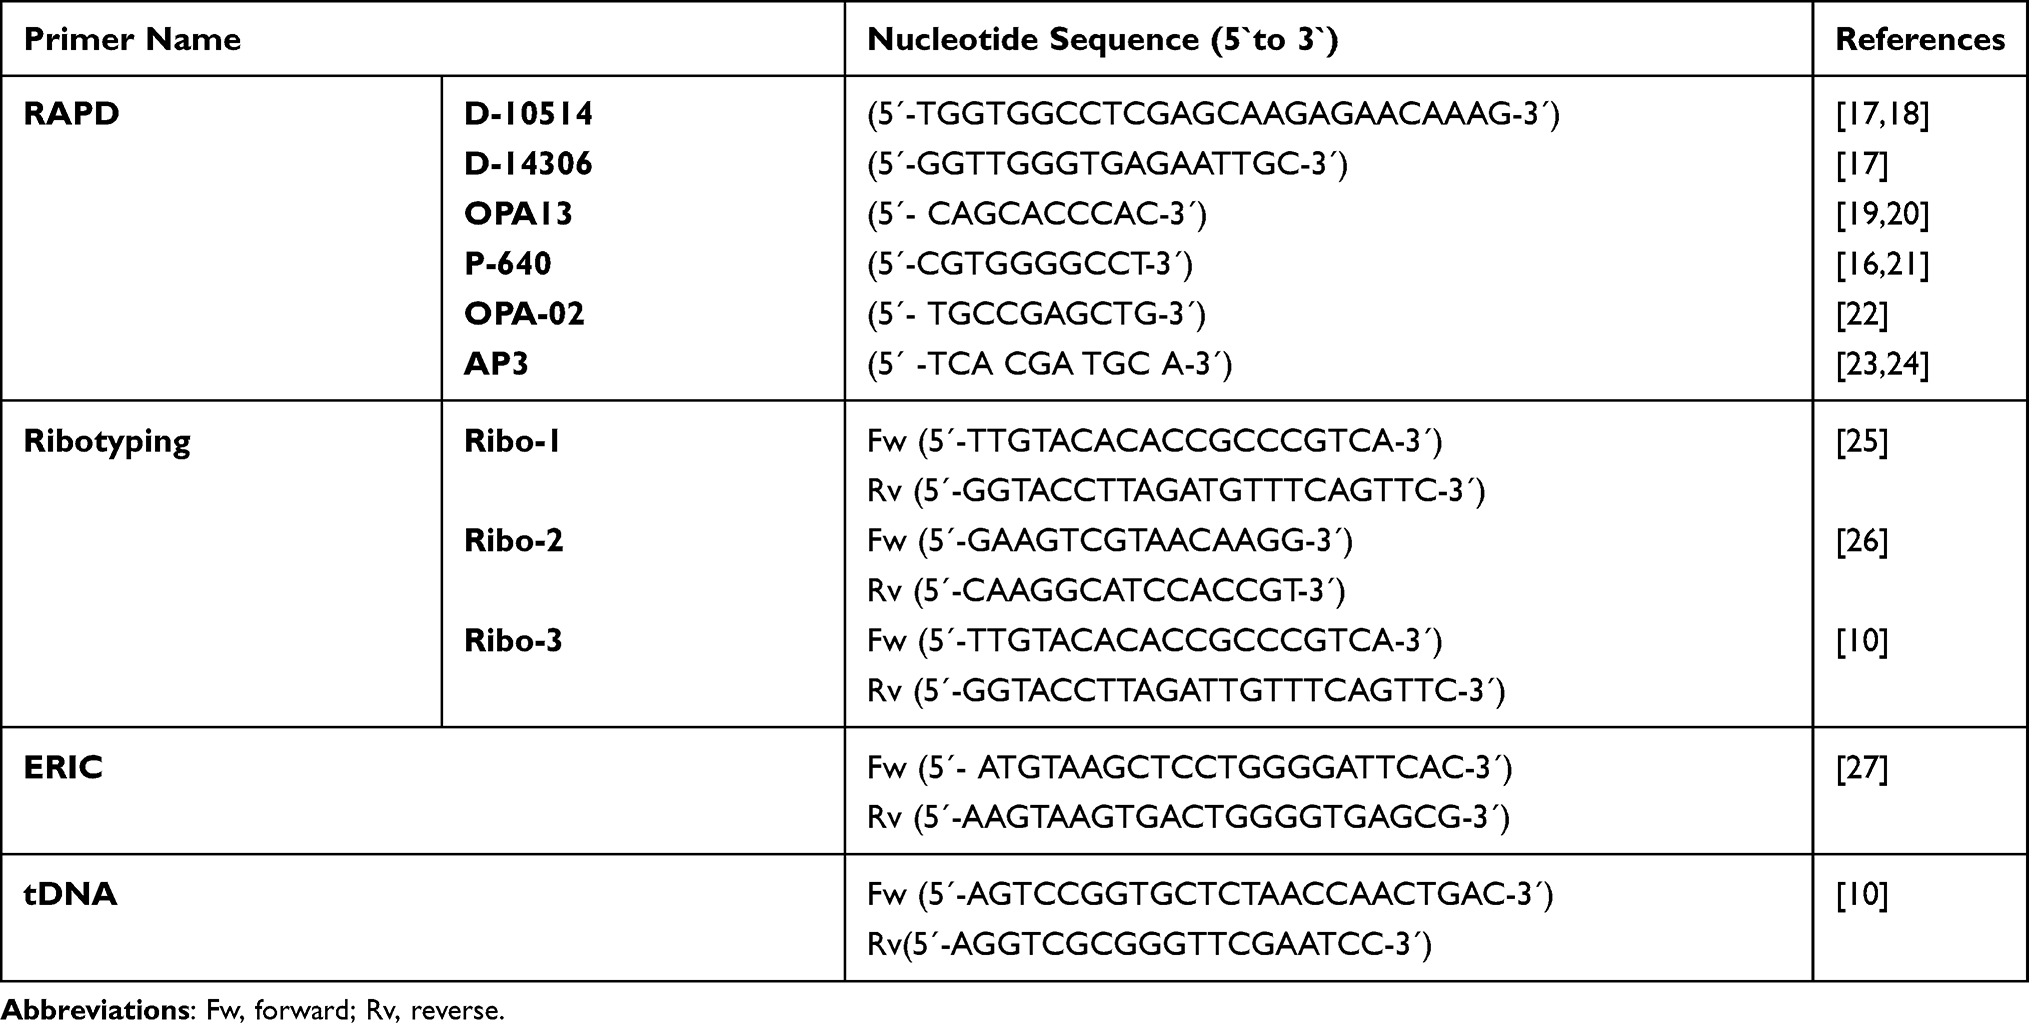 |
Table 1 Sequence of the Primers Used in This Study |
Data Analysis
For data analysis, each band with a different size was assigned and marked by a binary system (1 for presence and 0 for the absence of band of a specific molecular weight). The banding patterns produced by the different tested markers were analyzed by constructing a dendrogram using the unweighted pair group method with arithmetic mean (UPGMA) to determine the relatedness between isolates using the Dice coefficient, with the program DendoUPGMA [Univertat Rovirai Virgili (URV), Tarragona, Spain].
The polymorphism percentage (PM%), monomorphism percentage (MM%) were calculated for each typing system.28 Genotypic gene diversity (Hg) was calculated as described earlier28,29 by the following equation:
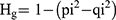
where pi (pi = 1-qi) refers to the frequency of the dominant allele and qi represents the frequency of the null allele (ie the number of isolates without the band).
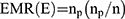
The effective Multiplex Ratio (EMR) is the product of the fraction of polymorphic bands and the number of polymorphic bands for an individual assay where np is the number of polymorphic bands and n is the total number of bands. It was calculated according to the equation:28
In addition, the assay efficiency index (AEI = Polymorphic bands/Total number of primers)28 of each typing method was calculated.
To determine the index of strain diversity (ISD), that measured as the frequency of diverse genotypes, the following equation was used.30

The typeability of each typing method was calculated as the percentage of isolates that can be typed among the tested ones.13,31 For the discriminatory power of each typing method, it was assessed by calculating the discriminatory index (DI) according to the following Simpson’s equation:31

Where N: the total number of isolates, S: the total number of types, nj: the number of isolates belonging to the jth type, and Non-typeable isolates were gathered into one group (untypeable group).
Calculation of the concordance of different typing methods and their combinations was done by the software described by Carrico et al,32 where Rand’s (R) and adjusted Wallace’s coefficients (W) were calculated.
Results
In the present study, the genetic diversity of 44 P. aeruginosa isolates was assessed using RAPD, ribotyping, tDNA, and ERIC typing techniques. The banding patterns were scored and were designed by a numeral for each primer.
RAPD Analysis
Among the 44 tested isolates, the typeability ranged from 70.5% to 97.7% (Table 2). RAPD-PCR typed 43 isolates by primer D-14306 and OP-13 (typeability 97.7%). Thirteen isolates were untypable by AP3 primer (typeability 70.5%). P-640 primer gave the highest strain diversity (ISD=70.45%), while D-14306 was the least marker in differentiating isolates (ISD=29.54%).
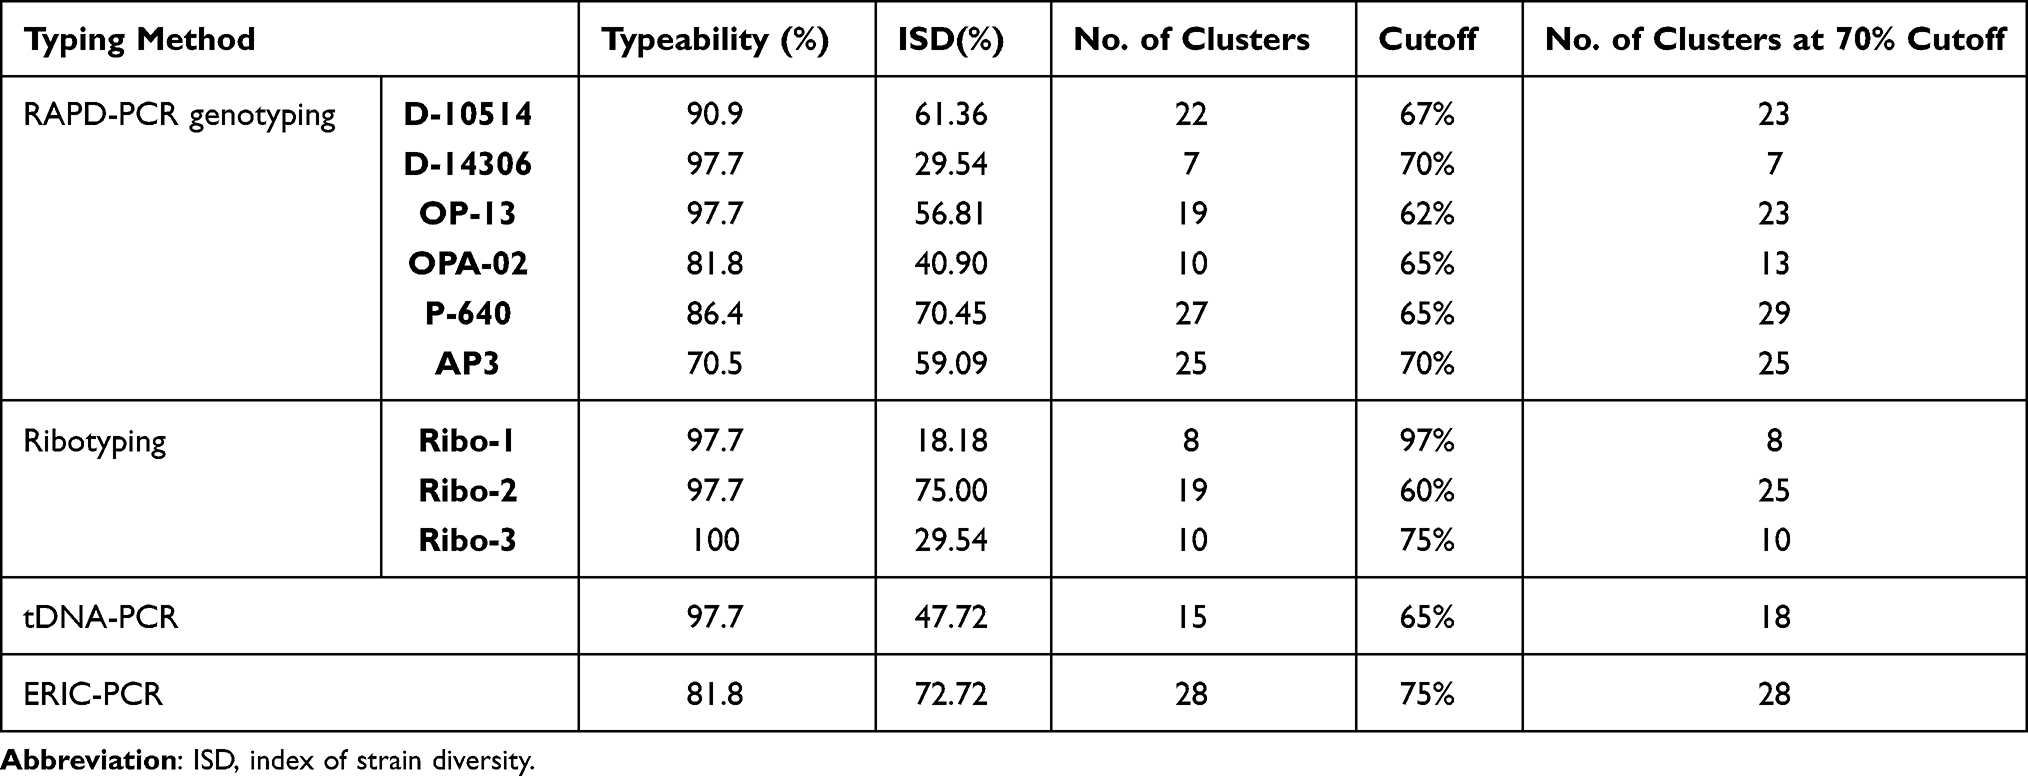 |
Table 2 Typeability, Index of Strain Diversity, and Cluster Analysis of 44 P. aeruginosa Strains Using Different PCR-Based Typing Methods |
Amplification using primer D-10514 yielded 27 genotypes through amplifying 15 bands ranging from 150 bp to 2000 bp. It clustered the isolates into 22 clusters at 67% cutoff. At cutoff 72%, two clusters could be further subdivided into two groups. One of these clusters was subdivided into three groups at 77% cutoff and into four groups at 80% cutoff. Six clusters were found to contain isolates with 100% similarity (Figure 1A).
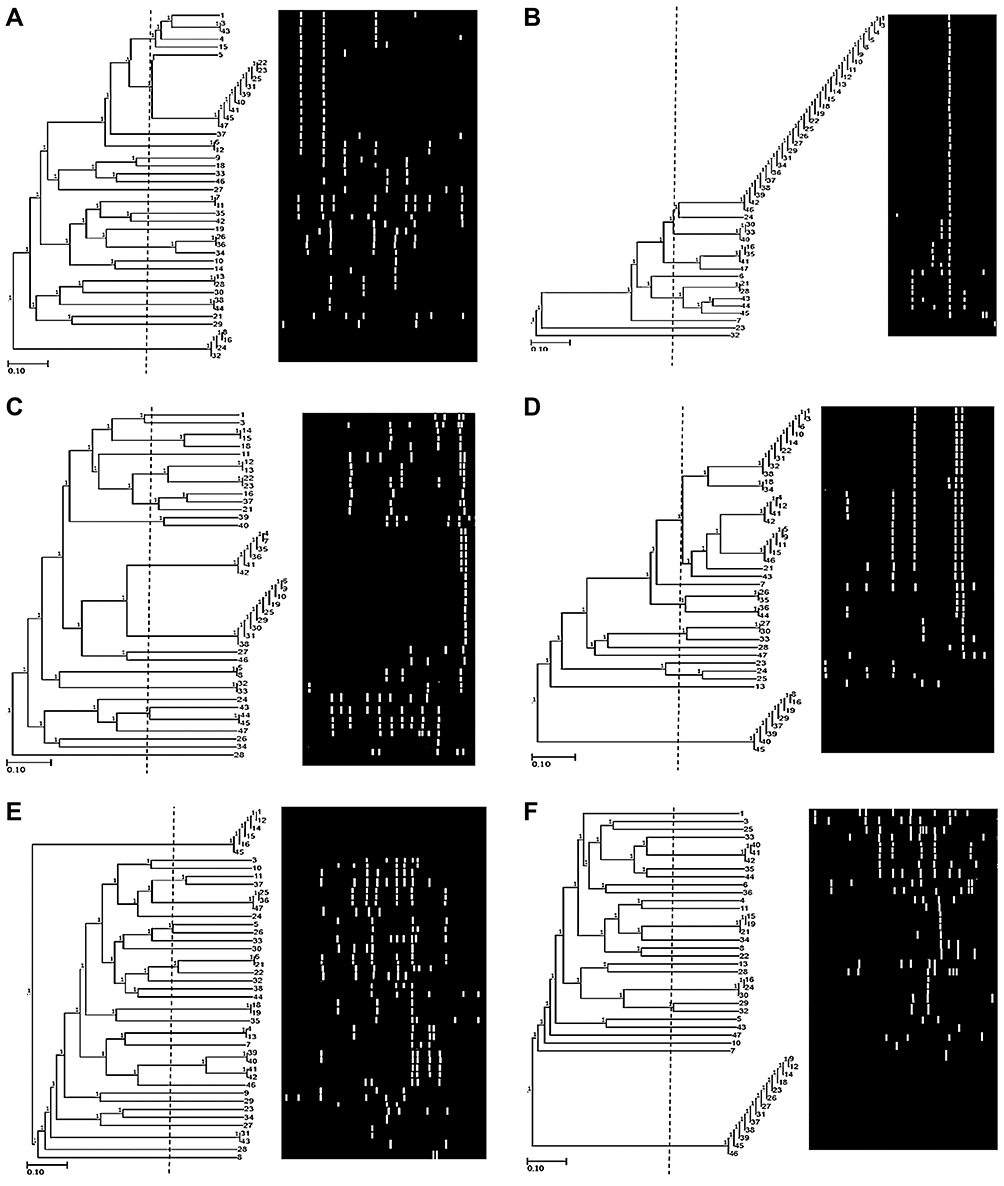 |
Figure 1 Dendrogram of 44 P. aeruginosa isolates using UPGMA algorithm and Dice coefficient for D-10514 primer (A), D-14603 primer (B), OP-13 primer (C), OPA-02 primer(D), P-640 primer (E), and AP3 (F). Patterns are schematically represented. |
Primer D-14306 generated 13 genotypes by amplifying 10 bands ranging approximately from 500 bp to 2000 bp. It classified the isolates into 7 clusters at 70% cutoff where they grouped them into 10 clusters at 83% cutoff, 12 clusters at 90% cutoff, and 13 clusters at 97% cutoff. Cluster No. one comprised the highest number of isolates (27) with 100% similarity. Three isolates were different at all levels of similarity (Figure 1B).
OP-13 and OPA-02 primers generated 25 genotypes (22 different bands ranging from 300 bp to 2500 bp) and 18 genotypes (12 bands ranging from 300 bp to 2500 bp), respectively (Figure 1C and D). The isolates were classified by OP-13 into 19 clusters at 62% cutoff where they were grouped into 25 clusters at 97% cutoff. Eight Clusters showed 100% similarity between their isolates. On the other hand, OPA-02 classified the isolates into 10, 14, 17, and 18 clusters at 65%, 76%, 83% and 97% cutoff, respectively. Eight Clusters showed 100% similarity between their isolates.
Thirty-one different genotypes were obtained by P-640 primer by amplifying 24 bands ranging from 250 bp to >3000 bp. P-640 primer classified the isolates into 27 clusters at 65% cutoff where they grouped them into 31 clusters at 97% cutoff where four clusters were further subdivided each into two groups. Eight clusters showed 100% similarity between their isolates with cluster No. 1 comprised six isolates (Figure 1E).
AP3 primer gave 26 genotypes with band sizes ranging between 250bp and 3000bp (25 bands). The isolates could be clustered into 25 clusters with two isolates showing similarity at 70% cutoff. Isolates (40, 41 and 42), (15, 19 and 21) and (16, 24 and 30) showed 100% similarity. Cluster No. 25 comprises the highest number of isolates (Figure 1F).
The number of the obtained amplicons in all tested isolates was specific for each of the tested RAPD primers. All tested primers showed PM% ranged between 70% to 86.7%. A number of 82 out of 108 total alleles was polymorphic. AP3 generated a maximum of 25 alleles followed by P-640 primer with 24 alleles. D-14306 generated a minimum of 10 alleles (Table 3).
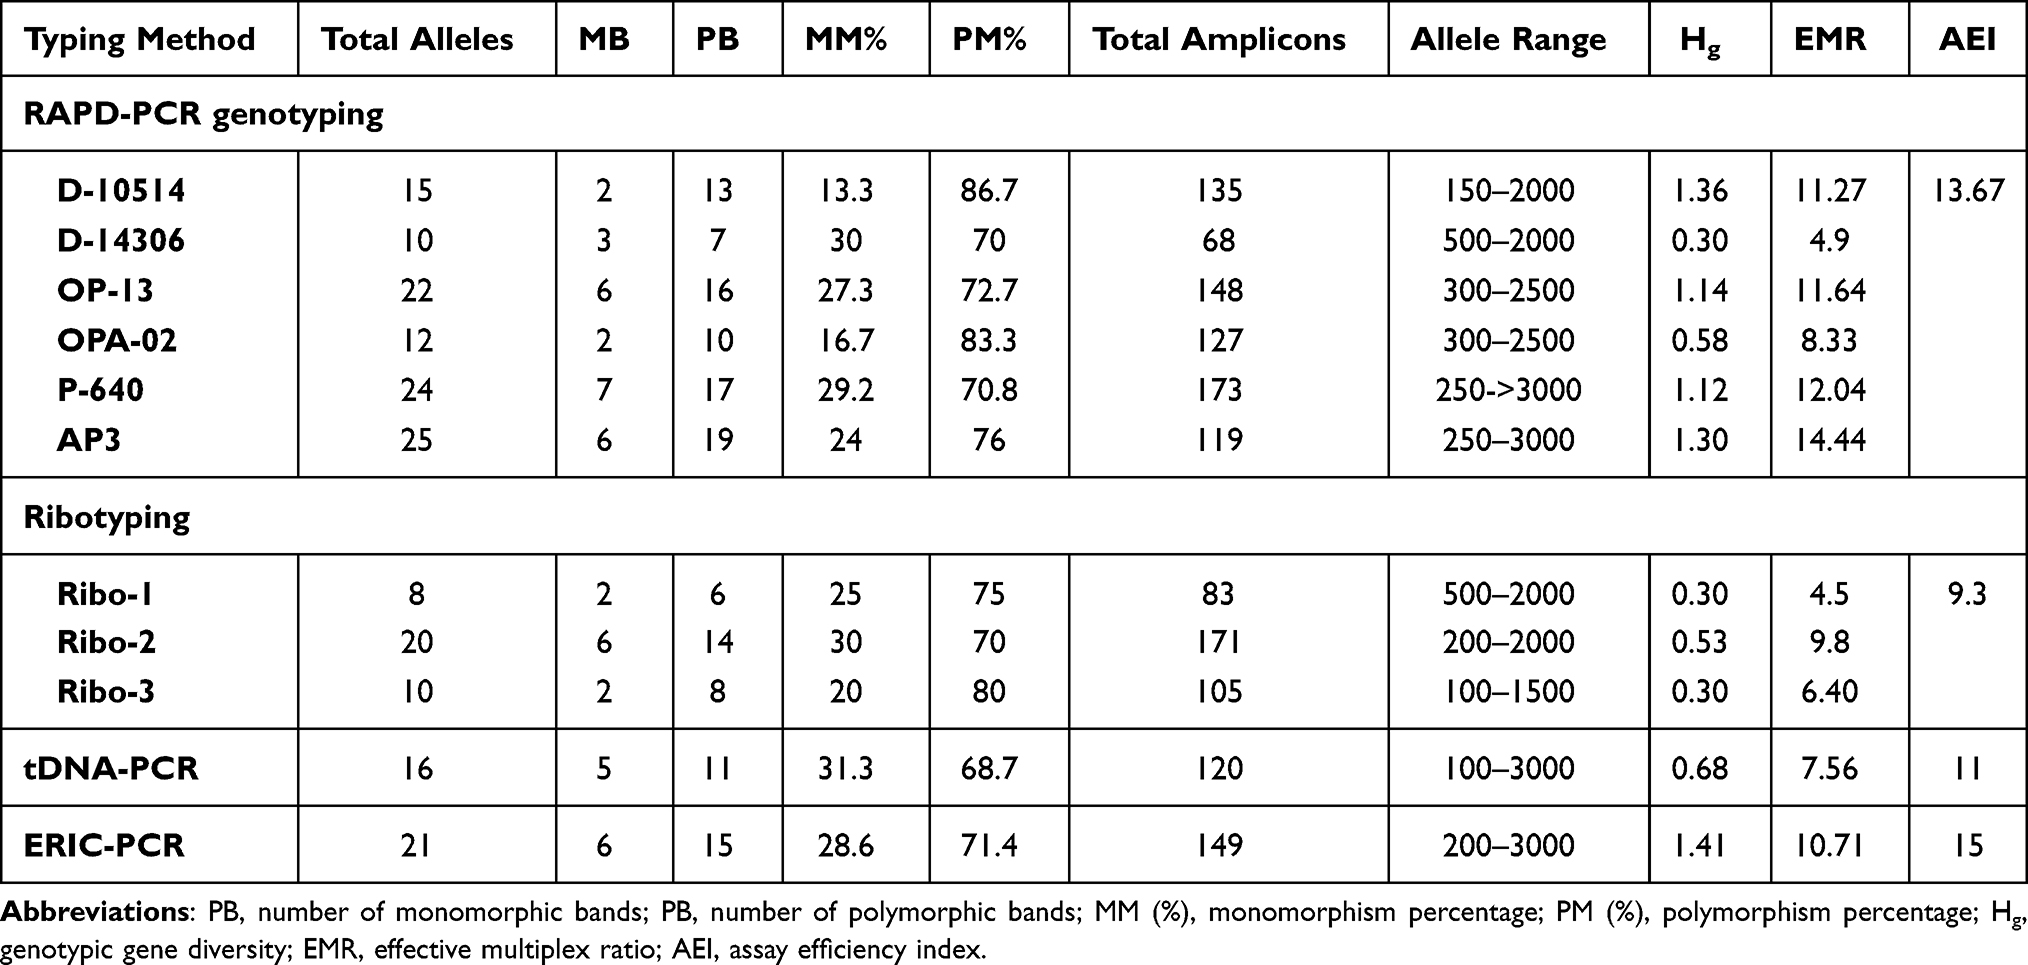 |
Table 3 Polymorphism Detected by the Used PCR-Based Typing Primers |
The calculated EMR ranged between 4.9 and 14.44 (mean EMR=10.44). Gene diversity (Hg) values ranged between 0.3 and 1.36 with an average of 0.97. A total of 770 amplicons were observed and AEI was 13.67. D-14306 primer revealed minimum values of Hg and EMR (Table 3).
PCR Ribotyping
The ribotyping assay was performed using three different markers. Both Ribo-1and Ribo-2 primers typed 43 out of 44 tested isolates (typeability 97.7%). Ribo-3 primer typed all isolates resulting in 100% typeability (Table 2).
Ribo-1 primer distinguished the typable isolates within eight genotypes (ISD=18.18%) through amplifying eight bands (500bp to 2000 bp) (Figure 2A). Ribo-2 primer amplified 20 visible bands (200bp to 2000 bp) resulting in 33 genotypes with high ISD=75.00% (Figure 2B). The third primer (Ribo-3) classified the tested isolates into 13 distinct genotypes with ISD= 29.54% by amplifying 10 different DNA fragments ranging approximately from 100 bp to 1500 bp (Figure 2C).
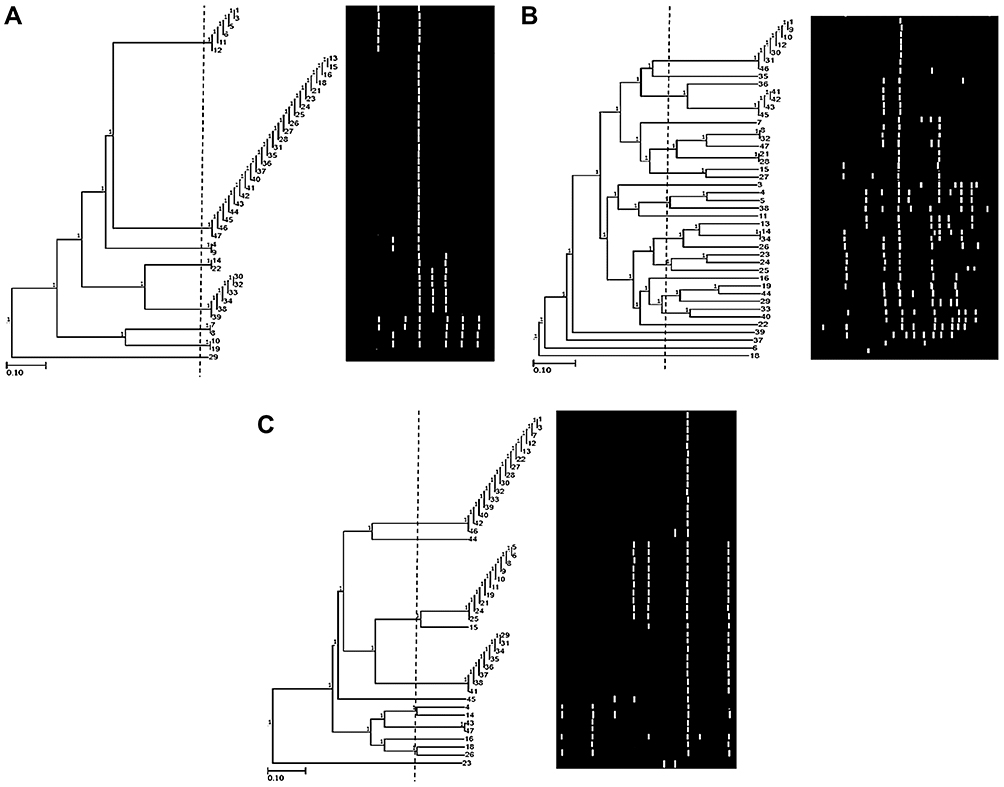 |
Figure 2 Dendrogram of 44 P. aeruginosa isolates using UPGMA algorithm and Dice coefficient for Ribo-1 primer (A), Ribo-2 primer (B), and Ribo-3 primer (C). Patterns are schematically represented. |
Ribo-1 primer showed the highest similarity between isolates where it classified them into 7 clusters at 97% cutoff. Cluster No. 2 contained 23 (52.27%) isolates. Ribo-2 primer classified the isolates into 19 clusters at 60% cutoff while it grouped them into 30 clusters at 80% cutoff where 3 clusters were further subdivided into two groups and four clusters were subdivided into 3 groups. At 97% cutoff, 32 clusters were found, five of them contained isolates with 100% similarity. Ribo-3 primer classified the isolates into 10 clusters at 70% cutoff and 13 clusters at 97% cutoff where 3 clusters were further subdivided into two groups. Isolates of four clusters showed 100% similarity.
Ribotyping revealed a total of 38 alleles, with an average of 12.67 per primer. Twenty-eight alleles were polymorphic resulting in an average of 75% polymorphism. The maximum Hg and EMR were observed with the primer Ribo-2. A total of 359 amplicons were obtained by ribotyping primers and AEI was 9.3 as illustrated in Table 3.
tDNA-PCR
tDNA marker typed 97.7% of isolates. It demonstrated 21 different genotypes with moderate strain diversity (ISD= 47.72%) of isolates by amplifying 16 alleles that ranged from 100 bp to 3000 bp. Among the tested isolates, tDNA amplified 120 amplicons, AEI was 11. The Hg and EMR values were 0.68 and 7.56, respectively (Table 3).
tDNA primer classified the isolates into 15 clusters at 65% cutoff where they grouped them into 18 clusters at 75% cutoff and 20 clusters at 97% cutoff. Isolates of seven clusters showed 100% similarity (Figure 3A).
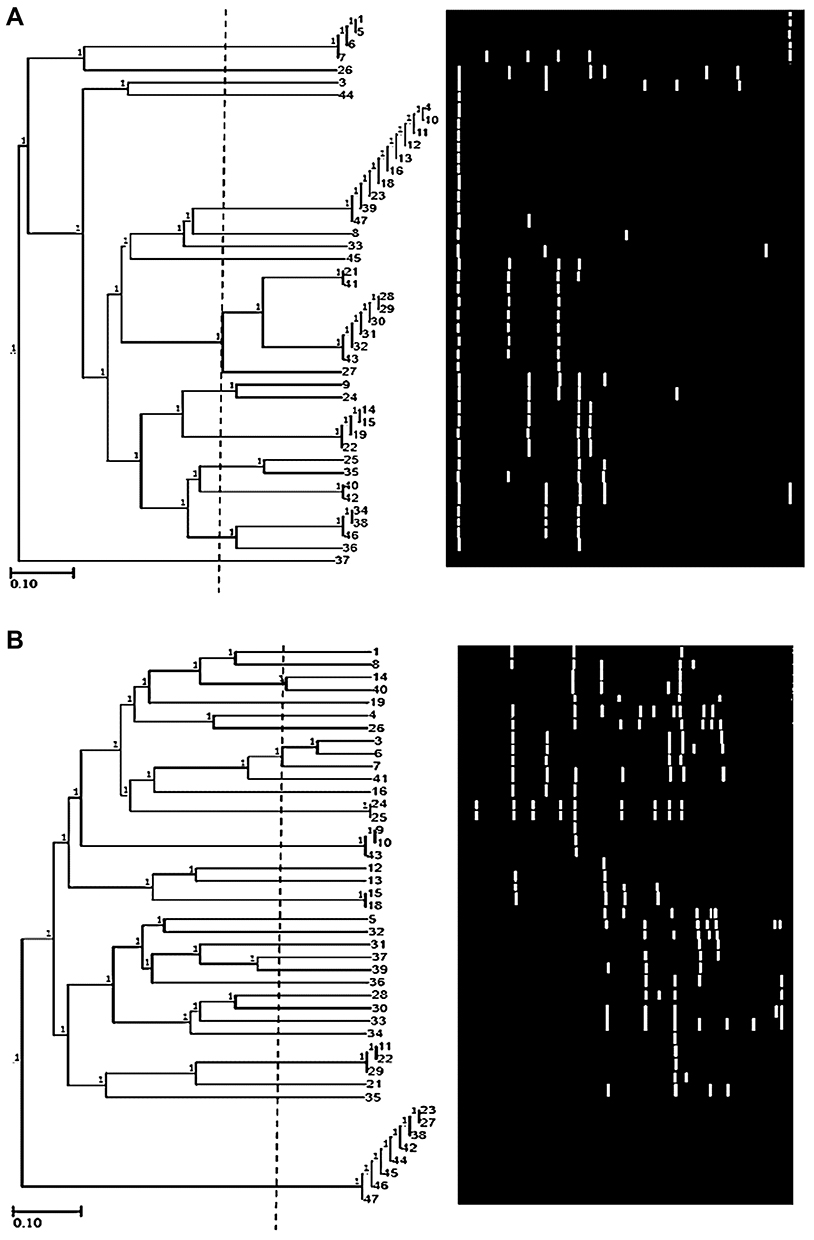 |
Figure 3 Dendrogram of 44 P. aeruginosa isolates using the UPGMA algorithm and Dice coefficient for tDNA-PCR typing (A) and ERIC-PCR typing (B). Patterns are schematically represented. |
ERIC-PCR
The molecular typing using ERIC-PCR generated 21 different alleles (200 bp to 3000 bp) among the 36 typed isolates (Figure 3B), 81.8% typeability (Table 2). Six bands were monomorphic and 15 were polymorphic. The typable isolates were classified into 32 genotypes with ISD= 72.72%. Besides that, EMR was 15.43. A total of 149 amplicons were observed and AEI was 18 (Table 3).
ERIC primer clustered the isolates into 28 clusters at 75% cutoff. Two clusters (No. 3 and 7) could be further subdivided into two and three groups at 87% cutoff, respectively. There was 100% similarity between isolates (24 and 25), (9, 10 and 43), (15 and 18), and (11, 22 and 29). Cluster No.28 contains the highest number (8) of isolates with 97% similarity.
Comparative Analysis of Banding Genotypes Generated by Typing Systems
ERIC marker system showed superior values of the mean number of alleles per assay unit, the number of monomorphic and polymorphic bands per assay unit (21, 6, and 15, respectively) as shown in Table 4. Despite that, a higher percentage of polymorphism was obtained from RAPD analysis (76.85%) as compared to ERIC (71.4%). Moreover, ERIC showed higher values of mean genotypic gene diversity (1.41), EMR (10.71), and AEI (15) followed by RAPD marker system accounting 0.97, 10.44, and 13.67, respectively. The Ribotyping system showed the lowest values of marker parameters; mean number of alleles per assay unit (12.67), number of monomorphic (3.33), and polymorphic bands (9.33) per assay unit, mean genotypic gene diversity (0.38), EMR (6.9). tDNA marker system showed the lowest mean percentage of polymorphism per assay (68.7%) and AEI (11).
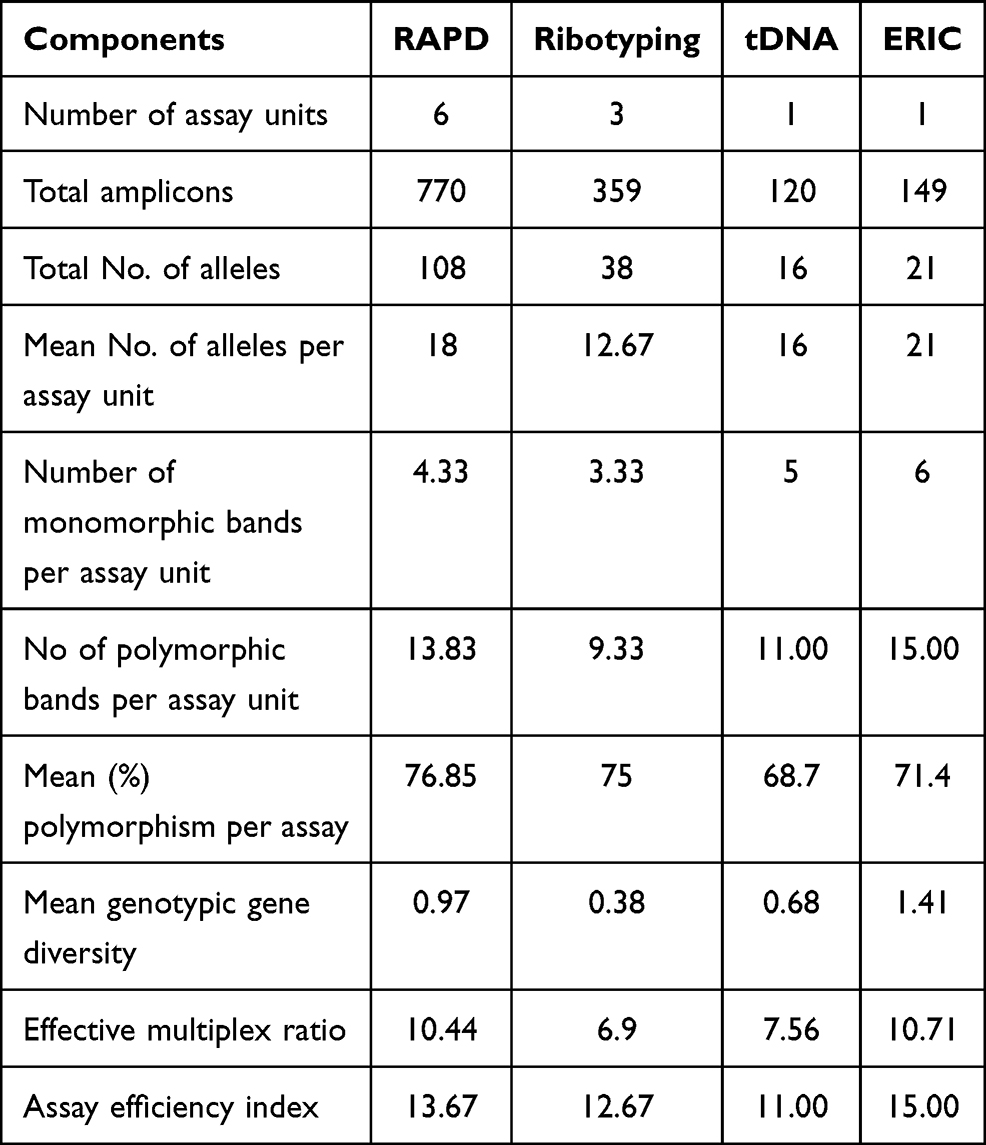 |
Table 4 Comparative Analysis of Banding Genotypes Generated by the Four PCR-Typing Techniques |
Discriminatory Power and Concordance Among Typing Systems
Concerning the discriminatory power, Table 5 shows the discriminatory indices (DIs)of the typing methods using each primer and those of the combination of the methods. The DIs ranged from 0.622 to 0.975. Three primers (P-640, Ribo-2, ERIC) gave DI above the recommended value, 0.95. The highest DI value (0.975) was obtained by using a P-640 primer. The DIs for D-10514 and OP-13 primers were 0.949 and 0.94, respectively. The lowest DI was 0.622 of D-14306 primer, showing poor discriminatory power (Table 5).
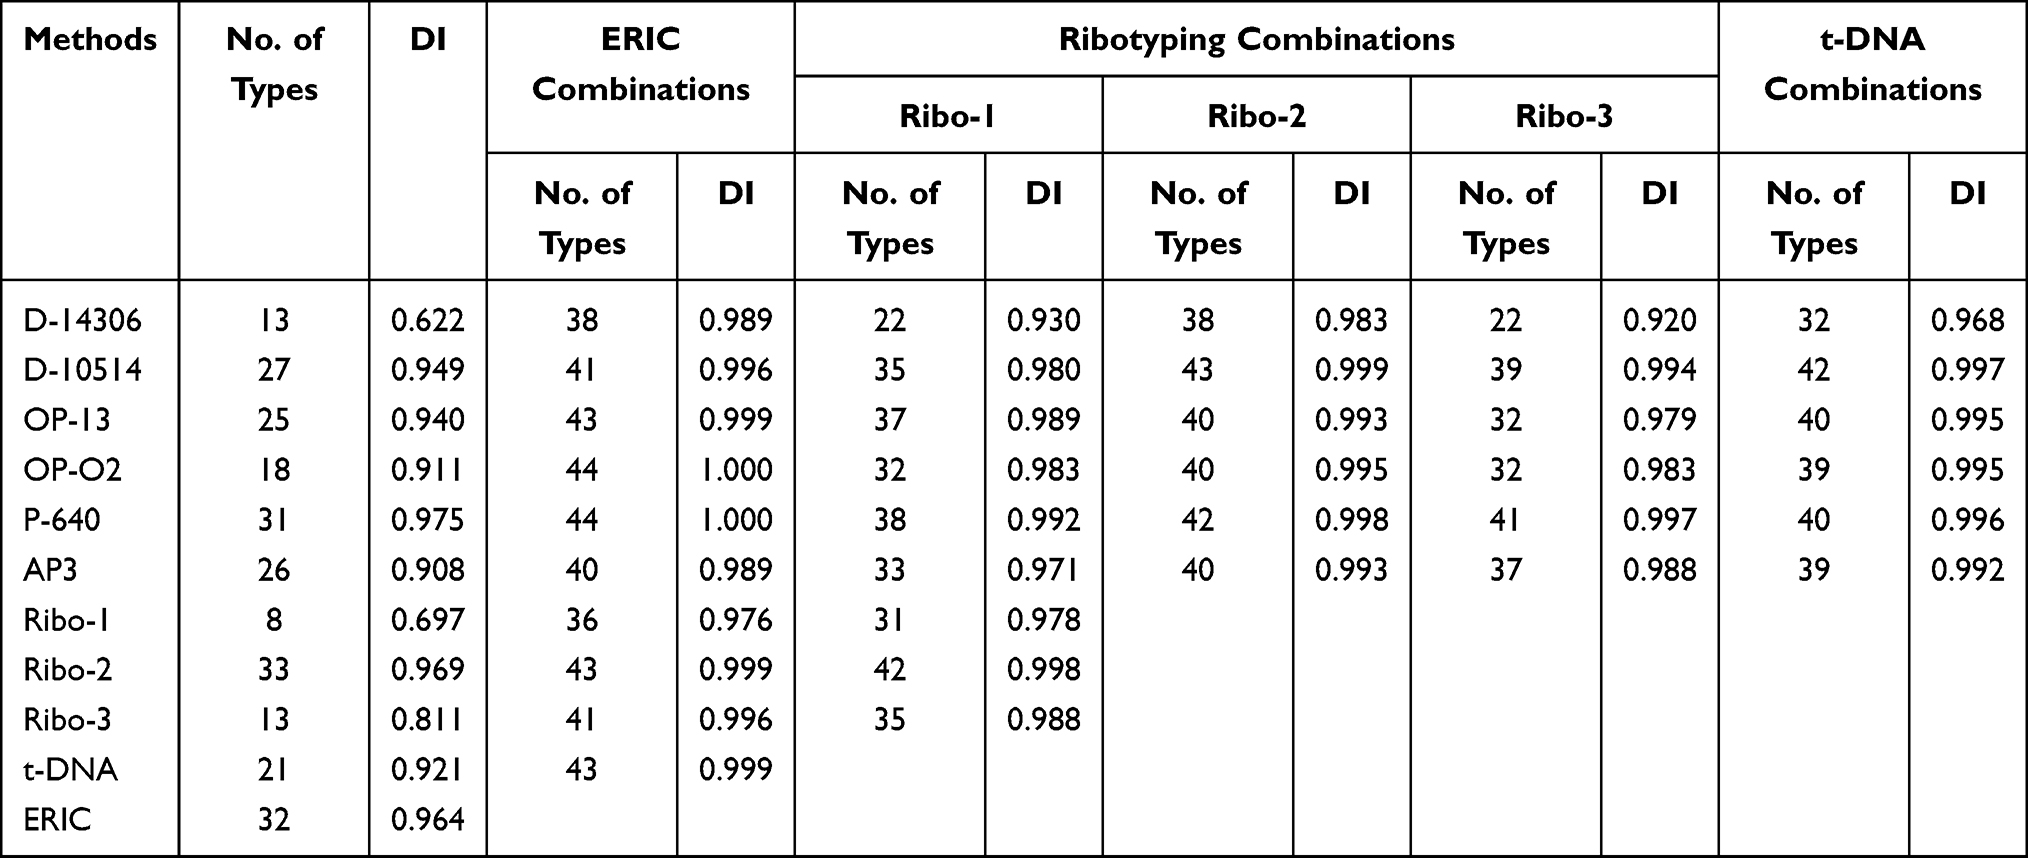 |
Table 5 The Discriminatory Power of the Typing Methods, Apart and in Combination, Evaluated with 44 P. aeruginosa Strains |
The combination of different typing methods noticeably increases the DI values. ERIC highly increases the DI of all typing methods, DI of 1 was achieved with OP-O2+P-640 pair. Also, all ribotyping primers and tDNA increased the DI with the combined typing methods. D-14306 primer that gave the lowest DI alone, revealed higher DI in all combination pairs.
The highest concordance was found between RAPD typing using P-640 primer and ribotyping using Ribo-2 primer calculated by Rand’s coefficient (R= 0.948) (Table 6). Both ERIC and ribotyping using Ribo-2 primer gave high concordance with all typing methods (R= 0.607–0.939 and 0.627–0.948, respectively). Only D-14306 and Ribo-1-types which were moderately predicted by AP3 and ERIC using Wallace coefficient (W= 0.427 and 0.536) with a 95% confidence level (CI), respectively. The other types of all typing methods were poorly predicted by either of these methods (Table 7).
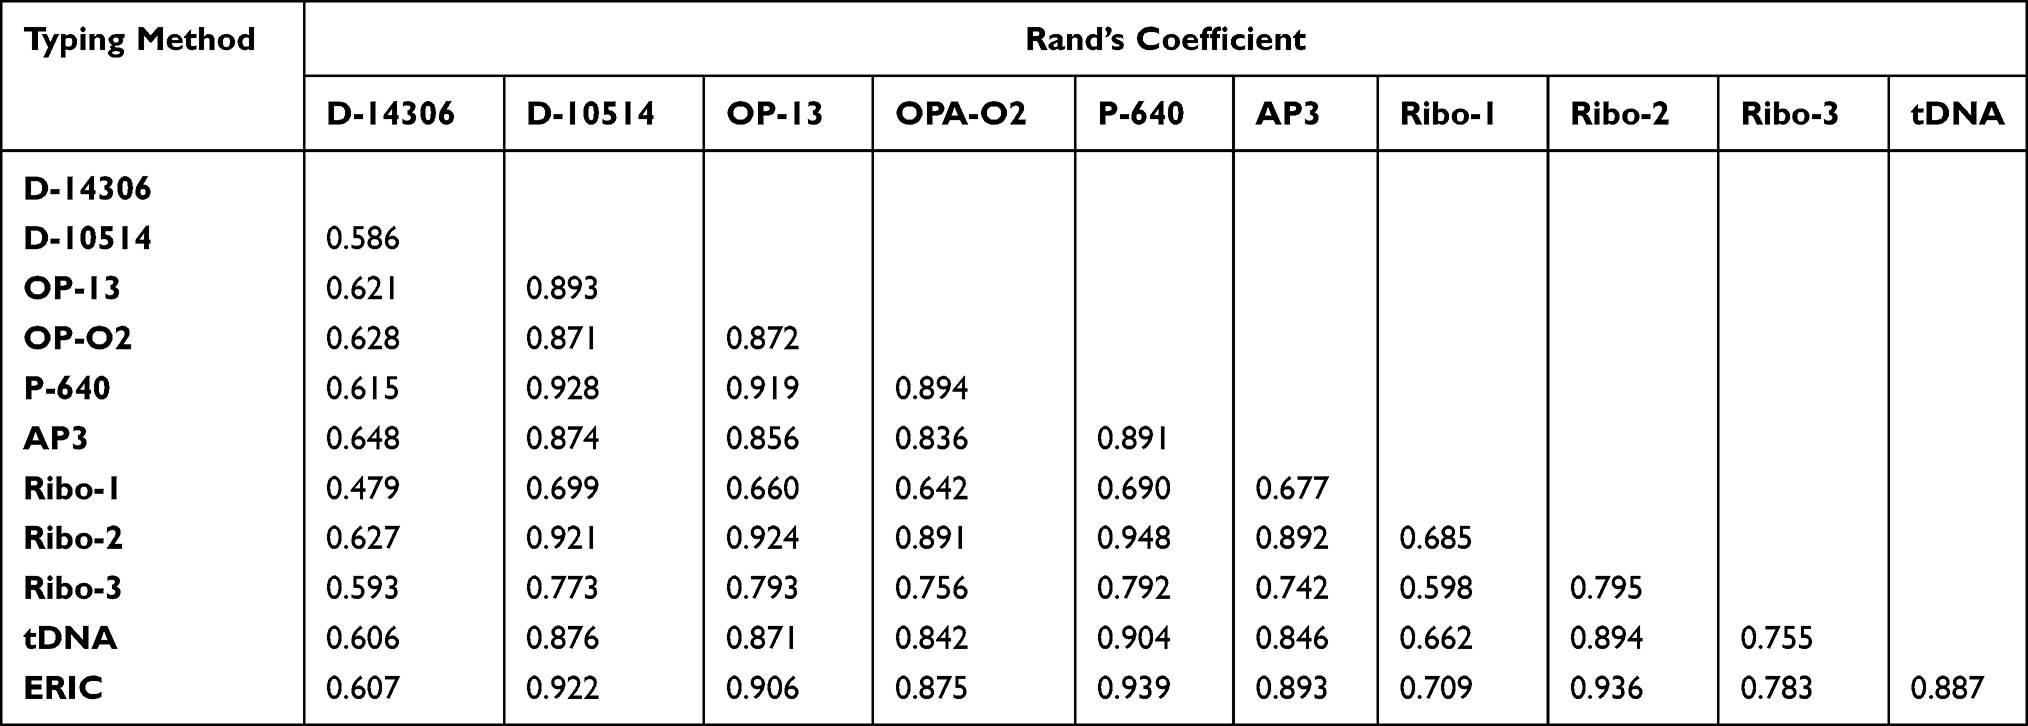 |
Table 6 Concordance Among Typing Methods According to Rand’s Coefficient |
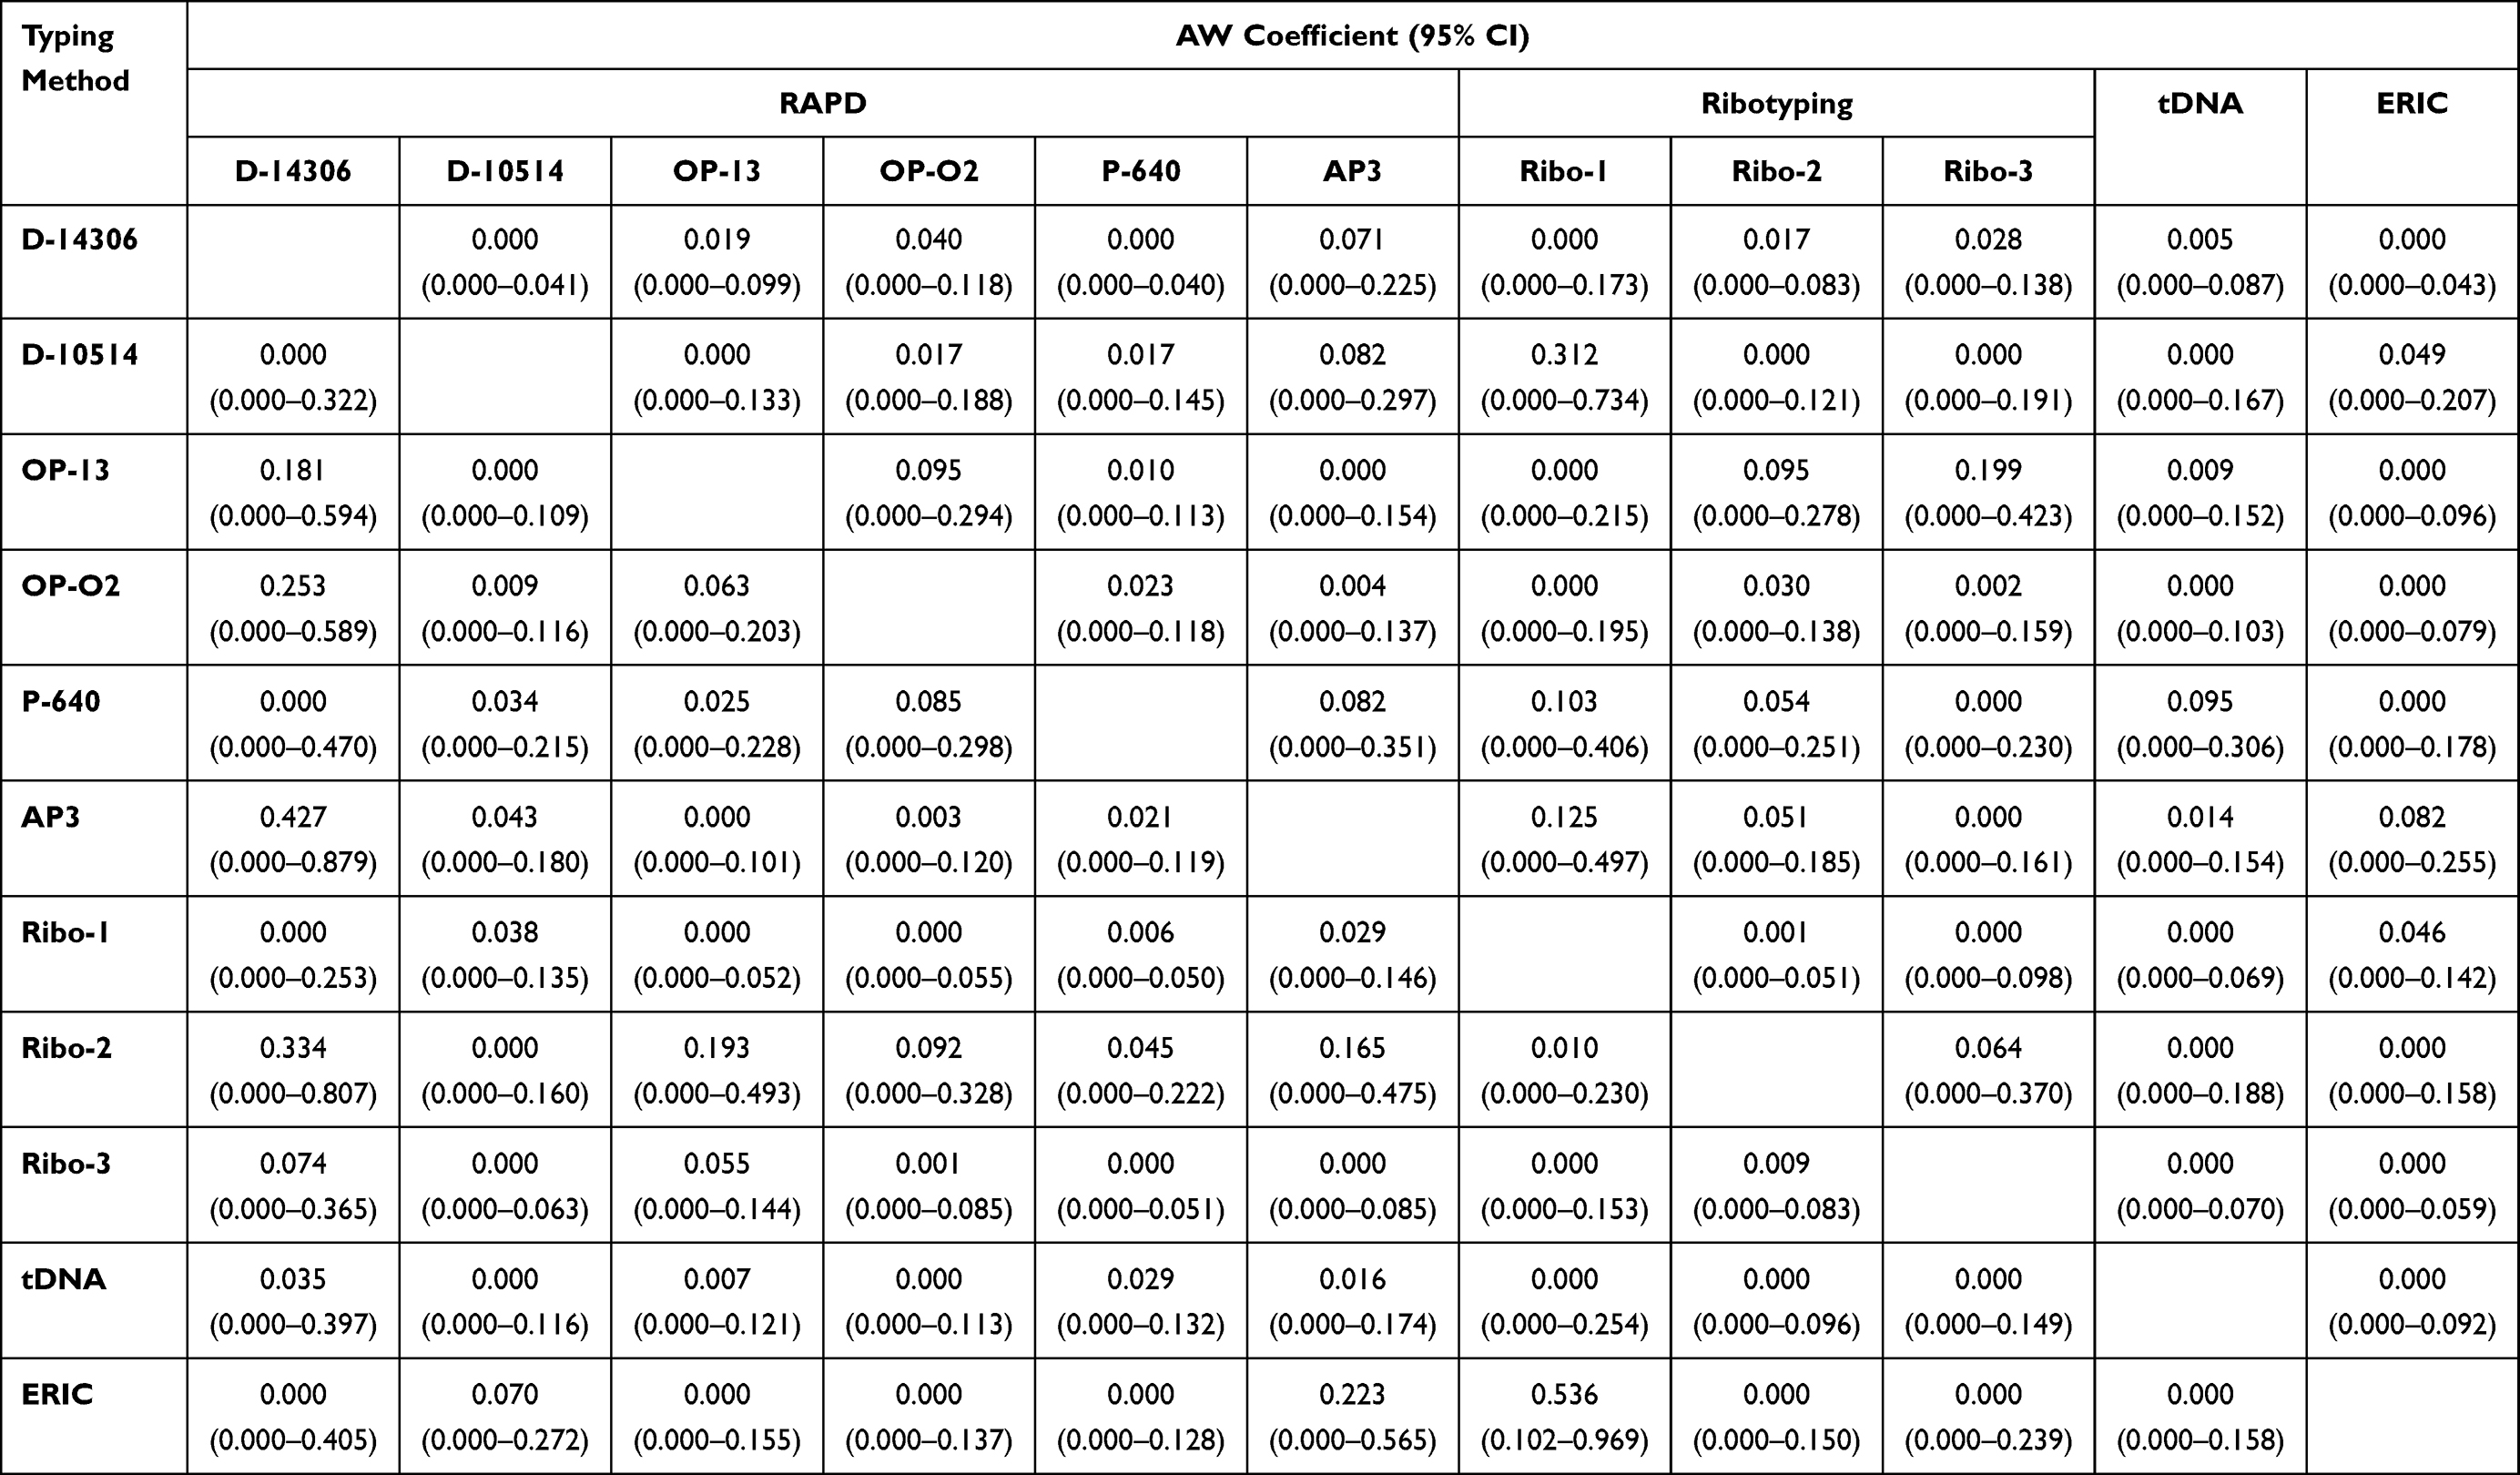 |
Table 7 Wallace’s Coefficient Values Among Typing Methods |
For combinations of typing methods, it was found that concordance highly increased as indicated by the Rand coefficient for all combined pairs. Complete concordance was found between the ERIC+ OPA-O2 pair using the ERIC+P-640 pair (R=1). Increased concordance (R=0.998) was found using tDNA+D-10514 and tDNA+Ribo-2 with tDNA+ERIC, R=0.979 using Ribo-1+OPA-02 with Ribo-1+P-640, R=0.998 in Ribo-2+D-10514 with Ribo-2+ERIC and R=0.993 in Ribo-3+D-10514 with Ribo-3+P-640 and Ribo-3+P-640 with Ribo-3+ERIC (data not shown).
Additionally, ERIC+OPA-02 and ERIC+P-640 pairs were able to predict the types produced by all other combination pairs with ERIC (W= 1). ERIC+Ribo-1 could be completely predicted by either ERIC+OP-13 or ERIC+tDNA (W= 1) (Table 8). Moreover, tDNA+D-10514 and tDNA+Ribo-1 were predicted completely with tDNA+ERIC. Ribo-2+D-14306 was highly predicted by Ribo-2+OPA-02 and Ribo-2+AP3 with W= 0.797 and 0.855, respectively. Besides, Ribo-3+D-14306 was best predicted by Ribo-3+AP3 and Ribo-3+ERIC with W=0.802 and 0.728, respectively (data not shown).
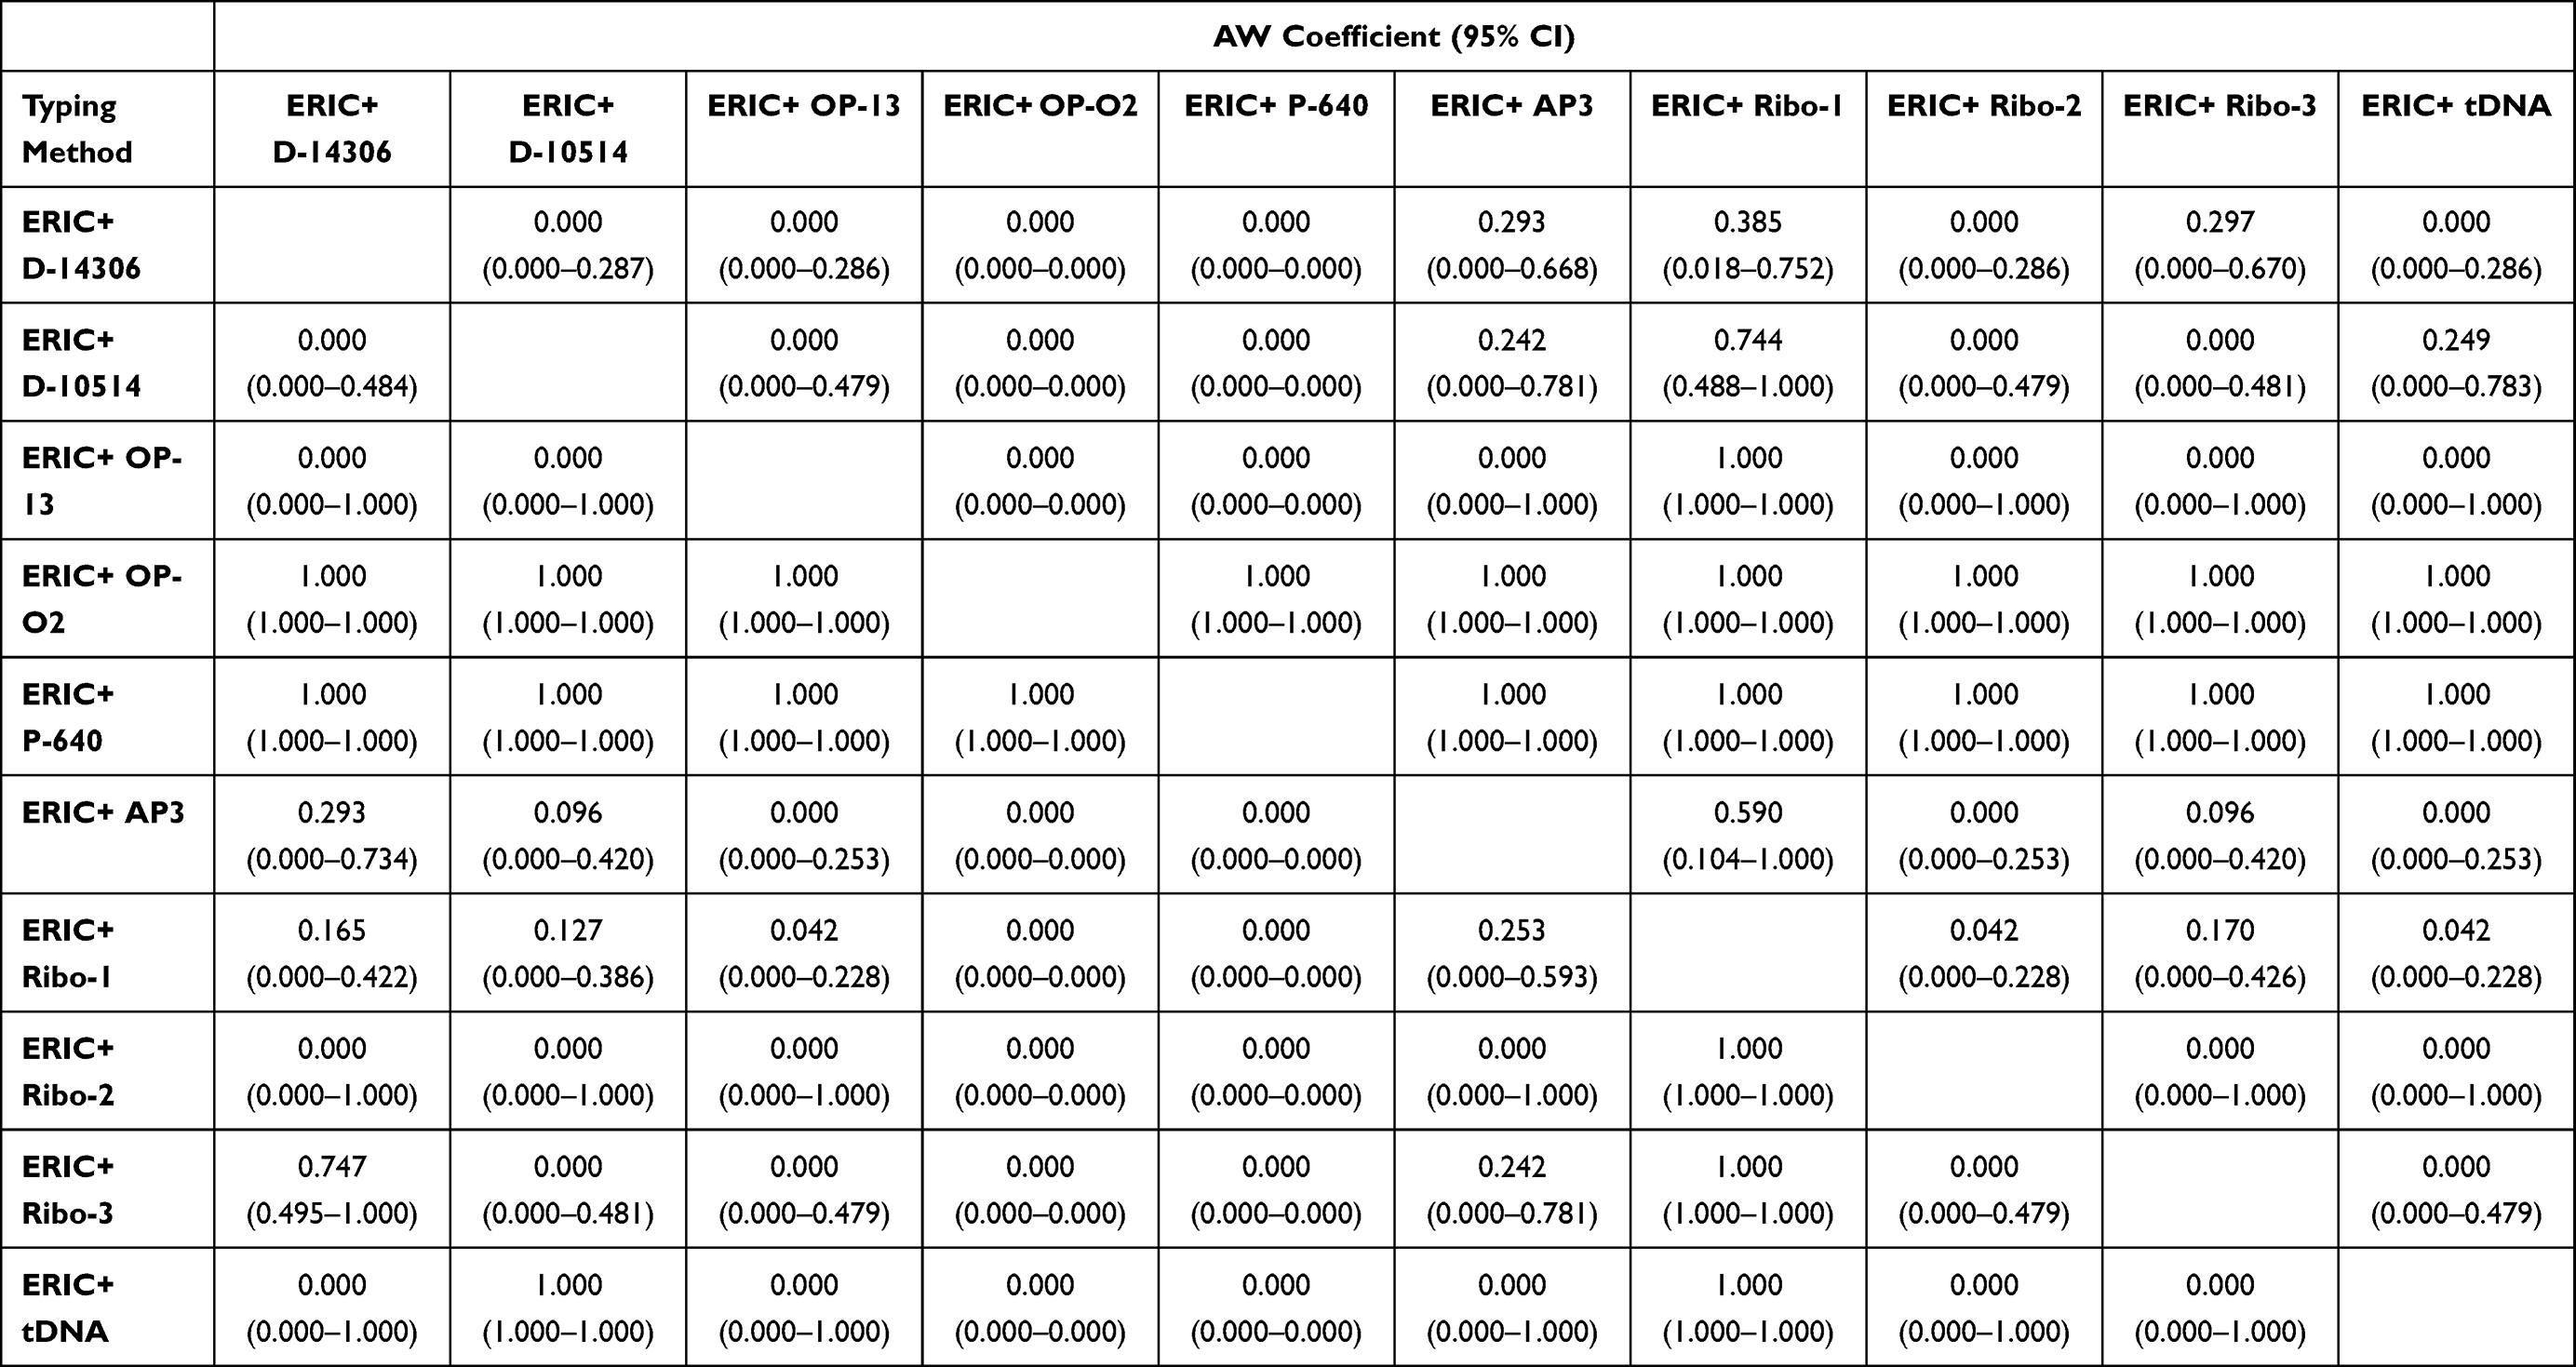 |
Table 8 Wallace’s Coefficient Values Among Combinations of ERIC with Other Typing Methods |
Discussion
Several techniques have been used to evaluate the genetic diversity of P. aeruginosa including PFGE which is the genotypic characteristics gold standard tool, primed PCR, ribotyping, multilocus sequence typing (MLST), and ERIC-PCR. PCR-based typing represents a simple and fast method for typing as compared to PFGE. Their discrimination power may be equivalent to PFGE.27
To the best of our knowledge, this is the first study that represents the most extensive evaluation of RAPD, ribotyping, tDNA, and ERIC to assess the relative strengths and weaknesses of each method or their combinations in discrimination of P. aeruginosa isolates from UTIs. In this study, we analyzed 44 P. aeruginosa isolates to quantify the performance characteristics and congruence between the studied methods.
RAPD is used to detect the genetic diversity by using a short oligonucleotide random sequence to arbitrarily amplify segments of target DNA.3 Six primers of RAPD were used for the molecular characterization of P. aeruginosa isolates. All primers gave ≥10 alleles indicating good resolving power. It was observed that primers, D-10514 and OPA-02, gave the higher PM% (86.7% and 83.3%, respectively) with the allele range of 150–2000 and 300–2500 bp, respectively. The mean number of alleles, number of polymorphic and monomorphic bands per unit for the RAPD typing method were 18, 13.83, and 4.33, respectively besides a high EMR of 10.68. In addition, the mean (%) polymorphism was 76.85. The monomorphic bands among strains illustrated the conserved regions in the genome.33 In contrast, Pethannan et al found that all RADP primers used for typing Pseudomonas species produced polymorphic bands and no monomorphic bands were detected.34 Comparison between the six RAPD markers revealed that no individual marker achieved both high typeability and discrimination. When measuring the efficacy of the markers according to DI, P-640 primer was the best marker as it showed the highest DI value (0.975) where it classified the 44 isolates into 31 genotypes with ISD=70.45%. While when assessing these markers according to typeability, D-14306 and OP-13 markers recorded 97.7% as only one isolate was non-typeable by each marker. Evaluating the efficacy of the markers in measuring the similarities between isolates illustrated that the D-14306 marker was the best as its ISD=29.54%. Moreover, it classified the isolates into 7 clusters at 70% cutoff, 13 clusters at 97% cutoff, and 4 clusters enclosed 79.54% of isolates at 100% cutoff.
Three ribotyping markers were included in the present study. On using Ribo-1 primer, 23 (52.27%) isolates have the same genotype No. 1 while the other 20 isolates were distributed over seven ribotypes with DI=0.697. These results indicate that these isolates may originate from the same source, besides that it demonstrated the constancy of the ISRs of these isolates.35 This may be also explained by the limited number of bands in each ribotype that did not give sufficient differentiation. However, Satpathy et al showed that Ribo-1 classified P. aeruginosa isolates into four ribotypes with DI=0.91.25 For the Ribo-2 primer, genotype No. 2 was predominant with seven (15.90%) isolates while for Ribo-3, out of the 13 genotypes generated, genotypes No. 1 and 3 consist of 15 (34.09%) and 10 (22.72%) isolates, respectively. Wolska and Szweda also reported that ribotyping of 62 P. aeruginosa isolates resulted in 9 groups with 80% of isolates being in two groups.26 Spacov et al reported that Ribo-3 generated 8 types with 79% of isolates classified as one type.10 rRNA genetic loci of prokaryotes have three types of genes (16S, 23S, and 5S) that are separated by spacer regions with diverse lengths and sequences in the genus and species. The spacer region between 16S and 23S can be used for the identification of bacteria by detection of the polymorphism of PCR products of this region.36 The genome of many bacteria has multiple copies (alleles) of the rRNA operons. Within different operons, the size of the spacer region may vary which is related to the number and type of tRNA genes (tRNAglu, tRNAile, tRNAala) found in some spacer regions. ISRs show wider genetic variation as they are subjected to lower evolutionary pressure.37 The comparison between the three primers revealed that although Ribo2 gave PM%= 70, its efficiency in the other parameters was better than Ribo-1 and Ribo-3 primers. Typeability, ISD, Hg, and EMR for Ribo-2 were 97.7%, 75%, 0.53, and 9.80, respectively and it gave 20 alleles ranging between 200–2000 bp that gave rise to 33 ribotypes. In contrast, Wolska and Szweda26 showed that Ribo-2 classified 62 P. aeruginosa isolates into 9 types with 1–3 bands ranging from 220–900bp. The mean number of alleles, number of polymorphic and monomorphic bands per unit for the ribotyping technique were 12.67, 9.33, and 3.33, respectively, with EMR 6.9. In addition, the mean (%) polymorphism was 75.
tDNA marker classified the isolates into 21 genotypes with genotype No.3 being the most pervasive one seen in 22.72% of isolates. A study conducted by Spacov et al10 using tDNA showed that tDNA had clustered 33 P. aeruginosa into 8 genotypes with genotype No.1 comprising about 79% of isolates. The number of alleles, polymorphic bands, monomorphic bands, and EMR were 16, 11, 5, and 7.56, respectively. In addition, PM% was 68.7 and DI was 0.921 where % typeability was 97.7%. Investigating the similarities between isolates showed that at 100% similarity among 7 clusters was found comprising 31 isolates.
ERIC-PCR typed P. aeruginosa isolates into 32 genotypes. Similar results were reported by Stehling et al27 where ERIC-PCR classified 62 P. aeruginosa isolates into 25 genotypes. The number of alleles, polymorphic bands, monomorphic bands, and EMR were 21, 15, 6, and 10.71, respectively. The Hg, Mean PM (%) and DI were 1.41, 71.4, and 0.964, respectively. In contrast to our results, previous studies reported that ERIC-PCR showed the least discrimination power.27,41 Typeability was 81.8% where 8 isolates were untypable. Other studies reported the inability of ERIC-PCR to type some isolates of Plesiomonas shigelloides,42 and E. coli.43,44 At 100% similarity, ERIC gave five clusters with 18 isolates.
Calculation of DI of each typing method revealed that RAPD marker (P-640) has the highest power in discriminating isolates followed by Ribo-2 and ERIC. Higher discriminatory power does not always represent accurate epidemiologic relatedness. The effectiveness of a molecular typing method is a measure of the capability to form significant clustering and discrimination of the unrelated strains.45 Azimirad et al construct a correlation between RAPD, PFGE, and ribotyping in C. difficile isolates, they showed that the same discrimination power was obtained by PFGE and RAPD.38
In general, various methods were used to characterize P. aeruginosa strains. A vital point is how the use of a single method or combination of methods could provide information as DI, typeability, or ISD of the isolates. The comparison between typing methods permits the user to retain a convenient typing method and dismiss an inadequate one.46
By comparing the four PCR-based methods used in this study, ERIC was the best marker used in most of the studied parameters indicating its potency in detecting genetic variation between isolates and its high polymorphic and discrimination power. The second best marker that can be used in discrimination was RAPD (P-640) followed by ribotyping (Ribo-2) then tDNA. Similar results were reported.41 Azimirad et al reported that RAPD and ERIC were the best markers in discrimination between C. difficile isolates followed by ribotyping.38 Besides, ribotyping using Ribo-2 primer was able to differentiate 75% of isolates followed by ERIC (72.72%) and P-640 primer (70%). Oleńska and Małek found that ERIC-PCR can differentiate 61% of 77 rhizobial strains.30 Moreover, ERIC was the best one in detecting the conserved regions in the genome followed by tDNA, RAPD, and ribotyping as the number of monomorphic bands per assay unit for them were 6, 5, 4.33, and 3.33, respectively.
Previous studies reported the usefulness of ERIC-PCR in detecting the difference in number and distribution of repetitive alleles in isolates as P. aeruginosa isolates47,48 E. coli49 and Leptospira isolates45 with high typeability %, DI and ISD. ERIC-PCR is cheaper, easier to perform, reliable, rapid in addition to its high discrimination power. All these factors facilitate its use in the epidemiology of P. aeruginosa in Australia and Brazil.50,51
All permutations of combinations of two types were analyzed and all combinations resulted in increased DI. The trend toward using more than one type for analysis was previously used by Clark et al who reported higher DI using combinations of more than one typing method than using either alone.52 Wolska and Szweda26 and Stehling et al27 proposed that the combination of ribotyping with other PCR-typing methods or traditional techniques can give extreme discrimination of P. aeruginosa. Combining ERIC with RAPD primers (OPA-02 and P-640) increased the DI to 1 as 44 types were obtained. Moreover, typeability increased to 100% as the isolates that could not be typed by one method were typed by the combined one.
The congruence between typing methods indicates the probability that pairs of isolates that are assigned to the same type by one typing method are also typed as identical by the other. The congruence between typing methods determined by Rand’s coefficient revealed that D-15014 and OP-13-types were best predicted by P-640, Ribo-2, and ERIC. While P-640-types were best predicted by Ribo-2 and ERIC. AP3-, Ribo-1-, Ribo-2-, Ribo-3- and tDNA-types were best predicted by ERIC. Evaluation of the congruence among combinations of typing methods by Rand’s coefficient indicated a high increase in the coefficient of all markers where R=1 in ERIC+OPA-02 using ERIC+P-640.
Evaluation of the congruence between typing methods using the Wallace coefficient showed that only D-14306- types and AP3; Ribo-1-types and ERIC showed moderate congruence (0.427 and 0.536, respectively) with 95% CI. The other typing methods showed no or poor congruence suggesting that they grouped the tested isolates in different ways. The Wallace coefficient values among combinations of ERIC with typing methods were very high indicating complete congruence (W=1). Clark et al found complete congruent and higher Wallace coefficient values when the method of a higher resolution was used.52 Worth mentioning that ERIC+OPA-02 and ERIC+P-640 combinations were the highest resolution methods (DI=1) and showed complete congruence with all other combinations when used as the secondary methods. ERIC+ Ribo-1 combination gave high to complete congruence when used as the primary method. Following our results, Faria et al found that combining two typing methods (PFGE type-spa type combination) increased the predictive power of each method for determining the SCCmec type in Staphylococcus aureus.15
Conclusion
Based on the results obtained, the genetic diversity of 44 isolates of P. aeruginosa were analyzed using primers of RAPD, ribotyping, tDNA, and ERIC. All the PCR-typing methods are useful for epidemiological typing of P. aeruginosa isolates as they are simple and fast methods. ERIC-PCR and RAPD-PCR showed the highest performance in discriminating isolates. The usage of two or more typing methods in combination may result in a better evaluation of the genetic diversity of isolates. The performance characteristics of ERIC and its combinations make them the most suitable typing methods for epidemiological analysis. So, we suggest their use to study the genetic diversity of P. aeruginosa. The application of two or more typing methods in combination may result in a better discrimination of isolates.
Acknowledgments
We would like to thank the Urology and Nephrology Centre for providing the clinical isolates. This study was performed at the Microbiology and Immunology Department, Faculty of Pharmacy, Mansoura University, Mansoura, Egypt.
Disclosure
The authors report no conflicts of interest in this work.
References
1. Pachori P, Gothalwal R, Gandhi P. Emergence of antibiotic resistance Pseudomonas aeruginosa in intensive care unit; a critical review. Genes Dis. 2019;6(2):109–119. doi:10.1016/j.gendis.2019.04.001
2. Liu T, Zhang Y, Wan Q. Pseudomonas aeruginosa bacteremia among liver transplant recipients. Infect Drug Resist. 2018;11:2345–2356. doi:10.2147/IDR.S180283
3. Li W, Raoult D, Fournier PE. Bacterial strain typing in the genomic era. FEMS Microbiol Rev. 2009;33(5):892–916. doi:10.1111/j.1574-6976.2009.00182.x
4. MacCannell D. Bacterial strain typing. Clin Lab Med. 2013;33(3):629–650. doi:10.1016/j.cll.2013.03.005
5. Ranjbar R, Karami A, Farshad S, Giammanco GM, Mammina C. Typing methods used in the molecular epidemiology of microbial pathogens: a how-to guide. New Microbiol. 2014;37(1):1–15.
6. Aljindan R, Alsamman K, Elhadi N. ERIC-PCR genotyping of Acinetobacter baumannii isolated from different clinical specimens. Saudi J Med Med Sci. 2018;6(1):13–17. doi:10.4103/sjmms.sjmms_138_16
7. Rodriguez JM, Lopez-Romalde S, Beaz R, Alonso MC, Castro D, Romalde JL. Molecular fingerprinting of Vibrio tapetis strains using three PCR-based methods: ERIC-PCR, REP-PCR and RAPD. Dis Aquat Organ. 2006;69(2):175–183. doi:10.3354/dao069175
8. Uddin MS, Cheng Q. Recent application of biotechniques for the improvement of mango research. In: Poltronieri P, Hong Y, editors. Applied Plant Genomics and Biotechnology. Woodhead Publishing; 2015:195–212.
9. Waturangi DE, Joanito I, Yogi Y, Thomas S. Use of REP- and ERIC-PCR to reveal genetic heterogeneity of Vibrio cholerae from edible ice in Jakarta, Indonesia. Gut Pathog. 2012;4(1):2. doi:10.1186/1757-4749-4-2
10. Spacov ICG, Silva S, Júnior M, Morais M. Polymorphism of the rDNA and tDNA loci in clinical isolates of Pseudomonas aeruginosa: a perspective for molecular epidemiology surveillance. Genet Mol Biol. 2006;29(4):722–729. doi:10.1590/S1415-47572006000400023
11. Adzitey F, Huda N, Ali GR. Molecular techniques for detecting and typing of bacteria, advantages and application to foodborne pathogens isolated from ducks. 3 Biotech. 2013;3(2):97–107. doi:10.1007/s13205-012-0074-4
12. Van Looveren M, Ison CA, Ieven M, et al. Evaluation of the discriminatory power of typing methods for Neisseria gonorrhoeae. J Clin Microbiol. 1999;37(7):2183–2188. doi:10.1128/JCM.37.7.2183-2188.1999
13. Burucoa C, Lhomme V, Fauchere JL. Performance criteria of DNA fingerprinting methods for typing of Helicobacter pylori isolates: experimental results and meta-analysis. J Clin Microbiol. 1999;37(12):4071–4080. doi:10.1128/JCM.37.12.4071-4080.1999
14. Welsh J, McClelland M. Fingerprinting genomes using PCR with arbitrary primers. Nucleic Acids Res. 1990;18(24):7213–7218. doi:10.1093/nar/18.24.7213
15. Faria NA, Carrico JA, Oliveira DC, Ramirez M, de Lencastre H. Analysis of typing methods for epidemiological surveillance of both methicillin-resistant and methicillin-susceptible Staphylococcus aureus strains. J Clin Microbiol. 2008;46(1):136–144. doi:10.1128/JCM.01684-07
16. Englen M, Kelley LC. A rapid DNA isolation procedure for the identification of Campylobacter jejuni by the polymerase chain reaction. Lett Appl Microbiol. 2008;31:421–426. doi:10.1046/j.1365-2672.2000.00841.x
17. Deligianni E, Pattison S, Berrar D, et al. Pseudomonas aeruginosa cystic fibrosis isolates of similar RAPD genotype exhibit diversity in biofilm forming ability in vitro. BMC Microbiol. 2010;10:38. doi:10.1186/1471-2180-10-38
18. Scaccabarozzi L, Leoni L, Ballarini A, et al. Pseudomonas aeruginosa in dairy goats: genotypic and phenotypic comparison of intramammary and environmental isolates. PLoS One. 2015;10(11):e0142973. doi:10.1371/journal.pone.0142973
19. Jana T, Sharma TR, Prasad RD, Arora DK. Molecular characterization of Macrophomina phaseolina and Fusarium species by a single primer RAPD technique. Microbiol Res. 2003;158(3):249–257. doi:10.1078/0944-5013-00198
20. Sazakli E, Leotsinidis M, Vantarakis A, Papapetropoulou M. Comparative typing of Pseudomonas species isolated from the aquatic environment in Greece by SDS-PAGE and RAPD analysis. J Appl Microbiol. 2005;99(5):1191–1203. doi:10.1111/j.1365-2672.2005.02691.x
21. Eftekhar F, Nouri P. Correlation of RAPD-PCR profiles with ESBL production in clinical isolates of Klebsiella pneumoniae in Tehran. J Clin Diagn Res. 2015;9(1):DC01–03. doi:10.7860/JCDR/2015/10651.5373
22. Abou-Dobara MI, Deyab MA, Elsawy EM, Mohamed HH. Antibiotic susceptibility and genotype patterns of Escherichia coli, Klebsiella pneumoniae and Pseudomonas aeruginosa isolated from urinary tract infected patients. Pol J Microbiol. 2010;59(3):207–212. doi:10.33073/pjm-2010-032
23. Sumbria D, Singla LD, Sharma A, Moudgil AD, Bal MS. Equine trypanosomosis in central and western Punjab: prevalence, haemato-biochemical response and associated risk factors. Acta Trop. 2014;138:44–50. doi:10.1016/j.actatropica.2014.06.003
24. Green LM, Worthington T, Hilton AC, Lambert PA. Genetic characterization of clinical isolates of Clostridium difficile using an optimized RAPD protocol and PCR ribotyping reveals strain diversity between two tertiary referral Trusts in the West Midlands, UK. J Med Microbiol. 2011;60(Pt 9):1287–1291. doi:10.1099/jmm.0.030999-0
25. Satpathy G, Patnayak D, Titiyal JS, et al. Post-operative endophthalmitis: antibiogram & genetic relatedness between Pseudomonas aeruginosa isolates from patients & phacoemulsifiers. Indian J Med Res. 2010;131:571–577.
26. Wolska K, Szweda P. A comparative evaluation of PCR ribotyping and ERIC PCR for determining the diversity of clinical Pseudomonas aeruginosa isolates. Pol J Microbiol. 2008;57(2):157–163.
27. Stehling EG, Leite DS, Silveira WD. Molecular typing and biological characteristics of Pseudomonas aeruginosa isolated from cystic fibrosis patients in Brazil. Braz J Infect Dis. 2010;14(5):462–467. doi:10.1016/S1413-8670(10)70094-5
28. Sornakili A, Rathinam P, Thiruvengadum R, Kuppusamy P. Comparative assessment of RAPD and ISSR markers to study genetic polymorphism in Colletotrichum gloeosorioides isolates of Mango. Asian J Plant Pathol. 2017;11:130–138. doi:10.3923/ajppaj.2017.130.138
29. Mariette S, Le Corre V, Austerlitz F, Kremer A. Sampling within the genome for measuring within-population diversity: trade-offs between markers. Mol Ecol. 2002;11(7):1145–1156. doi:10.1046/j.1365-294X.2002.01519.x
30. Olenska E, Malek W. Genomic polymorphism of Trifolium repens root nodule symbionts from heavy metal-abundant 100-year-old waste heap in southern Poland. Arch Microbiol. 2019;201(10):1405–1414. doi:10.1007/s00203-019-01708-x
31. Hunter PR, Gaston MA. Numerical index of the discriminatory ability of typing systems: an application of Simpson’s index of diversity. J Clin Microbiol. 1988;26(11):2465–2466. doi:10.1128/JCM.26.11.2465-2466.1988
32. Carrico JA, Silva-Costa C, Melo-Cristino J, et al. Illustration of a common framework for relating multiple typing methods by application to macrolide-resistant Streptococcus pyogenes. J Clin Microbiol. 2006;44(7):2524–2532. doi:10.1128/JCM.02536-05
33. Singh JP, Verma R, Chaudhuri P. Random amplified polymorphic DNA (RAPD) analysis of Mycobacterium tuberculosis strains in India. J Vet Sci. 2006;7(2):181–187. doi:10.4142/jvs.2006.7.2.181
34. Pethannan R, Kuppuswamy AC, Gupta R, et al. RAPD characterization of pseudomonas species identified from clinical samples. Recent Res Sci Technol. 2018;10:11–15.
35. Daly M, Power E, Bjorkroth J, et al. Molecular analysis of Pseudomonas aeruginosa: epidemiological investigation of mastitis outbreaks in Irish dairy herds. Appl Environ Microbiol. 1999;65(6):2723–2729. doi:10.1128/AEM.65.6.2723-2729.1999
36. Kostman JR, Alden MB, Mair M, Edlind TD, LiPuma JJ, Stull TL. A universal approach to bacterial molecular epidemiology by polymerase chain reaction ribotyping. J Infect Dis. 1995;171(1):204–208. doi:10.1093/infdis/171.1.204
37. Garcia-Martinez J, Acinas SG, Anton AI, Rodriguez-Valera F. Use of the 16S–23S ribosomal genes spacer region in studies of prokaryotic diversity. J Microbiol Methods. 1999;36(1–2):55–64. doi:10.1016/S0167-7012(99)00011-1
38. Azimirad M, Alebouyeh M, Rashidan M, Aslani MM, Zali MR. Comparison of common molecular typing methods for differentiation of Clostridium difficile strains in the study of hospital acquired diarrhea. Arch Clin Infect Dis. 2018;13:5.
39. Collier JG, Fraser GA, Marmion PB, Simmons A. Practical medical microbiology. Churchill Livingstone, NY. 1996;4:413–418.
40. Martin C, Ichou MA, Massicot P, Goudeau A, Quentin R. Genetic diversity of Pseudomonas aeruginosa strains isolated from patients with cystic fibrosis revealed by restriction fragment length polymorphism of the rRNA gene region. J Clin Microbiol. 1995;33(6):1461–1466. doi:10.1128/JCM.33.6.1461-1466.1995
41. Liu Y, Davin-Regli A, Bosi C, Charrel RN, Bollet C. Epidemiological investigation of Pseudomonas aeruginosa nosocomial bacteraemia isolates by PCR-based DNA fingerprinting analysis. J Med Microbiol. 1996;45(5):359–365. doi:10.1099/00222615-45-5-359
42. Ekundayo T, Okoh A. Molecular characterization, intra-species diversity and abundance of freshwater Plesiomonas shigelloides isolates. Microorganisms. 2020;8(7):1081. doi:10.3390/microorganisms8071081
43. Ekundayo TC, Okoh AI, Sibai AM. A global bibliometric analysis of Plesiomonas-related research (1990–2017). PLoS One. 2018;13(11):e0207655. doi:10.1371/journal.pone.0207655
44. Ekundayo TC, Okoh AI. Modelling the effects of physicochemical variables and anthropogenic activities as ecological drivers of Plesiomonas shigelloides distribution and freshwaters quality. Sci Total Environ. 2019;682:765–778. doi:10.1016/j.scitotenv.2019.05.129
45. Bilung LM, Pui CF, Su’ut L, Apun K. Evaluation of BOX-PCR and ERIC-PCR as molecular typing tools for pathogenic leptospira. Dis Markers. 2018;2018:1351634. doi:10.1155/2018/1351634
46. Ghazi F, Kihal M, Altay N, Gürakan GC. Comparison of RAPD-PCR and PFGE analysis for the typing of Streptococcus thermophilus strains isolated from traditional Turkish yogurts. Ann Microbiol. 2016;66:1013–1026. doi:10.1007/s13213-015-1185-z
47. Hernández M, Castillo G, Ramos OC, et al. Molecular characterization of Pseudomonas aeruginosa clinical isolates among patients of the Hospital Del Niño, Republic Of Panama. Internet J Microbiol. 2016;14(1).
48. Han MM, Mu LZ, Liu XP, Zhao J, Liu XF, Liu H. ERIC-PCR genotyping of Pseudomonas aeruginosa isolates from haemorrhagic pneumonia cases in mink. Vet Rec Open. 2014;1(1):e000043. doi:10.1136/vropen-2014-000043
49. Saha O, Hoque MN, Islam OK, Rahaman MM, Sultana M, Hossain MA. Multidrug-resistant avian pathogenic Escherichia coli strains and association of their virulence genes in Bangladesh. Microorganisms. 2020;8(8):1135. doi:10.3390/microorganisms8081135
50. Khosravi AD, Hoveizavi H, Mohammadian A, Farahani A, Jenabi A. Genotyping of multidrug-resistant strains of Pseudomonas aeruginosa isolated from burn and wound infections by ERIC-PCR. Acta Cir Bras. 2016;31(3):206–211. doi:10.1590/S0102-865020160030000009
51. Zarei O, Shokoohizadeh L, Hossainpour H, Alikhani MY. Molecular analysis of Pseudomonas aeruginosa isolated from clinical, environmental and cockroach sources by ERIC-PCR. BMC Res Notes. 2018;11(1):668. doi:10.1186/s13104-018-3765-z
52. Clark CG, Taboada E, Grant CC, et al. Comparison of molecular typing methods useful for detecting clusters of Campylobacter jejuni and C. coli isolates through routine surveillance. J Clin Microbiol. 2012;50(3):798–809. doi:10.1128/JCM.05733-11
 © 2021 The Author(s). This work is published and licensed by Dove Medical Press Limited. The
full terms of this license are available at https://www.dovepress.com/terms
and incorporate the Creative Commons Attribution
- Non Commercial (unported, 3.0) License.
By accessing the work you hereby accept the Terms. Non-commercial uses of the work are permitted
without any further permission from Dove Medical Press Limited, provided the work is properly
attributed. For permission for commercial use of this work, please see paragraphs 4.2 and 5 of our Terms.
© 2021 The Author(s). This work is published and licensed by Dove Medical Press Limited. The
full terms of this license are available at https://www.dovepress.com/terms
and incorporate the Creative Commons Attribution
- Non Commercial (unported, 3.0) License.
By accessing the work you hereby accept the Terms. Non-commercial uses of the work are permitted
without any further permission from Dove Medical Press Limited, provided the work is properly
attributed. For permission for commercial use of this work, please see paragraphs 4.2 and 5 of our Terms.