Back to Journals » International Journal of Nanomedicine » Volume 15
Comparative Analysis of Commercial Colloidal Silver Products
Received 22 October 2020
Accepted for publication 9 December 2020
Published 22 December 2020 Volume 2020:15 Pages 10425—10434
DOI https://doi.org/10.2147/IJN.S287730
Checked for plagiarism Yes
Review by Single anonymous peer review
Peer reviewer comments 3
Editor who approved publication: Dr Thomas Webster
Ajeet Kumar, 1 Dan V Goia 2
1Ames Electronic Materials Division, South Plainfield, NJ 07080, USA; 2Department of Chemistry and Biomolecular Science, Clarkson University, Potsdam, NY, 13676, USA
Correspondence: Dan V Goia
Department of Chemistry and Biomolecular Science, 123 Science Center, 8 Clarkson Ave, Potsdam, NY 13699, USA
Tel +1 315 268 4411
Email [email protected]
Purpose: The public fear associated with the novel coronavirus (SARS-CoV-2) pandemic has triggered recently a significant proliferation of supplements touted as potential cures against bacteria and viruses. Colloidal silver has particularly benefited from this rush given its empirically and scientifically documented anti-bacterial and anti-viral actions. The lack of standards in the unregulated supplements industry remains a major roadblock in evaluating the quality and consistency of marketed products or assessing the accuracy of the information provided by manufacturers. This study is the first scientifically rigorous attempt to evaluate commercial silver colloidal products offered for sale on the internet.
Methods: Fourteen of the most popular colloidal silver products purchased from Amazon (www.amazon.com) were evaluated using state-of-the-art analytical techniques widely accepted as gold standards for investigating the properties (size, shape) and the dispersion of silver nanoparticles.
Results: Commercial samples were analysed using UV-Vis, FE-SEM and AAS techniques. In general, the Ag concentration was very close to those claimed by the manufacturer. The colorless product shows no absorbance in the UV-Vis analysis. The FESEM and STEM images confirmed the conclusions of the UV-Vis analysis.
Conclusion: The results of this evaluation show clearly that 70% of the commercial products evaluated contain only ionic silver. Despite the evidence showing that silver nanoparticles are not present, eight of these products are promoted by the manufacturers as ‘colloidal silver’. Considering the extensive scientific research showing major differences between silver ionic and silver nanoparticles in terms of mechanisms of action, efficacy and safety, it is clear that this misrepresentation impacts the consumers and must be addressed. This study serves as blueprint for a scientific protocol to be followed by manufacturers for characterizing their silver supplements.
Keywords: colloidal silver, nanodispersion, bio-active, supplement, antimicrobial, UV-Vis analysis
Corrigendum for this paper has been published.
A Letter to the Editor has been published for this article.
A Response to Letter has been published for this article.
Introduction
The unique properties of silver have been known and exploited by humans since antiquity. While the ‘noble’ character that gave the metal a currency status was the most coveted, its health benefits were also highly valued. Indeed, the empirically discovered efficacy as disinfectant for water, food, wounds, and household utensils were put to use by many ancient societies. Due to the technological limitations at the time, bulk forms of silver (foils, coins, wires, silverware, etc.) were primarily used in the pre-modern era. Recent advances in manipulating the physical properties of the metal (particle size, shape, and surface characteristics) have dramatically changed the situation. Nowadays dispersed silver nanoparticles offer many novel properties and are widely used in biology and life science applications,1–7 microelectronics,8 catalysis,9 bio-imaging,10 solar cells,11 ink-jet printing,12 glass and ceramic staining,13–17 and spectroscopic research.16–18 They represent also a potential game changer in medicine as they can deliver the expected health benefits in a more effective and economical way. Recent studies19,20 have confirmed beyond doubt the empirically discovered antimicrobial effect of silver. Research data showing the efficacy of silver nanoparticles against Monkeypox and Tacaribe viruses were also reported.21,22 Against this backdrop, the rapid spread of the novel coronavirus (SARS-CoV-2) has triggered an explosive proliferation of colloidal silver products. Indeed, the number of new offerings on the Amazon website increased by an order of magnitude in just a few weeks. Considering the significant research involved in developing a new product, it is legitimate to ask if they are truly what the labels claim to be. The present study is the first scientifically rigorous attempt to evaluate commercial silver colloidal products. The work intends primarily to determine if widely accepted scientific knowledge and terminology (like ‘colloidal silver’) are ignored, misinterpreted, or abusively used as marketing tools. A second objective is to educate consumers about their choices in the largely unregulated and scientifically ambiguous supplements industry.
This investigation was triggered by the abundance of misleading and irrelevant claims posted on the labels of most colloidal silver products sold online. The terms ‘gluten free’, ‘certified vegan’, ‘vegan friendly’, ‘soy free’, ‘sugar free’, ‘no artificial ingredients’, “non-GMO”, and “BPA-free”, for example, are hardly relevant for products that according to the label contain only distilled water and silver nanoparticles. Other claims cast doubt on the scientific accuracy of the information provided. Several manufacturers state that their product consists of sub-nanometer (0.8 nm) silver particles suspended in water. This contradicts the prevailing view of the experts in the field who have demonstrated that silver clusters of such size are not stable in water. The most disturbing aspect that prompted the present study, however, was the author’s conclusion based on visual examination that the majority of the samples were colorless. The lack of the characteristic yellow color caused by the plasmon absorption band was a strong indication that they may contain in fact ionic silver and therefore could not be labeled “colloidal silver”. Considering the dramatic differences in physical properties, toxicity, and mechanism of action between the two types of silver, it is clear that identifying correctly the nature of the samples is of critical importance for consumers. To this end, UV-Vis and electron microscopy were employed to determine if the term colloidal silver is justifiably used by the manufacturers for marketing purposes.
Materials and Methods
Material
Fourteen of the most popular colloidal silver products purchased from Amazon (www.amazon.com) were evaluated using state-of-the-art analytical techniques widely accepted as gold standards for investigating the properties (size, shape) and the dispersion of silver nanoparticles. Amazon was the source of the samples as it is the largest on-line platform and it has certain standards that must be met prior listing. The selection of the fourteen products evaluated was done based on the number of reviews on the website and the suppliers estimated annual sales.
Characterization Methods
UV-Vis Spectrophotometry
UV-Vis is the best method to assess the dispersion of silver nanoparticles in liquids. When exposed to electromagnetic radiation, each silver entity (single particle or aggregate) absorbs at a certain wavelength that varies with its size. Collectively, the particles give rise to the so-called “plasmon band”. The position of the plasmon migrates towards higher wavelengths as the size of the particle/entity increases. Typically, the peak is located at 380–390 nm for 2–3 nm particles and shifts to ~400 nm for 10–12 nm particles and respectively ~460 nm for 70–80 nm particles. These values can be slightly shifted by species absorbed on the surface or changes in the dielectric constant of the liquid. As a corollary of the size-wavelength correlation, the width of the plasmon band provides also valuable information about the silver particles uniformity. A broader plasmon band indicates the presence different size silver entities while a narrow one is characteristic of uniform particles. The UV-Vis spectrometry also provides information regarding the particles shape. Indeed, anisometric particles with large aspect ratio (rods and platelets) display two plasmon bands corresponding to the collective electron oscillations along the two dissimilar dimensions.
Electron Microscopy
UV-Vis spectrometry cannot determine if a given size silver entity is a single particle or an aggregate as both absorb at the same wavelength. It also cannot detect shape differences between entities having the same plasmon band position and profile. For this reason, UV-Vis analysis must be used in conjunction with electron microscopy to provide a complete and accurate information about the size, shape and dispersion of silver particles in the colloidal system. In this study, both field emission scanning electron microscopy (FESEM) and scanning transmission electron microscopy (STEM) were used to provide such information. The former offers sufficient resolution to visualize particles as small as 1–2 nm while being also able to capture images of a large number of particles for a more reliable evaluation in regard to particles uniformity and aggregation. STEM is not suited for bulk analysis but provides atomic resolution allowing the visualization of sub-nanometer silver clusters.
Atomic Absorption Spectrometry
Flame Atomic Absorption Spectrometry (AAS) was used to determine if the silver concentration given on the labels is correct. The method is very accurate and has a very good sensitivity (40 ppb). The analysis was performed only for the colorless samples for which the silver concentration could not be estimated based on the value of plasmon band absorption.
Instrumentation and Sample Preparation
All analyses were performed by highly trained technical staff in the “Center of Advanced Materials Processing” at Clarkson University, Potsdam, NY. The UV-Vis spectra were generated with a Perkin Elmer Lamda 35 spectrophotometer. The samples received were diluted to 10 ppm Ag with deionized water to match the concentration of the most dilute sample. The UV-Vis spectra were collected in the 300–900 nm range using deionized water as blank. The scanning rate was in all cases 800nm/min and the spectral bandwidth was set at 0.5 nm. The FESEM images were obtained using a JEOL 7400 electron microscope. The samples were prepared by depositing a drop of silver dispersion on a 1.0 cm diameter aluminum stub and evaporating slowly the solvent in a desiccator. The instrument was operated at 15 keV voltage. The high-resolution scanning transmission electron micrographs (STEM) were taken with a JOEL 2010 microscope with a resolution of 0.6 nm and digital imaging capabilities. The particles were supported on a carbon-coated copper grid. The grid was set transversally at the bottom of a centrifuge tube containing the colloidal dispersion. The nanoparticles were then deposited in a dispersed form on the grid by ultracentrifugation. The operating voltage of the instrument was varied from 50 keV to 200 keV, depending on the resolution desired. The concentration of silver in the samples was determined by atomic absorption spectrophotometry (AAS) using a Perkin Elmer instrument. All samples were diluted to 10 ppm with deionized water and aspired into the flame. The emission line at 3281 angstroms was used as excitation wavelength.
Commercial Samples Evaluated
The products analyzed are listed in Table 1 in the increasing order of silver concentration claimed on the label. With the exception of Kaiame Silver H2O (Naturally Sourced LLC) and SilverSolution (My Doctor Suggests), all products are claimed to be “colloidal silver”. The samples were evaluated visually first to see if the specific yellow color characteristic to dispersions of silver nanoparticles was present. The inspection was performed before and after vigorously shaking the containers for 30 seconds to check for the eventual presence of settled particles. Based on this preliminary test, the samples were grouped in two distinct blocks in Table 1. The first, includes products (#1 through #10) that were colorless and did not contain dispersed solids or a settled deposit. The colored products (#11 through #14) are listed in the second block. All samples were first subjected to UV-Vis analysis. The samples with a characteristic plasmon band were further evaluated by electron microscopy. All samples were analyzed by atomic absorption spectrophotometry (AAS) to determine if the silver concentration claimed on the label is correct.
 |
Table 1 List of Commercial Silver Colloidal Samples Evaluated |
Results
Visual Evaluation
The results of the visual examination are presented in the last three columns of Table 1. The samples in the first block (1–10) were all colorless and clear. No settled particles were observed in any of them even after shaking the containers vigorously for at least 30 seconds. Judged by their turbidity, the samples in the second block were clearly dispersions of silver nanoparticles. They were colored from faint to dark brown, depending on the silver nanoparticles concentration.
Atomic Absorption Spectrophotometry
The silver concentrations measured by AAS are listed in Table 1, column 6. In general, the values are close to those claimed by the manufacturers. There are, however, a few exceptions for which the deviation was too large to be attributed to the accuracy of the method. Silver Crystalline Nano from “Noche” and ColloidalSilver from ‘Trace Minerals’ contained significantly less silver. The value in the first case was 5.85 ppm versus 30ppm advertised. The second contained only 11.9 ppm instead 30ppm. At the other end of the spectrum, Silver Wings contained 321ppm silver, 28.4% more than the value of 250ppm stated on the label.
UV-Vis Spectrophotometry Results
The UV-Vis spectra of samples #1–10 from Table 1 are presented in Figure 1. As expected, none of the colorless products showed absorption features in the 300 and 900 nm range. The UV-Vis spectra of the four products from the second group (Table 1, samples #11–14) are presented in Figure 2. Three samples from this group (MesoSilver, Silver Wings, and Coated Silver) displayed well-defined plasmon bands with absorption maxima ranging from 397 to 409 nm (see box in Figure 2). These values are typically associated with dispersed silver particles with sizes between 10 and 20 nm. The fourth sample (Trace Colloidal Silver) has a broad peak at 428 nm indicative for the presence of 40–50 nm particles.23 The maximum absorption value (0.14) was much lower than that of the other three samples, in agreement with the lower silver concentration found by AAS.
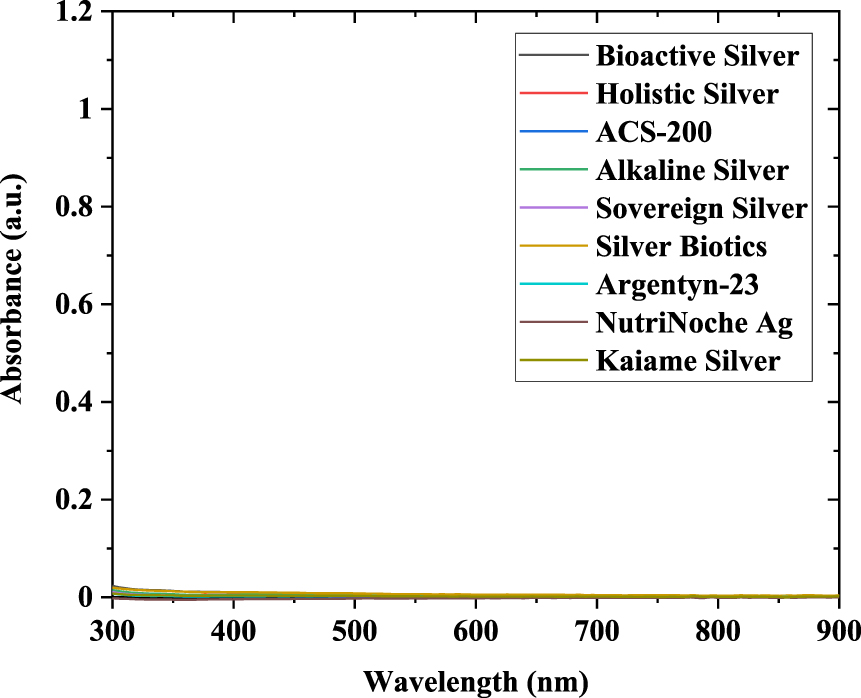 |
Figure 1 UV-Vis spectra of samples #1–10. Table 1 |
 |
Figure 2 UV-Vis spectra of samples 11–14. Table 1 |
The shape of the UV-Vis graphs gives valuable information in regard to both uniformity and silver nanoparticles dispersion. The large background absorption of MesoSilver and Trace Colloidal Silver products above 550 nm suggests considerable particles aggregation. In the former, this does not seem to affect dispersion stability as no particles settling was observed. The larger size and higher λ900nm/λmax absorbance ratio in Trace Colloidal Silver, however, caused complete settling of silver particles. Silver Wings displayed a sharp plasmon band located at 409 nm and a shoulder at 500 nm but no background absorption. Coated Silver has the narrowest plasmon band with no shoulder indicating the presence of very uniform silver nanoparticles around 10 nm. Clearly, the last two samples are truly “colloidal silver”.
Electron Microscopy Analysis
The electron microscopy analysis was performed only for samples #12–14 since in samples #1-#10 no silver particles were detected and for Trace Silver (Sample #11) it was not possible to obtain a representative sample for either FESM or STEM. The FESM images of samples #12 - #14 are shown in Figure 3 and the transmission electron micrographs in Figure 4. The FESEM and STEM images confirmed the conclusions of the UV-Vis analysis. MesoSilver contains numerous 10 nm particles (responsible for the maximum absorption wavelength of 397 nm) along with larger entities up to 50 nm (Figures 3 and 4, left images). The electron micrographs also show aggregates of various sizes, which together with the larger individual particles are responsible for the continuous background absorption above 600 nm observed in the UV-Vis spectrum (Figure 2). The particles in Silver Wings appear to have a low level of aggregation, which explains the lack of background absorption above 550 nm. Most particles are around 15 nm, in agreement with the position of the plasmon band at 409 nm. The electromicrographs reveal, however, the presence of few larger particles (40–50 nm), which are likely the reason for the plasmon shoulder at ~470 nm in the UV-Vis plot. For Coated Silver FESEM and STEM analyses reveal the presence of very uniform particles (~12) and the absence of large particles/aggregates. The size and uniformity are consistent with the position, width, and symmetry of the plasmon band recorded at 400 nm (Figure 2). It is truly remarkable that Coated Silver displays such excellent dispersion despite a silver concentration roughly two orders of magnitude higher than its competitors.
 |
Figure 3 FESEM images of samples #12–14: (left) MesoSilver, (middle) Silver Wings, (right) Coated Silver. |
 |
Figure 4 STEM images of samples #12–14: (left) MesoSilver, (middle) Silver Wings, (right) Coated Silver. |
Discussion
The absence of the plasmon band characteristic of dispersed silver nanoparticles clearly shows that 10 of the 14 products evaluated (~70%) contain silver in ionic form and should not be labeled “colloidal silver”. It appears that the large majority of manufacturers are either not aware or are simply ignoring that stable “colloidal silver” dispersions should be colored even at very low silver concentration. Four manufacturers (NaturalImunogenics, Sovereign Silver, Naturally Sourced LLC, and SilverDoc) attempt to “solve” this conundrum by claiming that the particles in their products are too small (0.8 nm) to absorb electromagnetic radiation and thus display color (Note: Based on our data and the identical value of the particle size given on the labels, these four companies appear to be selling the same product under different names). This is a clever approach considering that analytical tools capable to visualize such small clusters are not typically used in the supplements industry and surely not available to consumers. It is, however, scientifically incorrect. Over the last 4 decades, many articles published in respected peer reviewed journals have demonstrated both experimentally and computationally that silver clusters containing even few atoms absorb electromagnetic radiation. Aikens et al,24 for example, prepared Ag42+ and Ag9+ clusters by reducing Ag+ ions with sodium borohydride (NaBH4) in the presence of polyacrylate ions. By using the stop flow kinetics technique, the authors have shown that these small entities measuring approximately 0.40 and, respectively, 0.6 nm absorb at 270 and 340 nm. Henglein et al,25 and Suchov et al,26 have also prepared silver clusters containing only several atoms by pulse radiolysis and showed that they display distinct plasmon bands at 295 and 325 nm. The slightly larger 0.8 nm silver clusters (16–18 atoms) in the four samples above should therefore display a plasmon band between 300 and 360 nm and display a yellowish color. The above studies have also showed that silver entities containing less than 20 atoms (two atomic shells or less) oxidize in minutes to silver ions even in highly pure water and special containers. Therefore, it is unlikely that the 0.8 nm silver clusters claimed would survive in the commercial containers for weeks or months. Our failed attempts to visualize the “clusters” in Argentyn23 with our powerful STEM operated at its limits was a first confirmation that silver particles were not present. The irrefutable proof that the colorless samples contained in fact ionic silver was provided by the reaction with sodium borohydride. When this powerful reducing agent was added to the four products claiming to contain 0.8nm clusters, the yellow coloration characteristic to dispersed silver nanoparticles appeared immediately. Figure 5 shows the photos of the dispersions prior (left) and after (right) the reaction. The UV-Vis analysis of the samples treated with sodium borohydride revealed well-defined plasmon bands after the reductant addition (Figure 6). It is noteworthy that the value of the recorded maximum absorbances was in all cases around 1.0, similar to that of samples #12–14 which contained silver nanoparticles in the same concentration (10 ppm). Given the fact that the solutions of ionic silver are wrongly labeled as “colloidal silver” it is fair to ask if there is a difference in efficacy between the two or if it matters to consumers. A large body of research has established without a doubt that the Ag+ are the species responsible for the anti-microbial and anti-viral activity. According to the most widely accepted mechanism of action,19,27 silver ions react with the thiol groups in cysteine and methionine aminoacids. Methionine plays a central role in a variety of cellular functions being the universal initiator of protein synthesis. Its derivative, S-adenosylmethionine, is involved in the critical cellular processes of methylation and polyamine biosynthesis. Methionine is formed by the conversion of cysteine via cystathionine, a process facilitated by the activity of cystathionine gamma-synthase and cystathionine beta-lyase.28,29 The reaction of silver ions with the sulfur atom in the thiol group disrupts the conversion of cysteine and methionine causing cell apoptosis and bacteria inactivation.
 |
Figure 5 Images of Sovereign Silver (sample#1), Kaiame Silver (sample #4), Bio-active Silver Sol (sample#5), and Argentyn23 (sample#6) before and after the addition of sodium borohydride. |
 |
Figure 6 UV-Vis spectra of samples #1, #4, #5, and #6 before (left) and after (right) the addition of sodium borohydride. |
All samples evaluated contain enough silver ions capable to kill bacteria regardless if they contain silver nanoparticles or not. In the colorless products, the Ag+ ions concentration is practically equal with the nominal concentration given on the label. In true “colloidal silver”, however, the free silver ions concentration is determined by the solubility of the metal, which is rather constant for a given dispersion liquid. The “solubilized” atoms are oxidized in water to Ag+ ions until the later reach the equilibrium concentration. As only a very small amount of silver is oxidized, the concentration of silver ions established at equilibrium is very low. Its value depends on particle size (smaller nanoparticles “shed” more atoms due to the higher surface energy) as well as the presence of species in the liquid phase capable to complex silver ions and shift the equilibrium toward the formation of more silver ions.
Given the fact that the silver ions are the species responsible for antimicrobial effect, it would seem that pure ionic silver products should be more effective than the nanoparticles as the concentration of free Ag+ ion is significantly higher for the same total silver concentration. Surprisingly, however, existing research indicates that silver nanoparticles are more effective than silver ions. Lok et al,30 for example, found that the bacterial activity of silver nanoparticles manifests at nanomolar concentration in contrast to the micromolar level recorded for silver ions (a 1000-fold improvement). The higher efficacy of nanoparticles was confirmed by other studies31–33 and attributed to the ability of nanoparticles to kill bacteria by physically altering the properties of the cells wall and entering the intracellular space. This “internalization” capacity makes the nanoparticles more effective transporters of Ag+ inside the cell where the critical transcriptional processes need to be inhibited.
Conclusion
The results of this evaluation show clearly that 10 of 14 products evaluated contain only ionic silver. Despite the evidence showing that silver nanoparticles are not present, eight of these products are promoted by the manufacturers as “colloidal silver”. Considering the extensive scientific research showing major differences between silver ionic and silver nanoparticles in terms of mechanisms of action, efficacy and safety, it is clear that this misrepresentation impacts the consumers and must be addressed. This study serves as blueprint for a scientific protocol to be followed by manufacturers for characterizing their silver supplements. It provides the analytical tools and suggests the metrics they should adopt to ensure that consumers are given accurate information.
Disclosure
Ajeet Kumar is an employee of Ames Advanced Materials Corporation. Dan V Goia reports personal fees from Noble Elements LLC, during the conduct of the study; and has a patent issued: US Patent # 7,842,274 B2, November 30, 2010. The authors report no other potential conflicts of interest in this work.
References
1. De M, Ghosh PS, Rotello VM. Applications of nanoparticles in biology. Adv Mater. 2008;20(22):4225–4241.
2. Ghosh Chaudhuri R, Paria S. Core/shell nanoparticles: classes, properties, synthesis mechanisms, characterization, and applications. Chem Rev. 2012;112(4):2373–2433. doi:10.1021/cr100449n
3. Mallick K, Witcomb M, Scurrell M. Silver nanoparticle catalysed redox reaction: an electron relay effect. Mater Chem Phys. 2006;97(2–3):283–287. doi:10.1016/j.matchemphys.2005.08.011
4. McFarland AD, Van Duyne RP. Single silver nanoparticles as real-time optical sensors with zeptomole sensitivity. Nano Lett. 2003;3(8):1057–1062. doi:10.1021/nl034372s
5. Evanoff DD, Chumanov G. Size-controlled synthesis of nanoparticles. 1. “silver-only” aqueous suspensions via hydrogen reduction. J Phys Chem B. 2004;108(37):13948–13956. doi:10.1021/jp047565s
6. Jana NR, Gearheart L, Murphy CJ. Wet chemical synthesis of silver nanorods and nanowires of controllable aspect ratio. Chem Commun. 2001;7:617–618. doi:10.1039/b100521i
7. Balantrapu K, Goia DV. Silver nanoparticles for printable electronics and biological applications. J Mater Res. 2011;24(09):2828–2836. doi:10.1557/jmr.2009.0336
8. Tabatabaei M, Sangar A, Kazemi-Zanjani N, Torchio P, Merlen A, Lagugné-Labarthet F. Optical properties of silver and gold tetrahedral nanopyramid arrays prepared by nanosphere lithography. J Phys Chem C. 2013;117(28):14778–14786. doi:10.1021/jp405125c
9. Choi SJ, Won JW, Park KM, Chang P-S, New A. Method for determining the emulsion stability index by backscattering light detection. J Food Process Eng. 2014;37(3):229–236. doi:10.1111/jfpe.12078
10. Ankireddy K, Vunnam S, Kellar J, Cross W. Highly conductive short chain carboxylic acid encapsulated silver nanoparticle based inks for direct write technology applications. J Materials Chemistry C. 2013;1(3):572. doi:10.1039/C2TC00336H
11. Elechiguerra JL, Reyes-Gasga J, Yacaman MJ. The role of twinning in shape evolution of anisotropic noble metal nanostructures. J Mater Chem. 2006;16(40):3906. doi:10.1039/b607128g
12. Nge TT, Nogi M, Suganuma K. Electrical functionality of inkjet-printed silver nanoparticle conductive tracks on nanostructured paper compared with those on plastic substrates. J Materials Chemistry C. 2013;1(34):5235. doi:10.1039/c3tc31220h
13. Magdassi S, Grouchko M, Berezin O, Kamyshny A. Triggering the sintering of silver nanoparticles at room temperature. ACS Nano. 2010;4(4):1943–1948. doi:10.1021/nn901868t
14. Lv Y, Liu H, Wang Z, et al. Silver nanoparticle-decorated porous ceramic composite for water treatment. J Memb Sci. 2009;331(1–2):50–56. doi:10.1016/j.memsci.2009.01.007
15. Desireddy A, Conn BE, Guo J, et al. Ultrastable silver nanoparticles. Nature. 2013;501(7467):399–402. doi:10.1038/nature12523
16. Sondi I, Salopek-Sondi B. Silver nanoparticles as antimicrobial agent: a case study on E. coli as a model for Gram-negative bacteria. J Colloid Interface Sci. 2004;275(1):177–182. doi:10.1016/j.jcis.2004.02.012
17. Lee KJ, Browning LM, Nallathamby PD, Xu X-HN. Study of charge-dependent transport and toxicity of peptide-functionalized silver nanoparticles using zebrafish embryos and single nanoparticle plasmonic spectroscopy. Chem Res Toxicol. 2013;26(6):904–917. doi:10.1021/tx400087d
18. Meyer MW, Smith EA. Optimization of silver nanoparticles for surface enhanced Raman spectroscopy of structurally diverse analytes using visible and near-infrared excitation. Analyst. 2011;136(17):3542. doi:10.1039/c0an00851f
19. Durán N, Durán M, de Jesus MB, Seabra AB, Fávaro WJ, Nakazato G. Silver nanoparticles: A new view on mechanistic aspects on antimicrobial activity. Nanomedicine. 2016;12(3):789–799. doi:10.1016/j.nano.2015.11.016
20. Reidy B, Haase A, Luch A, Dawson K, Lynch I. Mechanisms of silver nanoparticle release, transformation and toxicity: a critical review of current knowledge and recommendations for future studies and applications. Materials. 2013;6(6):2295–2350. doi:10.3390/ma6062295
21. Rogers JV, Parkinson CV, Choi YW, Speshock JL, Hussain SM, Preliminary A. Assessment of silver nanoparticle inhibition of monkeypox virus plaque formation. Nanoscale Res Lett. 2008;3(4):129–133. doi:10.1007/s11671-008-9128-2
22. Murdock RC, Braydich-Stolle L, Schrand AM, Schlager JJ, Hussain SM. Characterization of nanomaterial dispersion in solution prior to in vitro exposure using dynamic light scattering technique. Toxicol Sci. 2008;101(2):239–253. doi:10.1093/toxsci/kfm240
23. Suber L, Sondi I, Matijević E, Goia DV. Preparation and the mechanisms of formation of silver particles of different morphologies in homogeneous solutions. J Colloid Interface Sci. 2005;288(2):489–495. doi:10.1016/j.jcis.2005.03.017
24. Zhang Z, Patel RC, Kothari R, Johnson CP, Friberg SE, Aikens PA. Stable silver clusters and nanoparticles prepared in polyacrylate and inverse micellar solutions. J Phys Chem B. 2000;104(6):1176–1182. doi:10.1021/jp991569t
25. Ershov BG, Janata E, Henglein A. Growth of silver particles in aqueous solution: long-lived “magic” clusters and ionic strength effects. J Phys Chem. 1993;97(2):339–343. doi:10.1021/j100104a013
26. Ershov BG, Abkhalimov EA, Sukhov NL. Formation of long-lived clusters and silver nucleation in the γ-irradiation of aqueous silver perchlorate solutions containing polyphosphate. High Energy Chem. 2005;39(2):55–59.
27. Durán N, Marcato PD, Conti RD, Alves OL, Costa FTM, Brocchi M. Potential use of silver nanoparticles on pathogenic bacteria, their toxicity and possible mechanisms of action. J Braz Chem Soc. 2010;21(6):949–959. doi:10.1590/S0103-50532010000600002
28. Hullo M-F, Martin-Verstraete I, Soutourina O. Complex phenotypes of a mutant inactivated for CymR, the global regulator of cysteine metabolism in Bacillus subtilis: pleiotropic role of CymR in Bacillus subtilis. FEMS Microbiol Lett. 2010;no–no. doi:10.1111/j.1574-6968.2010.02043.x
29. Wüthrich D, Irmler S, Berthoud H, Guggenbühl B, Eugster E, Bruggmann R. Conversion of methionine to cysteine in lactobacillus paracasei depends on the highly mobile cysk-ctl-cyse gene cluster. Front Microbiol. 2018;9:2415. doi:10.3389/fmicb.2018.02415
30. Lok C-N, Ho C-M, Chen R, et al. Proteomic analysis of the mode of antibacterial action of silver nanoparticles. J Proteome Res. 2006;5(4):916–924. doi:10.1021/pr0504079
31. Rai MK, Deshmukh SD, Ingle AP, Gade AK. Silver nanoparticles: the powerful nanoweapon against multidrug-resistant bacteria: activity of silver nanoparticles against MDR bacteria. J Appl Microbiol. 2012;112(5):841–852. doi:10.1111/j.1365-2672.2012.05253.x
32. Mirzajani F, Ghassempour A, Aliahmadi A, Esmaeili MA. Antibacterial effect of silver nanoparticles on Staphylococcus aureus. Res Microbiol. 2011;162(5):542–549. doi:10.1016/j.resmic.2011.04.009
33. Sánchez-López E, Gomes D, Esteruelas G, et al. Metal-based nanoparticles as antimicrobial agents: an overview. Nanomaterials. 2020;10(2):292. doi:10.3390/nano10020292
 © 2020 The Author(s). This work is published and licensed by Dove Medical Press Limited. The
full terms of this license are available at https://www.dovepress.com/terms
and incorporate the Creative Commons Attribution
- Non Commercial (unported, 3.0) License.
By accessing the work you hereby accept the Terms. Non-commercial uses of the work are permitted
without any further permission from Dove Medical Press Limited, provided the work is properly
attributed. For permission for commercial use of this work, please see paragraphs 4.2 and 5 of our Terms.
© 2020 The Author(s). This work is published and licensed by Dove Medical Press Limited. The
full terms of this license are available at https://www.dovepress.com/terms
and incorporate the Creative Commons Attribution
- Non Commercial (unported, 3.0) License.
By accessing the work you hereby accept the Terms. Non-commercial uses of the work are permitted
without any further permission from Dove Medical Press Limited, provided the work is properly
attributed. For permission for commercial use of this work, please see paragraphs 4.2 and 5 of our Terms.