Back to Journals » OncoTargets and Therapy » Volume 13
Combining Immunoscore with Clinicopathologic Features in Cholangiocarcinoma: An Influential Prognostic Nomogram
Authors Wu ZY ![]() , Shen W, Yue JQ, Yao WY, Liu SL, Jin YP, Dong P, Ma F, Wu XS, Gong W
, Shen W, Yue JQ, Yao WY, Liu SL, Jin YP, Dong P, Ma F, Wu XS, Gong W
Received 25 August 2020
Accepted for publication 21 October 2020
Published 6 November 2020 Volume 2020:13 Pages 11359—11376
DOI https://doi.org/10.2147/OTT.S274754
Checked for plagiarism Yes
Review by Single anonymous peer review
Peer reviewer comments 2
Editor who approved publication: Dr Leo Jen-Liang Su
Zi-You Wu,1,2 Wei Shen,3 Juan-Qing Yue,4 Wen-Yan Yao,1,2 Shi-Lei Liu,1,2 Yun-Peng Jin,1,2 Ping Dong,1,2 Fei Ma,1,2 Xiang-Song Wu,1,2,* Wei Gong1,2,*
1Department of General Surgery, Xinhua Hospital, Affiliated to Shanghai Jiao Tong University School of Medicine, Shanghai, People’s Republic of China; 2Shanghai Key Laboratory of Biliary Tract Disease Research, Shanghai, People’s Republic of China; 3Shanghai Colorectal Cancer Research Center, Shanghai, People’s Republic of China; 4Department of Pathology, Xinhua Hospital, Affiliated to Shanghai Jiao Tong University School of Medicine, Shanghai, People’s Republic of China
*These authors contributed equally to this work
Correspondence: Xiang-Song Wu; Wei Gong
Department of General Surgery, Xinhua Hospital, Affiliated to Shanghai Jiao Tong University School of Medicine, No. 1665 Kongjiang Road, Shanghai 200092, People’s Republic of China
Tel +86 13651683182
Email [email protected] [email protected]
Purpose: The aim of this study was to determine the Immunoscore as an independent prognostic factor for cholangiocarcinoma and establish a useful prognostic model for postoperative patients.
Methods: This retrospective study was performed to assess the correlation between the clinicopathological features, tumor immune microenvironment, and prognosis of 76 patients with cholangiocarcinoma. Multivariate analysis was used to identify independent factors significantly associated with local recurrence-free survival (LRFS) and overall survival (OS). Finally, we constructed a nomogram combining the Immunoscore with clinicopathologic features to predict postoperative recurrence and OS.
Results: The present study showed that immune cell infiltration was negatively correlated with tumor size, peripheral vascular invasion, lymph node metastasis, and tumor staging. Kaplan–Meier curves indicated that a decreased Immunoscore was associated with poor prognosis. Multivariate analysis demonstrated that resection type, number of tumors, lymph node metastasis, TNM staging, and the Immunoscore were significantly associated with LRFS. For OS, the significantly correlated factors included resection type, peripheral vascular invasion, TNM staging, and the Immunoscore. Immunoscore was superior to TNM staging in predicting both LRFS and OS according to the receiver operating characteristic analysis. Based on the results of the Cox regression analysis, a prognostic nomogram for the postoperative recurrence of cholangiocarcinoma and OS of patients was established.
Conclusion: The results of this study suggest that the Immunoscore may be used as an independent predictor of postoperative recurrence and OS of patients with cholangiocarcinoma. The Immunoscore appears to offer distinct advantages over the TNM staging system. By combining the Immunoscore and clinicopathological features, the proposed nomogram provides a more accurate predictive tool for postoperative patients with cholangiocarcinoma.
Keywords: cholangiocarcinoma, prognosis, immune microenvironment, Immunoscore, nomogram
Introduction
Cholangiocarcinoma (CCA) is a relatively common malignancy arising from the biliary tree. According to the anatomical position, CCA can be divided into intrahepatic cholangiocarcinoma (iCCA), hilar cholangiocarcinoma (hCCA), and distal cholangiocarcinoma (dCCA).1 The epidemiology, biological behavior, pathological types, clinical management, and prognosis of each subtype are significantly distinct. The incidence of hCCA and dCCA is markedly higher than that of iCCA.2 In this article, CCA was classified as cancer that originates from the interior of the liver and the extrahepatic bile duct. CCA exhibits three gross types. iCCA is classified into the mass-forming, periductal-infiltrating, and intraductal growth types. hCCA and dCCA are classified into the nodular-infiltrating, flat-infiltrating, and papillary types. Each of the three gross types corresponds to one by one.
The incidence of CCA is comparatively insidious, and characterized by difficulty for early diagnosis, rapid progression, and complicated anatomy. Surgery is the most crucial treatment for CCA; however, many patients miss the chance for radical surgical resection due to late diagnosis.3,4 Patients with locally advanced, metastatic, or relapsed disease can only receive chemotherapy or other comprehensive treatments. However, these treatments do not result in a satisfactory therapeutic response. Advancements in targeted therapy and immunotherapy offer new hope for patients with CCA, though the specific effects warrant further verification.5,6 Therefore, the current treatment of CCA mainly adopts a multimodal treatment protocol based on radical surgical resection. Even after receiving standard treatment, the high recurrence rate poses substantial challenges to clinical management.
There are several limitations related to the current study regarding the prognosis of CCA, and the systematic prediction of the risk of recurrence or overall survival (OS) is a formidable task. Currently, the TNM staging system is principally used to guide clinical management strategies and risk stratification. There are several types of TNM staging or prognostic tools based on this system, including the Okabayashi staging7 in Japan, Liver Cancer Study Group of Japan staging,8 Johns Hopkins Nathan staging,9 and American Joint Committee on Cancer (AJCC)/TNM staging (7th and 8th editions); the most important among those is the AJCC/TNM staging.2–4 Nonetheless, although international guidelines support the TNM staging system, its limitations remain apparent. For example, even in patients with disease at the same stage, the probability of recurrence and OS may differ considerably. Moreover, lymph node resection is not routinely performed in many countries. Approximately half of the patients with iCCA in the database of SEER do not have a clear lymph node status. Thus, TNM staging cannot make a reliable prediction for the prognosis of those patients. Previous studies showed that tumor biomarkers, such as carcinoembryonic antigen, carbohydrate antigen 199 (CA199), and CA125 may be related to the prognosis of CCA.10 However, no conspicuous predictive value has been found in clinical practice, perhaps due to the potential heterogeneity of tumor cells of CCA.
Recently, active investigation has risen regarding the tumor microenvironment, which is composed of tumor cells, stromal cells (including vascular endothelial cells and mesenchymal stem cells), and extracellular matrix. It is the basis for tumor growth, invasion, and metastasis, and affects the clinical treatment and prognosis of various types of cancer. Studies have shown that the interaction between cancer cells and the tumor microenvironment is bidirectional and dynamic, and the latter is involved in both the promotion and inhibition of tumor occurrence and development.11,12 In particular, the crucial role of the tumor immune microenvironment has become a research hotspot in recent years. Studies found that the degree of immune cell infiltration in the tumor microenvironment is significantly related to restraining tumor progression.12,13 For example, programmed death-ligand 1 (PD-L1) inhibitors reactivate immune cells by blocking the binding of programmed cell death 1 (PD-1) and PD-L1 to upregulate T cell growth and proliferation, particularly cytotoxic CD8+ tumor-infiltrating lymphocytes (CD8+TILs). Furthermore, PD-L1 inhibitors enhance the identification of tumor cells, and activates the attack and killing functions of CD8+TILs to accomplish the anti-tumor effects.14 Outstanding results were shown in malignant tumor therapy, such as malignant melanoma, non-small cell lung cancer, liver cancer, gastric cancer, and kidney cancer.
Galon15,16 established the immune scoring system (Immunoscore) to reveal the critical significance of the host immune status in the prognosis of colon cancer. Through a comprehensive analysis of the numeration and location of CD3+ and CD8+ T cells, the immune status of patients with colon cancer was scored. As a reliable and reproducible quantitative indicator of the immune microenvironment, the Immunoscore is an independent prognostic factor. It predicts prognosis and improves the hierarchical management of patients in clinical practice. Hence, it is essential for the development of immunotherapy.17–20 Thus far, the Immunoscore outperforms the traditional TNM staging in predicting relapse, and the survival status had been confirmed in numerous types of malignant tumors.19,21 However, data on immune infiltration in CCA are currently scarce, and further investigation is warranted.
Nomograms can predict the probability of clinical events, such as recurrence or death, for a specific individual by utilizing clinicopathology variables to construct a statistical prediction model.22,23 The advantage of the nomogram is that it provides a personalized prediction of the risk of clinical events based on specific disease characteristics, which is superior to the estimation of the morbid state by clinicians.22–24 In terms of treatment, the risk of positive margins and lymph node metastasis can be evaluated using a nomogram prior to surgery. In addition, this tool can assist clinicians in identifying patients who will benefit more from the operation. Furthermore, establishing a prognostic model for postoperative patients can forecast the benefits of adjuvant therapy, and the impact of treatment on quality of life; therefore, it can help doctors and patients in decision-making regarding interventions. Thus far, nomograms have been widely used in numerous types of cancer.22 Many researchers use it as an alternative, even the new diagnosis or forecasting criteria. The influence of the immune microenvironment on the occurrence and development of tumors has been well established. The usefulness of the Immunoscore as a prognostic model for patients with tumors has also been confirmed in many types of cancer.
Patients and Methods
Patients and Tissue Samples
Tissue samples from 76 patients (21 and 55 cases with iCCA and extrahepatic cholangiocarcinoma [eCCA], respectively), treated in the Department of General Surgery, Xinhua Hospital affiliated to Shanghai Jiao Tong University School of Medicine (Shanghai, China) from July 2008 to July 2013, were collected. We retrospectively reviewed the clinicopathological characteristics, including age, sex, CA199, CA125, obstructive jaundice, type of resection, tumor number, tumor size, tumor location, tumor grade, tumor staging, peripheral vascular invasion, surrounding tissue invasion, lymph node metastasis, postoperative adjuvant therapy, Ki-67 proliferation index, CerbB2, vascular endothelial growth factor (VEGF), epidermal growth factor receptor (EGFR), and microsatellite instability (MSI) (Table 1). Considering that tumor-specific treatments prior to surgery may affect the immune microenvironment and expression of other target proteins,11 we excluded patients who had received tumor-specific treatment before surgery, such as chemotherapy or radiation therapy. Obstructive jaundice was judged according to clinical symptoms and liver function (bilirubin levels) prior to the operation. Tumor grade and tumor stage were evaluated according to the 8th edition of the AJCC/TNM staging system for iCCA and eCCA. Peripheral vascular invasion and surrounding tissue invasion were diagnosed by preoperative imaging, including contrast-enhanced computed tomography or magnetic resonance imaging of the abdomen, and confirmed through histopathological evaluation by an anatomical pathologist.25 The Ki-67 proliferation index, CerbB2, VEGF, EGFR, and MSI were obtained from the pathological report prepared by the Department of Pathology.
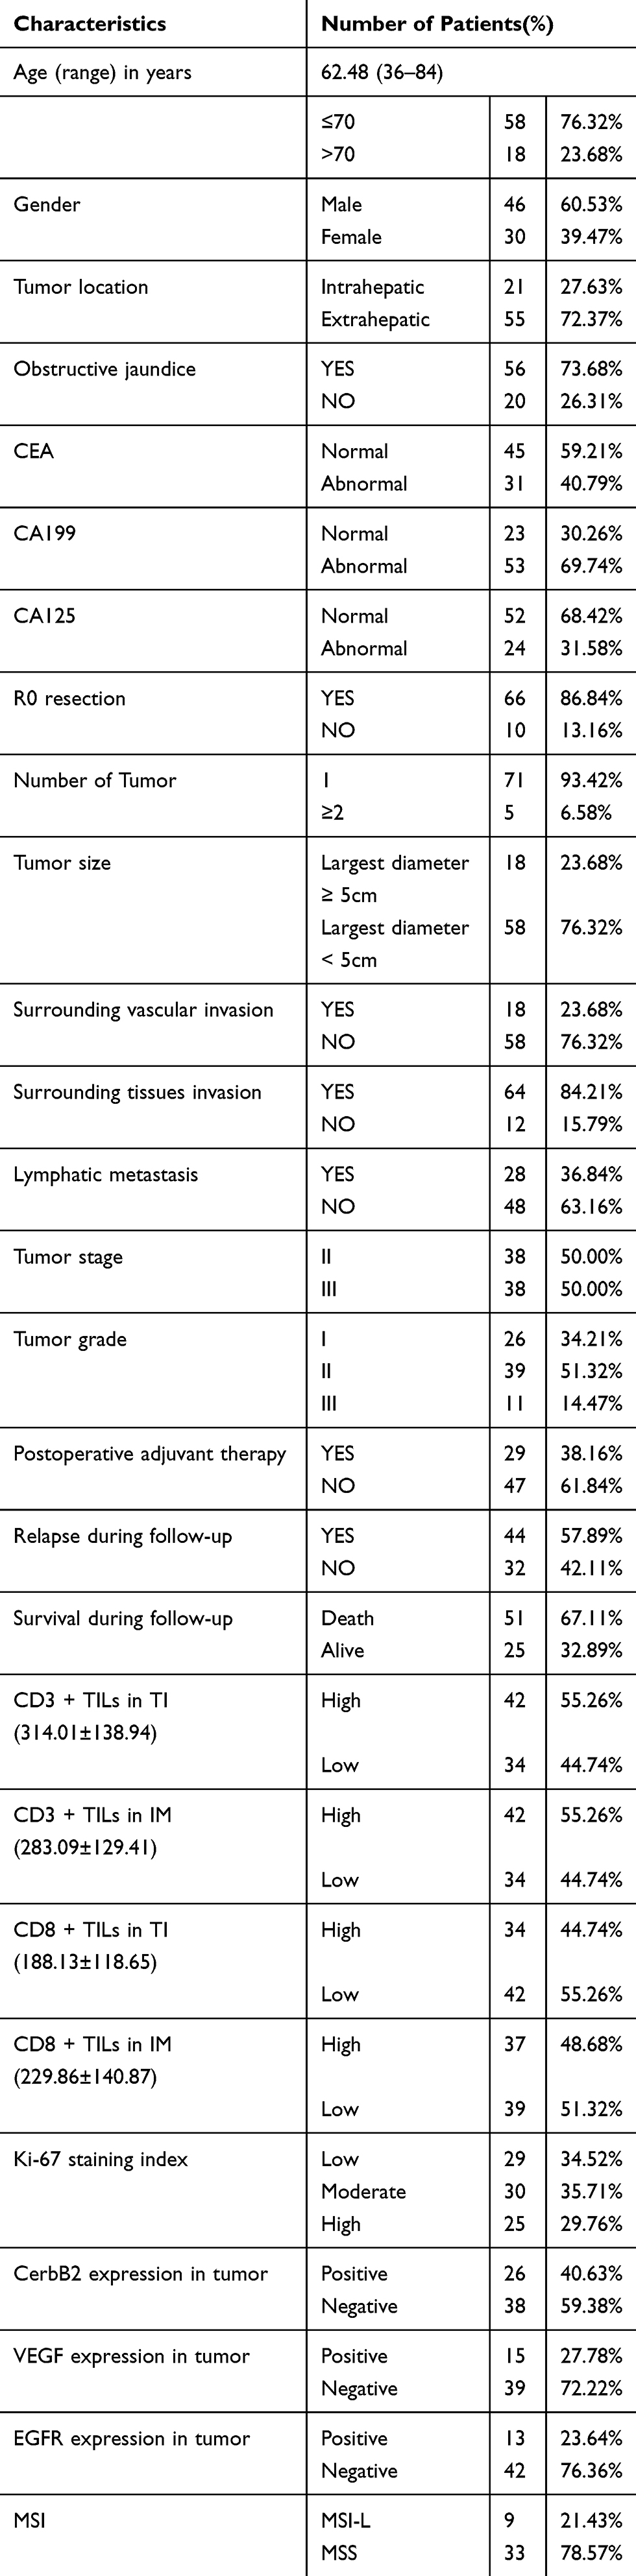 |
Table 1 Summary of Patient Characteristics |
Following surgery, the tissue samples were fixed in 10% formalin buffer, embedded in paraffin, and sliced into tissue sections (thickness: 4 µm). The histopathological examination of hematoxylin and eosin (HE)-stained tissue sections was performed according to the criteria described in previous studies,2,3,26 and the diagnosis of CCA was independently reached by two experienced pathologists. This study was conducted in accordance with the Declaration of Helsinki, and was approved by the Ethics Committee of Xinhua Hospital affiliated to Shanghai Jiao Tong University School of Medicine. Informed consent was provided by the patients prior to participation.
Clinical Management and Patient Follow-Up
Blood routine, liver function, renal function, blood coagulation routine, serological tumor index, indocyanine green retention at 15 min, abdominal enhanced computed tomography, abdominal enhanced magnetic resonance imaging, and three-dimensional visualization technique were performed prior to the operation. The resectability of the tumor was determined by evaluating the general condition and other important organ functions, liver reserve function, and tumor stage. Following the individualized evaluation of the patients, the best surgical strategy was formulated, and R0 resection was achieved as far as possible on the premise of protecting the functions of important nerves, blood vessels, and organs. The specific mode of operation is chosen by the chief surgeon according to the condition of the patient during the operation. For these patients, the aforementioned laboratory measurements were collected before the first operation.
Patients were followed up clinically and radiologically every 3 months after surgery, and the hospital review or medical records for other reasons were also analyzed. Histopathological of the second operation or imaging examinations were performed to diagnose tumor recurrence. The endpoint of the follow-up was defined as local recurrence and death related to any cause, while patient prognosis was defined as local recurrence-free survival (LRFS; time from tumor resection to the first diagnosis of local recurrence) and OS (interval from the date of surgery to death due to any cause). At the end of the follow-up, the observations were reviewed.
Immunohistochemistry
Paraffin sections were dewaxed thrice in xylene, rehydrated with a series of different concentrations of ethanol, rinsed with distilled water, and placed in citric acid antigen retrieval buffer (pH6.0) in a microwave oven (at medium heat for 15 min) for antigen retrieval. After cooling, the sections were washed thrice with phosphate-buffered saline for 5 min, and incubated in 3% H2O2 in the dark for 25 min to block endogenous peroxidase. Subsequently, the tissue was covered with 3% albumin from bovine serum, blocked at room temperature for 30 min for serum blocking, and incubated with CD-3 antibody (#ab231451; Abcam) at 1:300 dilution and CD8 antibody (#ab85792; Abcam) at 1:300 dilution at 4°C overnight; of note, water was added to the wet box to prevent evaporation of the antibodies. The next day, sections were incubated with horseradish peroxidase-conjugated secondary reagents for 50 min at room temperature. After washing with phosphate-buffered saline, freshly 3,3ʹ-diaminobenzidine solution was added for development, and the time-controlled color development was performed under a microscope; brown color indicated positivity. After counter-staining with hematoxylin for 3 min, the sections were rinsed and differentiated with hematoxylin differentiation solution for a few seconds, until hematoxylin returned to blue color. Finally, the sections were dehydrated using a series of different concentrations of alcohol and xylene, and sealed with gum. The negative control section was incubated with phosphate-buffered saline instead of the primary antibody (Figure 1A), and the positive control section was obtained from healthy lymph node tissue.18,27 (Figure 1B)
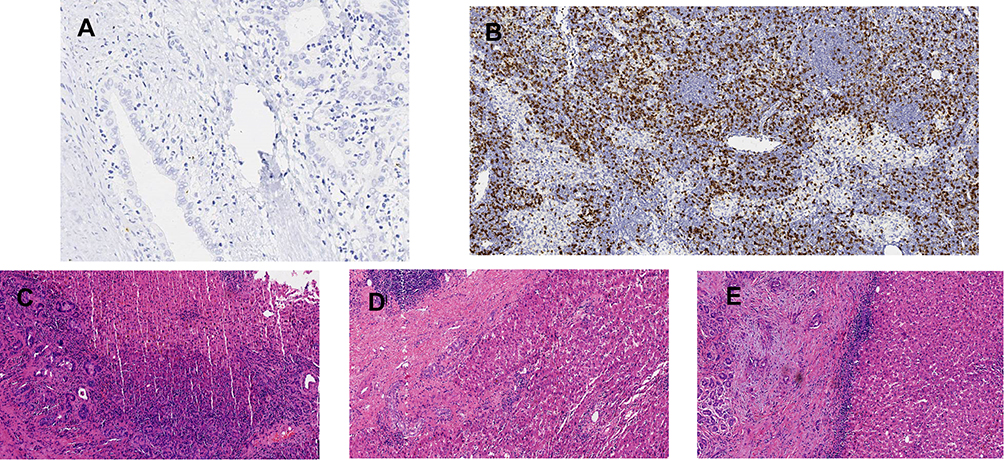 |
Figure 1 Immunohistochemistry control. (A) the negative control sections incubated with phosphate buffer saline instead of the primary antibody; (B) the positive control sections taken from lymph node tissue; (C) the overall TILs level of rare/few was evaluated in HE; (D) the overall TILs level of moderate was evaluated in HE; (E) the overall TILs level of prominent was evaluated in HE. |
Immunohistochemical Evaluation
Semi-Quantitative Analysis
Immunostaining sections were independently interpreted and scored under the microscope by two experienced pathologists who were blinded to the clinical data. Disagreements in interpretation and scoring were resolved through discussion. According to previous studies,16,21 the overall number of TILs was evaluated using HE-stained sections. According to the densities of TILs, the scores were none (0), rare (1), moderate (2), and abundant (3) (Figure 1C–E). Tissue specimens were classified as negative (score: 0–1) or positive (score: 2–3).
Automatic Quantitative Analysis
Sections were scanned using a digital pathological slice scanner (PRECICE 500B; Unic-tech Company), and the iViewer software of the device was used for image interpretation. Firstly, the whole film was observed at 100× multiples, combined with HE staining to identify the tumor interior (TI) and invasive margin (IM), and enlarged to 400× multiples to capture two image areas with the highest TIL density at each region using the screenshot function. For slides stained with CD3 or CD8, two high-density images both in the TI and IM regions were captured, respectively. The Image-Pro plus 6.0 software was used for computer-assisted image analysis to measure the numeration of positive staining cells and recorded in mm2. The density of each of the TIL subgroup regions was recorded separately. Each lymphocyte subgroup in TI and IM is classified into two categories according to the cut-off threshold (0 and 1 denote low and high, respectively). Binary scores for each immune cell type in different tumor regions are determined according to the cut-off threshold.17,18,20 (Figure 2). The Immunoscore for each patient was obtained by the sum of four binary score values and ranged from 0 to 4. For example, Im0 indicates that CD3 and CD8 showed low density in both tumor areas; Im1 denotes one high density and three low densities; and Im4 represented high densities for the two markers in both regions. According to this rule, five patient groups were defined: Im0; Im1; Im2; Im3; and Im4 (Figure 3).
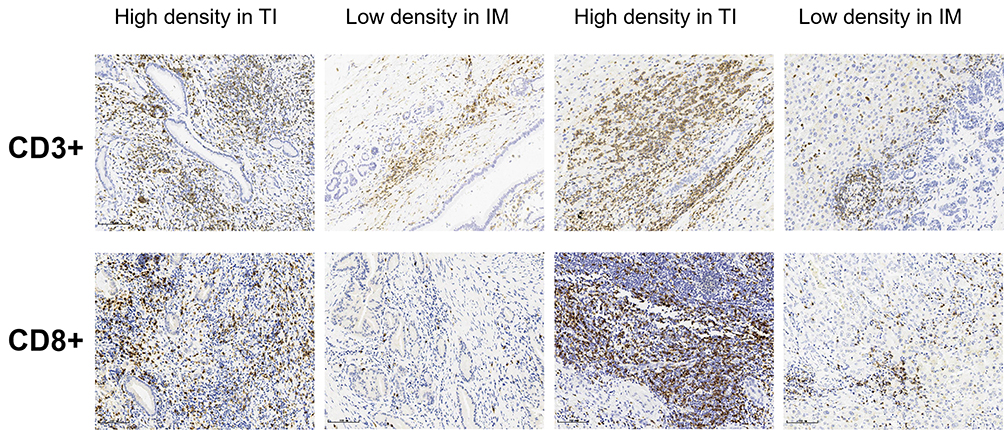 |
Figure 2 Representatively images of immunohistochemistry. According to the cut-off thresholds, tumor-infiltrating lymphocytes density of CD3+ and CD8+ at TI and IM were categorized into high density or low density. Each patient’s Immunocore obtained by the sum of four binary score values. |
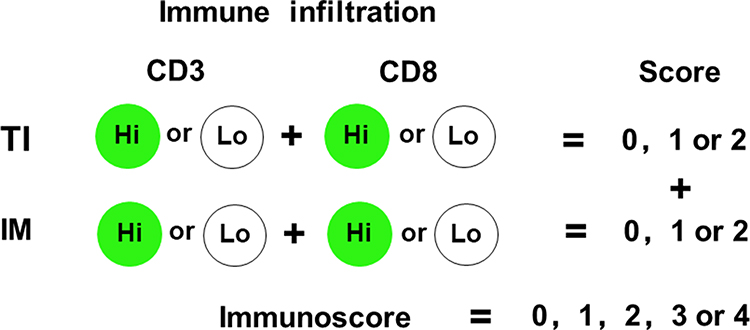 |
Figure 3 Immunoscore model. Immunoscore was established based on the numeration of two lymphocyte populations (CD3+ and CD8+) distributed in the TI and IM regions of cholangiocarcinoma. Precise quantification performed on slide sections using a computer-assisted image analysis software. Densities of each immune cell in TI and IM were categorized into Hi or Lo density according to the cut-off value. Each patient’s Immunocore obtained by the sum of four binary score values. According to this rule, patients were stratified into 5 groups, ranging from I0 to I4. For example, I4 means that both immune cells with high densities in each tumor region, and I0 means that both cells with low densities at each tumor region. |
Statistical Analysis
All statistical analyses were performed using SPSS version 17.0 (SPSS Inc., Chicago, IL, USA) and the R programming language. Quantitative data were expressed as the mean ± standard deviation. The density of CD3+TILs and CD8+TILs in TI and IM satisfied the normal distribution after testing. The association between the densities of TIL subtypes and the dichotomous variable was analyzed using Student’s t-test, and the respective value of t-tests was selected based on the results of the Levene’s variance equality test. The one-way analysis of variance test was utilized to analyze the association between densities of TILs and polytomous variables. The least significant difference t-test was employed to perform multiple comparisons between multiple samples means. The chi-squared test or Wilcoxon rank-sum test was used to analyze the categorical variables, where appropriate. The cut-off threshold for the density of CD3+ and CD8+ TILs in each region was obtained through the “minimum P-value” approach, and corrected by 100-fold cross-validations (the cut-off thresholds for CD3+ and CD8+ TILs were: TI, 285.71 cells/mm2 and 182.69 cells/mm2; and IM, 276.09 cells/mm2 and 231.59 cells/mm2, respectively).27,28 LRFS and OS were analyzed through Kaplan–Meier curves, and the Log rank test was used to assess the significance of the univariate survival analysis. Independent risk factors affecting relapse and OS were assessed using the Cox proportional hazards model. Receiver operating characteristic curves were used to compare the sensitivity and specificity of the Immunoscore and TNM staging in predicting LRFS and OS. Finally, we used the nomogram to establish a predictive model of prognosis. All tests were bilateral, and p-values ≤0.05 denoted statistically significant differences.
The nomogram was based on the results of the multivariate regression analysis, and compiled using the RMS package in R version 3.6.2 (http://www.R-project.org/). Moreover, it was subjected to bootstrap resamples for internal validation to decrease the over-fitting bias. The bootstrap corrected concordance index (C-index) was calculated and used to predict the performance of the nomogram, which indicates the probability of consistency between relapse or OS calculated using the model and the actual observation. The C-index ranges from 0 to 1. Higher C-index values denote more accurate predictions.24,29
Results
Patient Characteristics
All patients underwent surgery prior to July 2013, and were followed up until July 2018. None of the patients were lost to follow-up. The median LRFS and median OS were 11.87 months and 19.72 months, respectively. Using the Kaplan–Meier method, the probability of LRFS at 1 year, 3 years, and 5 years was 63.2%, 38.5%, and 17.0%, respectively. The probability of OS was 57.1%, 39.7%, and 21.5%, respectively. Other clinicopathological features are shown in Table 1. Among the 21 cases of iCCA, there were six, 12, and three cases of mass-forming, periductal-infiltrating, and intraductal growth types, respectively. Among the 55 cases of eCCA, there were 23, 19, and 13 cases of nodular-infiltrating, flat-infiltrating, and papillary types, respectively. Chi-squared analysis did not reveal a significant difference between the two groups (P=0.202).
Description of the Overall TILs, CD3 and CD8 Expression, and Immunoscore
In the semi-quantitative analysis, we found that TILs were present in TI and IM in all CCA specimens by examining HE-stained sections. The overall TIL infiltration was categorized into four types: no immune-infiltrating lymphocytes; sparse or scattered lymphocytes; diffusely uniformly distributed lymphocytes; and dense nodular lymphocyte populations.21 In the present study, the overall TILs levels were distributed in 76 patients as follows: rare/few (21 patients, 27.60%); moderate (33 patients, 43.40%); and abundant (22 patients, 28.90%) (Table 1).
The expression of CD3 and CD8 was detected in tumor samples of all patients through the use of computer automatic quantitative analysis software. The expression in both regions varied among individuals, and the number of positive lymphocytes in TI and IM was similar. The highest and lowest cell density was exhibited by CD3+TILs in TI (314.01±138.94 cells/mm2) and CD8+TILs in TI (188.13±118.65 cells/mm2), respectively (Table 1). For the distribution of the Immunoscore in this study, the I0, I1, I2, I3, and I4 were 18 (23.69%), 13 (17.10%), 14 (18.42%), 15 (19.74%), and 16 (21.05%) cases, respectively.
Association Between Immune Infiltration and Clinicopathological Parameters
Of note, the overall TIL levels had no significant correlation with clinicopathological data (Table 2). Similarly, the densities of TIL subtypes, including CD3+TILs and CD8+TILs, also had no significant correlation with the overall TIL levels. These observations may be related to the high intratumoral heterogeneity or to our insufficiently representative data in this study.
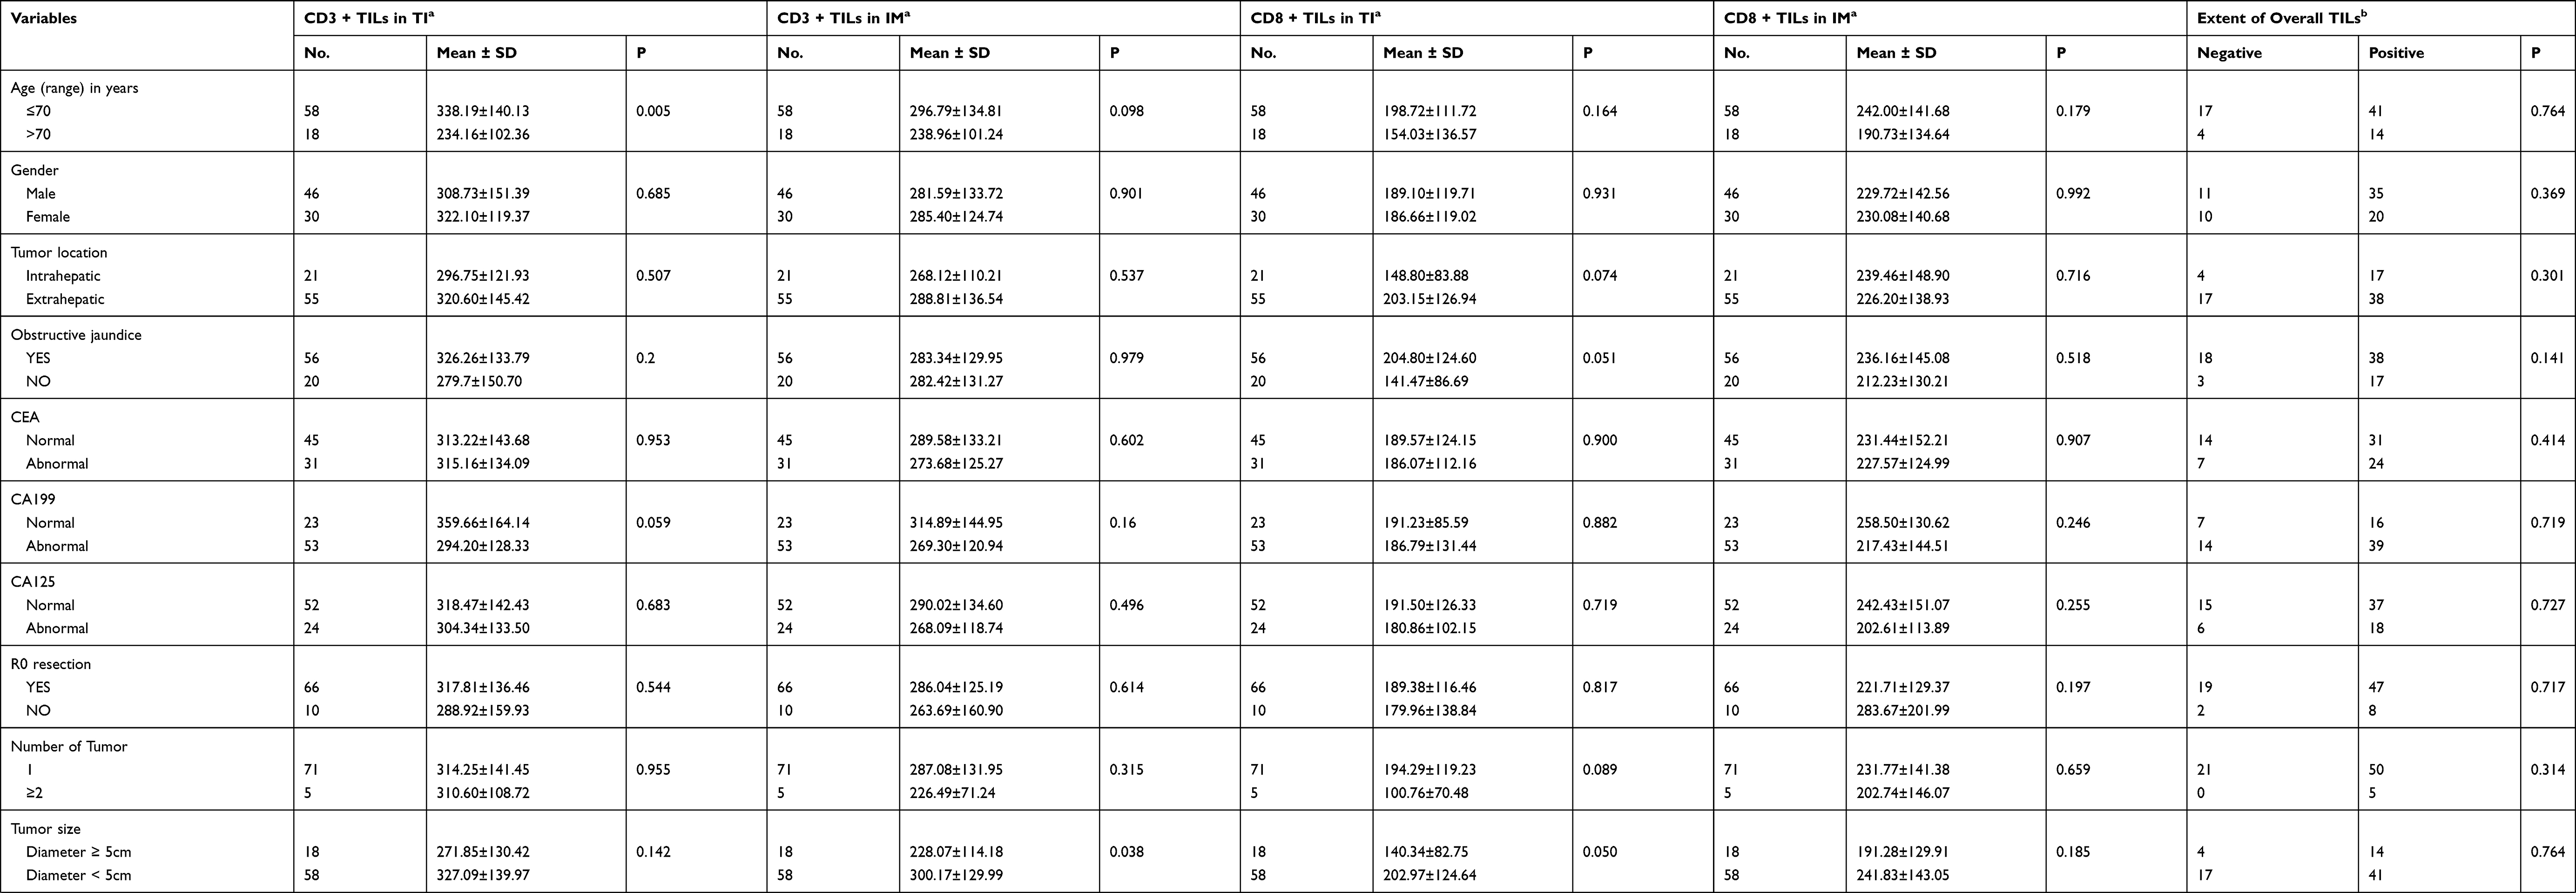 |
Table 2 Association Between Immune Infiltration and Clinicopathological Parameters |
The density of CD3+TILs in TI was inversely related to age. In elderly patients aged >70 years, the density of CD3+TILs was 234.16±102.36 cells/mm2, which was significantly less than that of CD3+TILs (338.19±140.13 cells/mm2) in patients aged <70 years (P=0.005). However, this relationship was not evident in other TIL subgroups. In patients with tumors of diameter >5 cm, the density of CD3+TILs in IM and CD8+TILs in TI showed a significant decline (P=0.038 and P=0.050, respectively). The reason for this finding may be that the tumor exerts an inhibitory effect on the immune microenvironment when it grows to a specific size. In tumors that had invaded peripheral blood vessels, the density of CD8+TILs was significantly decreased to that of patients in whom the tumors had not invaded blood vessels. Among the 76 patients, peripheral blood vessel invasion was noted in 18 patients, and the densities of CD8+TILs in TI and IM in these patients were 133.26±112.10 and 164.36±127.97 cells/mm2, respectively. Among the remaining 58 patients without vascular invasion, the density was 205.17±116.32 (P=0.024) and 250.19±139.47 cells/mm2 (P=0.023), respectively. However, the surrounding tissue invasion was not significantly associated with differences in TIL density. Lymph node metastasis and TNM staging showed a conspicuous negative correlation with immune infiltration. Particularly in TNM staging, all TIL subgroups had a negative correlation with tumor staging; P-values of CD8+TILs in TI and IM were 0.001 and 0.027, respectively. This indicates that advanced tumor stages are linked to more pronounced effects on the immune microenvironment. Notably, TIL densities in CCA patients with CerbB2-positive expression were markedly higher than those observed in patients with CerbB2-negative expression. This suggests that the expression of CerbB2 plays a role in tumor immune microenvironment changes and is correlated with the pathogenesis of CCA. Nevertheless, the elucidation of this mechanism warrants further research. The high-frequency mutation (36.8%) of the ErbB signaling pathway in gallbladder cancer, confirmed by whole somatic mutation spectrum in the Department of General Surgery, Xinhua Hospital affiliated to Shanghai Jiao Tong University School of Medicine, may have some association with this mechanism. The ERBB2/3 signaling pathway promotes the progression of gallbladder cancer by upregulating PD-L1 cellular immune escape.30,31 This suggests the presence of similar pathways in CCA, and may assist in the further development of immunotherapy for CCA in the future. We did not detect a noticeable correlation of VEGF, EGFR, MSI, or other factors with tumor immune infiltration (Table 2). Similarly, correlation analysis of the Immunoscore and clinicopathological data showed significant correlations between the Immunoscore and tumor size (P=0.034), peripheral vascular invasion (P=0.008), lymphatic metastasis (P=0.018), TNM staging (P=0.001), tumor grade (P=0.039), and CerbB2 (P=0.004) (by Wilcoxon rank-sum test).
Impact of Immune Infiltration and Clinical Parameters on LRFS and OS
The Kaplan–Meier curve was used for the univariate analysis of the correlation between clinicopathological data and prognosis (Table 3). The number of tumors was significantly negatively correlated with LRFS (median: 22.87 vs 8.7 months; P=0.033, Log rank test). The risk of recurrence was significantly increased in patients with lymph node metastasis versus those without metastasis (median: 18.33 vs 34.15 months, respectively; P=0.018, Log rank test). Univariate analysis indicated a marked negative correlation between LRFS and TNM staging (median: 9.00 vs 40.93 months; P=0.008, Log rank test) (Table 3). For the TIL subgroups, the densities in the TI and IM regions were jointly analyzed. According to the method of density binary classification described in previous studies, LoLo is a type with low density of CD3+TILs and CD8+TILs in both regions, LoHi/HiLo is a type with high density of CD3+TILs or CD8+TILs in a single tumor area, and HiHi is a type with high density of CD3+TILs and CD8+TILs in both regions. In the joint analysis, CD3+TILs and CD8+TILs showed a strong positive correlation with LRFS. Subgroup analysis showed that the median LRFS between the HiHi and LoLo groups in CD3+ TILs was 44.40 versus 8.57 months, respectively (corrected P=0.0006, Log rank test) (Figure 4A), and 40.93 versus 8.97 months, respectively in CD8+TILs (corrected P=0.0012, Log rank test) (Figure 4B). The Immunoscore significantly positively affected LRFS (Figure 4C); the median LRFS of I0, I1, I2, I3, and I4 was 6.87, 12.90, 25.70, 40.93, and 60.00 months, respectively (P<0.0001) (Table 4).
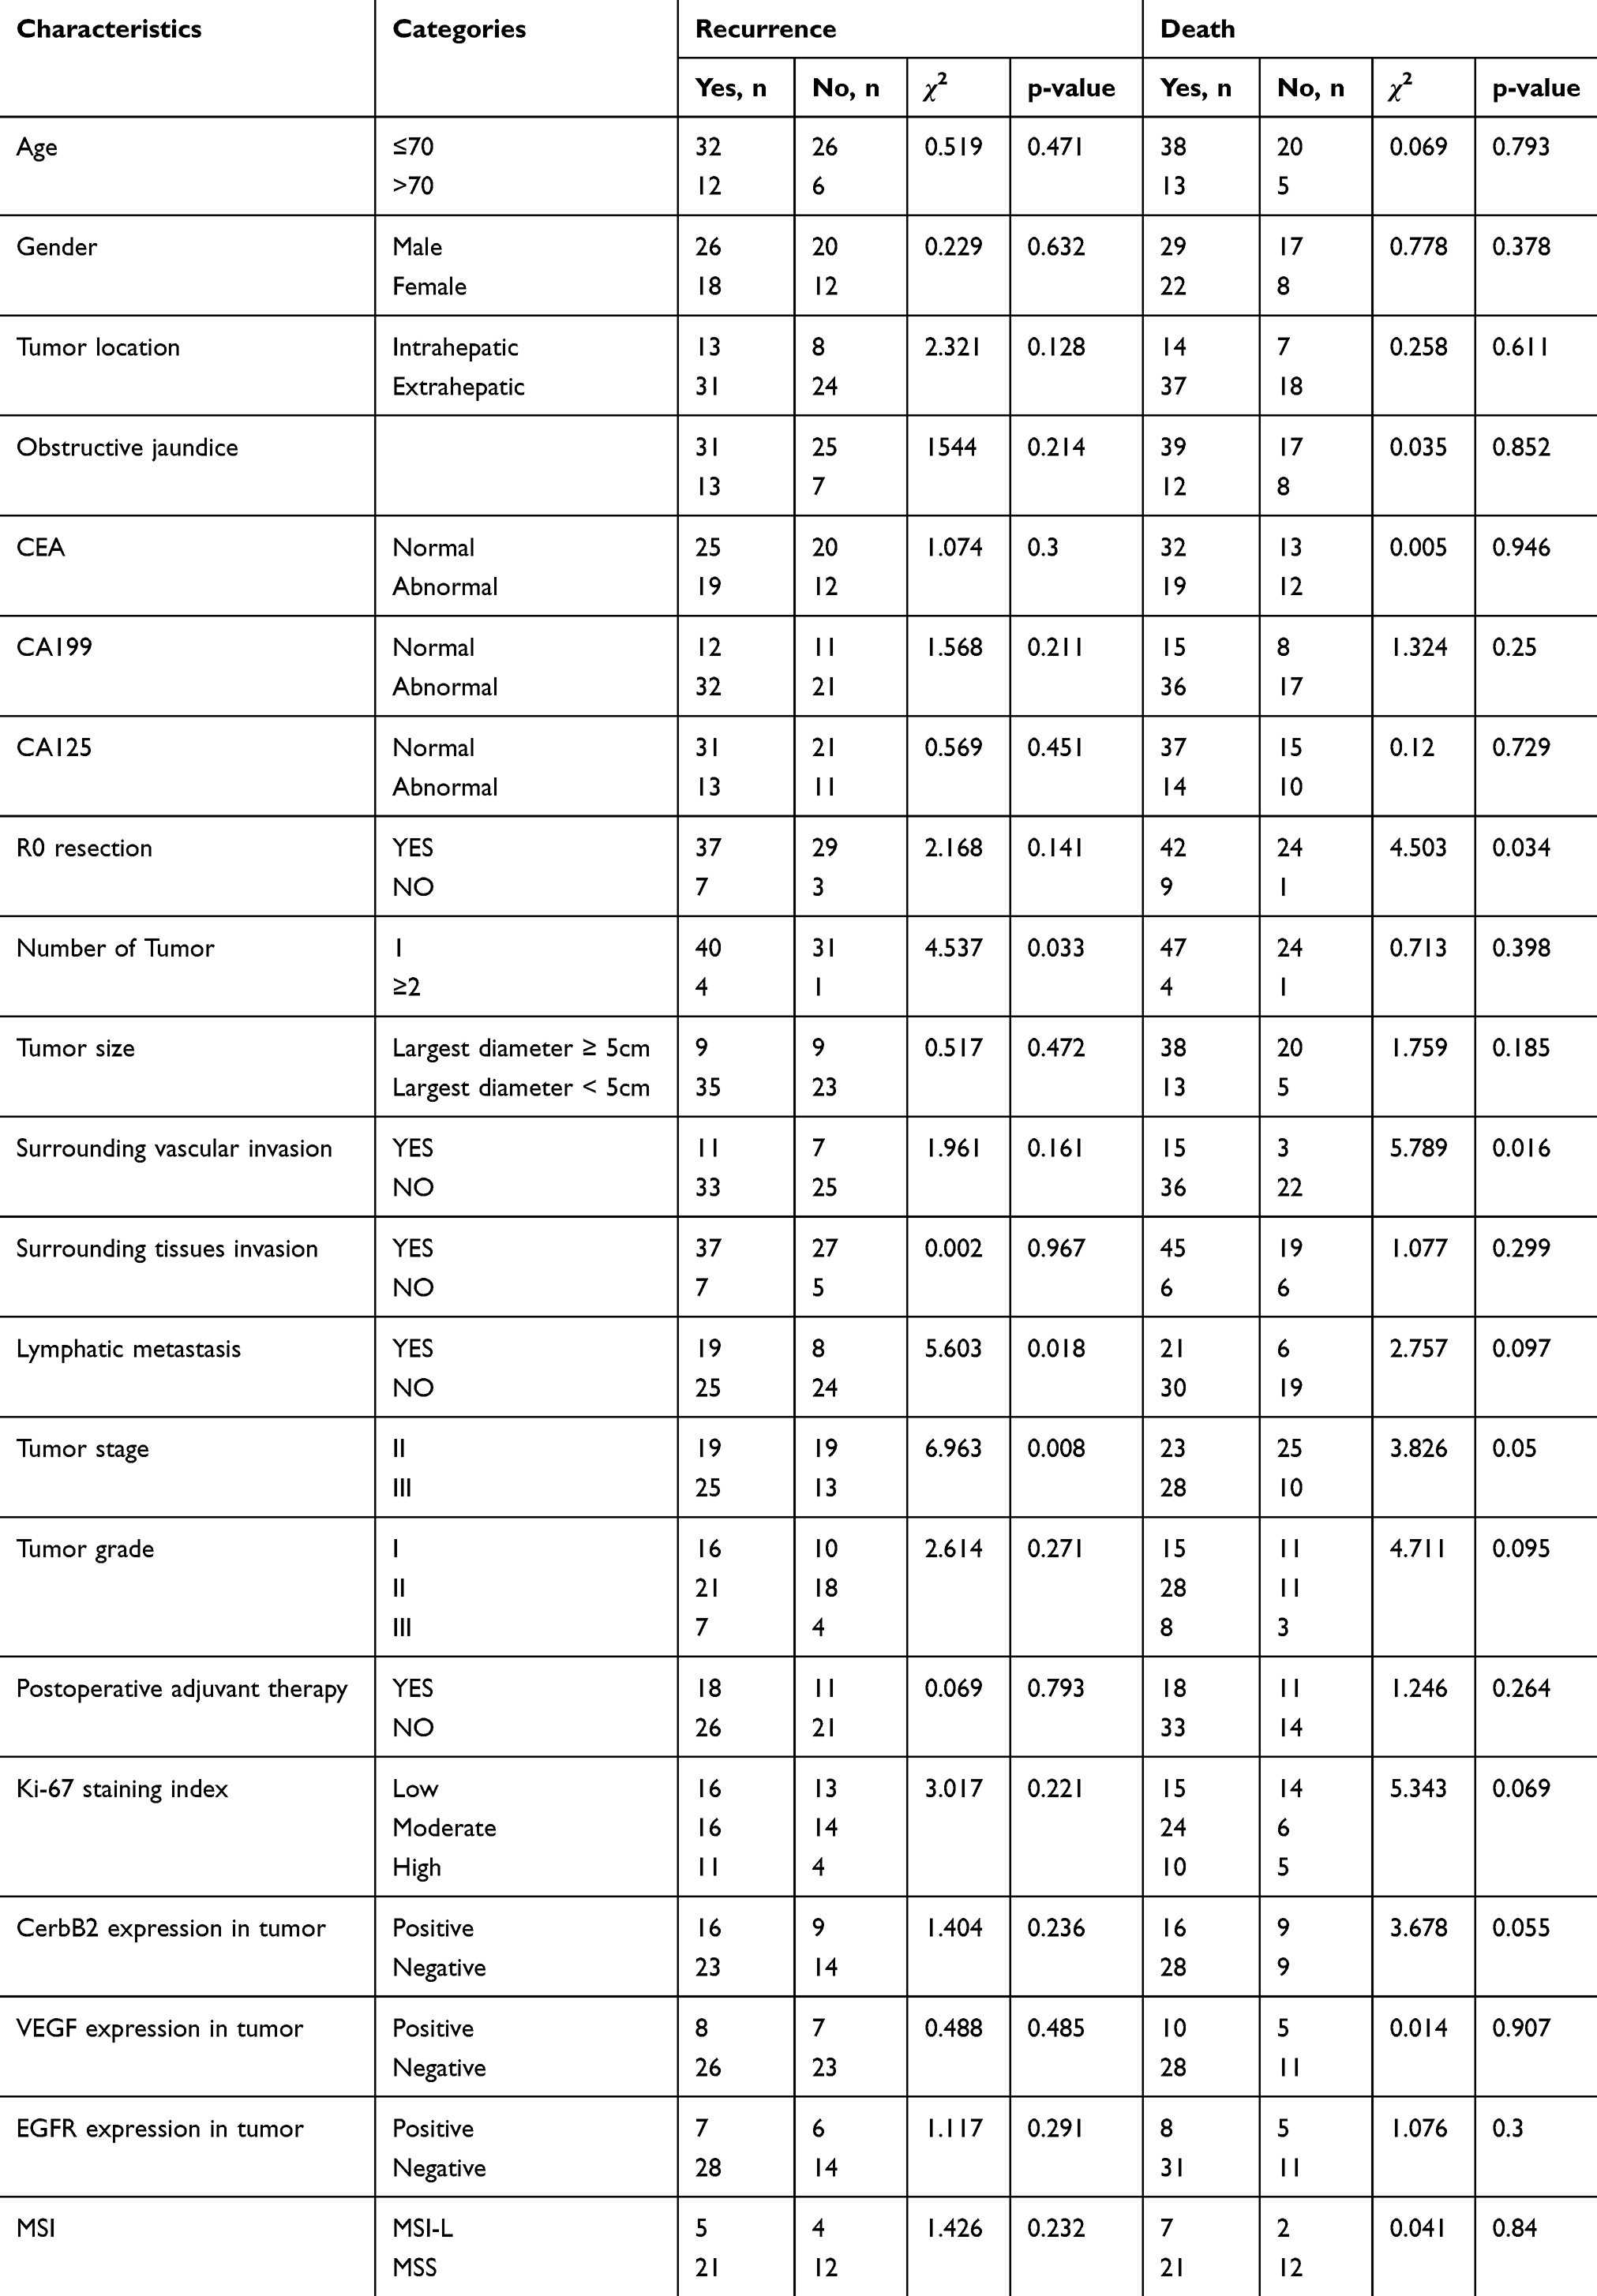 |
Table 3 Correlation Between Clinicopathological Parameters and Prognosis |
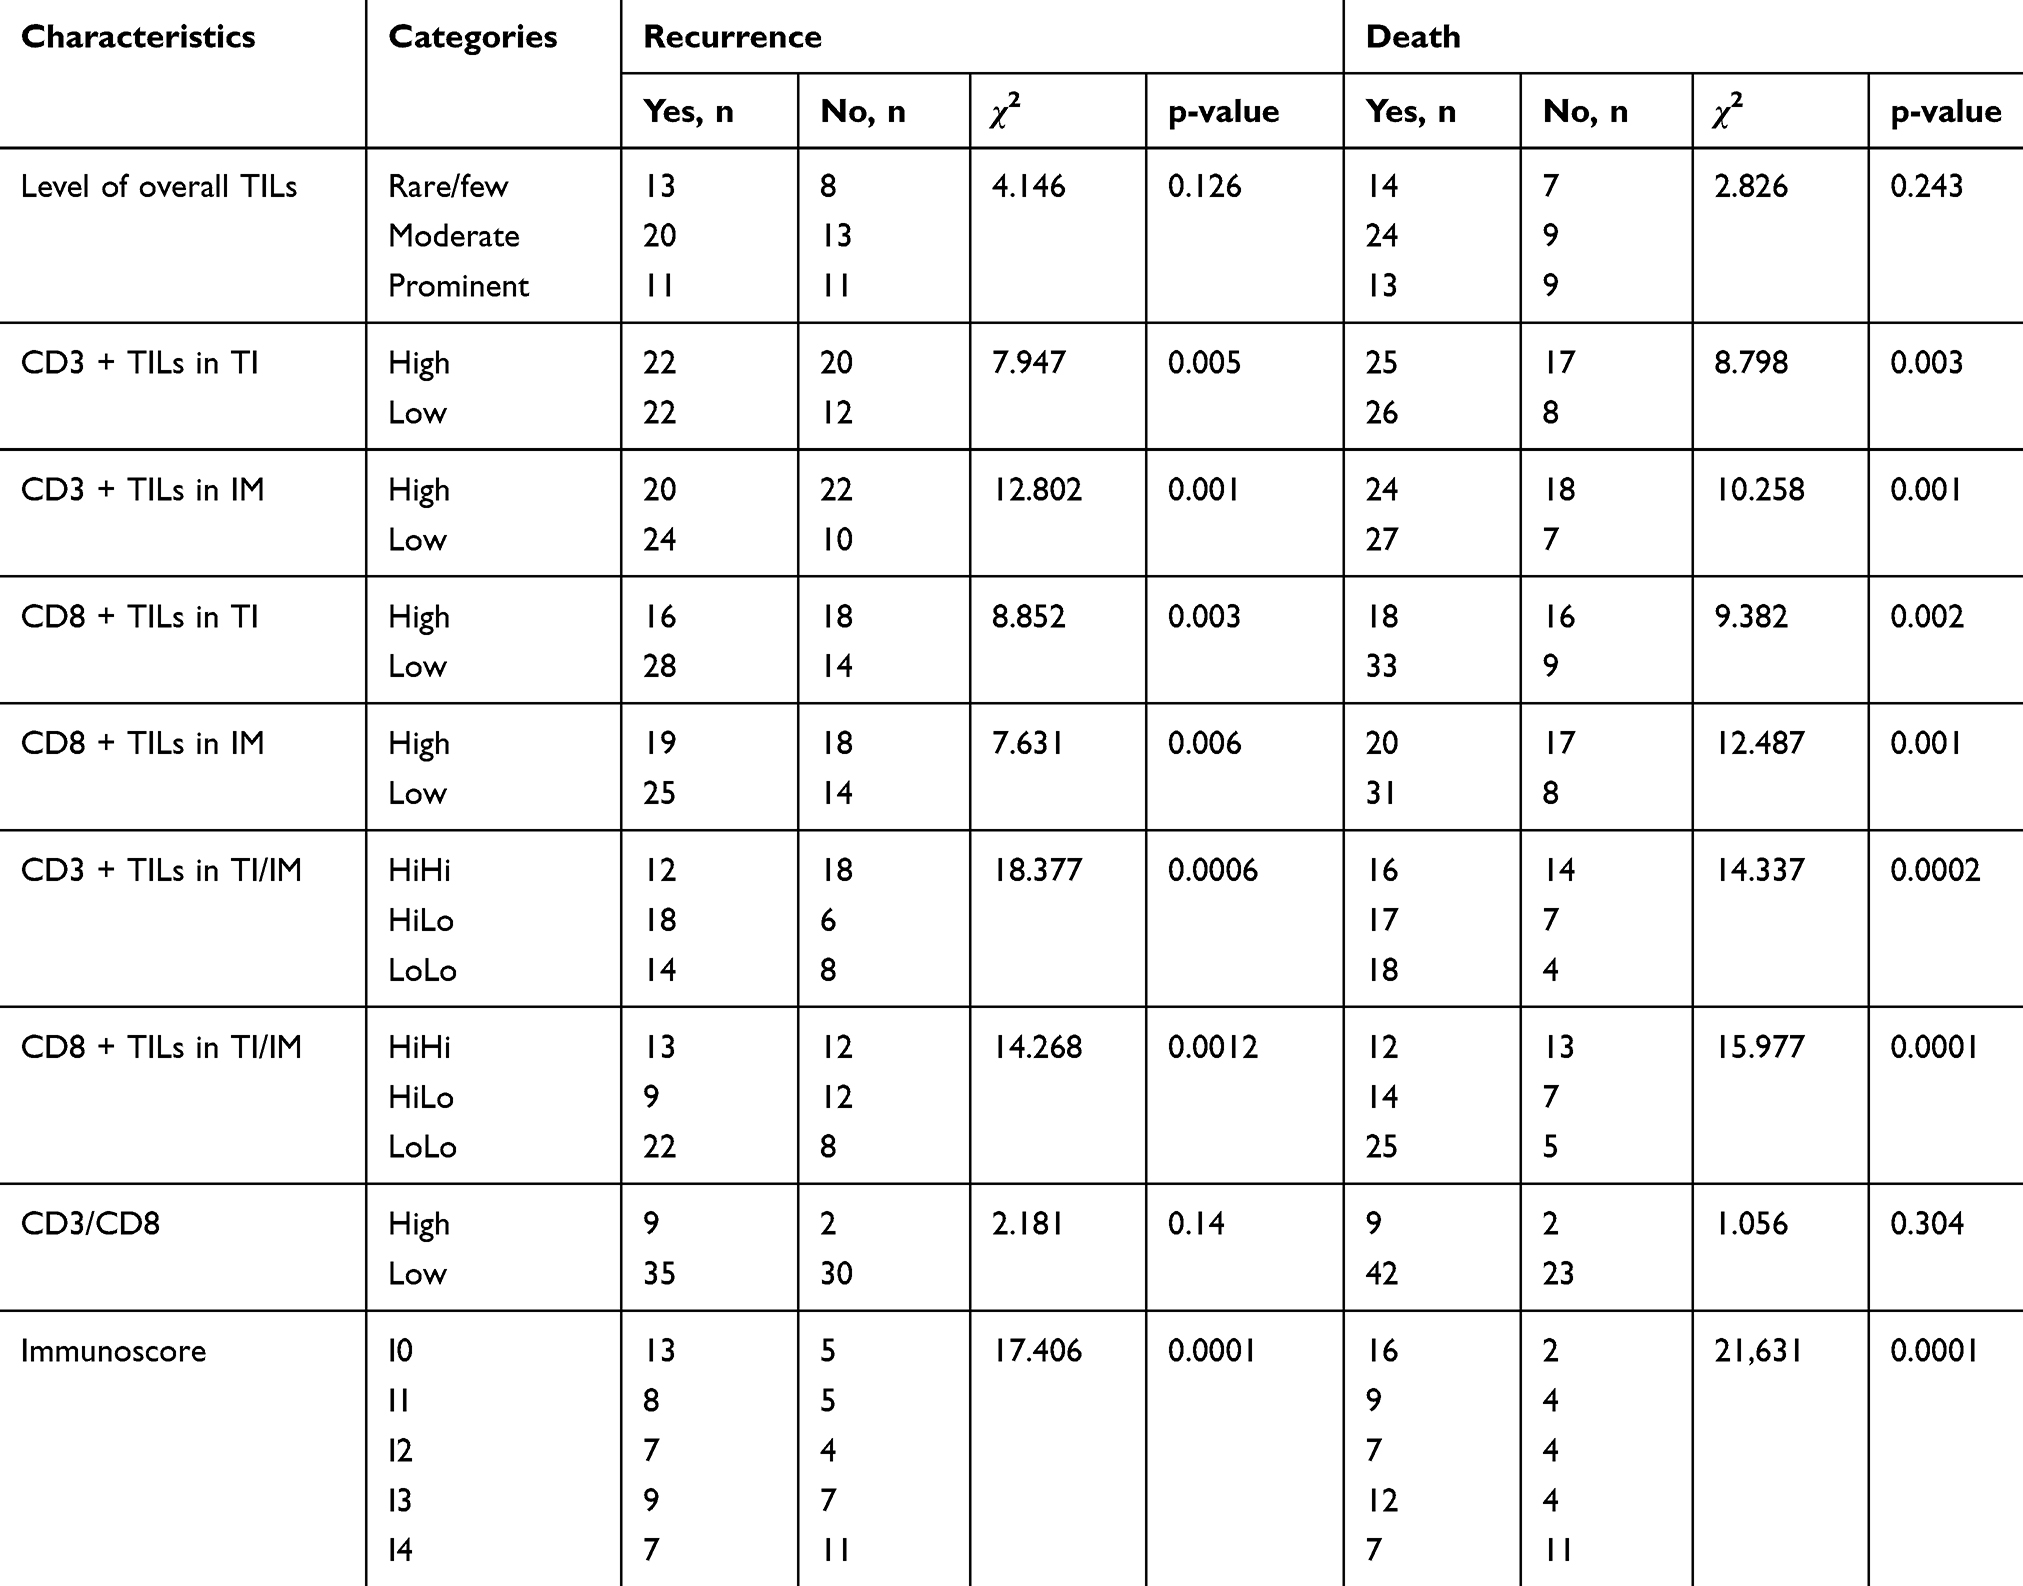 |
Table 4 Correlation Between TILs, Immunoscore and Prognosis |
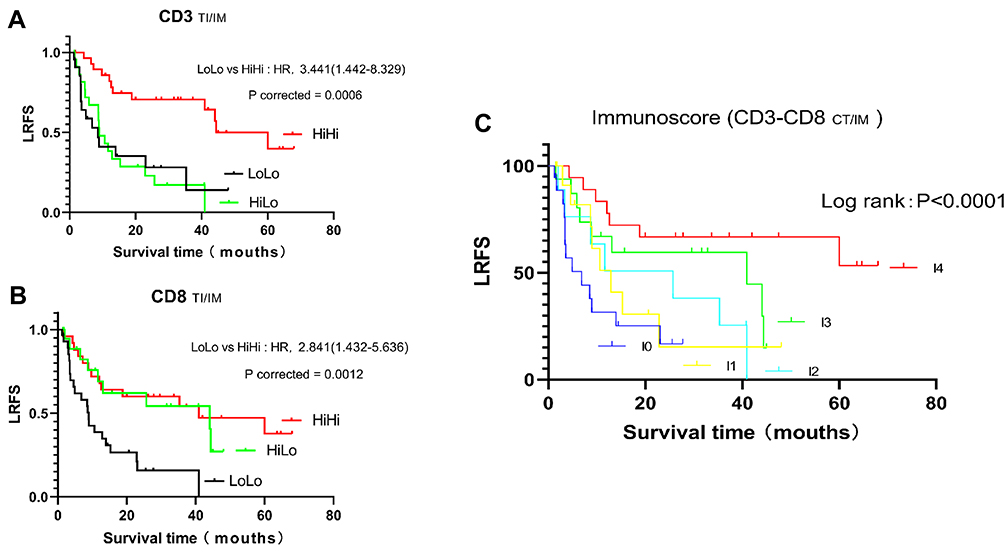 |
Figure 4 Kaplan–Meier curve analysis of LRFS in cholangiocarcinoma patients. (A) Kaplan–Meier curves for LRFS according to T-cell (CD3+) density evaluated in combined tumor regions (TI and IM). (B) Kaplan–Meier curves for LRFS according to cytotoxic T-cell (CD8+) density evaluated in combined tumor regions (TI and IM). Patients at risk at each interval in the Kaplan–Meier survival curves for the duration of LRFS are shown. (C) Kaplan–Meier curves comparing LRFS in patients with different Immunoscores. |
Univariate analysis showed that variables, such as resection type, peripheral vascular invasion, and TNM staging were significantly related to OS (Table 3). The analysis indicated that achievement of R0 resection was associated with significantly prolonged OS versus incomplete resection (median: 24.87 vs 7.37 months, respectively; P=0.034, Log rank test). The median OS of patients with or without peripheral vascular invasion was significantly different (median: 19.43 vs 32.97 months, respectively; P=0.016, Log rank test). For TNM staging, a significant negative correlation with OS was observed (median: 32.03 vs 13.93 months; P=0.050, Log rank test). The joint analysis showed a strong positive correlation between the density of CD3+TILs and CD8+TILs with OS. In the subgroup analysis, the median OS between HiHi and LoLo groups in CD3+TILs was 49.40 versus 9.70 months, respectively (corrected P=0.0002, Log rank test) (Figure 5A), and 46.67 versus 9.87 months, respectively in CD8+TILs (corrected P=0.0001, Log rank test) (Figure 5B). The Immunoscore significantly affected OS (Figure 5C); the median OS of I0, I1, I2, I3, and I4 was 9.70, 10.03, 21.86, 46.67, and 60.20 months, respectively (P<0.0001) (Table 4).
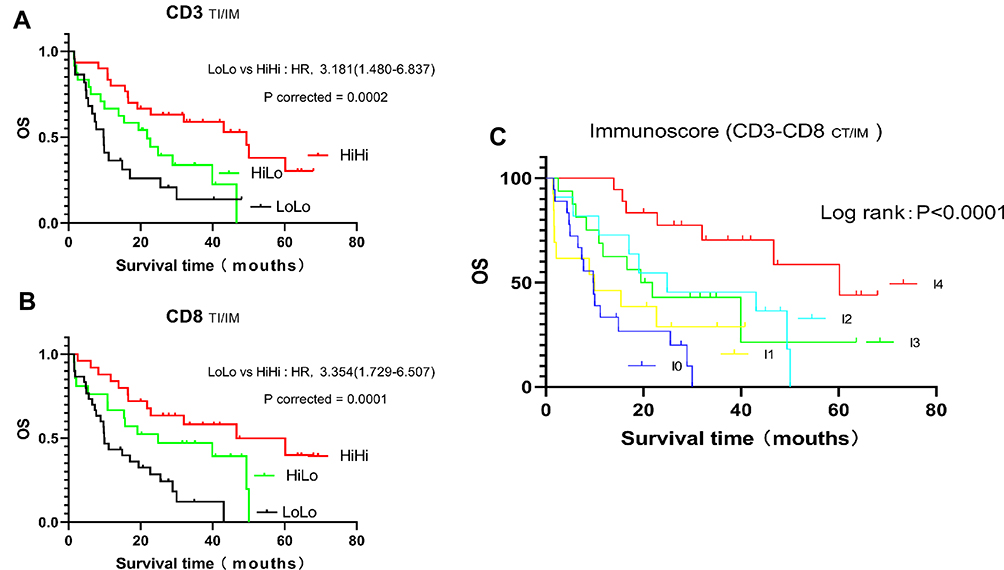 |
Figure 5 Kaplan–Meier curve analysis of OS of cholangiocarcinoma patients. (A) Kaplan–Meier curves for OS according to T-cell (CD3+) density evaluated in combined tumor regions (TI and IM). (B) Kaplan–Meier curves for OS according to cytotoxic T-cell (CD8+) density evaluated in combined tumor regions (TI and IM). Patients at risk at each interval in the Kaplan–Meier survival curves for the duration of OS are shown. (C) Kaplan–Meier curves comparing OS in patients with different Immunoscores. |
Multivariate Cox Regression and Nomogram
In the multivariable Cox regression analysis of LRFS, significant variables identified in the univariate analysis were included in this model, namely the number of tumors, lymph node metastasis, TNM staging, and the Immunoscore. Resection type, which is a factor that significantly affects prognosis in clinical practice, was also included. The results showed that the Immunoscore was an independent factor affecting LRFS in CCA regardless of inclusion of the TNM stage in the model (Table 5).
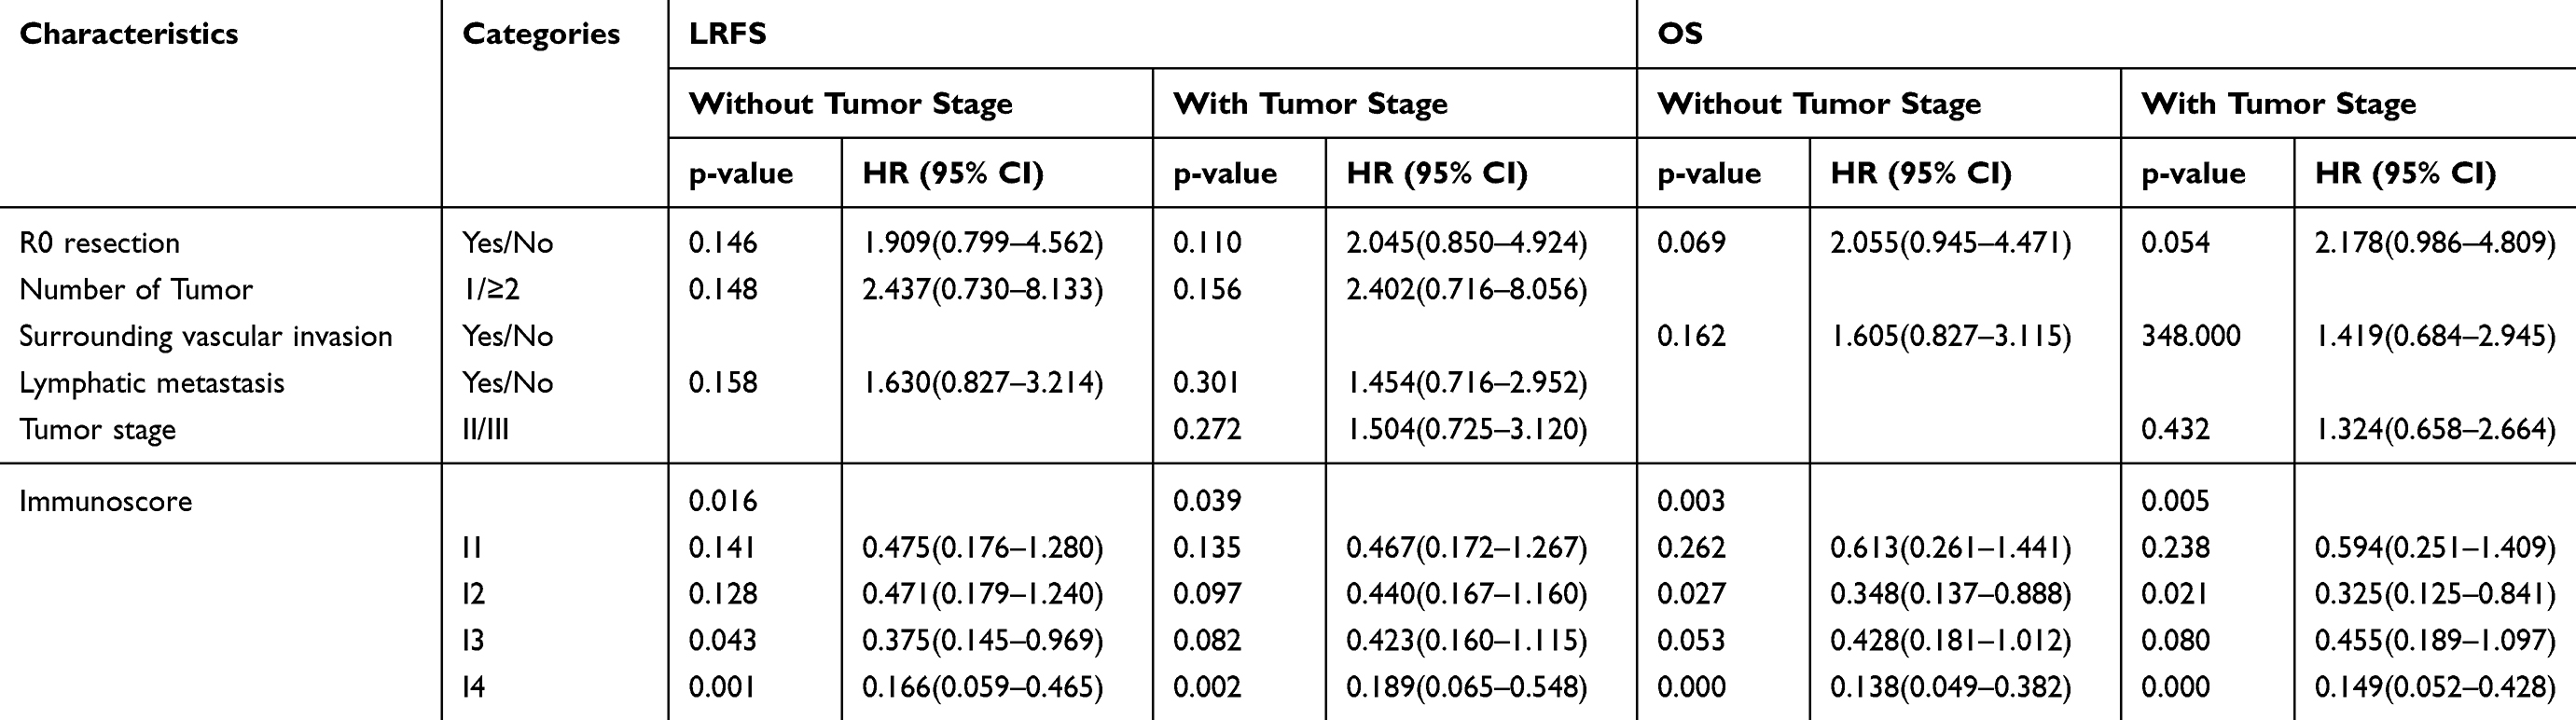 |
Table 5 Multivariate Analysis of Recurrence and Survival |
In the multivariate Cox regression analysis of OS, the variables included in the model were resection type, peripheral vascular invasion, TNM staging, and the Immunoscore. The results showed that the Immunoscore had a significant positive correlation with OS regardless of inclusion of the tumor stage in the model. This finding indicates that the Immunoscore was an independent risk factor affecting the OS of patients with CCA (Table 5).
Receiver operating characteristic analysis was used to compare the diagnostic efficiency of TNM staging and the Immunoscore with regards to the LRFS and OS of patients with CCA. The results showed that the Immunoscore had a significant predictive value for LRFS and OS, and showed a conspicuous advantage over TNM staging (Figure 6).
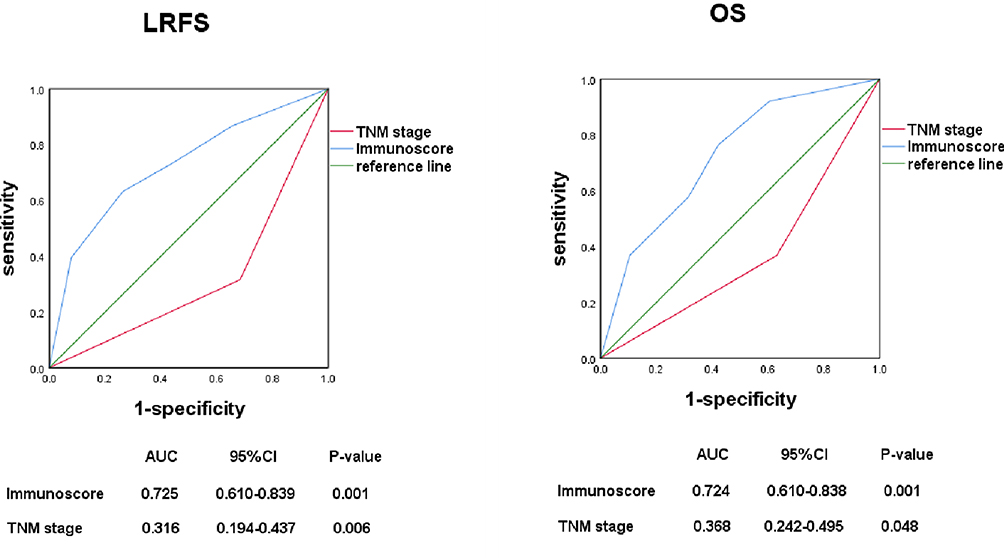 |
Figure 6 Comparison of the sensitivity and specificity between the Immunoscore system and the TNM staging system in predicting LRFS and OS of cholangiocarcinoma patients. (Left) ROC curves showed predictive values for both systems in predicting LRFS; (Right) ROC curves showed predictive values for both systems in predicting OS. The Immunoscore system was found to be superior to the TNM staging system both in LRFS and OS prediction. ROC, receiver operating characteristic; AUC, area under the ROC curve. |
Based on the results of the multivariate analysis of LRFS and OS, we constructed a prognostic nomogram of recurrence and OS, respectively. Data analysis showed that I3 ranks between I1 and I2 in the nomogram, and this may be due to the distribution of prognostic data for cases with I2 and I3. In this part of the cases, the number of recurrence and death was much more than the number of cases that did not occur, and there was minimal difference between I2 and I3 in terms of disease-free survival and OS. Therefore, the multivariate Cox regression analysis showed that the prognosis of I3 was worse than that of I2 in the nomogram. However, it showed that disease-free survival and OS were significantly increased with the increase in scores. Internal verification using the bootstrap method showed that the C-index of the recurrence and OS prediction models was 0.760 (Figure 7) and 0.745 (Figure 8), respectively.
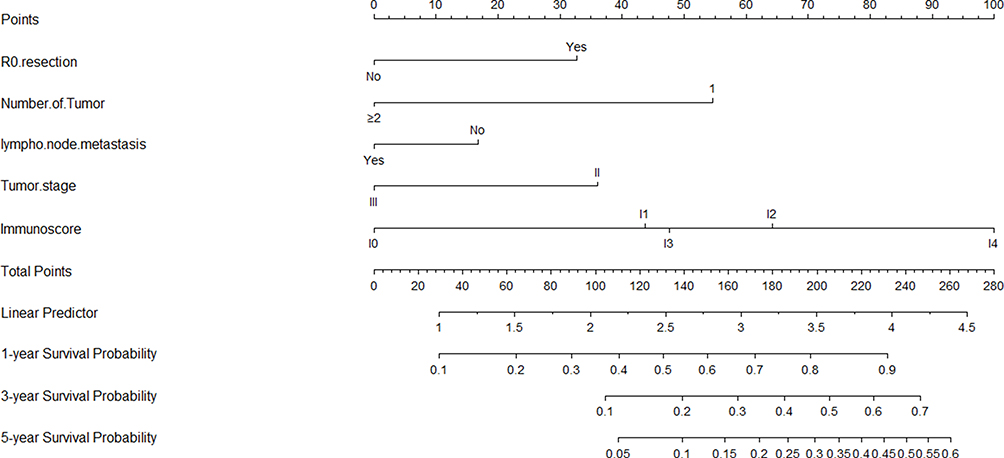 |
Figure 7 Nomogram to predict the probabilities of 1, 3 and 5-year recurrence probability. Points are assigned for R0 resection, Number of Tumor, lymph node metastasis, Tumor stage and Immunoscore by drawing a line upward from the corresponding values to the “Points” line. Draw an upward vertical line to the “Points” bar to calculate points. Based on the sum, draw a downward vertical line from the “Total Points” line to calculate 1, 3 and 5-year recurrence probability. Internal validation using the bootstrap method showed that the C-index for the model was 0.702. |
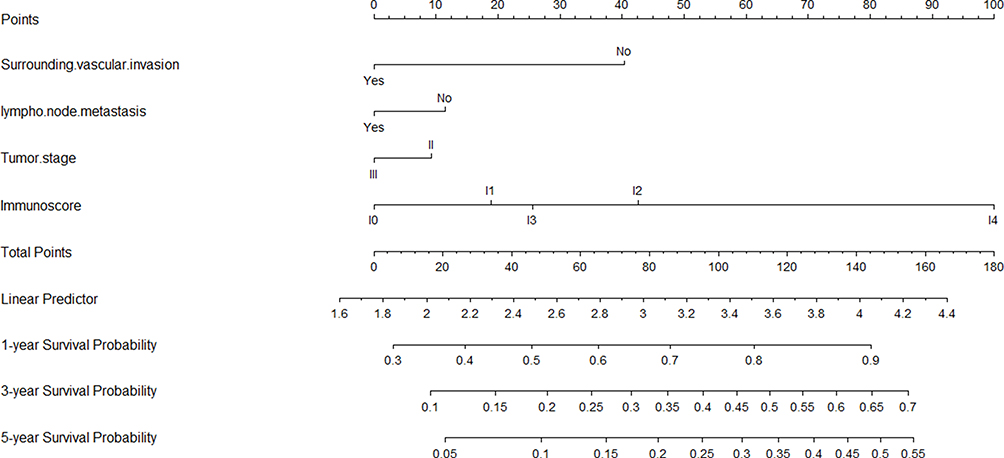 |
Figure 8 Nomogram to predict the probabilities of 1, 3 and 5-year survival probability. Points are assigned for R0 resection, Surrounding vascular invasion, Tumor stage and Immunoscore by drawing a line upward from the corresponding values to the “Points” line. Draw an upward vertical line to the “Points” bar to calculate points. Based on the sum, draw a downward vertical line from the “Total Points” line to calculate 1, 3 and 5-year survival probability. Internal validation using the bootstrap method showed that the C-index for the model was 0.704. |
Discussion
The characteristics of CCA include highly aggressive disease, propensity for recurrence, and poor prognosis. Surgical resection remains the best method currently available to improve the long-term survival of patients and achieve a favorable prognosis.2–4 Unfortunately, recrudescence is always possible, and there are no effective strategies to reduce the risk of recurrence. According to clinical practice and previous studies, parameters such as resection type and tumor staging have a specific relationship with recurrence and OS. However, this does not fully explain all clinical events. For example, patients with similar clinicopathological parameters and tumor stage may have enormously different prognoses, which may be related to the interaction between the tumor and the immune response.15,20 It has been demonstrated in various types of cancer that the immune system plays an essential role in the occurrence and progression of tumors. Innovative and highly effective immunomodulatory therapies had an excellent performance in the treatment of various types of cancer, including melanoma, lung cancer, and kidney cancer.20,32 However, data on the role of the immune system in the treatment and prognosis of patients with CCA is lacking.
The findings of our study confirmed that the Immunoscore can be used as a promising predictor of recurrence and OS of CCA. After adjusting for covariates, the Immunoscore also played a statistically significant role in predicting relapse and OS. Furthermore, we constructed a nomogram that can accurately assess the risk of recurrence and OS after CCA surgery, which has important guiding significance for the selection of subsequent treatment. By evaluating the immune microenvironment, immune intervention can be performed. This intervention aims to activate the anti-tumor immune response that is highly aggressive against cancer cells, and is an essential supplement to the surgical treatment of patients with CCA.
Studies showed that the tumor immune microenvironment is important in predicting response to anti-tumor drug treatment. For example, breast cancer patients with a high degree of immune infiltration respond better to chemotherapy.33,34 In addition, in neoadjuvant therapy, high immune cell infiltration has a significant correlation with a high response rate.35,36 Similarly, better response to chemotherapy and longer survival time were observed in colon cancer patients with liver metastasis and a higher degree of infiltration of CD8+TILs at the margin of tumor invasion.37 Prospective randomized clinical trials are warranted to further clarify the value of the Immunoscore in tumor prediction.
Given the universality of the tumor immune microenvironment, the Immunoscore is an influential prognostic factor that has significant predictive value for tumor recurrence and OS. Moreover, it provides a tool or target for the development of new treatment methods (including immunotherapy). As a biomarker for the classification of cancer, the Immunoscore has great significance in clinical decision-making. This includes the reasonable stratification of patient treatment, and identification of high-risk patients who could benefit the most from adjuvant therapy.32,38,39
As one of the emerging strategies for tumor therapy, immunotherapy has become a research hotspot in recent years. Van den Eynde40 reported that tumors withstand the continuous pressure of adaptive immunity during the process of spread and progression. From the perspective of the immune system, tumor behavior is the result of a balance between tumor invasion and the host’s immune response; of note, the local immune response is the most crucial component. Studies have shown that higher degrees of local immune infiltration are linked to better prognosis and lower risk of recurrence.12,13,39 Thus, assessing T cell infiltration in tumors according to the Immunoscore is expected to provide a more reliable treatment strategy for improving the clinical prognosis of patients with CCA. Furthermore, some researchers propose that the tumor mutational burden promotes immune cell infiltration into the tumor microenvironment.41 In our study, 76 cases of CCA had high tumor infiltration, indicating that CCA may be an immunogenic tumor with high tumor mutational burden. Therefore, immunotherapy may yield excellent results in the treatment of CCA.
The present study had certain limitations. Firstly, this was a retrospective investigation. Secondly, we performed internal validation of the nomogram; hence, further external validation is warranted to determine whether it could be universally applied.
Conclusion
The Immunoscore can be used as an independent predictor of postoperative recurrence and OS in patients with CCA, and provides distinct advantages over TNM staging. Taking into account the impact of the immune status on tumor progression, this prognostic model established by the nomogram includes variables (eg, resection type and traditional TNM staging), innovatively combined with the Immunoscore. The results demonstrated that the nomogram can accurately predict postoperative recurrence and OS in patients with CCA.
Data Sharing Statement
Some or all data, models, or code generated or used during the study are available from the corresponding author by request.
Ethics Approval and Informed Consent
This study was conducted in accordance with the Declaration of Helsinki, and was approved by the Ethics Committee of Xinhua Hospital affiliated to Shanghai Jiao Tong University School of Medicine. Informed consent was provided by the patients prior to participation.
Consent for Publication
All the authors agreed to publish this article and the related images, videos, etc.
Acknowledgments
We thank the patients and the staff in the Department of General Surgery of Xinhua Hospital.
Author Contributions
All authors contributed to data analysis, drafting or revising the article, have agreed on the journal to which the article will be submitted, gave final approval of the version to be published, and agree to be accountable for all aspects of the work.
Funding
This study was supported by the National Natural Science Foundation of China (No.81974371), the Emerging Frontier Program of Hospital Development Center (No. SHDC12018107), the General Surgery Construction Program of Shanghai Municipal Health Commission (No. 2017ZZ02011), the Project of Excellent Young Scholars from Shanghai Municipal Health and Family Planning Commission (No. 2018YQ10), the Talent Development Fund from Shanghai Municipal Human Resources and Social Security Bureau (No. 2018048), the Experiment Animal Program of Shanghai Science and Technology Committee Innovative (No. 19140902700), and Research Team of High-level Local Universities in Shanghai and Shanghai Key Laboratory of Biliary Tract Disease Research Foundation (No. 17DZ2260200). The sponsor(s) had no involve in any of the stages from study design to submission of the paper for publication.
Disclosure
The authors report no conflicts of interest in this work.
References
1. Rizvi S, Khan SA, Hallemeier CL, Kelley RK, Gores GJ. Cholangiocarcinoma - evolving concepts and therapeutic strategies. Nat Rev Clin Oncol. 2018;15(2):95–111. doi:10.1038/nrclinonc.2017.157
2. Razumilava N, Gores GJ. Cholangiocarcinoma. Lancet. 2014;383(9935):2168–2179. doi:10.1016/S0140-6736(13)61903-0
3. Rizvi S, Gores GJ. Pathogenesis, diagnosis, and management of cholangiocarcinoma. Gastroenterology. 2013;145(6):1215–1229. doi:10.1053/j.gastro.2013.10.013
4. Blechacz B, Komuta M, Roskams T, Gores GJ. Clinical diagnosis and staging of cholangiocarcinoma. Nat Rev Gastroenterol Hepatol. 2011;8(9):512–522. doi:10.1038/nrgastro.2011.131
5. Rizvi S, Gores GJ. Emerging molecular therapeutic targets for cholangiocarcinoma. J Hepatol. 2017;67(3):632–644. doi:10.1016/j.jhep.2017.03.026
6. Mou H, Yu L, Liao Q, et al. Successful response to the combination of immunotherapy and chemotherapy in cholangiocarcinoma with high tumour mutational burden and PD-L1 expression: a case report. BMC Cancer. 2018;18(1):1105.
7. Okabayashi T, Yamamoto J, Kosuge T, et al. A new staging system for mass-forming intrahepatic cholangiocarcinoma: analysis of preoperative and postoperative variables. Cancer. 2001;92(9):2374–2383. doi:10.1002/1097-0142(20011101)92:9<2374::AID-CNCR1585>3.0.CO;2-L
8. Yamasaki S. Intrahepatic cholangiocarcinoma: macroscopic type and stage classification. J Hepatobiliary Pancreat Surg. 2003;10(4):288–291. doi:10.1007/s00534-002-0732-8
9. Nathan H, Aloia TA, Vauthey JN, et al. A proposed staging system for intrahepatic cholangiocarcinoma. Ann Surg Oncol. 2009;16(1):14–22. doi:10.1245/s10434-008-0180-z
10. Endo I, Gonen M, Yopp AC, et al. Intrahepatic cholangiocarcinoma: rising frequency, improved survival, and determinants of outcome after resection. Ann Surg. 2008;248(1):84–96. doi:10.1097/SLA.0b013e318176c4d3
11. Wu T, Dai Y. Tumor microenvironment and therapeutic response. Cancer Lett. 2017;387:61–68. doi:10.1016/j.canlet.2016.01.043
12. Yang LV. Tumor microenvironment and metabolism. Int J Mol Sci. 2017;18(12):2729. doi:10.3390/ijms18122729
13. McGranahan N, Swanton C. Cancer evolution constrained by the immune microenvironment. Cell. 2017;170(5):825–827. doi:10.1016/j.cell.2017.08.012
14. Prestipino A, Zeiser R. Clinical implications of tumor-intrinsic mechanisms regulating PD-L1. Sci Transl Med. 2019;11:478. doi:10.1126/scitranslmed.aav4810
15. Galon J, Pages F, Marincola FM, et al. Cancer classification using the immunoscore: a worldwide task force. J Transl Med. 2012;10:205. doi:10.1186/1479-5876-10-205
16. Galon J. Type, density, and location of immune cells within human colorectal tumors predict clinical outcome. Science. 2006;313(5795):1960–1964. doi:10.1126/science.1129139
17. Pages F, Kirilovsky A, Mlecnik B, et al. In situ cytotoxic and memory T cells predict outcome in patients with early-stage colorectal cancer. J Clin Oncol. 2009;27(35):5944–5951. doi:10.1200/JCO.2008.19.6147
18. Jiang Y, Zhang Q, Hu Y, et al. ImmunoScore signature: a prognostic and predictive tool in gastric cancer. Ann Surg. 2018;267(3):504–513.
19. Roxburgh CS, McMillan DC. The role of the in situ local inflammatory response in predicting recurrence and survival in patients with primary operable colorectal cancer. Cancer Treat Rev. 2012;38(5):451–466. doi:10.1016/j.ctrv.2011.09.001
20. Idos GE, Kwok J, Bonthala N, Kysh L, Gruber SB, Qu C. The prognostic implications of tumor infiltrating lymphocytes in colorectal cancer: a systematic review and meta-analysis. Sci Rep. 2020;10(1):3360. doi:10.1038/s41598-020-60255-4
21. Zou MX, Lv GH, Wang XB, et al. Clinical impact of the immune microenvironment in spinal chordoma: immunoscore as an independent favorable prognostic factor. Neurosurgery. 2019;84(6):E318–E333. doi:10.1093/neuros/nyy274
22. Balachandran VP, Gonen M, Smith JJ, DeMatteo RP. Nomograms in oncology: more than meets the eye. Lancet Oncol. 2015;16(4):e173–180. doi:10.1016/S1470-2045(14)71116-7
23. Iasonos A, Schrag D, Raj GV, Panageas KS. How to build and interpret a nomogram for cancer prognosis. J Clin Oncol. 2008;26(8):1364–1370. doi:10.1200/JCO.2007.12.9791
24. Wang Y, Li J, Xia Y, et al. Prognostic nomogram for intrahepatic cholangiocarcinoma after partial hepatectomy. J Clin Oncol. 2013;31(9):1188–1195. doi:10.1200/JCO.2012.41.5984
25. Joo I, Lee JM, Yoon JH. Imaging diagnosis of intrahepatic and perihilar cholangiocarcinoma: recent advances and challenges. Radiology. 2018;288(1):7–13. doi:10.1148/radiol.2018171187
26. Kendall T, Verheij J, Gaudio E, et al. Anatomical, histomorphological and molecular classification of cholangiocarcinoma. Liver Int. 2019;39(Suppl 1):7–18. doi:10.1111/liv.14093
27. Gabrielson A, Wu Y, Wang H, et al. Intratumoral CD3 and CD8 T-cell densities associated with relapse-free survival in HCC. Cancer Immunol Res. 2016;4(5):419–430. doi:10.1158/2326-6066.CIR-15-0110
28. Kim YJ. Subverting the adaptive immune resistance mechanism to improve clinical responses to immune checkpoint blockade therapy. Oncoimmunology. 2014;3(12):e954868. doi:10.4161/21624011.2014.954868
29. Wang S, Yang L, Ci B, et al. Development and validation of a nomogram prognostic model for SCLC patients. J Thorac Oncol. 2018;13(9):1338–1348. doi:10.1016/j.jtho.2018.05.037
30. Li M, Zhang Z, Li X, et al. Whole-exome and targeted gene sequencing of gallbladder carcinoma identifies recurrent mutations in the ErbB pathway. Nat Genet. 2014;46(8):872–876. doi:10.1038/ng.3030
31. Li M, Liu F, Zhang F, et al. Genomic ERBB2/ERBB3 mutations promote PD-L1-mediated immune escape in gallbladder cancer: a whole-exome sequencing analysis. Gut. 2019;68(6):1024–1033. doi:10.1136/gutjnl-2018-316039
32. Galon J, Bruni D. Approaches to treat immune hot, altered and cold tumours with combination immunotherapies. Nat Rev Drug Discov. 2019;18(3):197–218.
33. Desmedt C, Haibe-Kains B, Wirapati P, et al. Biological processes associated with breast cancer clinical outcome depend on the molecular subtypes. Clin Cancer Res. 2008;14(16):5158–5165. doi:10.1158/1078-0432.CCR-07-4756
34. Iwamoto T, Bianchini G, Booser D, et al. Gene pathways associated with prognosis and chemotherapy sensitivity in molecular subtypes of breast cancer. J Natl Cancer Inst. 2011;103(3):264–272. doi:10.1093/jnci/djq524
35. Andre F, Berrada N, Desmedt C. Implication of tumor microenvironment in the resistance to chemotherapy in breast cancer patients. Curr Opin Oncol. 2010;22(6):547–551. doi:10.1097/CCO.0b013e32833fb384
36. Denkert C, Loibl S, Noske A, et al. Tumor-associated lymphocytes as an independent predictor of response to neoadjuvant chemotherapy in breast cancer. J Clin Oncol. 2010;28(1):105–113. doi:10.1200/JCO.2009.23.7370
37. Halama N, Michel S, Kloor M, et al. Localization and density of immune cells in the invasive margin of human colorectal cancer liver metastases are prognostic for response to chemotherapy. Cancer Res. 2011;71(17):5670–5677. doi:10.1158/0008-5472.CAN-11-0268
38. Pitt JM, Marabelle A, Eggermont A, Soria JC, Kroemer G, Zitvogel L. Targeting the tumor microenvironment: removing obstruction to anticancer immune responses and immunotherapy. Ann Oncol. 2016;27(8):1482–1492. doi:10.1093/annonc/mdw168
39. Zhang Y, Chen L. Classification of advanced human cancers based on Tumor Immunity in the MicroEnvironment (TIME) for cancer immunotherapy. JAMA Oncol. 2016;2(11):1403. doi:10.1001/jamaoncol.2016.2450
40. de Andrea CE, Schalper KA, Sanmamed MF, Melero I. Immunodivergence in metastatic colorectal cancer. Cancer Cell. 2018;34(6):876–878. doi:10.1016/j.ccell.2018.11.012
41. Howitt BE, Shukla SA, Sholl LM, et al. Association of polymerase e–mutated and microsatellite-instable endometrial cancers with neoantigen load, number of tumor-infiltrating lymphocytes, and expression of PD-1 and PD-L1. JAMA Oncol. 2015;1(9):1319. doi:10.1001/jamaoncol.2015.2151
 © 2020 The Author(s). This work is published and licensed by Dove Medical Press Limited. The
full terms of this license are available at https://www.dovepress.com/terms
and incorporate the Creative Commons Attribution
- Non Commercial (unported, 3.0) License.
By accessing the work you hereby accept the Terms. Non-commercial uses of the work are permitted
without any further permission from Dove Medical Press Limited, provided the work is properly
attributed. For permission for commercial use of this work, please see paragraphs 4.2 and 5 of our Terms.
© 2020 The Author(s). This work is published and licensed by Dove Medical Press Limited. The
full terms of this license are available at https://www.dovepress.com/terms
and incorporate the Creative Commons Attribution
- Non Commercial (unported, 3.0) License.
By accessing the work you hereby accept the Terms. Non-commercial uses of the work are permitted
without any further permission from Dove Medical Press Limited, provided the work is properly
attributed. For permission for commercial use of this work, please see paragraphs 4.2 and 5 of our Terms.