Back to Journals » Journal of Pain Research » Volume 14
Combined T2 Mapping and Diffusion Tensor Imaging: A Sensitive Tool to Assess Myofascial Trigger Points in a Rat Model
Authors Yu S ![]() , Su H
, Su H ![]() , Lu J
, Lu J ![]() , Zhao F, Jiang F
, Zhao F, Jiang F ![]()
Received 1 April 2021
Accepted for publication 20 May 2021
Published 14 June 2021 Volume 2021:14 Pages 1721—1731
DOI https://doi.org/10.2147/JPR.S313966
Checked for plagiarism Yes
Review by Single anonymous peer review
Peer reviewer comments 2
Editor who approved publication: Professor E Alfonso Romero-Sandoval
Shuangcheng Yu,1,* Haiqing Su,2,* Jianchang Lu,1 Fanyu Zhao,1 Fangyan Jiang2
1Department of Radiology, Minzu Hospital of Guangxi Zhuang Autonomous Region, Nanning, Guangxi, 530001, People’s Republic of China; 2Department of Medical Ultrasound, Minzu Hospital of Guangxi Zhuang Autonomous Region, Nanning, Guangxi, 530001, People’s Republic of China
*These authors contributed equally to this work
Correspondence: Fangyan Jiang
Department of Medical Ultrasound, Minzu Hospital of Guangxi Zhuang Autonomous Region, Nanning, Guangxi, 530001, People’s Republic of China
Email [email protected]
Background: Myofascial trigger points (MTrPs) are defined as very small and hypersensitive points in skeletal muscle that are palpable, and produce localized pain on compression. The aim of this study was to explore the feasibility of combining T2 mapping with diffusion tensor imaging (DTI) for assessing MTrPs in a rat model and to investigate properties of the pathophysiological mechanisms.
Methods: Twenty-four Sprague-Dawley rats (model group, n = 14; control group, n = 10) underwent a magnetic resonance imaging (MRI) examination on a 3 T-MRI-scanner with a protocol consisting of T2 mapping and DTI. The MTrPs were established by blunt strike in combination with eccentric exercise. Enzyme-linked immunosorbent assays (ELISAs) were used to detect the levels of interleukin-1ß (IL-1ß) and interleukin-2 (IL-2) and their results were correlated with T2 values. Parameters from MRI including T2 values, fractional anisotropy (FA), axial diffusivity (AD), mean diffusivity (MD), and radial diffusivity (RD) were compared between the two groups. Histological analysis was applied to provide an additional supply for MRI findings.
Results: The MTrPs of rats displayed significantly increased T2 values and FA (= 0.000) compared with normal controls, whereas MD and RD values were significantly lower (P= 0.031, = 0.000, respectively). There was no statistically significant difference in AD between the two groups (P= 0.400). These differences were accompanied by elevated levels of IL-1ß and interleukin-2 IL-2 in the MTrP group compared with controls. T2 values were positively correlated with elevated IL-1ß levels (r = 0.543, P < 0.05) but were not correlated with IL-2 levels (P > 0.05).
Conclusion: Combining T2 and DTI sequences creates a sensitive tool to assess MTrPs in a rat model. These data clarify a hypothesis that a trigger point is a chronic and mild muscle injury with inflammation.
Keywords: magnetic resonance imaging, gastrocnemius muscle, myofascial pain syndrome, diagnosis, inflammatory cytokines
Introduction
Myofascial trigger points (MTrPs) are a commonly occurring clinical problem and defined as very small and hypersensitive points in skeletal muscle that are palpable, produce localised pain on compression and which can evoke referred pain.1–3 MTrPs are the main characteristics of myofascial pain syndrome (MPS), recognised as a very common cause of pain and dysfunction in various parts of the body, including neck, shoulder, spine and pelvis.3–5
The pathogenesis of MTrPs is still not consistent and the diagnostic criteria are not objective enough. Palpation of the affected muscles has for decades represented the key process for identifying MTrPs during the diagnostic process.6 This method is proven to be poorly reproducible and lacking objectivity when medical staff blindly examine different patient groups. Attempts to visualize and locate these points specifically via imaging modality and make a reliable diagnosis is essential to guide treatment of MPS. Different modalities in ultrasound (US) imaging have been applied to visualize MTrPs.7 However, they remain problematic and are generally controversial. Two-dimensional ultrasound imaging has difficulty in distinguishing MTrPs from surrounding normal muscles due to lack of adequate gray-scale comparison in the region of clinically detectable MTrPs.8 Nevertheless, combinations of US or elastography were demonstrated to successfully diagnose MTrPs appearing as a stiff and hypoechoic region during US examinations.9–11 To date, US has not found a standardized routine procedure and is still under study.
Recently, different magnetic resonance imaging (MRI) techniques have been undertaken to evaluate MTrPs in skeletal muscle. Chen et al. used magnetic resonance elastography to examine 65 patients with myofascial pain-associated taut bands and found that the agreement between clinicians and magnetic resonance elastography was relatively poor.12 In addition, T2 mapping, namely T2 relaxation time, used to quantify T2 values for identification of MTrPs demonstrated a statistically significant difference when comparing the T2 values of the trapezius muscles to the area of MTrPs.13 The T2 hyperintensities observed were thought to be associated with edematous changes. However, the distinct nature of edematous changes was not well elucidated.13 Diffusion tensor imaging (DTI) is an emerging MRI-based technique for evaluating the structural characterization of anisotropic muscle tissues by assessing the degree and the directionality of water diffusion in tissue.14,15 It is considered a sensitive tool to assess changes in tissue microstructure and simultaneously provide information about the quantification and visualization of macroscopic muscle architecture.16 DTI parameters such as FA, MD, RD and eigenvalues (λ1, λ2, and λ3) have been successfully used to evaluate the structural effects of exercise injury, denervation, ischemia, gender, and inflammation within the skeletal muscle.17–20 However, the changes in the microstructure of MTrPs evaluated by DTI indexes have not yet been reported.
Previous studies have detected elevated levels of inflammatory cytokines in the vicinity of active MTrPs including interleukin-1ß (IL-1ß), IL-6, IL-8, and TNF-a.21 It was proposed that MTrPs may represent an ischemia-induced inflammatory microenvironment.22,23 MRI-based measurements of cerebral edema, synovitis and tendinopathy have been suggested to correlate with inflammatory cytokines in previous findings.24–26 Taking a lead from the above-mentioned studies, we hypothesize that the active MTrPs should generate changes on DTI indices and T2 values, which may reflect an inflammatory process at the level of MTrPs.
Therefore, the aims of the present study were to explore the feasibility of T2 and DTI sequences for assessing MTrPs in a rat model, and attempt to investigate the properties of the pathophysiological mechanisms of MTrPs by combining MRI findings with histological analysis as well as levels of inflammatory cytokines.
Materials and Methods
Animal Care
Data were collected as previously described by Fangyan Jiang.23 Since this study requires post-mortem elements at high cost, all efforts were made to minimize the number of animals sacrificed based on common sense to choose a suitable sample size. A total of 25 male Sprague-Dawley rats weighing 200–220g were obtained from the Animal Experiment Center of Guangxi Medical University (Nanning, China) and were 7 weeks old at the start of experiments. They were housed in a constant 12 h/12 h light/dark cycle at a controllable temperature of 22–24°C and 42% humidity, with food and water freely available. This study was conducted in accordance with the guide for the Care and Use of Laboratory Animals recommended by the National Research Council (US) Committee27 and the Animal Ethics Committee of Guangxi Medical University approved this study (Approval No. 201904013).
Animal Model of MTrPs
All enrolled rats were randomly divided into two groups: one normal control group (n = 10) and one model group (n = 15). In the model group, the MTrPs was established by blunt striking injury on the right gastrocnemius muscle in combination with eccentric exercise for 8 weeks.28 Rats were anesthetized by injection of 30 mg/kg pentobarbital sodium into abdominal cavity every Saturday and then fixed on a board, followed by blunt striking injury. With a kinetic energy of 2.352J, a 1200g stick was dropped freely from a height of 20cm to blunt the site of right proximal gastrocnemius marked on the skin. On the next Sunday, all injured rats accomplished 90 min eccentric exercise with speed of 16 m/min on a treadmill (SA101B, Jiangsu Saiangsi Biological Technology Co., Ltd, Nanjing, China) at a 16° downward angle (Figure 1). Subsequently, the rats were permitted to rest for the remaining 5 days a week without any intervention. All rats in the model group were treated in this way for 8 weeks and rested for 4 weeks. Hence, the process of MTrPs modeling was accomplished. Control rats received no intervention during this period.
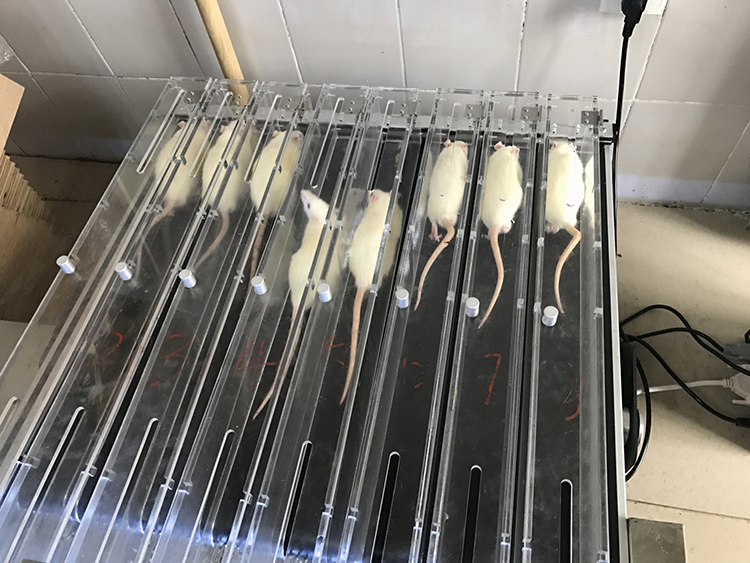 |
Figure 1 A picture of the rats in eccentric exercise. |
Identification of MTrPs with EMG
MTrPs were determined by the presence of a taut band (TB), a local twitch response of muscle when adequately stimulated, and spontaneous electrical activity (SEA) by electromyography (EMG).28 Specifically, the injured right gastrocnemius muscle in each rat was completely exposed. The taut band was palpated and marked on the skin. Then, all rats were examined to assess a local twitch response and SEA by an electrode from an NTS-2000 instrument (Nuocheng Medical Co., Ltd, Shanghai).
Magnetic Resonance Imaging
All subjects underwent an MRI examination on a 3 T-MRI-scanner (Magnetom Prisma, Siemens Healthineers, Erlangen, Germany). The rats were placed into a 16 channel transmit/receive animal phased array coil, in prone position, under general anesthesia obtained with intraperitoneal injection of 30 mg/kg pentobarbital sodium. The image stack was centered at the proximal gastrocnemius level. After imaging localizers, MRI protocol including T2 mapping and DTI sequences were acquired according to the acquisition parameters listed in Table 1. During the examination, a blanket covered the rats to maintain a stable body temperature.
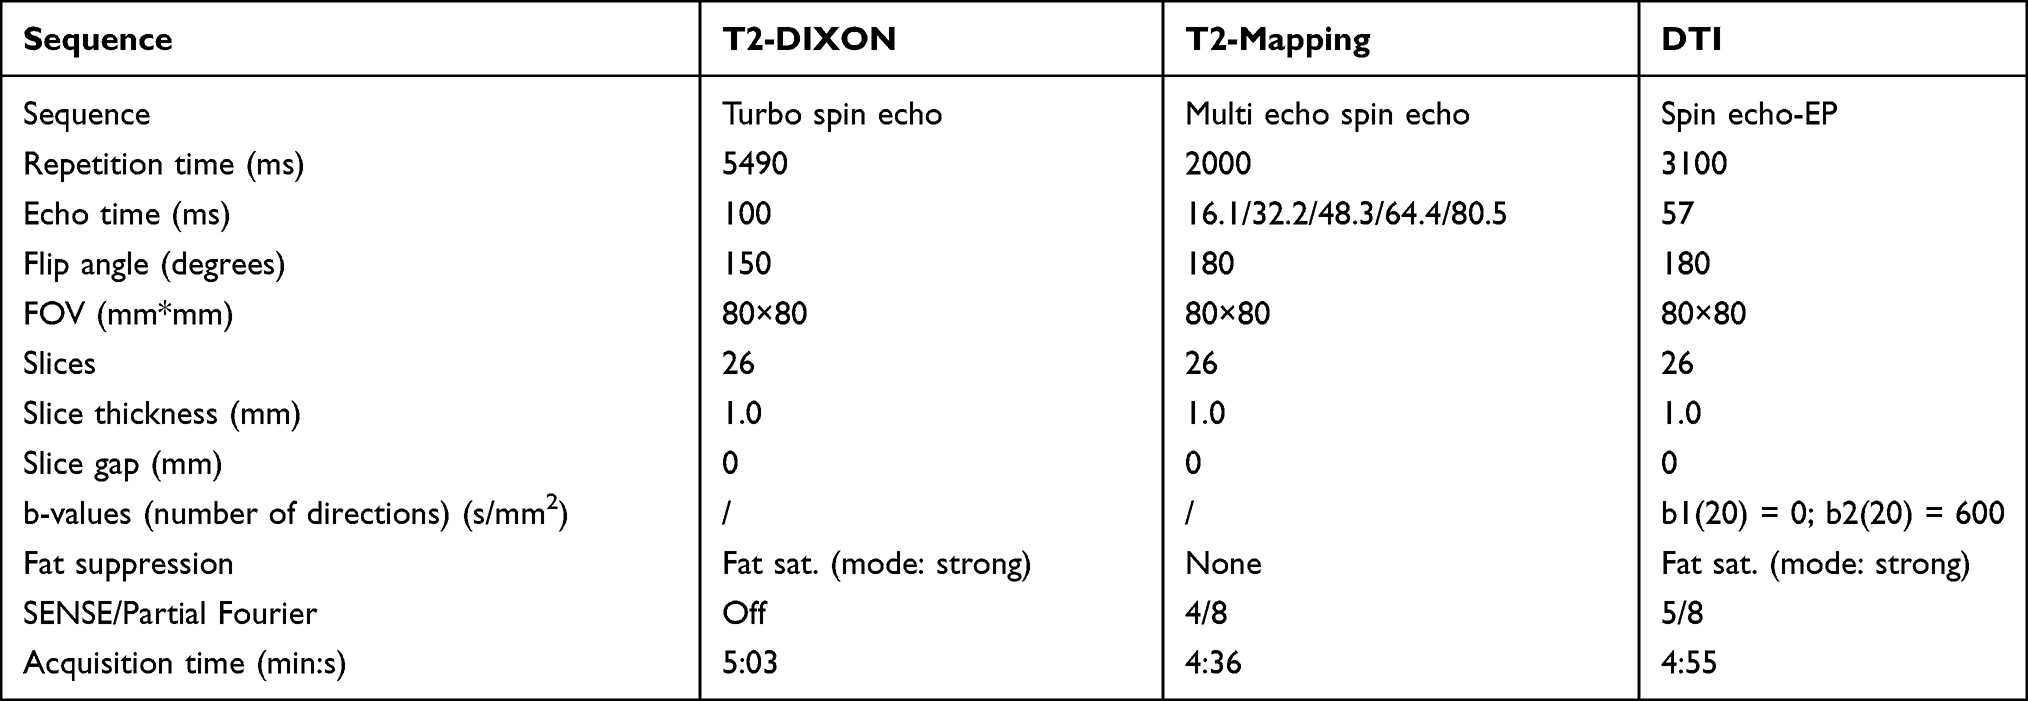 |
Table 1 Specific Parameters of Acquisition Sequence of MR Protocol |
MR Imaging Analysis
Post-processing of MRI images was performed with Siemens Syngo Multimodality Workplace (MMWP) MRI workstation-ve40c. To extract DTI parameters RD, AD, MD and FA, as well as T2 values, the proximal gastrocnemius in the image was targeted for measurement. A region of interest (ROI) was manually drawn to cover the cross-sectional area of muscle injury, avoiding areas of bone, vascular, fatty or skin areas on matched anatomical images. Three ROIs were identified from three sequential segments to acquire the average values. The same ROIs were applied on the controls to measure the indices. Two radiologists with 7 and 13 years of experience in MR imaging in blinded conditions analyzed the data in consensus after each MR examination.
Histological Analysis
After the MRI examination, muscle tissues were acquired from marked sites in two groups and fixed in 4% paraformaldehyde for 24 h. Next, the slices were dehydrated with ethanol in different concentrations (70%, 80%, 90%, 95%, 100% ethanol, respectively). After paraffin embedding, sections were sliced to 5μm and dried for hematoxylin and eosin (H&E) staining. In the process of H&E staining, at room temperature, the sections were stained with hematoxylin for 20 min and then eosin for 1 min. The histological images were captured using a BX43 light microscope (Olympus Corporation) at 400× magnification.
Enzyme-Linked Immunosorbent Assay (ELISA Assay)
The muscle tissue samples (including area of MTrPs and normal control tissue) were homogenized to extract protein in order to increase the sensitivity of the test. The tissues were cut, weighed, and stored in a −80°C freezer until homogenization and analysis. 1 g of tissue was rinsed and homogenized in buffer (pH 7.4) and stored overnight at −20°C. The tissue was completely dissolved after two freeze-thaw cycles and centrifuged. The supernatant was obtained and examined immediately. IL-1ß and IL-2 protein levels were detected with enzyme-linked immunosorbent assay (ELISA) kits according to the manufacturer’s instructions (Cusabio Biotech Co., Ltd, Wuhan, China).
Statistical Analysis
All statistical analyses were calculated using SPSS software (version 22.0, SPSS Inc., Chicago, IL, USA). The Shapiro–Wilk test and Levene’s test were employed to evaluate the normality and homoscedasticity of continuous data, respectively. The continuous data were shown with mean ± standard deviation. The levels of inflammatory cytokines and MRI parameters were compared between the MTrP group and normal controls using independent-sample t tests separately. In the MTrP group, the correlation between T2 values and levels of cytokines was determined by Pearson’s correlation coefficient (r). A P value of 0.05 was accepted as the threshold for statistical significance in all tests.
Results
During the process of modeling, one rat died unexpectedly due to anesthetic complications. Therefore, 24 rats were enrolled in the present study (model group: n = 14, normal group: n = 10).
Electromyography Analysis
In all rats of the model group, the taut bands were identified as a palpable nodule during physical examination within the right gastrocnemius. Local twitch response and SEA were observed in experimental rats when the EMG electrode was inserted into the taut band. These findings supported the presence of a myofascial trigger point at the site of right gastrocnemius injury. However, no MTrPs were found in the control group of rats (Figure 2).
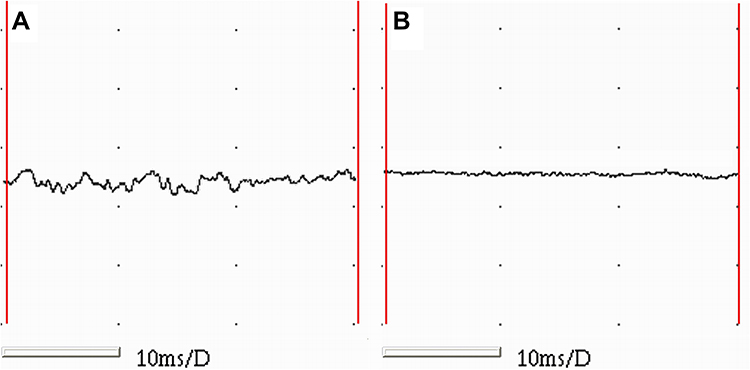 |
Figure 2 Electromyography recordings of the two groups. (A) Spontaneous electrical activities of muscle fibers were detected in the MTrP group. (B) No EMG activity of muscle fibers were shown in the control group. Abbreviation: EMG, electromyography. |
MRI Findings
A total of 24 rats underwent MRI examination. Compared with normal controls, all experimental rats showed T2 hyperintensities in the right proximal gastrocnemius on T2-WI MRI scanning (Figure 3A). The FA and T2 values were significantly higher in the MTrP group versus controls (P = 0.000), whereas MD and RD values were significantly lower (P = 0.007, P = 0.000, respectively) (Figure 3B). There was no statistically significant difference in AD values between the two groups (P = 0.475). Quantitative changes are summarized in Figure 3. A representative picture of 3D fiber tractography is shown in Figure 4, which was used to visualize continuous changes in the gastrocnemius. The continuity of muscle fibers in injury groups was intact macroscopically.
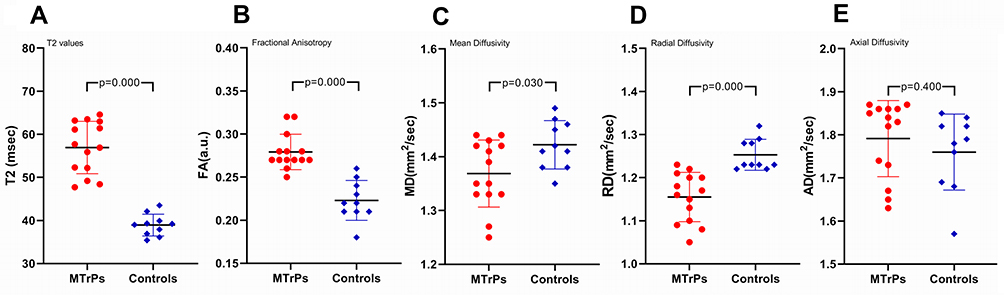 |
Figure 3 Changes of the T2 values, FA, MD, RD and AD values in the MTrP group and control group. Horizontal lines indicate the average with standard deviation (SD). The values of (A) T2, (B) FA were significantly higher in the MTrP group than control group. The values of (C) MD, (D) RD were lower in the MTrP group compared with normal controls. There were no statistically significant differences in (E) AD between the two groups. Abbreviations: FA, fractional anisotropy; MD, mean diffusivity; RD, radial diffusivity; AD, axial diffusivity. |
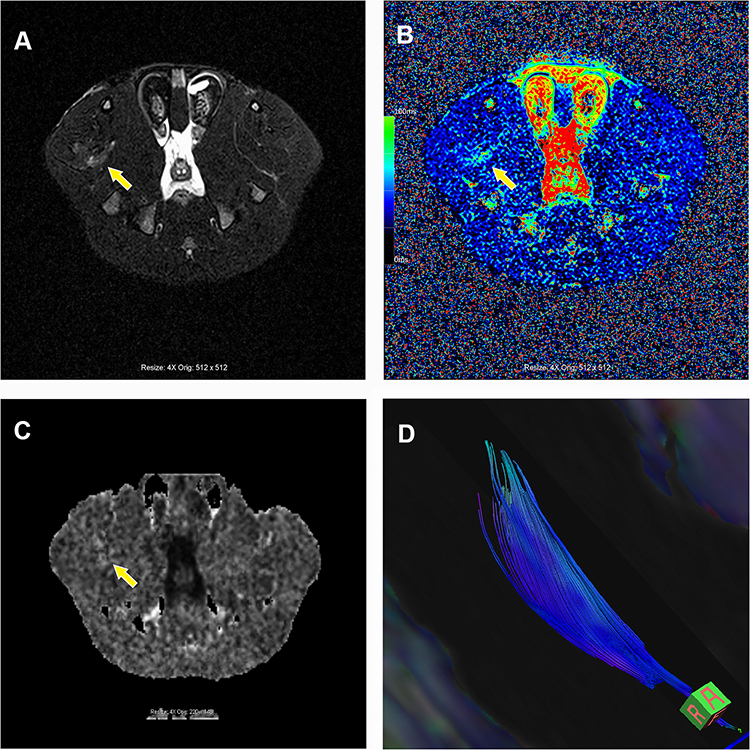 |
Figure 4 Graph of MRI findings including T2 mapping and DTI sequences. (A) The area of defined MTrPs presented with T2 hyperintensities in the T2 Dixon fat-saturated axial images (yellow arrow). (B) The T2 values of MTrPs (yellow arrow) in the color-coded T2 maps were higher than normal control. (C) The FA value of MTrPs (yellow arrow) was higher versus controls. (D) A representative picture of 3D fiber tractography exhibited the area of MTrPs in the gastrocnemius architecture was intact macroscopically. Abbreviations: MRI, magnetic resonance imaging; DTI, diffusion tensor imaging; MTrPs, myofascial trigger points; FA, fractional anisotropy. |
Histopathological Features
As expected, in the control group, the muscle fibres were uniform in terms of sizes, regular polygon and gap size in cross-section. The myofibrils in muscle cells were evenly stained. In the MTrP group, the involved muscle fibers were thinner at both ends and swelled in the middle in longitudinal-section, accompanied by partial fibers distortion. The different sizes of round or oval muscle fibres were gathered in cross-section within one field of view. Large round nodes were considered to be the contracture nodules, while small ones were the distal or caudal of contracture fibers. In addition, the muscle-fiber space and the muscle-bundle space were both irregularly widened along with the infiltration of mononuclear cells. However, the microstructures of these fibers remained intact and did not present with fat infiltration. The observed muscle cells presented with 2–3 peripheral nuclei in cross-section, without central nucleus (Figure 5).
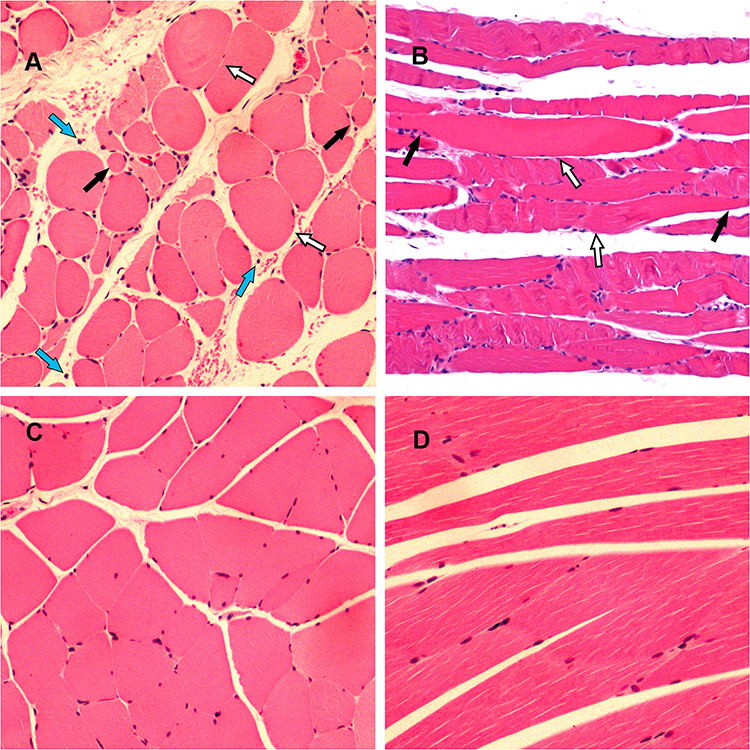 |
Figure 5 Representative HE staining sections of gastrocnemius from the two groups (400× amplification). (A and B) show histological changes from the MTrPs in the cross-sectional and longitudinal-section, respectively. White arrows indicate locally swollen muscle fibers. Black arrows indicate locally thinner muscle fibers. Blue arrows indicate the infiltration of mononuclear cells in the muscle bundle space. (C and D) show the muscle fibers from normal controls were uniform in terms of sizes, regular polygon and gap size both in cross-section and longitudinal-section. |
Expression of IL-1ß and IL-2 in the Two Groups
Protein levels of cytokines were examined in muscle tissue homogenates. As displayed in Figure 6, the levels of the cytokines IL-1ß and IL-2 were significantly higher in the MTrP group than normal controls (P < 0.05). These results were consistent with previous findings.21
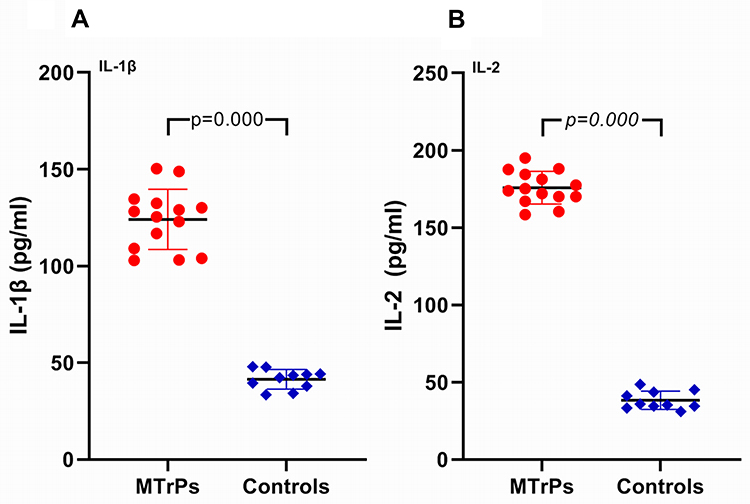 |
Figure 6 Expression of IL-1ß and IL-2 in the two groups. The levels of (A) IL-1ß, and (B) IL-2 were significantly higher in the MTrP group than control group (P < 0.001). |
Analysis of Correlation Between the Levels of IL-1ß, IL-2 and T2 Values in the MTrP Group
The correlations in the MTrP group between T2 values and levels of cytokines are presented in Figure 7. T2 values was positively correlated with elevated IL-1ß levels (r = 0.606; P = 0.022), but was not correlated with IL-2 levels (P > 0.05).
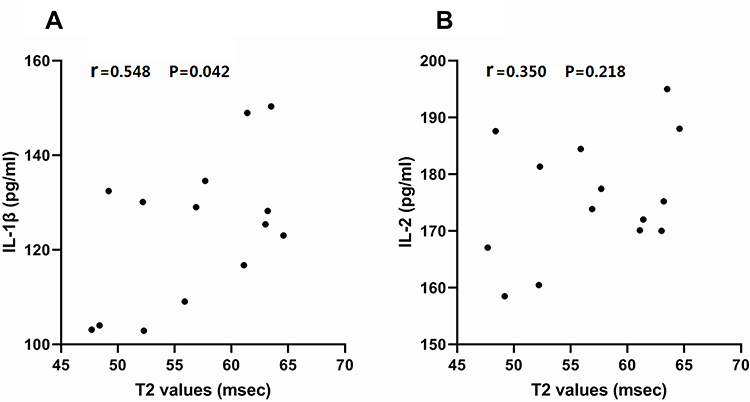 |
Figure 7 Graph represents correlation between T2 values and levels of inflammatory cytokines in the MTrP group. Each dot represents one rat. (A) A significant positive correlation was observed between the T2 values and the level of IL-1ß (P < 0.05). (B) There was no significant correlation between T2 values and levels of IL-2 (P > 0.05). Abbreviations: IL-1ß, interleukin-1ß; IL-2, interleukin-2. |
Discussion
We conducted a prospective case-control study by performing a multi-parametric MRI protocol to investigate the potential changes in a MTrPs rat model and correlate the T2 values with levels of inflammatory cytokines. The main findings of this study were observations of both microstructural and biochemical milieu alterations in the model group. T2 values were positively associated with IL-1ß levels, but not with IL-2 levels. The distinct properties of MRI findings in combination with histological analysis further elucidate the nature of the pathophysiological mechanisms and the onset of MTrPs.
One of our main findings was that statistically significant differences in MRI T2 values between the MTrPs and control subjects were identified, verifying the utility of T2 values as a marker of MTrPs. Elevated T2 values in MTrPs were reported in a previous study when compared with surrounding musculature.13 Nevertheless, the specific T2 values increased with a range of 29.8–34.8ms in the literature.13 This cannot be directly compared with our data mainly due to variations in both subjects and commercially available machines. We did not expect the same changes in T2 values. Although the T2 hyperintensities observed was explained to be related to edemain the previous study, the nature of the edema is not yet elucidated.13 There is a general consensus that all intramuscular oedema in conventional MRI images is due to an increase in intracellular or extracellular free water.29,30 The origin of T2 relaxation is generally thought to be associated with the spatial separation of water entering intracellular and/or extracellular spaces. However, T2 values alone could not identify these different phases. The observed T2 hyperintensity alterations of the MTrPs areas in the gastrocnemius could reflect alterations either within the muscle fibers or in the extracellular matrix/connective tissue.31 We cannot determine the main origin of hyperintensity and also cannot completely exclude other potential factors appearing with T2 relaxation times lengthening characteristics such as skeletal muscle fat infiltration.
Previous studies have demonstrated that T2 values of muscles with inflammation or edema are higher than normal muscles.30,32 This notion was further supported in the present study by the observed linear correlation between T2 values and IL-1ß levels together with the infiltration of mononuclear cells in the intercellular space around muscle fibers on histological analysis. Moreover, we also confirmed that the levels of IL-2 were increased in the MTrPs compare with normal subjects, but there was no significant correlation with T2 values. Currently, there have been no studies to assess the concentrations of IL-2 biomarker in the MTrPs. This may be related to the complex role of IL−2 in the inflammatory responses. Unlike analysis of levels of other inflammatory mediators, i.e. IL-1ß, IL-6, IL-8 and TNF-α, in MTrPs areas,21 assessment of the effect of IL-2 levels in inflammatory responses is difficult. The role of IL-2 in the inflammatory process involves pro- and anti-inflammatory effects by inducing the proliferation, survival and cytokine production of T cells, whose balance contributes to a controlled inflammatory response.33 Therefore, these findings have been proposed to confirm an actual link between chronic inflammation and higher T2 values in the MTrPs. However, inflammation may always coexist with edema in the progression of myopathy.
To verify in better detail changes of the specific microstructure and pathophysiology in the MTrPs, DTI was applied to provide supplementary valuable muscle damage information based on T2 mapping. DTI is a powerful tool for quantification and visualization of subtle changes in the muscle architecture due to muscle pathological or physiological processes.17–20 FA, MD, AD and RA are the main quantitative DTI indices to assess the diffusion of water molecules in diverse directions in a space.15,34 They are all calculated from three eigenvalues (λ1, λ2, and λ3) by their corresponding equations.15,35 It is important to understand how DTI indices relate with muscle properties to accurately interpret results.
FA is commonly calculated to reflect the degree of anisotropic diffusion with a range from 0 to 1, where 0 represents isotropic diffusion and 1 represents anisotropic diffusion.15,35 The fibers of integrity, diameter and density have certain influences on the skeletal muscle FA value.36 Previous studies have indicated that all acute muscle damage coincides with an increased diffusivity, which shows decreased FA value.35–39 While the chronic phase of muscle injury resulting in muscular atrophy has significantly higher FA than normal controls.40–42 As suggested in the literature, the diffusion of water observed in skeletal muscles mainly reflects the diffusion in the intracellular space, which may be associated with cell diameter and extracellular fluid fraction.35,43 Accordingly, it is easy to understand that the muscle fibre swelling and the loss of integrity in the acute inflammation phase along with widening intracellular space would make diffusion of water occur in any direction, resulting in a decrease in FA values. Remarkably, our findings that the FA values were higher in the MTrPs than normal controls are contrary to this notion and are in accordance with characteristics of chronic muscle injury. On the other hand, our histological analysis revealed some smaller muscle fibers versus healthy controls were gathered in cross-section within one field of view. The data obtained from histology and imaging demonstrated that an increased FA was associated with decrease of muscle fiber diameter. Two possible factors for contributing to reduction in fiber diameter are proposed: one is the atrophy of muscle fibers, another is the new muscle fibers which are still immature and characterized by a smaller size compared with healthy tissue. The immature muscle fibers are histologically labeled by the central nucleus, which were not observed in our histological analysis. The current study showed each muscle fiber in cross-section with 2–3 peripheral nuclei gathered together on the histological images. Hence, we proposed that increased FA in the MTrPs may be related to the slight atrophy of some muscle fibers. In addition, lower RD and MD were observed in the MTrPs, while AD stayed relatively unchanged. These results further strengthened our interpretation of FA changes. MD is described as the mean value of the direction of diffusion in the tissue. RD is determined by the secondary and tertiary eigenvalues and positively correlated with the muscle fiber diameter. We observed decreases in the MD and RD as well as unchanged AD that were likely to be involved in the diffusivity restriction perpendicular to the muscle fiber direction. Our results were in accordance with previous observations.40,41 One likely explanation of this change is the reduction of muscle fiber diameter and the expansion of extracellular space. These hypothesized changes were strongly confirmed by our histopathological specimens. These findings corresponded well with reduction of the second and third eigenvalues as a marker to indirectly indicate cell atrophy.41
Altogether, our findings demonstrate the feasibility of measuring T2 values and DTI parameters to identify the MTrPs from surrounding healthy muscles in a rat model. Changes in diffusion coefficient and T2 values followed a markedly different pattern and they provided non-overlapping and valuable information during the process of musculopathy. Multi-parameter MRI combined with histopathological analysis firstly demonstrated that not only enlarged contraction nodules but also reduced fibers diameter coexisted in the MTrPs skeletal muscle microenvironment. Interestingly, 3D fiber tractography exhibited the gastrocnemius architecture in injury groups was intact macroscopically. These results enable clarification of the hypothesis that a trigger point is actually a chronic and mild muscle injury with inflammation, which may be accompanied by the process of muscle injury and repair.
There were certain limitations in the current study. Firstly, though the muscle injury model used in the current study has been applied in several studies to investigate MTrPs, to our knowledge, there are currently no published human (in vivo) studies on histological analysis of MTrPs in the available literature. The rat model may not adequately reproduce the natural disease course of human MTrPs in vivo. In this regard, it is not clear to what extent this rat model will extrapolate to MTrPs in humans. Secondly, the time-course analysis was not scheduled in the current study as it was a case-control study. The presence of MTrPs is a controversial and little-understood subject. The pathogenesis to induce the onset and maintenance of MTrPs is still not completely understood. Detecting the initiation of MTrPs in a controlled setting is very difficult. A proper time-course analysis may be helpful to clarify the pathophysiological mechanisms of MTrPs. Further studies are required to research. Lastly, DTI image itself has technical challenges. Although the muscle images have been created with special software to minimize eddy current induced image distortion in this study, the anatomical structure in the DTI image may still not be completely consistent with T2. Positioning ROI with vendor supplied software using T2 image as a reference to obtain DTI indices may have some inevitable errors. However, variation of parameters from these errors has little influence on the results.
Conclusion
Overall, we have already suggested that combining T2 and DTI sequences creates a sensitive tool to assess the MTrPs in a rat model. This study manifests that DTI can provide supplementary valuable information based on existing MR protocols that have focused on T2 values and fat fraction. We reveal the distinct properties of skeletal muscle microenvironment in MTrPs by combining DTI indices with histological images, which have not been reported before. These findings clarify the hypothesis that a trigger point is actually a chronic and mild muscle injury with inflammation.
Data Accessibility
All datasets from this study are available from the corresponding author upon reasonable request.
Acknowledgments
The authors thank the Department of Radiology in the First Affiliated Hospital of Guangxi Medical University for the technical assistance.
Funding
This work was supported by the Self-Funded Research Project of Guangxi Zhuang Autonomous Region National Health Planning Commission (NO. Z20200569).
Disclosure
The authors report no conflicts of interest in this study.
References
1. Simons DG, Travell JG, Simons LS. Volume 1: upper half of body. In: Travell and Simons’ Myofascial Pain and Dysfunction: The Trigger Point Manual,
2. Ribeiro DC, Belgrave A, Naden A, Fang H, Matthews P, Parshottam S. The prevalence of myofascial trigger points in neck and shoulder-related disorders: a systematic review of the literature. BMC Musculoskelet Disord. 2018;19(1):252. doi:10.1186/s12891-018-2157-9
3. Rha DW, Shin JC, Kim YK, Jung JH, Kim YU, Lee SC. Detecting local twitch responses of myofascial trigger points in the lower-back muscles using ultrasonography. Arch Phys Med Rehabil. 2011;92(10):1576–1580. doi:10.1016/j.apmr.2011.05.005
4. Chiarotto A, Clijsen R, Fernandez-de-las-penas C, Barbero M. Prevalence of Myofascial Trigger Points in Spinal Disorders: a Systematic Review and Meta-Analysis. Arch Phys Med Rehabil. 2016;97(2):316–337. doi:10.1016/j.apmr.2015.09.021
5. Aredo JV, Heyrana KJ, Karp BI, Shah JP, Stratton P. Relating Chronic Pelvic Pain and Endometriosis to Signs of Sensitization and Myofascial Pain and Dysfunction. Semin Reprod Med. 2017;35(1):88–97. doi:10.1055/s-0036-1597123
6. Fernández-de-las-peñas C, Dommerholt J. International Consensus on Diagnostic Criteria and Clinical Considerations of Myofascial Trigger Points: a Delphi Study. Pain Med. 2018;19(1):142–150. doi:10.1093/pm/pnx207
7. Do TP, Heldarskard GF, Kolding LT, Hvedstrup J, Schytz HW. Myofascial trigger points in migraine and tension-type headache. J Headache Pain. 2018;19(1):84. doi:10.1186/s10194-018-0913-8
8. Lewis J, Tehan P. A blinded pilot study investigating the use of diagnostic ultrasound for detecting active myofascial trigger points. Pain. 1999;79(1):39–44. doi:10.1016/s0304-3959(98)00155-9
9. Sikdar S, Shah JP, Gebreab T, et al. Novel applications of ultrasound technology to visualize and characterize myofascial trigger points and surrounding soft tissue. Arch Phys Med Rehabil. 2009;90(11):1829–1838. doi:10.1016/j.apmr.2009.04.015
10. Turo D, Otto P, Shah JP, et al. Ultrasonic tissue characterization of the upper trapezius muscle in patients with myofascial pain syndrome. Annu Int Conf IEEE Eng Med Biol Soc. 2012;2012:4386. doi:10.1109/EMBC.2012.6346938
11. Ballyns JJ, Shah JP, Hammond J, Gebreab T, Gerber LH, Sikdar S. Objective sonographic measures for characterizing myofascial trigger points associated with cervical pain. J Ultrasound Med. 2011;30(10):1331–1340. doi:10.7863/jum.2011.30.10.1331
12. Chen Q, Wang HJ, Gay RE, et al. Quantification of Myofascial Taut Bands. Arch Phys Med Rehabil. 2016;97(1):67–73. doi:10.1016/j.apmr.2015.09.019
13. Sollmann N, Mathonia N, Weidlich D, et al. Quantitative magnetic resonance imaging of the upper trapezius muscles - assessment of myofascial trigger points in patients with migraine. J Headache Pain. 2019;20(1):8. doi:10.1186/s10194-019-0960-9
14. Zaraiskaya T, Kumbhare D, Noseworthy MD. Diffusion tensor imaging in evaluation of human skeletal muscle injury. J Magn Reson Imaging. 2006;24(2):402–408. doi:10.1002/jmri.20651
15. Oudeman J, Nederveen AJ, Strijkers GJ, Maas M, Luijten PR, Froeling M. Techniques and applications of skeletal muscle diffusion tensor imaging: a review. J Magn Reson Imaging. 2016;43(4):773–788. doi:10.1002/jmri.25016
16. Budzik JF, Balbi V, Verclytte S, Pansini V, Le Thuc V, Cotten A. Diffusion tensor imaging in musculoskeletal disorders. Radiographics. 2014;34(3):E56–72. doi:10.1148/rg.343125062
17. Galbán CJ, Maderwald S, Uffmann K, Ladd ME. A diffusion tensor imaging analysis of gender differences in water diffusivity within human skeletal muscle. NMR Biomed. 2005;18(8):489–498. doi:10.1002/nbm.975
18. Yamabe E, Nakamura T, Oshio K, Kikuchi Y, Toyama Y, Ikegami H. Line scan diffusion spectrum of the denervated rat skeletal muscle. J Magn Reson Imaging. 2007;26(6):1585–1589. doi:10.1002/jmri.21184
19. Qi J, Olsen NJ, Price RR, Winston JA, Park JH. Diffusion-weighted imaging of inflammatory myopathies: polymyositis and dermatomyositis. J Magn Reson Imaging. 2008;27(1):212–217. doi:10.1002/jmri.21209
20. Zaccagnini G, Palmisano A, Canu T, et al. Magnetic Resonance Imaging Allows the Evaluation of Tissue Damage and Regeneration in a Mouse Model of Critical Limb Ischemia. PLoS One. 2015;10(11):e0142111. doi:10.1371/journal.pone.0142111
21. Shah JP, Danoff JV, Desai MJ, et al. Biochemicals associated with pain and inflammation are elevated in sites near to and remote from active myofascial trigger points. Arch Phys Med Rehabil. 2008;89(1):16–23. doi:10.1016/j.apmr.2007.10.018
22. Gerwin RD. Classification, epidemiology, and natural history of myofascial pain syndrome. Curr Pain Headache Rep. 2001;5(5):412–420. doi:10.1007/s11916-001-0052-8
23. Jiang F, Yu S, Su H, Zhu S. Assessment of the effects of ischaemia/hypoxia on angiogenesis in rat myofascial trigger points using colour Doppler flow imaging. PeerJ. 2020;8:e10481. doi:10.7717/peerj.10481
24. Heilmeier U, Mamoto K, Amano K, et al. Infrapatellar fat pad abnormalities are associated with a higher inflammatory synovial fluid cytokine profile in young adults following ACL tear. Osteoarthritis Cartilage. 2020;28(1):82–91. doi:10.1016/j.joca.2019.09.001
25. Gupta T, Dhiman RK, Ahuja CK, et al. Characterization of Cerebral Edema in Acute-on-Chronic Liver Failure. J Clin Exp Hepatol. 2017;7(3):190–197. doi:10.1016/j.jceh.2017.04.001
26. Yan R, Gu Y, Ran J, et al. Intratendon Delivery of Leukocyte-Poor Platelet-Rich Plasma Improves Healing Compared with Leukocyte-Rich Platelet-Rich Plasma in a Rabbit Achilles Tendinopathy Model. Am J Sports Med. 2017;45(8):1909–1920. doi:10.1177/0363546517694357
27. National Research Council. Guide for the care and use of laboratory animals. National Academies Press. 2010.
28. Huang QM, Ye G, Zhao ZY, Lv JJ, Tang L. Myoelectrical activity and muscle morphology in a rat model of myofascial trigger points induced by blunt trauma to the vastus medialis. Acupunct Med. 2013;31(1):65–73. doi:10.1136/acupmed-2012-010129
29. Ran J, Ji S, Morelli JN, Wu G, Li X. T2 mapping in dermatomyositis/polymyositis and correlation with clinical parameters. Clin Radiol. 2018;73(12):
30. Kim HK, Laor T, Horn PS, Racadio JM, Wong B, Dardzinski BJ. T2 mapping in Duchenne muscular dystrophy: distribution of disease activity and correlation with clinical assessments. Radiology. 2010;255(3):899–908. doi:10.1148/radiol.10091547
31. Landgraf MN, Ertl-Wagner B, Koerte IK, et al. Alterations in the trapezius muscle in young patients with migraine–a pilot case series with MRI. Eur J Paediatr Neurol. 2015;19(3):372–376. doi:10.1016/j.ejpn.2014.12.021
32. Yao L, Yip AL, Shrader JA, et al. Magnetic resonance measurement of muscle T2, fat-corrected T2 and fat fraction in the assessment of idiopathic inflammatory myopathies. Rheumatology. 2016;55(3):441–449. doi:10.1093/rheumatology/kev344
33. Lan RY, Selmi C, Gershwin ME. The regulatory, inflammatory, and T cell programming roles of interleukin-2 (IL-2). J Autoimmun. 2008;31(1):7–12. doi:10.1016/j.jaut.2008.03.002
34. Hata J, Mizuno S, Haga Y, et al. Semiquantitative Evaluation of Muscle Repair by Diffusion Tensor Imaging in Mice. JBMR Plus. 2018;2(4):227–234. doi:10.1002/jbm4.10040
35. Esposito A, Campana L, Palmisano A, et al. Magnetic resonance imaging at 7T reveals common events in age-related sarcopenia and in the homeostatic response to muscle sterile injury. PLoS One. 2013;8(3):e59308. doi:10.1371/journal.pone.0059308
36. Bryant ND, Li K, Does MD, et al. Multi-parametric MRI characterization of inflammation in murine skeletal muscle. NMR Biomed. 2014;27(6):716–725. doi:10.1002/nbm.3113
37. Zaccagnini G, Palmisano A, Canu T, et al. Magnetic Resonance Imaging Allows the Evaluation of Tissue Damage and Regeneration in a Mouse Model of Critical Limb Ischemia. PLoS One. 2015;10(11):e0142111. doi:10.1371/journal.pone.0142111
38. Feng S, Chen D, Kushmerick M, Multiparameter LD. MRI analysis of the time course of induced muscle damage and regeneration. J Magn Reson Imaging. 2014;40(4):779–788. doi:10.1002/jmri.24417
39. Saotome T, Sekino M, Eto F, Ueno S. Evaluation of diffusional anisotropy and microscopic structure in skeletal muscles using magnetic resonance. Magn Reson Imaging. 2006;24(1):19–25. doi:10.1016/j.mri.2005.09.009
40. Zhang J, Zhang G, Morrison B, Mori S, Sheikh KA. Magnetic resonance imaging of mouse skeletal muscle to measure denervation atrophy. Exp Neurol. 2008;212(2):448–457. doi:10.1016/j.expneurol.2008.04.033
41. Otto LAM, van der Pol WL, Schlaffke L, et al. Quantitative MRI of skeletal muscle in a cross-sectional cohort of patients with spinal muscular atrophy types 2 and 3. NMR Biomed. 2020;33(10):e4357. doi:10.1002/nbm.4357
42. Damon BM, Ding Z, Anderson AW, Freyer AS, Gore JC. Validation of diffusion tensor MRI-based muscle fiber tracking. Magn Reson Med. 2002;48(1):97–104. doi:10.1002/mrm.10198
43. Ha DH, Choi S, Kang EJ, Park HT. Diffusion tensor imaging and T2 mapping in early denervated skeletal muscle in rats. J Magn Reson Imaging. 2015;42(3):617–623. doi:10.1002/jmri.24818
 © 2021 The Author(s). This work is published and licensed by Dove Medical Press Limited. The
full terms of this license are available at https://www.dovepress.com/terms
and incorporate the Creative Commons Attribution
- Non Commercial (unported, 3.0) License.
By accessing the work you hereby accept the Terms. Non-commercial uses of the work are permitted
without any further permission from Dove Medical Press Limited, provided the work is properly
attributed. For permission for commercial use of this work, please see paragraphs 4.2 and 5 of our Terms.
© 2021 The Author(s). This work is published and licensed by Dove Medical Press Limited. The
full terms of this license are available at https://www.dovepress.com/terms
and incorporate the Creative Commons Attribution
- Non Commercial (unported, 3.0) License.
By accessing the work you hereby accept the Terms. Non-commercial uses of the work are permitted
without any further permission from Dove Medical Press Limited, provided the work is properly
attributed. For permission for commercial use of this work, please see paragraphs 4.2 and 5 of our Terms.