Back to Journals » Drug Design, Development and Therapy » Volume 10
Combined computational and experimental studies of molecular interactions of albuterol sulfate with bovine serum albumin for pulmonary drug nanoparticles
Authors Lin S, Cui W, Wang G, Meng S, Liu Y, Jin H, Zhang L, Xie Y
Received 9 June 2016
Accepted for publication 27 July 2016
Published 15 September 2016 Volume 2016:10 Pages 2973—2987
DOI https://doi.org/10.2147/DDDT.S114663
Checked for plagiarism Yes
Review by Single anonymous peer review
Peer reviewer comments 2
Editor who approved publication: Prof. Dr. Wei Duan
Shao-Hui Lin,1 Wei Cui,2 Gui-Ling Wang,1 Shuai Meng,1 Ying-Chun Liu,3 Hong-Wei Jin,4 Liang-Ren Zhang,4 Ying Xie1,4
1Beijing Key Laboratory of Molecular Pharmaceutics and New Drug Delivery Systems, Department of Pharmaceutics, School of Pharmaceutical Sciences, Peking University, 2School of Chemistry and Chemical Engineering, University of Chinese Academy of Sciences, Beijing, 3Soft Matter Research Center, Department of Chemistry, Zhejiang University, Hangzhou, 4State Key Laboratory of Natural and Biomimetic Drugs, Peking University, Beijing, People’s Republic of China
Abstract: Albumin-based nanoparticles (NPs) are a promising technology for developing drug-carrier systems, with improved deposition and retention profiles in lungs. Improved understanding of these drug–carrier interactions could lead to better drug-delivery systems. The present study combines computational and experimental methods to gain insights into the mechanism of binding of albuterol sulfate (AS) to bovine serum albumin (BSA) on the molecular level. Molecular dynamics simulation and surface plasmon resonance spectroscopy were used to determine that there are two binding sites on BSA for AS: the first of which is a high-affinity site corresponding to AS1 and the second of which appears to represent the integrated functions of several low-affinity sites corresponding to AS2, AS3, and AS8. AS1 was the strongest binding site, established via electrostatic interaction with Glu243 and Asp255 residues in a hydrophobic pocket. Hydrogen bonds and salt bridges played a main role in the critical binding of AS1 to BSA, and water bridges served a supporting role. Based upon the interaction mechanism, BSA NPs loaded with AS were prepared, and their drug-loading efficiency, morphology, and -release profiles were evaluated. Successful clinical development of AS-BSA-NPs may improve therapy and prevention of bronchospasm in patients with reversible obstructive airway disease, and thus provide a solid basis for expanding the role of NPs in the design of new drug-delivery systems.
Keywords: molecular dynamics, surface plasmon resonance, interaction mechanism, BSA nanoparticles, drug delivery systems
Introduction
Albuterol sulfate (AS), also called salbutamol, is a water-soluble, relatively selective β2-adrenergic agonist. It is used clinically to treat asthma, chronic obstructive pulmonary disease, and bronchiectasis. The chemical name of AS is 1-(4-hydroxy-3-hydroxymethlphenyl)-2-(tert-butylamino)ethanol sulfate (2:1) (salt). Pharmaceutical formulations of AS include tablets, syrups, metered dose inhalers, and nebulized inhalation solutions.1 These formulations provide lung-deposition ratios of only 5.5%–40.5%.2
The potential for nanoparticles (NPs) to provide improved drug delivery to the lungs is well recognized.3 This is attributed to their ability to reduce macrophage uptake and improve pulmonary deposition and retention profiles.4,5 Albumin NPs have the potential to be developed for pulmonary drug-delivery systems (DDSs), with improved sustained release and reduced toxicity. Albumin is an abundant component of lung-lining fluid, with a concentration approximately 10% of that found in serum,6 and has favorable biocompatibility. Self-assembling albumin NPs containing doxorubicin have been shown to significantly reduce tumor size following pulmonary administration in a mouse model of lung cancer.7 Tacrolimus, an insoluble therapeutic agent, has been encapsulated in albumin NPs for pulmonary fibrosis therapy, and these NPs have remarkable antifibrotic efficacy in mice.8 In our previous research, bovine serum albumin (BSA) NPs carrying IFN were successfully prepared for pulmonary administration.9 However, the development of AS-loaded BSA-NPs has not been reported.
The interaction between drug and carrier is one of the important factors to be considered in developing a new DDS.10 A systematic understanding of these interactions is essential for the design, development, and optimization of new types of NPs.11 Currently, a lot of methods, including experimental techniques and theoretical calculations, have been used for studying drug–serum albumin interactions. Experimental strategies, such as Fourier transform infrared spectroscopy,12,13 synchronous fluorescence spectroscopy,12,14,15 ultraviolet–visible spectroscopy,13,14 circular dichroism spectra,16 and Förster resonance energy transfer,15 can provide molecular information from a macro perspective, but these conventional strategies have limited ability to reveal specific binding sites of drug molecules to albumin. Theoretical calculations like molecular dynamics (MD) simulations have the potential to study these binding site interactions and provide insights into the structure and dynamics of complex systems at the atomic level at shorter timescales (nanosecond) for biological processes.17 Surface plasmon resonance (SPR) spectroscopy may reveal binding mechanisms and improve our molecular models of ligand–receptor interactions. It exploits the excitation of surface plasmon to investigate such molecular interactions in real time with high sensitivity, but without requiring any additional molecular probes.18,19 Furthermore, the release behaviors found with drug NPs may indirectly mirror the interactions between drugs and carriers.
BSA is widely utilized as a carrier protein in experimental research and the pharmaceutical industry,20,21 because it has low cost, abundant availability, and similarity to human serum albumin.22 In this study, both computational and experimental methods were utilized to explore the mechanism of AS–BSA interaction. Accordingly, MD simulation was performed first to explore binding sites, binding affinity, and the critical binding site on BSA. Binding energy calculation and decomposition of binding free energy were performed subsequently. Then, SPR spectroscopy was conducted for the sake of revealing the binding mechanism and model of AS and BSA in real time. Following the combination of the results of MD and SPR, the binding mechanism was hypothesized. Finally, a series of experiments, including preparation, characterization, and in vitro release, were carried out to verify the hypothesis. The interaction analysis between drug and carrier was found to be of benefit for the rational design of formulations of AS to BSA-NPs, which may be developed as novel pulmonary DDSs.
Materials and methods
Materials
BSA (biotechnology grade) was purchased from Hoffman-La Roche Ltd (Basel, Switzerland). AS was obtained from Beijing Ouhe Chemistry Technology Co Ltd (Beijing, People’s Republic of China). N-Ethyl-N′-(3-dimethylaminopropyl)carbodiimide, N-hydroxysuccinimide, ethanolamine, and phosphate-buffered saline (PBS)-P buffer were all supplied from GE Healthcare Bio-Sciences AB (Uppsala, Sweden). All other chemicals purchased were of analytical grade.
Initial structure construction
The crystal structure of BSA (code 3V03)23 was obtained from the Protein Data Bank (http://www.rcsb.org/pdb/explore/explore.do?structureId=3V03), and then was modified using Sybyl-X 2.0 (Certara LP, Princeton, NJ, USA) to construct a complete three-dimensional structure of BSA, with two residues absent at the N-terminal (D1–T2).9 A protonated AS molecule was constructed by ChemOffice 2010 (CambridgeSoft Corporation, Cambridge, MA, USA), and is shown in Figure 1. This structure was then optimized in Gaussian 0324 using the B3LYP/6-31+G basis set after HF/3-21G small-basis-set optimization. The topology and coordinate files were generated by general AMBER (V12, University of California, LA, USA) (assisted model building with energy refinement) force field25 and acpype.py.26
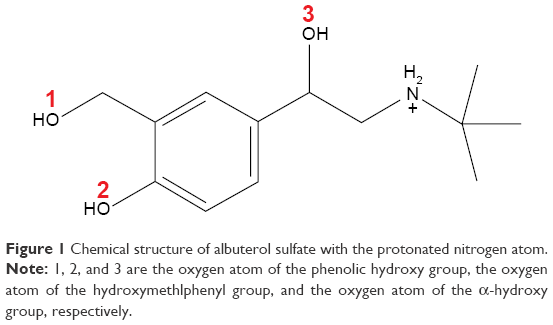 | Figure 1 Chemical structure of albuterol sulfate with the protonated nitrogen atom. |
Optimization of BSA structure
After refinement of the original BSA structure, a GROMACS 5.0.2 (Royal Institute of Technology and Uppsala University, Sweden)27 program was used to optimize the structure for a reasonable MD simulation. The BSA was modeled in a cubic box with a radius of 11.2 nm, and all residues were parameterized using an AMBER 03 all-atom force field.28 The box was solvated with TIP3P water molecules29 and neutralized by sodium ions. In order to establish appropriate geometry, energy was relaxed using the steepest-descent minimization algorithm for all atoms until the maximum force was no larger than 100 kJ/mol/nm. After the energy convergence, the system was conducted under 1 ns constant number, volume, and temperature ensemble with temperature maintained at 298 K and then 1 ns constant number, pressure, and temperature equilibration with pressure at 101.3 kPa, using Nosé–Hoover thermostat30 and Parrinello–Rahman algorithm,31 respectively. Long-range electrostatics were described by the particle-mesh Ewald method32 with a cutoff of 12 Å, and Lennard-Jones interaction was calculated with a cutoff of between 10 and 11 Å with smooth switching. All bonds were constrained by LINCS algorithms.33 The time step was set to 2 fs and the timescale was 5 ns. Trajectory was collected every 10 ps for analysis.
Molecular dynamics simulation
The 40 ns simulation of the BSA-AS complex system was performed using GROMACS 5.0.227 for atomic insights into complex interactions. A box was created with a radius of 11.2 nm, and then one BSA molecule after 5 ns optimization and ten AS molecules after Gaussian optimizing were added into the box. The following procedures and the parameters were the same as used in the optimization of BSA. Following the 40 ns MD simulation, the trajectory was analyzed, and visualization of all trajectories was performed using visual MD.
Binding energy calculation and decomposition
A new GROMACS tool named g_mmpbsa,34 with performance comparable to the AMBER package35 that implements a molecular mechanics Poisson–Boltzmann surface area approach,36 was used to calculate the complex binding energy from MD trajectories. From the production trajectory, 20 snapshots with an interval of 0.2 ns from 33 to 35 ns were extracted. Both the binding free energy components (ΔEelec, ΔEvdw, ΔGpolar, and ΔGnonpolar) and the binding free energy decomposition were calculated by g_mmpbsa, with zero ionic concentration at 298 K and other parameters being set based on the developer’s publication.34
Surface plasmon resonance spectroscopy
The binding affinity of AS with BSA was assayed using the SPR-based Biacore T200 (GE Healthcare) at 298 K.37,38 BSA was covalently immobilized on a CM5 gold sensor chip (GE Healthcare) by standard amine-coupling chemistry. To activate the carboxyl groups on the sensor surface, a mixture solution of N-ethyl-N′-(3-dimethylaminopropyl)carbodiimide and N-hydroxysuccinimide was injected at a flow rate of 10 μL/min. Then, BSA in 10 mM sodium acetate buffer (pH 4) was injected at a flow rate of 5 μL/min until the immobilization level was more than 6,000 response units (RU). Finally, the remaining active sites in the flow cell were blocked by ethanolamine. The reference flow cell was activated and blocked in the absence of BSA as a control for nonspecific binding. A series of AS solutions with concentration from 1.01 mM to 0.982 μM were prepared using PBS-P buffer (20 mM phosphate buffer, 2.7 mM NaCl, 137 mM KCl, 0.05% surfactant P-20, pH 7.4) with a twofold-dilution method. The solutions were perfused through the BSA immobilization flow cell and a blank immobilization flow cell at 30 μL/min for 60 seconds, followed by dissociation for 10 minutes with running buffer (PBS-P). The data were analyzed by using the Biacore T200 Evaluation software version 2.0 (GE Healthcare Bio-Sciences AB, Upplasa, Sweden).
Preparation of AS-loaded BSA-NPs
BSA-NPs were prepared by a desolvation method with minor modification, as previously reported.39 AS was loaded into BSA-NPs by two techniques. In the incorporation method, different concentrations of AS (0.5, 1, or 2 mg/mL) were incubated with 1% BSA for 30 minutes.40 The aqueous solution was 6 mL in volume (pH 7.5) before the synthesis of the NPs. Then, 20 mL of ethanol was added dropwise into the solution under continuous magnetic stirring at room temperature. Subsequently, 100 μL 4% glutaraldehyde was added under stirring, and the solution was stirred overnight to allow cross-linking. The ethanol was then evaporated under vacuum at 313 K to obtain suspensions of AS-BSA-NPs (ABNI).
In the adsorption method, 1% blank BSA-NPs were prepared first according to the method described earlier, without adding the drug, and incubated. Then, different concentrations of AS (0.5, 1, or 2 mg/mL) were incubated with the 1% blank BSA-NPs at room temperature for 24 hours, and AS-BSA-NPs (ABNA) suspensions were obtained.
Drug-loading efficiency of BSA-NPs
The ability of BSA-NPs to load AS is expressed by drug-loading (DL) efficiency, which was calculated as follows:
| (1) |
where cAS-free and V are the AS concentration and volume of AS in filtrate, respectively, while mAS-total and mBSA-total are the whole mass of AS and BSA in the preparation, respectively.
To determine the DL, the free drug in AS-BSA-NP suspension was separated by ultrafiltration (molecular weight cutoff 30 kDa; EMD Millipore, Billerica, MA, USA) at 10,000 rpm for 15 minutes and was analyzed by ultraviolet spectrophotometry (λ=276 nm). Subsequently, the concentration of AS was calculated by the standard equation between the adsorption intensity of AS and its concentration.
Particle size and morphology of AS-BSA-NPs
The ABNI and the ABNA were chosen for the particle-size and morphology examination, and the AS concentration of both was 2 mg/mL. After dilution with distilled water, the mean grain size and polydispersity index of AS-BSA-NPs were determined by dynamic light scattering using a Nano series Zen 4003 Zetasizer (Malvern Instruments, Malvern, UK), with the following parameters: 298 K, running 15 times, equilibrium time of 60 seconds. Transmission electron microscopy (TEM) was used to observe and confirm the morphology of the AS-BSA-NPs (JEM-1230; JEOL, Tokyo, Japan).
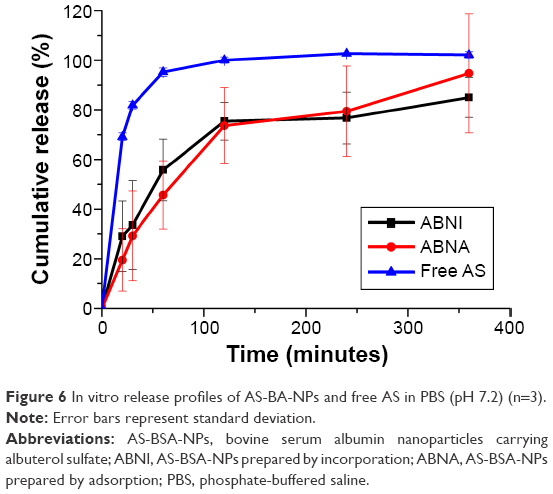
In vitro release of AS-BSA-NPs
For probing the velocity and degree of AS release from AS-BSA-NPs, the in vitro release behavior of AS was monitored by using the dialysis-bag diffusion method described previously.41 ABNI and the ABNA were chosen for the release assay using an AS concentration of 2 mg/mL. A dialysis bag (molecular weight cutoff 8–14 kDa) with 2 mL of prepared NPs was placed in a conical flask with a stopper containing 25 mL pH 7.2 PBS (0.01 mol/L) and spun at 50 rpm at 310±0.5 K. At a predetermined time point, 2 mL release medium was collected and replaced with 2 mL of fresh PBS. Free AS solution (2 mg/mL) in water was used as the positive control. The amount of AS released was evaluated using ultraviolet–visible spectrometry (λ=276nm), and the release curve of cumulative drug release versus time was made accordingly. Cumulative drug release (CR%) was calculated with the following formula:
| (2) |
where cn is the concentration of AS in the supernatant at a given time point, ci is the concentration of AS in the supernatant at a previously given time, mtotal is the total mass of AS in AS-BSA-NPs, 25 is the volume of the release medium, and the 2 represents the sample volume at each given time.
Results
Optimization of the initial BSA
To ensure the rationality of the BSA structure for further MD simulation, free BSA was optimized first. As shown in Figure 2A, the root-mean-square deviation (RMSD) of the backbone atoms reached equilibrium approximately 3.5 ns and fluctuated approximately 0.17 nm, indicating that the three-dimensional structure of the free BSA was stable and reasonable after 5 ns simulation. The structures became more compact for major structural features42,43 of the free BSA after 5 ns simulation. The structural features included pocket volume, solvent-accessible surface, and pocket depth, which were slightly smaller than those of the initial free BSA (Supplementary materials).
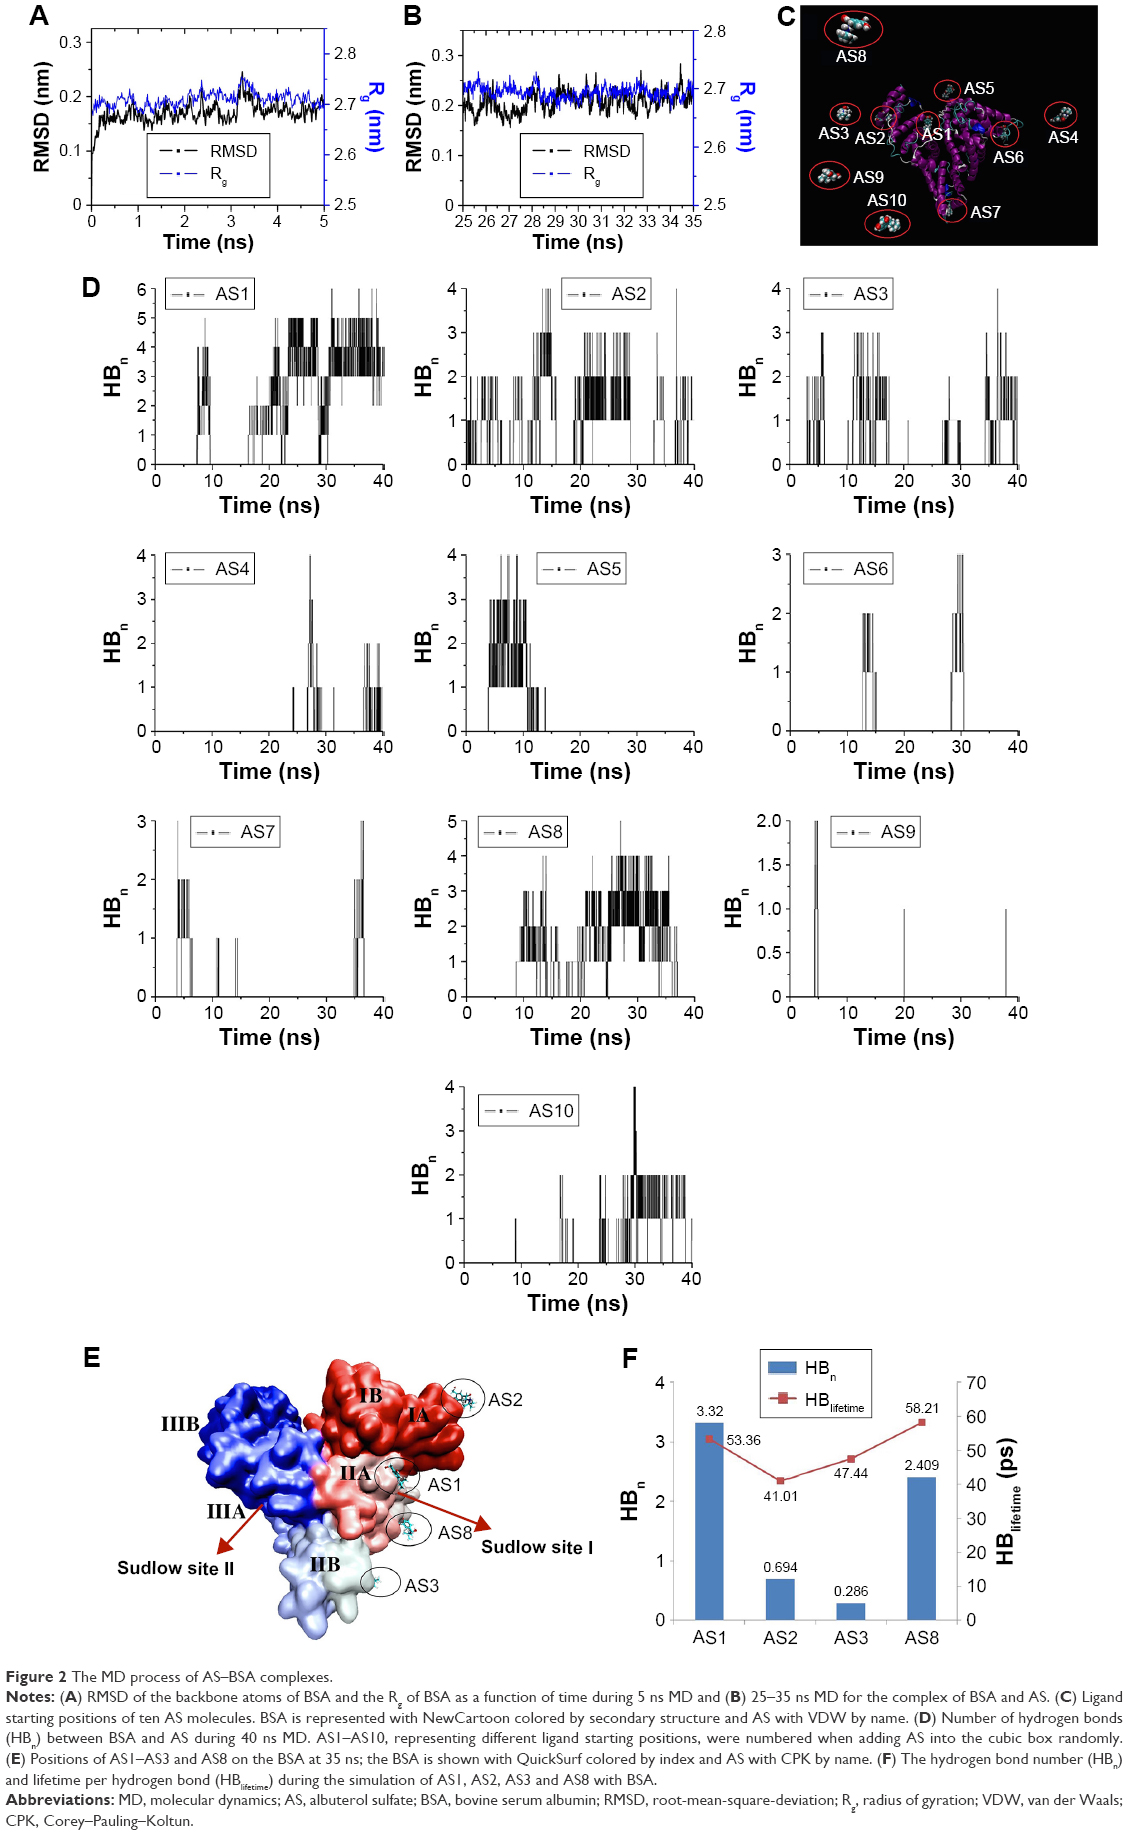 | Figure 2 The MD process of AS–BSA complexes. |
Binding sites and stability
To elucidate the mechanism of AS binding to BSA, MD simulation of one BSA with ten AS molecules for 40 ns (Figure 2C) in a cubic box was carried out. During the simulation, the RMSD of the backbone of the complex with respect to its initial structure was found to reach equilibrium within 25–35 ns and fluctuated approximately 0.20 nm (see Supplementary materials), manifesting equilibration during that period of time. Therefore, trajectories for 25–35 ns were extracted and used for further analyses.
The radius of gyration not only demonstrated the compactness of protein structures but also provided insights into complex changes in molecular shape.44 Both free BSA and the AS-BSA complex demonstrated similar radii approximately 2.7 nm (Figure 2A and B), indicating that the compactness of BSA remained unchanged in the presence of AS. However, the fact that the RMSD value of the complex (Figure 2B) was slightly larger than that of the free BSA (Figure 2A) suggested that a synergic conformational change45 between AS and BSA might have occurred.
The number of hydrogen bonds formed between BSA and each AS molecule versus the time during MD for 40 ns is displayed in Figure 2D. The number of hydrogen bonds of four sites (AS1, AS2, AS3, and AS8) showed higher prevalence than the other sites, ie, these four sites appeared to be the strong binding sites for AS on BSA. Accordingly, a further analysis of these four candidate sites (Figure 2E) during a 25–35 ns simulation was performed in terms of the average number of hydrogen bonds (HBn) per time frame and the average lifetime of each hydrogen bond (HBlifetime). As depicted in Figure 2F, the results indicated that the binding of AS1 and AS8 to BSA was stronger than that of AS2 or AS3.
Based on the production trajectory, the binding free energy of AS to BSA was calculated by g_mmpbsa. The binding free energy of AS to BSA in the four potential binding sites and the contribution of each component are summarized in Table 1. Binding free energy can be divided into nonpolar energy (ΔEvdw + ΔGnonpolar) and polar energy (ΔEele + ΔGpolar).46 Generally, the van der Waals interaction (ΔEvdw) and the nonpolar solvation energy (ΔGnonpolar) are closely correlated with the hydrophobic interaction: ΔEvdw + ΔGnonpolar values were −39.1, −45.2, −21.2, and −47.1 kJ/mol for AS1, AS2, AS3, and AS8 binding to BSA, respectively, and they failed to achieve statistical significance. This result made it clear that it was the aromatic ring of AS that played the main role in the weak hydrophobic interaction with BSA amid four candidate sites. Polar energy is associated with electrostatic interaction (ΔEele).46 ΔEele + ΔGpolar values were −233.6, −15.2, −19.7, and −28.2 kJ/mol for AS1, AS2, AS3, and AS8 binding to BSA, respectively. Obviously, the polar energy of AS1 to BSA was significantly larger than the others, and showed an important contribution to binding free energy. This result indicated that AS1 had an appreciable electrostatic interaction, while others had weaker electrostatic interactions with BSA. Overall, AS1, with a total binding free energy of −272 kJ/mol, had the strongest binding affinity among the four putative strong-binding sites, and the binding stability of AS to BSA was in the order of AS1 > AS2 ≈ AS3 ≈ AS8, which was in good agreement with the previous general hydrogen bond analysis. Therefore, AS1 was the strongest binding site.
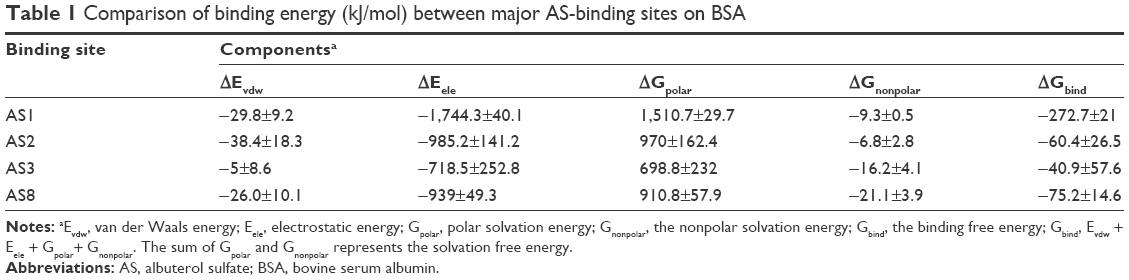 | Table 1 Comparison of binding energy (kJ/mol) between major AS-binding sites on BSA |
Critical site interactions
To gain more understanding of the mechanisms at the atomic level, detailed interactions of AS1 with BSA were analyzed. As outlined in Table 2, there were probably nine hydrogen bonds, with five of them noteworthy. The key hydrogen bonds are represented in Figure 3A. It can be seen that the amino group of Lys239 formed a hydrogen bond with the oxygen (O3) of AS1 (HB2) and was oriented just above the aromatic ring of AS1, which implied that the cation–π interaction probably existed at the same time. Hydrogen bonds between the carboxyl group of Glu243 and the hydroxyl group (O1–H) of AS1 came into existence (HB3 and HB4). The carboxyl group of Asp255 formed hydrogen bonds with the oxygen (O3) and the amino group of AS1 simultaneously (HB6 and HB9). All these hydrogen bonds were stable, with duration time all over 80% (Table 2). In other words, they were not easy to break during simulation. Additionally, a salt bridge came into being between the carboxyl group of Asp254 and the amino group of AS1. As reported by Xu et al,47 hydrogen bonds and salt bridges play major roles in electrostatic interactions, and relate to why AS1 and BSA had the strongest interaction.
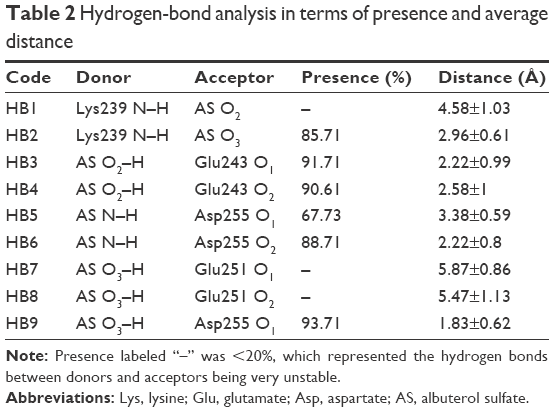 | Table 2 Hydrogen-bond analysis in terms of presence and average distance |
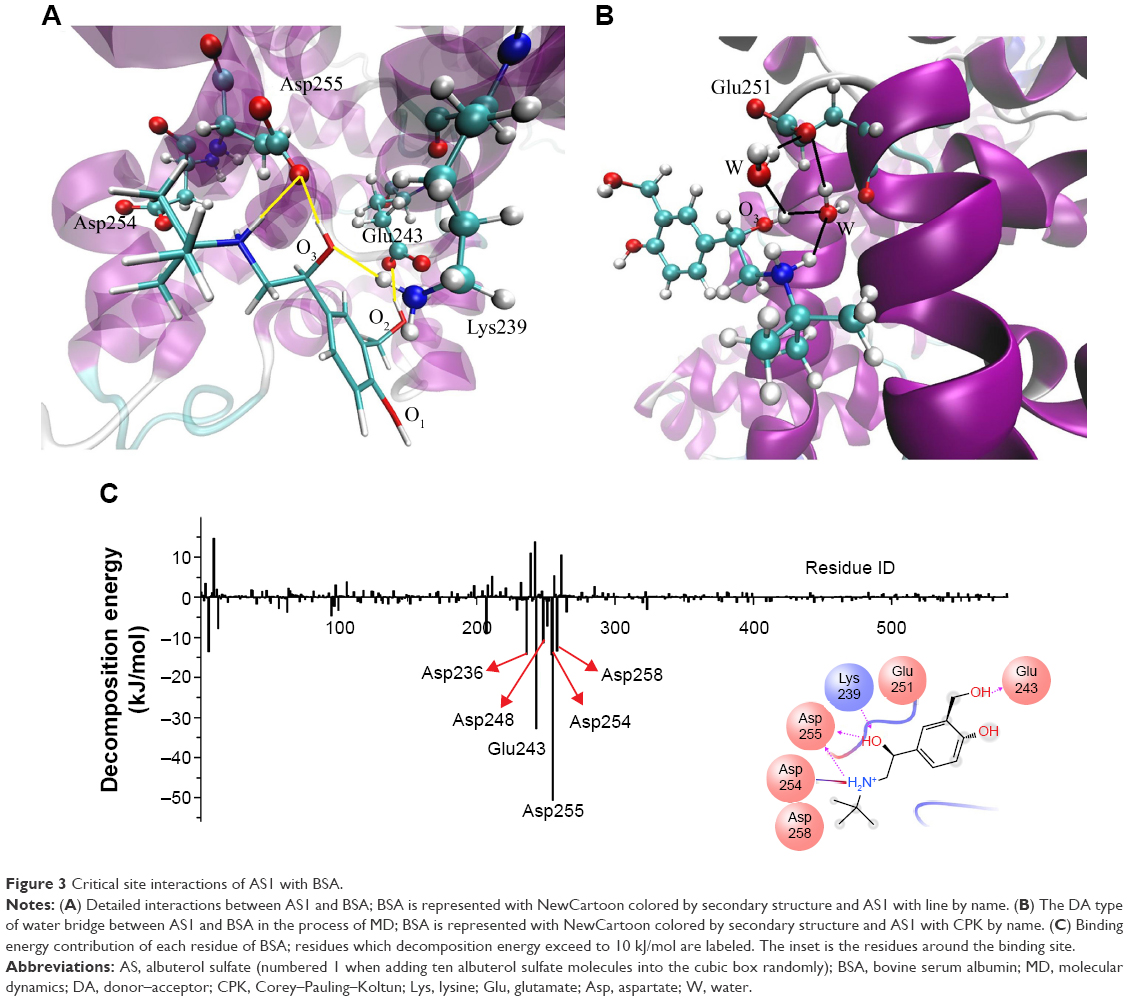 | Figure 3 Critical site interactions of AS1 with BSA. |
Water molecules can simultaneously donate and accept two hydrogen bonds, making four types of water bridges feasible (donor–donor, acceptor–acceptor, donor–acceptor, and acceptor–donor).48 Water bridges of the donor–acceptor type were formed (Figure 3B) when the carboxyl group of Glu251 interacted spontaneously with the oxygen (O3) and the amino group of AS1 via water molecules. Unlike hydrogen bonds and salt bridges, water bridges with their weak interaction played a supporting role in the interaction between AS and BSA.9
The energy decomposition of each residue to the whole AS1–BSA complex system is presented in Figure 3C. It can be seen that residues in or around the binding site played an important role in the binding of AS1 to BSA. Moreover, Glu243 and Asp255 were the biggest contributors, indicating they were the main anchor residues responsible for the stability of the AS1–BSA complex. This result was in accordance with the detailed interaction analysis (Table 2).
Affinity of AS with BSA using SPR
The SPR dose–response sensorgram of AS to immobilized BSA is shown in Figure 4A. Apparently, the binding mode of AS to BSA was fast association and dissociation for equilibrium (steady state), which indicated that no chemical interactions occurred when AS contacted BSA. Based upon the response versus AS concentration (Figure 4B), the 1:1 Langmuir binding model from the Biacore T200 Evaluation software version 2.0 was used to fit the data. Two binding sites were derived, and yielded an average equilibrium dissociation constant (with standard deviation) for the first site (maximum <3 RU) of 1.163×10⁻⁵±2.3×10⁻⁶ M and for the second site (maximum <22 RU) of 8.892×10⁻⁴±2.2×10⁻⁴ M. χ2-Values for these were 0.165 and 0.272, respectively, which demonstrated that the data fitting separated into two sites was reasonable.
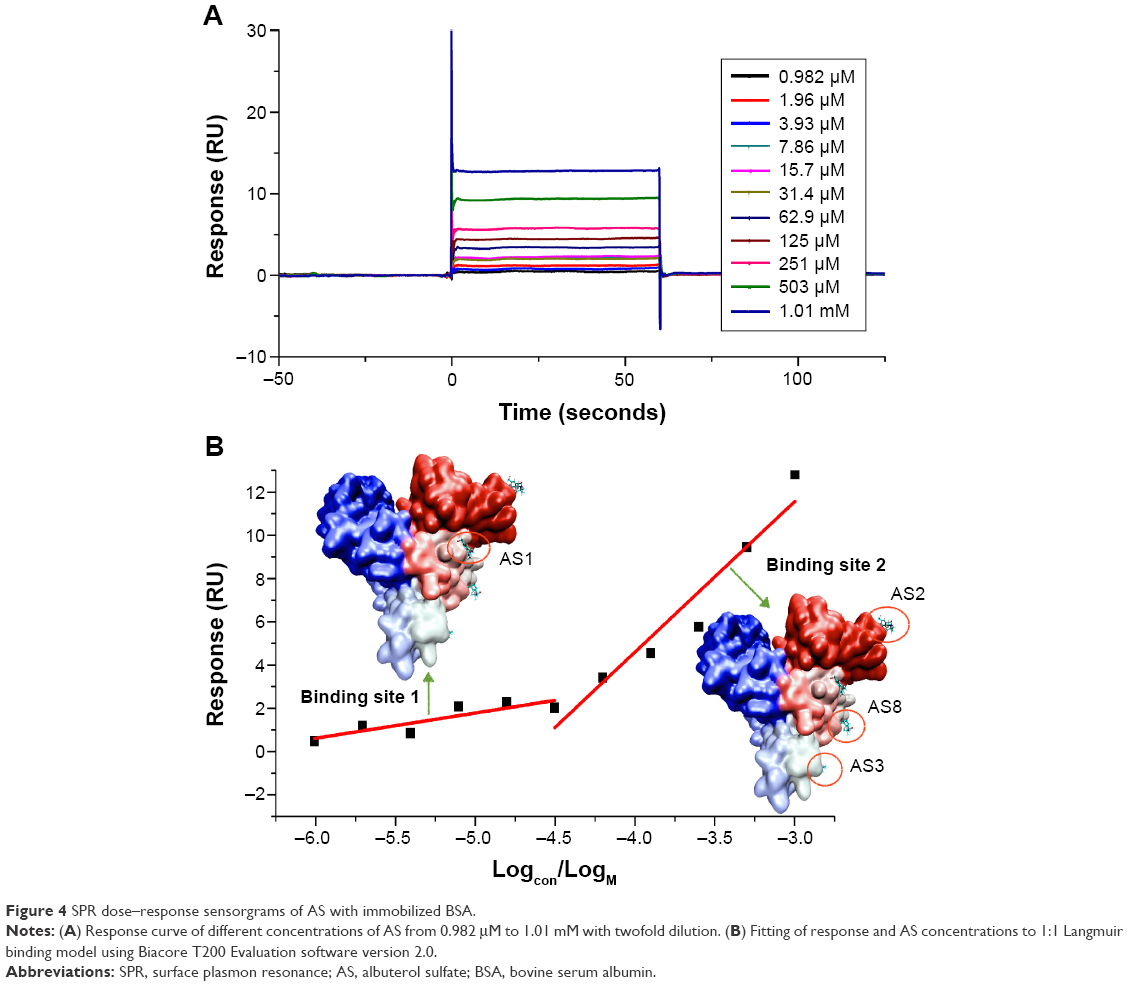 | Figure 4 SPR dose–response sensorgrams of AS with immobilized BSA. |
Drug-loading efficiency of BSA-NPs
Various combinations of AS with BSA were taken, and the synthesis of BSA-NPs was done using the desolvation method to ascertain the feasibility of BSA-NPs carrying AS in the experiment. The DL of AS-BSA-NPs prepared by two techniques is given in Table 3. Interestingly, the DL of ABNI was quite different to that of ABNA. The DL of ABNI increased upon AS concentration, and seemed closely in direct proportion to it. On the other hand, the DL of ABNA was independent of the AS concentration. When the perspective was focused on the binding molecular ratio of BSA bound with AS, it was found that the number of AS molecules bound to one BSA molecule increased from two to eight when the concentration of AS ranged from 0.5 to 2 mg/mL in ABNI, while it was fixed at four in ABNA, irrespective of the AS concentration.
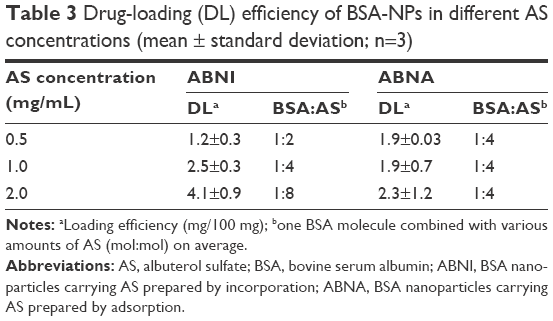 | Table 3 Drug-loading (DL) efficiency of BSA-NPs in different AS concentrations (mean ± standard deviation; n=3) |
Particle size and morphology of AS-BSA-NPs
The suspensions of ABNI and ABNA obtained were opalescent. As determined by dynamic light scattering, the average diameters of ABNI and ABNA were 199.9±13.2 and 177.6±2.5 nm, respectively. Both had a narrow distribution with a polydispersity index of 0.248±0.064 and 0.167±0.033, respectively (Figure 5A and B), implying high thermodynamic stability without aggregation of particles in aqueous media. TEM images showed that both ABNI and ABNA were spherical (Figure 5C and D) with no significant difference in morphology, and particle size measured from TEM coincided with that from dynamic light scattering.
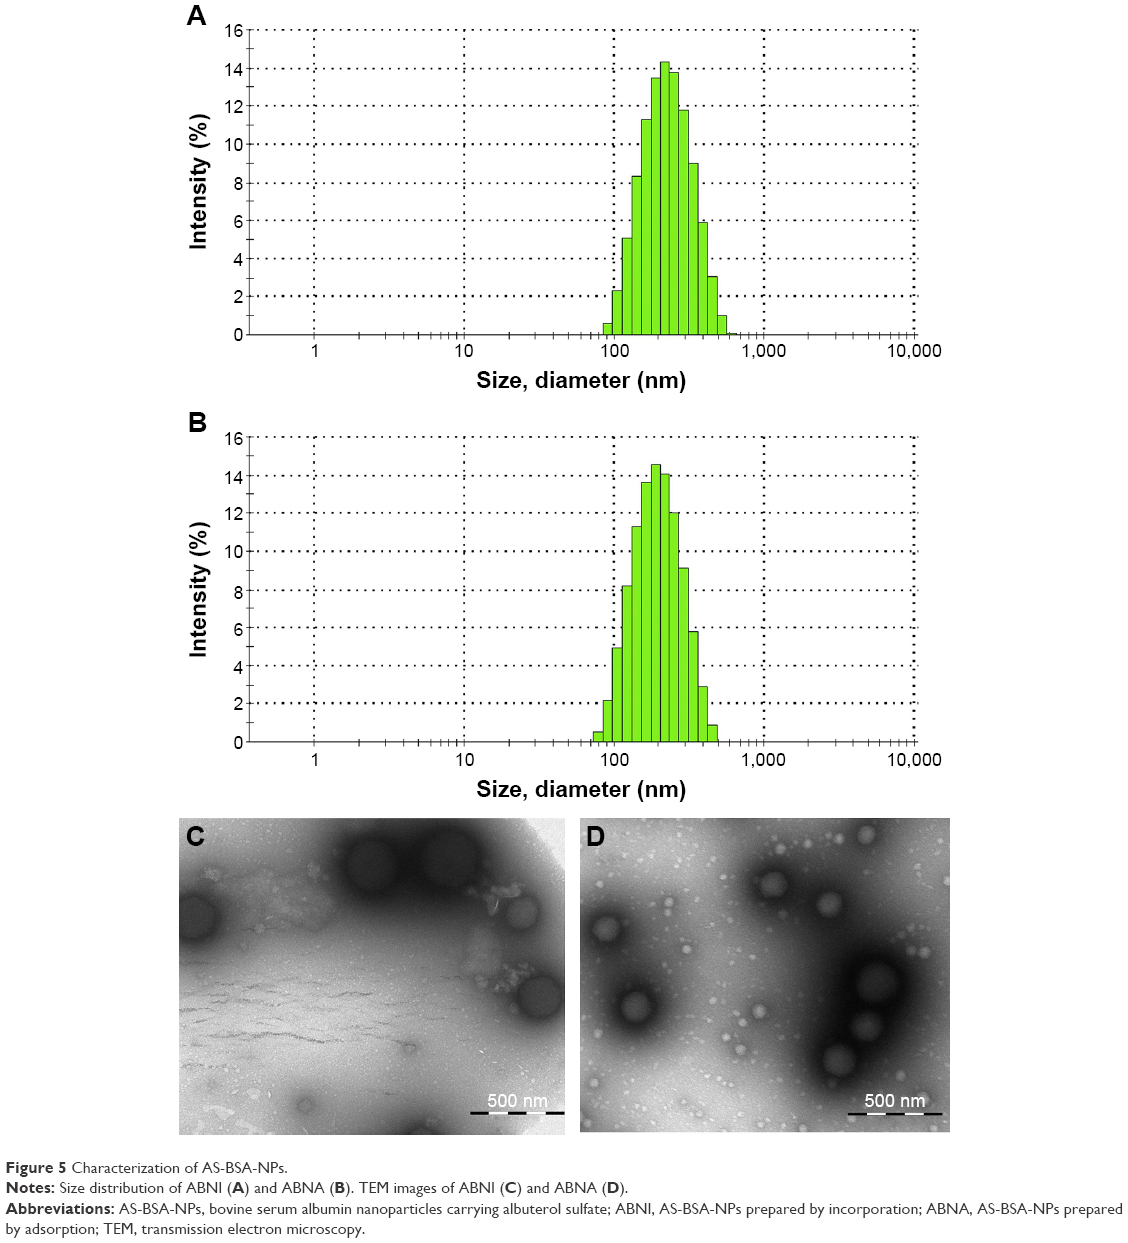 | Figure 5 Characterization of AS-BSA-NPs. |
In vitro release profiles of AS-BSA-NPs
The release mechanism of AS from NPs was investigated by dialysis-membrane diffusion at 310 K. As the cumulative release (%) curve versus time (Figure 6) shows, free AS released rapidly, indicating the dialysis membrane did not restrict its release behavior. Both ABNI and ABNA released AS significantly more slowly than free AS, characterizing the sustained-release profiles of AS-BSA-NPs. The DL values of ABNI (4 mg/100 mg) and ABNA (2 mg/100 mg) were different, but there was no statistically significant difference in cumulative AS release (%). Fitting of drug-release data to various kinetic models was performed, and the results are shown in Table 4. The best-fitting model for both ABNI- and ABNA-release mechanisms was first-order kinetics.
 | Figure 6 In vitro release profiles of AS-BA-NPs and free AS in PBS (pH 7.2) (n=3). |
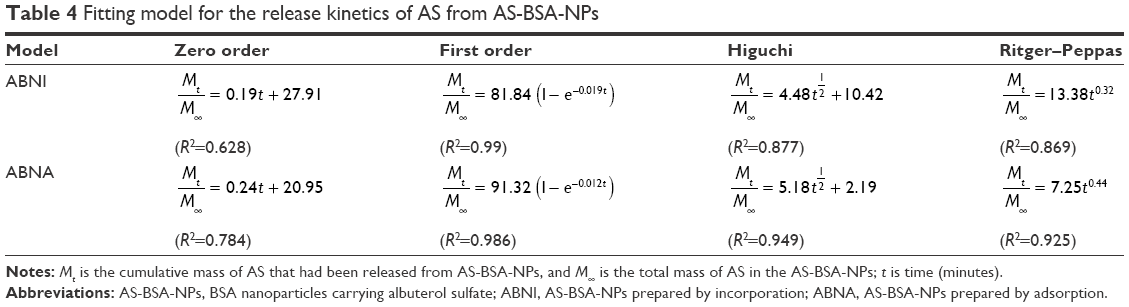 | Table 4 Fitting model for the release kinetics of AS from AS-BSA-NPs |
Discussion
Albumin NPs are of enormous significance for the development of safer and more efficient drug-carrier systems; their specific biological advantages include biodegradability, nontoxicity, and nonimmunogenicity.49,50 Additionally, they manifest better stability during storage, and have the special property of targeting tumors and inflamed tissues. These factors make albumin NPs a promising drug carrier in targeted DSs.51,52
Abraxane®53 was approved by the US Food and Drug Administration in 2005, and brought a promising perspective to albumin NPs in clinical applications. Additionally, the freely water-soluble drug sodium ferulate has been encapsulated within BSA-NPs as a strategy for hepatic-targeted drug delivery; it achieved considerable drug accumulation in mouse liver.39 Although pharmaceutical and biological evaluations have been done on BSA-NPs for DL, investigations into the interactions between drugs and BSA at the atomic level are lacking. With the development of digital technology, computer modeling can assist in the rational design of DDSs with improved and optimized technologies.54 Complementary experimental and computational studies could enhance our understanding of the underlying interactions of BSA with drug molecules.
BSA, which is comprised of 583 amino acid residues, contains three homologous domains (I, residues 1–195; II, residues 196–383; III, residues 384–583), each of which can be divided into two subdomains (A and B).13,55 It is known to contain two major binding sites for the majority of drugs, namely Sudlow site I (also often called the warfarin-binding site)56 and Sudlow site II (also often called the benzodiazepine site)57 (Figure 2E). Sudlow site I, located in subdomain IIA, is a big hydrophobic cavity where interactive associations of drugs bind.55 Additionally, Sudlow site II, located in subdomain IIIA, is a strong binding site for fatty acids.58,59
In our research, AS1, the high-affinity site located in Sudlow site I (subdomain IIA), was consistent with previous reports from studies by spectroscopic methods.12–16 Interestingly, it seemed that molecules like warfarin, with bulky heterocyclic and aromatic groups near a central location of the molecule, were more likely to bind at Sudlow site I.60 This binding occurred via hydrophobic interactions with a tryptophan residue in the cavity. However, AS1 presented as having high affinity for this site via strong electrostatic interaction rather than tryptophan residue (Figure 3C), as a result of hydrogen bonds that formed between AS1 and Glu243 and Asp255 (Figure 3A and B). This may indicate that the hydrophobic cavity also contains two clusters of polar residues: an inner cluster toward the bottom of the pocket and an outer cluster at the pocket entrance.56 Except for AS1, the other sites were of low affinity via weak hydrophobic and electrostatic interaction.
SPR that has emerged during the last 2 decades is a suitable and reliable platform in the detection of low- and high-affinity interaction for biomolecular interactions.19,61 In this study, the results from both SPR and the MD simulation confirmed that there were two binding sites: the first of which was the high-affinity site corresponding to AS1 (Figure 4B) and the second of which might represent the integrated performance of several low-affinity sites corresponding to AS2, AS3, and AS8 (Figure 4B). The mechanistic research on AS binding to BSA suggests a valuable strategy for understanding the interactions of water-soluble drugs with BSA.
The pKa and log-P values of albuterol were 10.3 and 1.3, respectively, indicating its strong hydrophilic characteristics and weak alkalinity. The interaction of protonated AS with BSA, as seen in the MD simulation, suggested that a low-pH environment would augment AS binding by BSA-NPs. The experimental practices proved that the pH value of the aqueous solution was optimized to be 7.5 when the maximum DL was achieved. ABNI would not have been successfully prepared if the pH value continued to decrease, because the isoelectric point of BSA is 4.7.
As there were several binding sites on BSA for protonated AS, as the amount of AS per volume solution increased, the BSA to binding AS went up as well, ie, the DL of ABNI was positively correlated with the AS concentration used for the preparation. Nevertheless, in the adsorption method, the BSA was first fabricated into the BSA-NP matrix, and then drugs were adsorbed onto the matrix surface. After achieving the kinetic equilibrium state, no further net AS would be absorbed onto the matrix. Ultimately, the DL of ABNA is independent of AS concentration used for preparation. As reported previously12 with regard to water-soluble drugs, DL can be augmented in BSA-NPs with 12-hour incubations. The present investigation of interactions between AS and BSA not only provides a theoretical basis to explain the efficacy of preincubation, but also serves as a guideline for improving the DL of BSA-NPs.
Even though the method of BSA-NPs carrying AS was different, the release profiles of both ABNI and ABNA showed best fit in a first-order kinetics model. They also presented some information on sustained-release profiles, and documented that AS released completely within 6 hours. It was clear that the interactions of AS with the NPs (either being encapsulated into BSA-NPs via electrostatic interaction or being absorbed onto the BSA-matrix surface) were physical. Consequently, under the force of concentration gradients, AS release followed the same kinetic law. Since AS is a-first-line agent for treatment and prevention of bronchospasm in patients with asthma and chronic obstructive pulmonary disease,62,63 the pharmacodynamic properties of AS-BSA-NPs should confer benefits to these patients via the targeted and rapid release of a bronchodilator after NPs arrive at the distal bronchi. Large hollowed NP aggregates have many merits, including prolonging drug release, enhanced drug utilization, and alleviation of administration frequency, giving rise to improved patient compliance.64,65 As a consequence, we plan to prepare large hollowed NP aggregates66 based on AS-BSA-NPs to improve lung drug deposition via dry-powder inhalation to enhance therapeutic efficacy.
In this paper, the binding mechanism of AS to BSA at the molecular level was investigated via a combination of experimental and computational studies, and the findings provided guidance for the rational design of BSA carrying small water-soluble drugs as well. According to the binding free energy calculation, the solvation energy term of the AS-BSA complex was a little larger, accounting for the high solubility of AS. Therefore, significant benefits may be derived by the adoption of such strategies as polyethylene glycol modification to increase the DL of BSA-NPs. Moreover, in the future, a further analysis of BSA assembly utilizing all-atom and coarse-grained simulation will be conducted based on the results of this paper to provide more valuable information for BSA-NPs as a DDS.
Conclusion
Understanding drug–carrier interactions is key for the design of NP-based DDSs, which in turn verify the binding mechanism. From SPR observation and findings by MD simulation, we confirmed that there were two binding sites in BSA and that AS1 was the stronger, operating via electrostatic interaction with Glu243 and Asp255. Hydrogen bonds and salt bridges were critical for the binding of AS1 to BSA, and water bridges served a supporting role. The characteristic evaluation of AS-BSA-NPs, prepared by two different techniques, supported the different mechanisms of AS binding to BSA in ABNI and ABNA. The binding sites from computation provided a guideline for the design of AS-BSA-NPs, while the release trail verified the interaction mechanism.
Acknowledgments
This work was financially supported by the National Natural Science Foundation of China (81202469) and Founder of New Drug Research Fund (20130527).
Disclosure
The authors report no conflicts of interest in this work.
References
Erram SV, Fanska CB, Asif M. Determination of albuterol sulfate and its related substances in albuterol sulfate inhalation solution, 0.5% by RP-HPLC. J Pharm Biomed Anal. 2006;40(4):864–874. | ||
Newman SP, Busse WW. Evolution of dry powder inhaler design, formulation, and performance. Respir Med. 2002;96(5):293–304. | ||
Sung JC, Pulliam BL, Edwards DA. Nanoparticles for drug delivery to the lungs. Trends Biotechnol. 2007;25(12):563–570. | ||
Woods A, Patel A, Spina D, et al. In vivo biocompatibility, clearance, and biodistribution of albumin vehicles for pulmonary drug delivery. J Control Release. 2015;210:1–9. | ||
Das PJ, Paul P, Mukherjee B, et al. Pulmonary delivery of voriconazole loaded nanoparticles providing a prolonged drug level in lungs: a promise for treating fungal infection. Mol Pharm. 2015;12(8):2651–2664. | ||
Kim KJ, Malik AB. Protein transport across the lung epithelial barrier. Am J Physiol Lung Cell Mol Physiol. 2003;284(2):L247–L259. | ||
Choi SH, Byeon HJ, Choi JS, et al. Inhalable self-assembled albumin nanoparticles for treating drug-resistant lung cancer. J Control Release. 2015;197:199–207. | ||
Seo J, Lee C, Hwang HS, et al. Therapeutic advantage of inhaled tacrolimus-bound albumin nanoparticles in a bleomycin-induced pulmonary fibrosis mouse model. Pulm Pharmacol Ther. 2016;36:53–61. | ||
Luo Q, Wang Y, Yang H, et al. Modeling the interaction of interferon α-1b to bovine serum albumin as a drug delivery system. J Phys Chem B. 2014;118(29):8566–8574. | ||
Vallianatou T, Lambrinidis G, Tsantili-Kakoulidou A. In silico prediction of human serum albumin binding for drug leads. Expert Opin Drug Discov. 2013;8(5):583–595. | ||
Albers J, Alles R, Matthée K, Knop K, Nahrup JS, Kleinebudde P. Mechanism of drug release from polymethacrylate-based extrudates and milled strands prepared by hot-melt extrusion. Eur J Pharm Biopharm. 2009;71(2):387–394. | ||
Sripriyalakshmi S, Anjali CH, George PD, Rajith B, Ravindran A. BSA nanoparticle loaded atorvastatin calcium: a new facet for an old drug. PLoS One. 2014;9(2):e86317. | ||
Shooshtary S, Behtash S, Nafisi S. Arsenic trioxide binding to serum proteins. J Photochem Photobiol B. 2015;148:31–36. | ||
Peng X, Qi W, Huang R, Su R, He Z. Elucidating the influence of gold nanoparticles on the binding of salvianolic acid B and rosmarinic acid to bovine serum albumin. PLoS One. 2015;10(4):e0118274. | ||
Ghosh K, Rathi S, Arora D. Fluorescence spectral studies on interaction of fluorescent probes with bovine serum albumin (BSA). J Lumin. 2016;175:135–140. | ||
Zhang X, Li L, Xu Z, et al. Investigation of the interaction of naringin palmitate with bovine serum albumin: spectroscopic analysis and molecular docking. PLoS One. 2013;8(3):e59106. | ||
Furini S, Domene C. Computational studies of transport in ion channels using metadynamics. Biochim Biophys Acta. 2016;1858(7 Pt B):1733–1740. | ||
Henseleit A, Pohl C, Kaltenbach HM, et al. Kinetic analyses of data from a human serum albumin assay using the liSPR system. Biosensors (Basel). 2015;5(1):27–36. | ||
Nguyen HH, Park J, Kang S, Kim M. Surface plasmon resonance: a versatile technique for biosensor applications. Sensors (Basel). 2015;15(5):10481–10510. | ||
Hu YJ, Liu Y, Sun TQ, Bai AM, Lu JQ, Pi ZB. Binding of anti-inflammatory drug cromolyn sodium to bovine serum albumin. Int J Biol Macromol. 2006;39(4–5):280–285. | ||
Tantra R, Tompkins J, Quincey P. Characterisation of the de-agglomeration effects of bovine serum albumin on nanoparticles in aqueous suspension. Colloids Surf B Biointerfaces. 2010;75(1):275–281. | ||
He XM, Carter DC. Atomic structure and chemistry of human serum albumin. Nature. 1992;358(6383):209–215. | ||
Majorek KA, Porebski PJ, Dayal A, et al. Structural and immunologic characterization of bovine, horse, and rabbit serum albumins. Mol Immunol. 2012;52(3–4):174–182. | ||
Frisch MJ, Trucks GW, Schlegel HB, et al. Gaussian 03 [software]. Wallingford (CT): Gaussian Inc; 2004. | ||
Wang J, Wolf WR, Caldwell JW, Kollman PA, Case DA. Development and testing of a general amber force field. J Comput Chem. 2004;25(9):1157–1174. | ||
da Silva AW, Vranken WF. ACPYPE: AntecChamber PYthon Parser interfacE. BMC Res Notes. 2012;5:367. | ||
Abraham MJ, Murtola T, Schulz R, et al. GROMACS: high performance molecular simulations through multi-level parallelism from laptops to supercomputers. SoftwareX. 2015;1–2:19–25. | ||
Duan Y, Wu C, Chowdhury S, et al. A point-charge force field for molecular mechanics simulations of proteins based on condensed-phase quantum mechanical calculations. J Comput Chem. 2003;24(16):1999–2012. | ||
Jorgensen WL, Chandrasekhar J, Madura JD, Impey RW, Klein ML. Comparison of simple potential functions for simulating liquid water. J Chem Phys. 1983;79(2):926–935. | ||
Nose S. A unified formulation of the constant temperature molecular dynamics methods. J Chem Phys. 1984;81(1):511–519. | ||
Parrinello M, Rahman A. Polymorphic transitions in single crystals: a new molecular dynamics method. J Appl Phys. 1981;52(12):7182–7190. | ||
Darden T, York D, Pedersen L. Particle mesh Ewald: an N·log(N) method for Ewald sums in large systems. J Chem Phys. 1993;98(12):10089–10092. | ||
Hess B, Bekker H, Berendsen H, Fraaije J. LINCS: a linear constraint solver for molecular simulations. J Comput Chem. 1997;18(12):1463–1472. | ||
Kumari R, Kumar R. g_mmpbsa: a GROMACS tool for high-throughput MM-PBSA calculations. J Chem Inf Model. 2014;54(7):1951–1962. | ||
Case DA, Cheatham TE 3rd, Darden T, et al. The Amber biomolecular simulation programs. J Comput Chem. 2005;26(16):1668–1688. | ||
Homeyer N, Gohlke H. Free energy calculations by the molecular mechanics Poisson-Boltzmann surface area method. Mol Inform. 2012;31(2):114–122. | ||
Xiaokaiti Y, Wu H, Chen Y, et al. EGCG reverses human neutrophil elastase-induced migration in A549 cells by directly binding to HNE and by regulating α1-AT. Sci Rep. 2015;5:11494. | ||
Satoh M, Saburi H, Tanaka T, et al. Multiple binding modes of a small molecule to human Keap1 revealed by X-ray crystallography and molecular dynamics simulation. FEBS Open Bio. 2015;5:557–570. | ||
Li FQ, Su H, Wang J, et al. Preparation and characterization of sodium ferulate entrapped bovine serum albumin nanoparticles for liver targeting. Int J Pharm. 2008;349(1–2):274–282. | ||
Merodio M, Arnedo A, Renedo MJ, Irache JM. Ganciclovir-loaded albumin nanoparticles: characterization and in vitro release properties. Eur J Pharm Sci. 2001;12(3):251–259. | ||
Zhao L, Zhou Y, Gao Y, et al. Bovine serum albumin nanoparticles for delivery of tacrolimus to reduce its kidney uptake and functional nephrotoxicity. Int J Pharm. 2015;483(1–2):180–187. | ||
Volkamer A, Kuhn D, Rippmann F, Rarey M. DoGSiteScorer: a web server for automatic binding site prediction, analysis and druggability assessment. Bioinformatics. 2012;28(15):2074–2075. | ||
Awasthi S, Murugan NA, Saraswathi NT. Advanced glycation end products modulate structure and drug binding properties of albumin. Mol Pharm. 2015;12(9):3312–3322. | ||
Singh A, Soliman ME. Understanding the cross-resistance of oseltamivir to H1N1 and H5N1 influenza A neuraminidase mutations using multidimensional computational analyses. Drug Des Devel Ther. 2015;9:4137–4154. | ||
Xiang Y, Duan L, Ma Q, Lv Z, Ruohua Z, Zhang Z. Fluorescence spectroscopy and molecular simulation on the interaction of caffeic acid with human serum albumin. Luminescence. Epub 2016 Apr 13. | ||
Gräter F, Schwarzl SM, Dejaegere A, Fischer S, Smith JC. Protein/ligand binding free energies calculated with quantum mechanics/molecular mechanics. J Phys Chem B. 2005;109(20):10474–10483. | ||
Xu D, Tsai CJ, Nussinov R. Hydrogen bonds and salt bridges across protein-protein interfaces. Protein Eng. 1997;10(9):999–1012. | ||
Petukhow M, Cregut D, Soares CM, Serrano L. Local water bridges and protein conformational stability. Protein Sci. 1999;8(10):1982–1989. | ||
Kratz F. Albumin as a drug carrier: design of prodrugs, drug conjugates and nanoparticles. J Control Release. 2008;132(3):171–183. | ||
Yu Z, Yu M, Zhang Z, Hong G, Xiong Q. Bovine serum albumin nanoparticles as controlled release carrier for local drug delivery to the inner ear. Nanoscale Res Lett. 2014;9(1):343. | ||
Elzoghby AO, Samy WM, Elgindy NA. Albumin-based nanoparticles as potential controlled release drug delivery systems. J Control Release. 2012;157(2):168–182. | ||
Noorani L, Stenzel M, Liang R, Pourgholami MH, Morris DL. Albumin nanoparticles increase the anticancer efficacy of albendazole in ovarian cancer xenograft model. J Nanobiotechnology. 2015;13:25. | ||
Vishnu P, Roy V. Safety and efficacy of nab-paclitaxel in the treatment of patients with breast cancer. Breast Cancer (Auckl). 2011;5:53–65. | ||
Bunker A, Magarkar A, Vilitala T. Rational design of liposomal drug delivery systems, a review: combined experimental and computational studies of lipid membranes, liposomes and their PEGylation. Biochim Biophys Acta. Epub 2016 Feb 23. | ||
Yang F, Zhang Y, Liang H. Interactive association of drugs binding to human serum albumin. Int J Mol Sci. 2014;15(3):3580–3595. | ||
Joseph KS, Moser AC, Basiaga SB, Schiel JE, Hage DS. Evaluation of alternatives to warfarin as probes for Sudlow site I of human serum albumin characterization by high-performance affinity chromatography. J Chromatogr A. 2009;1216(16):3492–3500. | ||
Conrad ML, Moser AC, Hage DS. Evaluation of indole-based probes for high-throughput screening of drug binding to human serum albumin: analysis by high-performance affinity chromatography. J Sep Sci. 2009;32(8):1145–1155. | ||
Simard JR, Zunszain PA, Ha CE, et al. Locating high-affinity fatty acid-binding sites on albumin by X-ray crystallography and NMR spectroscopy. Proc Natl Acad Sci U S A. 2005;102(50):17958–17963. | ||
Simard JR, Zunszain PA, Hamilton JA, Curry S. Location of high and low affinity fatty acid binding sites on human serum albumin revealed by NMR drug-competition analysis. J Mol Biol. 2006;361(2):336–351. | ||
Dockal M, Chang M, Carter DC, Rüker F. Five recombinant fragments of human serum albumin: tools for the characterization of the warfarin binding site. Protein Sci. 2000;9(8):1455–1465. | ||
Poda SB, Kobayashi M, Nachane R, et al. Development of a surface plasmon resonance assay for the characterization of small-molecule binding kinetics and mechanism of binding to kynurenine 3-monooxygenase. Assay Drug Dev Technol. 2015;13(8):466–475. | ||
El-Gendy N, Pornputtapitak W, Berkland C. Nanoparticle agglomerates of fluticasone propionate in combination with albuterol sulfate as dry powder aerosols. Eur J Pharm Sci. 2011;44(4):522–533. | ||
Muchão FP, Souza JM, Torres HC, et al. Albuterol via metered-dose inhaler in children: lower doses are effective and higher doses are safe. Pediatr Pulmonol. Epub 2016 May 12. | ||
Edwards DA, Hanes J, Caponetti G, et al. Large porous particles for pulmonary drug delivery. Science. 1997;276(5320):1868–1871. | ||
Gharse S, Fiegel J. Large porous hollow particles: lightweight champions of pulmonary drug delivery. Curr Pharm Des. 2016;22(17):2463–2469. | ||
Anton N, Jakhmola A, Vandamme TF. Trojan microparticles for drug delivery. Pharmaceutics. 2012;4(1):1–25. |
Supplementary materials
Brief introduction of g_mmpbsa
G_mmpbsa is an alternative tool based on GROMACS and APBS1 packages to calculate the binding free energy using the MM-PBSA method. The binding free energy of complex in solvent is calculated as:
ΔGbind = ΔEMM + ΔGsolvation | (1) |
where ΔEMM is the vacuum potential energy and ΔGsolvation is the free energy of solvation. ΔEMM is calculated based on molecular mechanic (MM) force-field parameters.
ΔEMM = ΔEvdw + ΔEelec | (2) |
where ΔEvdw is the van der Waal interaction utilizing the Lennard-Jones potential function and ΔEelec is electrostatic interaction using the Coulomb potential function. The free energy of solvation is calculated using an implicit solvent model based on the MM Poisson–Boltzmann surface area (PBSA) approach, and is expressed as follows:
ΔGsolvation = ΔGpolar + ΔGnonpolar | (3) |
where ΔGpolar, estimated by solving the Poisson–Boltzmann equation, is the electrostatic contribution to solvation free energy and ΔGnonpolar, adopting the solvent-accessible surface area (SASA) model most commonly, represents nonpolar solvation free energy.
ΔGnonpolar = Δ(γA + b) | (4) |
where γ is a coefficient related to surface tension of the solvent, A is SASA, and b is a fitting parameter. Furthermore, every residue’s energy contribution can be evaluated by binding energy decomposition, and energy contribution summed over all residues is equal to the binding energy. However, the entropy term is not included in g_mmpbsa tool.2
Binding pocket analysis for initial and molecular dynamics–bovine serum albumin
For insight into molecular structure changes, initial free bovine serum albumin (BSA) and free BSA after 5 ns molecular dynamics (MD) simulation were analyzed by DoGSiteScorer.3 As shown in Table S1, the values for pocket volume, solvent-accessible surface, and pocket depth of MD-BSA were slightly lower than those of initial BSA overall, indicating that the free BSA structure became more compact after optimization. Combined with the root-mean-square deviation (RMSD) analysis of 5 ns MD simulation, it was easy to establish that a reasonable BSA structure was obtained for further MD simulation.
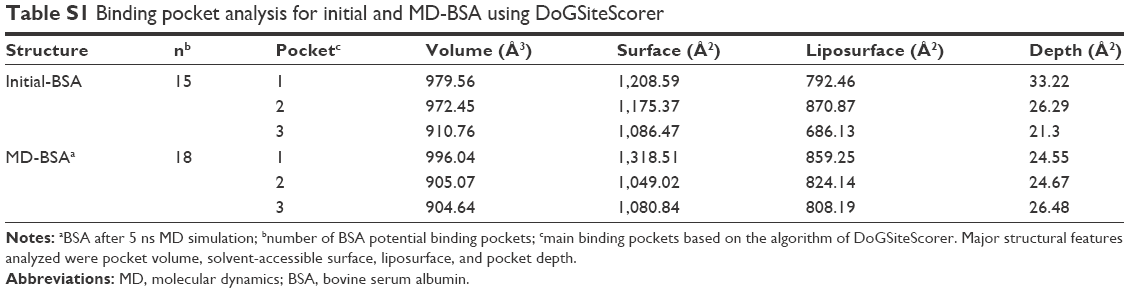 | Table S1 Binding pocket analysis for initial and MD-BSA using DoGSiteScorer |
RMSD of backbone atoms of complex during 40 ns MD simulation
The RMSD value of the backbone atoms of the complex during 40 ns MD simulation is shown in Figure S1. Obviously, before 25 ns, the RMSD value gradually increased, and after 35 ns it increased sharply. However, the RMSD reached equilibrium within 25–35 ns and fluctuated at approximately 0.2 nm, indicating that the simulation system was equilibrated.
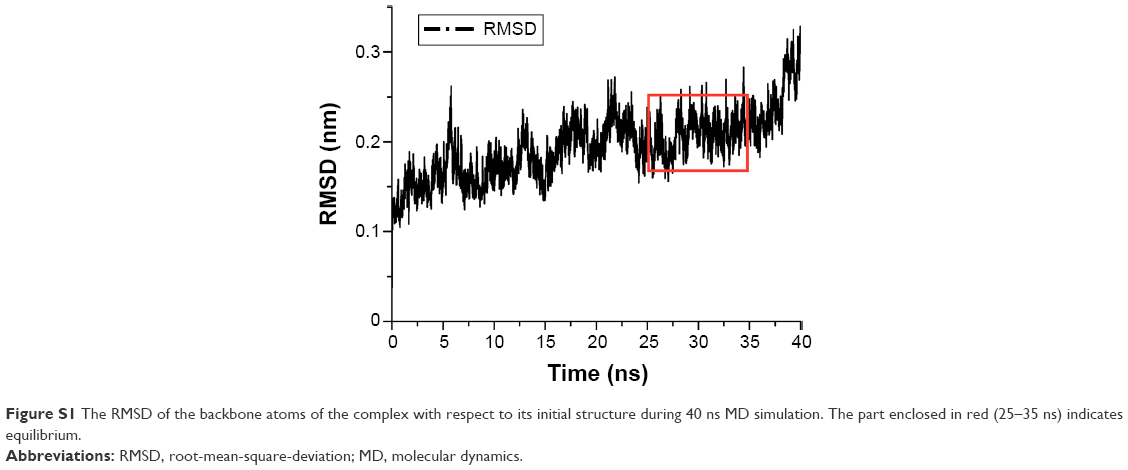 | Figure S1 The RMSD of the backbone atoms of the complex with respect to its initial structure during 40 ns MD simulation. The part enclosed in red (25–35 ns) indicates equilibrium. |
References
Baker NA, Sept D, Joseph S, Holst MJ, McCammon JA. Electrostatics of nanosystems: application to microtubules and the ribosome. Proc Natl Acad Sci U S A. 2001;98(18):10037–10041. | ||
He JY, Li C, Wu G. Discovery of potential drugs for human-infecting H7N9 virus containing R294K mutation. Drug Des Devel Ther. 2014;8:2377–2390. | ||
Volkamer A, Kuhn D, Rippmann F, Rarey M. DoGSiteScorer: a web server for automatic binding site prediction, analysis and druggability assessment. Bioinformatics. 2012;28(15):2074–2075. |
 © 2016 The Author(s). This work is published and licensed by Dove Medical Press Limited. The
full terms of this license are available at https://www.dovepress.com/terms
and incorporate the Creative Commons Attribution
- Non Commercial (unported, 3.0) License.
By accessing the work you hereby accept the Terms. Non-commercial uses of the work are permitted
without any further permission from Dove Medical Press Limited, provided the work is properly
attributed. For permission for commercial use of this work, please see paragraphs 4.2 and 5 of our Terms.
© 2016 The Author(s). This work is published and licensed by Dove Medical Press Limited. The
full terms of this license are available at https://www.dovepress.com/terms
and incorporate the Creative Commons Attribution
- Non Commercial (unported, 3.0) License.
By accessing the work you hereby accept the Terms. Non-commercial uses of the work are permitted
without any further permission from Dove Medical Press Limited, provided the work is properly
attributed. For permission for commercial use of this work, please see paragraphs 4.2 and 5 of our Terms.