Back to Journals » Journal of Inflammation Research » Volume 15
Combination of Nutritional Risk Index and Handgrip Strength on the Survival of Patients with Cancer Cachexia: A Multi- Center Cohort Study
Authors Xie H, Ruan G, Zhang Q, Ge Y, Song M, Zhang X ![]() , Liu X, Lin S, Zhang X, Li X, Zhang K, Yang M, Tang M, Cong M, Shi H
, Liu X, Lin S, Zhang X, Li X, Zhang K, Yang M, Tang M, Cong M, Shi H ![]()
Received 2 December 2021
Accepted for publication 4 February 2022
Published 15 February 2022 Volume 2022:15 Pages 1005—1015
DOI https://doi.org/10.2147/JIR.S352250
Checked for plagiarism Yes
Review by Single anonymous peer review
Peer reviewer comments 2
Editor who approved publication: Professor Ning Quan
Hailun Xie,1– 3,* Guotian Ruan,1– 3,* Qi Zhang,1– 3,* Yizhong Ge,1– 3 Mengmeng Song,1– 3 Xi Zhang,1– 3 Xiaoyue Liu,1– 3 Shiqi Lin,1– 3 Xiaowei Zhang,1– 3 Xiangrui Li,1– 3 Kangping Zhang,1– 3 Ming Yang,1– 3 Meng Tang,1– 3 Minghua Cong,4 Hanping Shi1– 3
1Department of Gastrointestinal Surgery/Department of Clinical Nutrition, Beijing Shijitan Hospital, Capital Medical University, Beijing, 100038, People’s Republic of China; 2Beijing International Science and Technology Cooperation Base for Cancer Metabolism and Nutrition, Beijing, 100038, People’s Republic of China; 3Key Laboratory of Cancer FSMP for State Market Regulation, Beijing, 100038, People’s Republic of China; 4Department of Comprehensive Oncology, National Cancer Center/National Clinical Research Center for Cancer/Cancer Hospital, Chinese Academy of Medical Sciences and Peking Union Medical College, Beijing, People’s Republic of China
*These authors contributed equally to this work
Correspondence: Hanping Shi, Department of Gastrointestinal Surgery/Department of Clinical Nutrition, Beijing Shijitan Hospital, Capital Medical University, Beijing, 100038, People’s Republic of China, Email [email protected]
Purpose: The nutritional risk index (NRI) and handgrip strength (HGS) are useful indicators of nutritional and physical status, respectively, both of them can predict the prognosis of many cancers; however, the predictive accuracy of a single indicator is unsatisfactory. Whether the combination of NRI and HGS could enhance the stratification of the prognosis of patients with cancer cachexia.
Patients and Methods: The study population was randomly divided into training and validation cohorts. We combined NRI and HGS and constructed the NRI–HGS score. Restricted cubic splines were used to assess the associations between NRI, HGS, and all-cause mortality. The Kaplan–Meier method was used to calculate the survival probability of the patients. The Cox proportional hazards risk model was used to analyze survival and prognostic factors.
Results: Low NRI and low HGS were independent predictors of poor prognosis in patients with cancer cachexia. The NRI–HGS score showed a better prognostic stratification than either NRI or HGS. The co-occurrence of low NRI and low HGS was associated with an approximately 1.8-fold increased risk of mortality. The NRI–HGS score could effectively distinguish patients with a poor prognosis at different pathological stages. Furthermore, we constructed a novel prognostic nomogram based on NRI and HGS. The concordance index and calibration plot confirmed that the nomogram had good prognostic accuracy. The area under the receiver operating characteristic curve of the nomogram reached > 0.8, which was much higher than that of the traditional tumor–node–metastasis staging system. The nomogram provided better prognostic stratification for patients with cancer cachexia.
Conclusion: Low NRI and low HGS are independent prognostic indicators in cancer cachexia. The combination of NRI and HGS improve prognostic stratification for patients with cancer cachexia. Our study suggests combining nutritional and physical status in future cachexia research.
Keywords: nutritional risk index, handgrip strength, cancer cachexia, prognostic
Introduction
According to the Global Cancer Statistics 2021,1 cancer is one of the leading diseases affecting the lives and health of people worldwide, and its incidence continues to rapidly increase. It was estimated that there were approximately 19.3 million new cancer cases worldwide in 2020, with China having the highest number at approximately 4.57 million. In other words, approximately 125,000 people are diagnosed with cancer every day (8.7 people every minute), showing the heavy burden of the disease. Cancer remains one of the leading causes of death worldwide and a major obstacle to increasing life expectancy in every country in the 21st century. Cancer cachexia is reported to be one of the main causes of poor prognosis in patients with cancer. Approximately 50–80% of cancer patients have varying degrees of cachexia, and the proportion is even higher among patients with advanced cancer.2 Patients with cancer cachexia are at increased risk of death, especially those with intractable cachexia, which accounts for more than one-fifth of all cancer deaths.3 Therefore, to reduce mortality related to cancer cachexia, it is imperative to identify potential prognostic markers that can stratify patients with this condition.
Tumor factors (eg, microvascular invasion), tumor-related factors, and pathological stage have been reported to be strong prognostic predictors in patients with cancer. However, even at the same pathological stage, the biological behavior of the tumors and the prognosis of the patients may differ, indicating the necessity of combining additional patient factors to individualize the risk stratification of patients with cancer. Increasing evidence indicates that inflammation and nutritional status are important factors affecting the development and clinical outcome of cancer.4,5 In recent years, the nutritional risk index (NRI), which incorporates commonly used nutritional parameters, has been reported to be associated with the prognosis of patients with various malignancies.6–8 Because of its simplicity, low cost, and availability, the NRI is considered a prognostic biomarker with broad potential applications. Some studies have also demonstrated that handgrip strength (HGS), a simple and noninvasive Clinical index, is a useful factor in predicting the survival and prognosis of patients with cancer.9,13 Burtin et al9 found that low HGS is an adverse factor for the prognosis of patients with non-small cell lung cancer and that combining low HGS with fat-free mass can enhance the accuracy of prognostic prediction. A multicenter study by Zhuang et al13 showed that low HGS is strongly associated with cancer mortality. However, the impact of HGS on patients with cancer remains controversial. Celis-morales et al10 reported that HGS is associated with cancer mortality in men but not in women. Another study found no significant association between HGS and cancer-related mortality in men.11 Therefore, the relationship between HGS and prognosis in patients with cancer needs to be further explored.
The accuracy of a single indicator in predicting the prognosis of malignancy is low; however, the combination of multiple indicators can improve the accuracy of prognostic prediction. The NRI is an objective nutritional index that combines serological and physical measurements, whereas HGS is a useful indicator of the physical status of patients. We hypothesized that the combination of NRI and HGS can more comprehensively reflect the prognosis of patients with cancer cachexia. Accordingly, the purpose of this study was to evaluate and validate the usefulness of the combination of NRI and HGS in evaluating clinical outcomes in patients with cancer cachexia.
Methods
Study Population
This was a large-scale, multi-center and prospective study, which included pathologically confirmed cancer patients from more than 40 medical centers between June 2012 and December 2019. All included patients were diagnosed with cancer cachexia and had complete clinicopathological data. We excluded patients who were hospitalized for < 24 h; had no data on HGS, height, weight, and other physical measures; or refused to participate in the study. All patients were regularly followed up through outpatient visits or telephone interviews. The patients were followed up every 3 months for 2 years, and every 6 months thereafter. The final follow-up was conducted in September 2019.
Definition of Cancer Cachexia
Cancer cachexia is defined as a multifactorial syndrome characterized by a continuous loss of skeletal muscle mass (including or excluding fat mass loss). As this condition cannot be completely reversed by traditional nutritional support, it can lead to several dysfunctions.12 In the Chinese population, the diagnostic criteria for cancer cachexia are as follows: (1) loss of > 5% body weight within 6 months without dieting, (2) body mass index (BMI) < 18.5 kg/m2 accompanied by a weight loss of > 2%, and (3) skeletal muscle mass index of the extremities meeting the criteria for sarcopenia and > 2% weight loss. Patients meeting one or more of the above criteria are diagnosed with cancer cachexia.
Data Collection and Definition
Data on basic information including sex, age, height, and weight; comorbid diseases including hypertension and diabetes; and laboratory serological parameters including white blood cell (WBC) count, neutrophil count, lymphocyte count, platelet count, red blood cell (RBC) count, hemoglobin level, and serum albumin level were collected. All laboratory serological tests were performed on an empty stomach within 1–3 days of admission. Data on clinicopathological information, such as tumor location and pathological tumor–node–metastasis (TNM) stage (American Joint Committee on Cancer staging system, 8th edition); treatment methods such as surgery, radiotherapy, and chemotherapy; and other indices such as the Karnofsky Performance Scale (KPS) score, Patient-Generated Subjective Global Assessment (PG-SGA) score, mid-arm circumference (MAC), and HGS, were also collected. The primary endpoint was all-cause mortality. The secondary endpoints were quality of life and length of hospital stay.
HGS was measured using a hand dynamometer (CAMRY, Model EH101, Guangdong, China). During the measurement, the patients were asked to sit upright, with the arm resting on the armrest and the elbow flexed 90°. They were instructed to squeeze the handle of the dynamometer with maximum effort within 3 s. HGS was measured three times for both hands, and the highest measurement values were selected for analysis. According to previous studies,13 HGS differs between men and women. Therefore, we adopted a sex-specific standardized log-rank statistic to determine the optimal cutoff value of HGS. The sex-specific cutoff values of low HGS associated with all-cause mortality were < 13.8 kg for women and < 31.9 kg for men. The NRI was calculated using the following formula: 1.519 × serum albumin level (g/L) + 41.7 × (current body weight [kg]/ideal body weight [kg]). Ideal body weight was calculated using the Lorentz formula, as follows: height (cm)-100 - ([height (cm)-150]/4) for men and height (cm)-100 - ([height (cm)-150]/2.5) for women. The current body weight/ideal body weight was considered to be 1 when the current weight exceeded the ideal weight.14 Following a previous study,15 the patients were divided into three groups according to NRI: normal risk (NRI ≥ 97.5), moderate risk (83.5 ≤ NRI < 97.5), and severe risk (NRI < 83.5). Quality of life was assessed using the European Organization for Research and Treatment of Cancer Quality of Life Questionnaire (EORTC QLQ-C30, version 3.0).16,17 All-cause mortality was defined as the time interval between the date of cancer diagnosis and the patient’s death or the last follow-up.
Statistical Analysis
Continuous variables are presented as median and interquartile range or mean ± standard deviation (SD) values, whereas categorical variables are presented as counts and percentages. Variables were analyzed using Fisher’s exact test, chi-squared test, t-test, or Mann–Whitney U-test, as appropriate. According to the principle of randomization, the study population was randomly divided into training and validation cohorts at a ratio of 7:3. Restricted cubic splines were used to assess the associations between NRI, HGS, and all-cause mortality. The Kaplan–Meier method was used to calculate the survival probability of the patients, and the Log rank test was used to evaluate the survival differences. To determine the potential prognostic factors that affect all-cause mortality, we used the Cox proportional hazards regression model. Variables with a p-value of < 0.05 in the univariate analysis were entered into a multivariate analysis to determine the prognostic effect of the independent variables on all-cause mortality. A nomogram model was constructed on the basis of the results of the multivariate analysis. The goodness of fit between the observed and predicted values was evaluated using a calibration curve and the concordance index (C-index). Time-dependent receiver operating characteristic (ROC) curve analysis was performed to compare the prognostic value of the indicators. In this study, p < 0.05 on both sides was considered statistically significant. All statistical analyses were performed using R software (version 4.0.5; https://www.r-Project.org).
Results
Clinicopathological Characteristics of Patients
According to the inclusion and exclusion criteria, 2612 patients with complete information were finally included in this study. The patients were randomly assigned to the training (1832 patients) and validation (780 patients) cohorts using computer-generated random numbers, at a ratio of 7:3 (Figure S1). This study included 1529 men and 1083 women with an average age of 58.76 (11.73) years. Of them, 226 patients had stage I, 559 patients had stage II, 698 patients had stage III, and 1129 patients had stage IV. The median follow-up time was 18.53 (1.00–81.05) months. The clinicopathological characteristics of the training and validation cohorts are shown in Table S1. The clinicopathological characteristics of the patients were mostly consistent between the two cohorts, indicating good randomization.
We assessed the associations between NRI, HGS, and all-cause mortality in patients with cancer cachexia using restricted cubic splines. The results showed that the prognosis of patients gradually worsened with decreasing NRI and HGS. After adjusting for confounding variables, a significant negative correlation was still observed (Figure S2). Patients with low NRI had significantly lower survival rates than those with high NRI in the training cohort (30.9% vs 49.7% vs 67.2%, log-rank p < 0.001) (Figure 1A, NRI) and in the validation cohort (31.5% vs 51.2% vs 69.8%, log-rank p < 0.001) (Figure 1B, NRI). The survival rate of patients with low HGS was approximately 20.6% lower than that of patients with high HGS in the training cohort (Figure 1A, HGS) and 22.9% lower than that of patients with high HGS in the validation cohort (Figure 1B, HGS). For every SD increase in NRI, the risk of poor prognosis in patients with cancer cachexia was reduced by 2.2% (hazard ratio [HR] 0.978, 95% confidence interval [CI] 0.969–0.987, log-rank p = 0.001) in the training cohort and by 2.7% (HR 0.973, 95% CI 0.957–0.989, log-rank p = 0.001) in the validation cohort. Similarly, for every SD increase in HGS, the risk of poor prognosis in patients with cancer cachexia was reduced by 2.0% (HR 0.980, 95% CI 0.971–0.988, log-rank p < 0.001) in the training cohort and by 1.9% (HR 0.981, 95% CI 0.969–0.994, log-rank p = 0.004) in the validation cohort (Table S2).
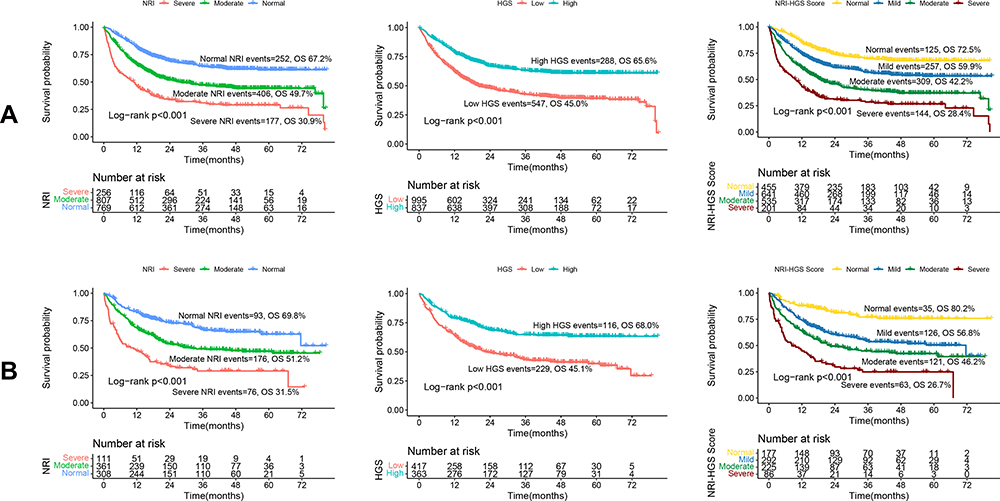 |
Figure 1 Kaplan-Meier survival of NRI, HGS, and NRI-HGS score in patients with cancer cachexia. Notes: (A) Training cohort; (B) Validation cohort. |
Combination Analysis of NRI and HGS
Multivariate analysis revealed that NRI and HGS were independent prognostic factors in patients with cancer cachexia. We hypothesized that the combination of these two factors may contribute to better stratification of the prognosis of patients with cancer cachexia. Therefore, we constructed a new score, the NRI–HGS score. First, NRI was assigned a score of 1 for the normal group, 2 for the moderate group, and 3 for the severe group. HGS was also scored, with a score of 1 indicating high HGS and a score of 2 indicating low HGS. Finally, the two scores were combined. We categorized the NRI–HGS score into four groups: normal (score: 2), mild (score: 3), moderate (score: 4), and severe (score: 5). The associations between the NRI–HGS score and various clinicopathological factors are presented in Table S3. The results showed that high NRI–HGS scores were associated with man, old age, low BMI, smoking, advanced pathological stage, high WBC count, high neutrophil count, low lymphocyte count, low RBC count, low hemoglobin level, low KPS score, low MAC, low NRI, low HGS, high weight loss, high PG-SGA score, high mortality, and long length of hospital stay.
In the training cohort, we found that the NRI–HGS score had good prognostic stratification in patients with cancer cachexia. The survival rates of the normal, mild, moderate, and severe groups were 72.5%, 59.9%, 42.2%, and 28.4%, respectively (Figure 1A, NRI–HGS score). In the validation cohort, as the NRI–HGS score increased, the prognosis of patients gradually worsened (80.2% vs 56.8% vs 46.2% vs 26.7%) (Figure 1B, NRI–HGS score). We also compared the survival curves of each NRI–HGS score group according to pathological stage. In the training cohort (Figure S3A), statistically significant differences in NRI–HGS scores were found among stage I–IV patients with cancer cachexia (all log-rank p < 0.05). Similarly, in the validation cohort, the NRI–HGS score showed good prognostic stratification in patients with cancer cachexia at different pathological stages (Figure S3B). We also found that the NRI–HGS score could effectively predict the prognosis of each tumor subgroup (Figure S4A and B). Compared with the normal group, the mild, moderate, and severe groups were all negatively associated with a poor prognosis, and the HRs for all-cause mortality were 1.324 (95% CI 1.059–1.656, log-rank p = 0.014), 2.176 (95% CI 1.718–2.756, log-rank p < 0.001), and 2.745 (95% CI 2.023–3.725, log-rank p < 0.001), respectively, in the training cohort. Concordantly, the HRs for all-cause mortality progressively decreased to 1.826 (95% CI 1.233–2.705, log-rank p = 0.003), 2.298 (95% CI 1.500–3.520, log-rank p < 0.001), and 2.855 (95% CI 1.684–4.840, log-rank p < 0.001) in the validation cohort (Table 1).
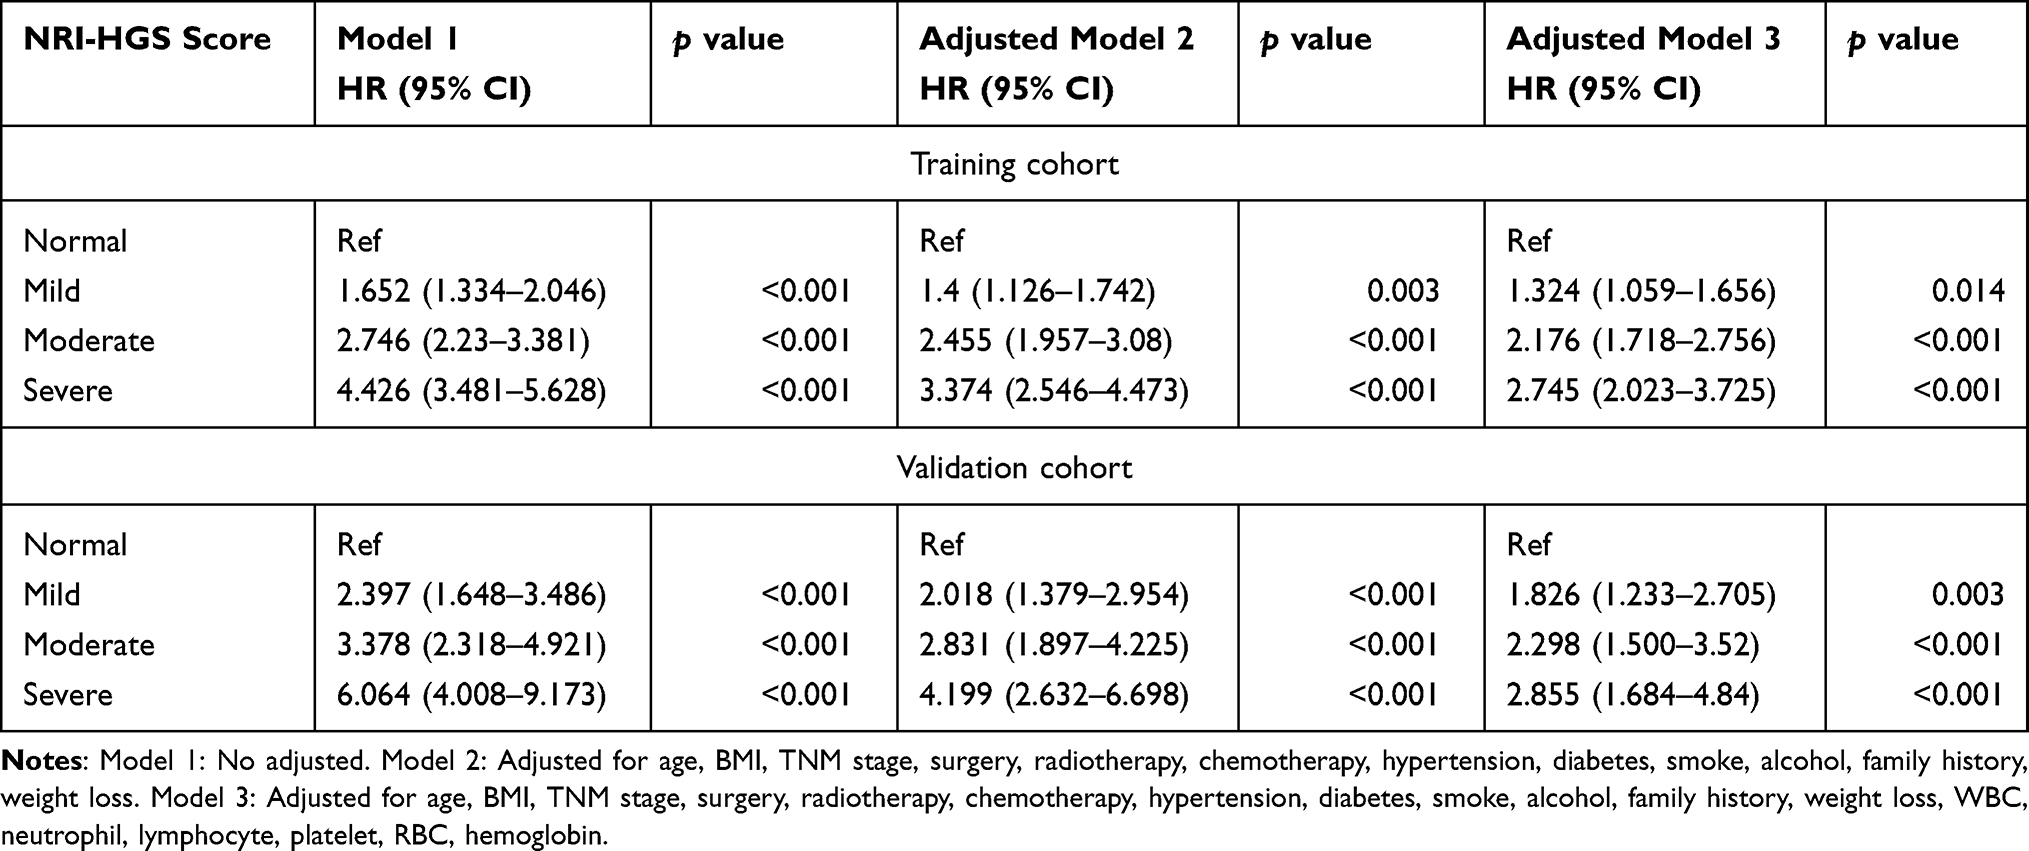 |
Table 1 Relationship Between NRI-HGS Score and All-Cause Mortality in Patients with Cancer Cachexia |
Death within 3 months and hematological disease or abnormal liver function were confounding factors in this study. Therefore, we performed a sensitivity analysis excluding patients with the above conditions. The results still showed that the NRI–HGS score had good prognostic discrimination in patients with cancer cachexia (Table S4). In addition, we also compared the ROC curves of the NRI–HGS score with other prognostic assessment tools. We found that the NRI–HGS score was superior to most other tools at 1, 3, and 5 years in both the training and validation cohorts (Figure S5A and B). Quality of life is also an important outcome in patients with cancer cachexia. The EORTC QLQ-C30, the most commonly used tool for assessing quality of life, includes five functional scales (physical, role, emotional, cognitive, and social), three symptom scales (fatigue, nausea and vomiting, and pain), six single symptoms (dyspnea, sleep disturbance, appetite loss, constipation, diarrhea, and financial difficulties), and a global quality of life scale. As shown in Table S5, the EORTC QLQ-C30 score of the patients gradually decreased with increasing NRI–HGS score, and the difference was statistically significant in most individual items.
Construction of a Novel Prognostic Nomogram Based on NRI and HGS
A nomogram was constructed using variables with p < 0.05 in the multivariate analysis in both the training and validation cohorts. The nomogram model had six features (sex, surgery, age, NRI, HGS, and tumor stage), which were independent prognostic factors in patients with cancer cachexia in both the training and validation cohorts (Figure 2A). With decreasing NRI and HGS, the total score of the nomogram increased, indicating increased possibility of adverse outcomes. The C-index of the nomogram in the training and validation cohorts was 0.763 (0.779, 0.747) and 0.745 (0.770, 0.720), respectively. Moreover, the calibration plot of the nomogram showed good consistency between the statistical prediction probability and the actual probability (Figure S6A and B). The ROC curve indicated that the nomogram provided good discrimination, with an area under the ROC curve (AUC) at 1, 2, and 3 years of 0.805, 0.834, and 0.831, respectively, in the training cohort and 0.786, 0.791, and 0.800, respectively, in the validation cohort (Figure 2B). The above results indicated that our nomogram had good prognostic accuracy. The TNM staging system is currently recognized as the most effective tool for predicting disease progression and for designing therapeutic strategies. We compared the nomogram and the traditional TNM staging system using time-dependent ROC curves. Our nomogram showed better resolution and accuracy in predicting all-cause mortality at 3 and 5 years than TNM staging (Figure S7A and B) in the training cohort (AUC at 3 years: 0.829, 95% CI 0.806–0.852 vs 0.786, 95% CI 0.762–0.810; AUC at 5 years: 0.825, 95% CI 0.787–0.863 vs 0.789, 95% CI 0.749–0.829) and in the validation cohort (AUC at 3 years: 0.801, 95% CI 0.764–0.838 vs 0.763, 95% CI 0.725–0.802; AUC at 5 years: 0.788, 95% CI 0.724–0.852 vs 0.771, 95% CI 0.708–0.834).
 |
Figure 2 Construction of a new prognostic nomogram and ROC curve of the nomogram of 1–3 years. Notes: (A) Nomogram; (B) ROC curve of nomogram in training and validation cohort. |
Thereafter, we divided the patients into four equal groups according to the nomogram scores in the training cohort: normal, mild, moderate, and severe. The survival rates in the normal, mild, moderate, and severe groups were 86.0%, 69.4%, 44.1%, and 18.1%, respectively, in the training cohort (Figure 3A) and 88.7%, 71.6%, 52.6%, and 24.9%, respectively, in the validation cohort (Figure 3B). We further explored the prognostic value of the nomogram in the tumor subgroups, and the results showed that the nomogram can effectively stratify the prognosis of each tumor in both the training and validation cohorts, including lung, esophageal, gastric, colorectal, hepatic–biliary–pancreatic, gynecological, and other cancers (Figure S8A and B). In the correlation analysis, a high nomogram score was associated with male sex, advanced age, low BMI, smoking, alcohol drinking, advanced stage, high WBC count, high neutrophil count, low lymphocyte count, low RBC count, low hemoglobin level, low KPS score, low MAC, low NRI, low HGS, high PG-SGA score, low EORTC QLQ-C30 score, high mortality, and long length of hospital stay (Table S6).
 |
Figure 3 Kaplan-Meier survival of nomogram model in patients with cancer cachexia. Notes: (A) Training cohort; (B) Validation cohort. |
After adjustments, the mild, moderate, and severe groups were all associated with poor prognosis, compared with normal group. The HRs for all-cause mortality were 1.690 (95% CI 1.127–2.533, log-rank p = 0.011), 2.874 (95% CI 1.759–4.695, log-rank p = 0.001), and 4.595 (95% CI 2.639–7.999, log-rank p < 0.001), respectively, in the training cohort. Concordantly, the HRs for all-cause mortality progressively decreased to 2.173 (95% CI 1.035–4.559, log-rank p = 0.040), 2.778 (95% CI 1.198–6.440, log-rank p = 0.017), and 4.626 (95% CI 1.866–11.472, log-rank p = 0.001), respectively, in the validation cohort (Table 2). In the sensitivity analysis, after excluding patients who died within 3 months and patients with confounding diseases, the nomogram could still effectively stratify the prognosis of patients with cancer cachexia (Table S7). Similarly, a high nomogram score was significantly associated with poor quality of life (Table S8).
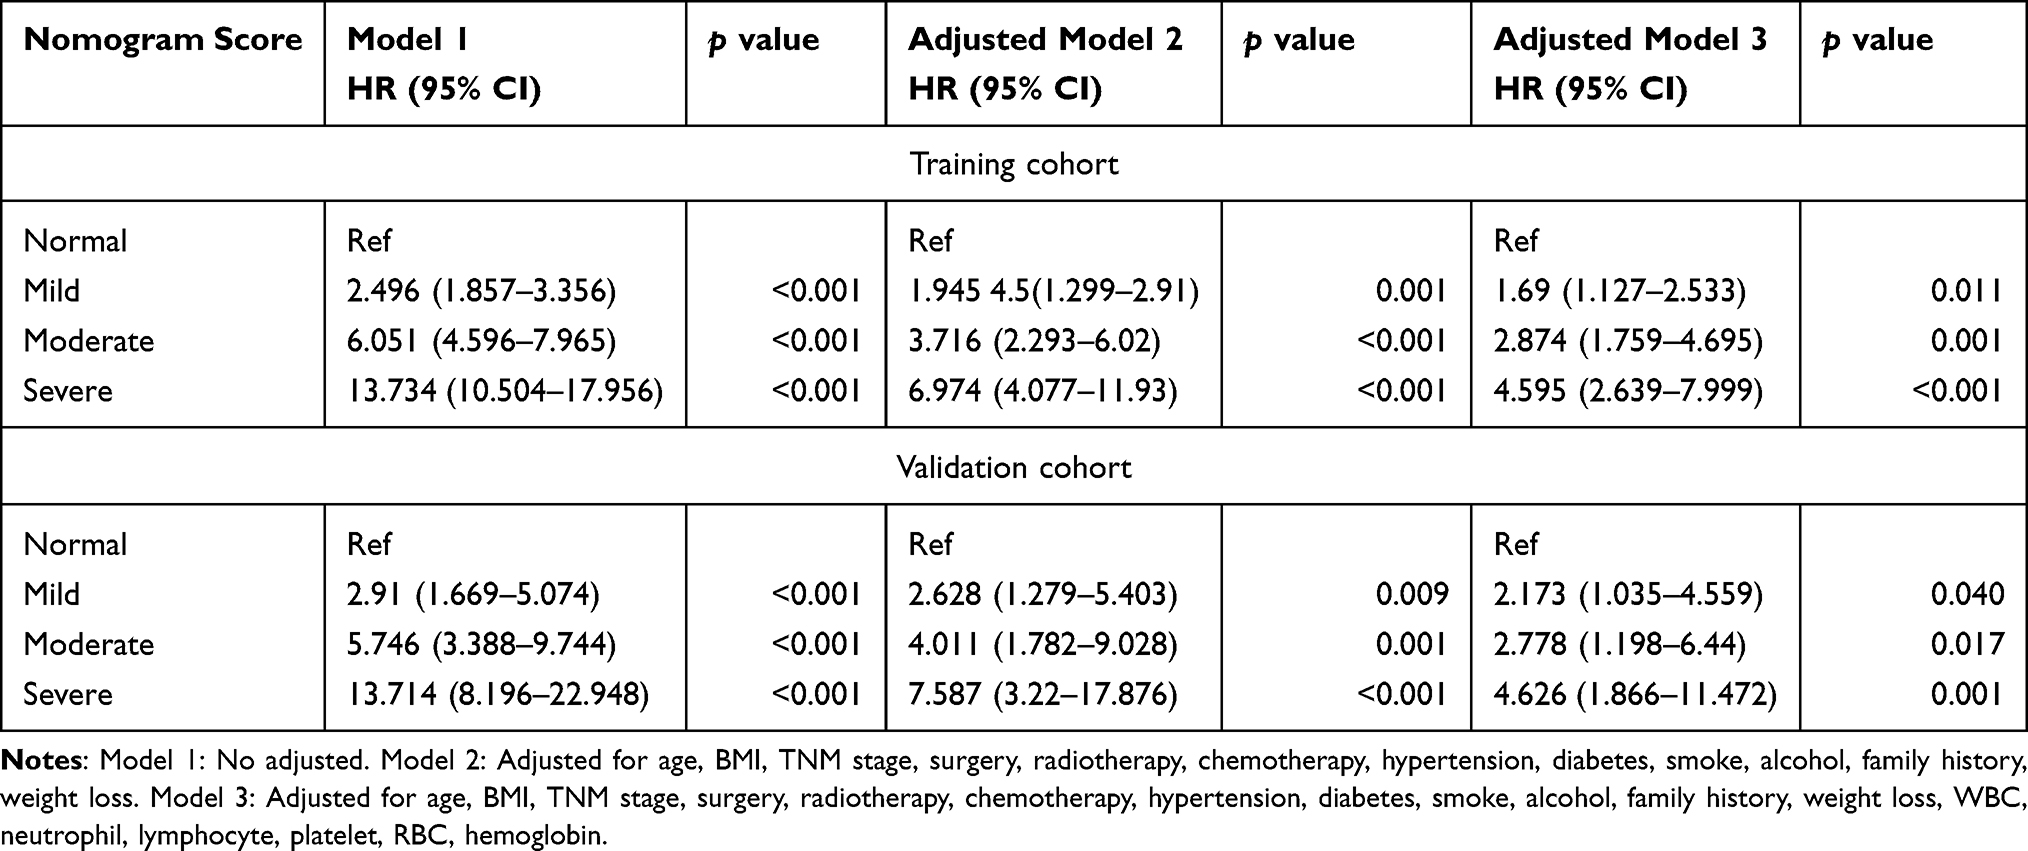 |
Table 2 Relationship Between Nomogram and All-Cause Mortality in Patients with Cancer Cachexia |
Discussion
Accumulating evidence shows that a gradual decline in the patients’ nutritional status is associated with disease progression and is one of the main reasons for poor treatment effectiveness.4,5 Early nutritional assessment has a crucial impact on improving the risk of morbidity or mortality related to malnutrition.18,19 The NRI has become a popular nutritional indicator because it is easy to measure and simple to interpret. Buzby et al14 originally developed the NRI to assess the nutritional status of surgical patients. Subsequent large randomized trials have demonstrated that preoperative nutritional assessment using the NRI could help reduce the incidence of adverse outcomes.20 Many recent studies have found that the NRI serves not only as a nutritional screening tool but also as an independent prognostic factor for malignancies.6–8,21 Meanwhile, cancer treatments such as radiotherapy and chemotherapy can contribute treatment-related toxicities and have detrimental effects of body compositions (such as skeletal muscle loss). Notably, skeletal muscle loss has been identified as an important factor affecting the prognosis of patients with cancer.22,23 HGS is a simple and noninvasive indicator that reflects the muscle function of patients. Low HGS was reported to be associated with poor prognosis, providing additional information for the prognostic evaluation of patients with cancer.24,25 To our knowledge, no study has investigated the prognostic value of combining NRI and HGS in cancer cachexia.
In this study, we demonstrated for the first time that the combination of NRI and HGS provides good prognostic stratification of the outcome of patients with cancer cachexia. We found that higher NRI–HGS scores were associated with worse nutritional status of patients, more advanced tumor stage, and more severe inflammation, indicating that the NRI–HGS score can be used as a comprehensive index reflecting physical status, tumor characteristics, and systemic inflammation. We also observed that the nomogram had good consistency. Both NRI and HGS were independent prognostic factors affecting patients with cancer cachexia. We found that the co-occurrence of low NRI and low HGS was associated with an approximately 1.8-fold increased risk of mortality in these patients. When the NRI and HGS were combined, the opening of the survival curve was better than that with any single factor and the difference in survival among patients with different scores had a good slope, ranging from 12.6% to 17.7%. With respect to pathological stages, we found that the NRI–HGS score could still perform good prognostic stratification at all stages, suggesting that this score can be used as a supplement for prognostic prediction beyond tumor-related factors. Our results also showed that the NRI–HGS score is an effective prognostic factor for various tumors. Although prognostic factors may differ among different tumors, nutritional status and physical condition are common factors reflecting the clinical outcomes of patients with cancer because cancer is a wasting disease. In addition, the NRI–HGS score had better predictive accuracy than other prognostic assessment tools and was superior to the individual components.
The nomogram is an easy-to-use clinical tool for predicting clinical events and outcomes. Since the clinical application of the nomogram was first reported, nomograms have been used in diagnosing or predicting the prognosis of various malignancies.26 In this study, we developed a novel nomogram to predict the prognosis of patients with cancer cachexia by combining general information, treatment strategies, nutritional status, physical status, and tumor stage. The C-index and calibration plots confirmed that the nomogram had good prediction accuracy. The AUC of the nomogram reached > 0.8 in both the training and validation cohorts, which was much higher than the prediction accuracy of the traditional TNM staging system. The nomogram could provide better prognostic stratification of patients with cancer cachexia. Compared with the normal group, the severe group had an approximately 3.5-fold increased risk of mortality. In addition, the nomogram can clearly distinguish patients with a poor prognosis in each tumor subgroup. Quality of life is another important outcome in patients with cancer. We found that both high NRI–HGS scores and high nomogram scores were significantly related to poor quality of life. This may be explained by the fact that NRI and HGS reflect the nutritional status and physical status of patients, respectively. Patients with low nutritional status often have difficulty coping with the burden of cancer or treatment and are prone to developing varying degrees of physical symptoms. In addition, because of their poor physical status, patients with cancer cachexia often lack exercise and are unable to engage in out-of-bed activities, which often lead to depression and other negative emotions. In summary, the combination of NRI and HGS is a reliable, objective, reproducible, and inexpensive tool for assessing the prognosis of patients with cancer cachexia. The NRI–HGS score, which reflects the status of malnutrition and skeletal muscle loss, can assist in formulating the supportive care and treatment plan for patients with cancer cachexia. In clinical practice, if a patient newly diagnosed with cancer cachexia has a high combined NRI-HGS score, suggesting poor prognosis. At this time, nutritional support and skeletal muscle function training should be strengthened in addition to aggressive anti-cancer therapy.
This study confirmed that the combination of NRI and HGS can be used to stratify the prognosis of patients with cancer cachexia. In addition, because we divided the patients into training and validation cohorts, our results have good reliability. However, this study also has some limitations. First, as this was a cross-sectional study, a potential bias may be present. Second, owing to data limitations, this study included only patients from Chinese hospitals. Future studies in multiple countries and ethnic groups are needed to validate our results. Finally, the training and validation cohorts were obtained from the same dataset. Although the grouping was randomized, a potential selection bias may still exist. External validation with a large sample from multiple centers may be the optimal method.
Conclusion
This study demonstrated that low NRI and low HGS are independent prognostic indicators in cancer cachexia. As they are easy to measure, they have a great potential for use in clinical practice. The combination of NRI and HGS improve prognostic stratification for patients with cancer cachexia. Moreover, our novel prognostic nomogram can be used in designing individualized interventions for patients with cancer cachexia. Our study suggests combining nutritional and physical status in future cachexia research.
Data Sharing Statement
The datasets used and analyzed during the current study are available from the corresponding author on reasonable request.
Ethics Approval and Informed Consent
This study followed the Helsinki declaration. All participants signed an informed consent form and this study was approved by the Institutional Review Board of each hospital (Registration number: ChiCTR1800020329). The names of all participating hospitals were shown in Table S9.
Acknowledgments
The authors would like to thank the INSCOC project members for their substantial work on data collecting and follow-up.
Author Contributions
All authors made a significant contribution to the work reported, whether that is in the conception, study design, execution, acquisition of data, analysis and interpretation, or in all these areas; took part in drafting, revising or critically reviewing the article; gave final approval of the version to be published; have agreed on the journal to which the article has been submitted; and agree to be accountable for all aspects of the work.
Funding
This study was supported by the National Key Research and Development Program to Dr. Hanping Shi (No. 2017YFC1309200) and the Beijing Municipal Science and Technology Commission (SCW2018-06).
Disclosure
The authors declare that they have no competing interests in this work.
References
1. Sung H, Ferlay J, Siegel RL, et al. Global cancer statistics 2020: GLOBOCAN estimates of incidence and mortality worldwide for 36 cancers in 185 countries. CA Cancer J Clin. 2021;71(3):209–249. doi:10.3322/caac.21660
2. von Haehling S, Anker SD. Cachexia as a Major Underestimated and Unmet Medical Need: Facts and Numbers. Springer; 2010.
3. Argilés JM, Busquets S, Stemmler B, López-Soriano FJ. Cancer cachexia: understanding the molecular basis. Nat Rev Cancer. 2014;14(11):754–762. doi:10.1038/nrc3829
4. Schwegler I, Von Holzen A, Gutzwiller J, Schlumpf R, Mühlebach S, Stanga Z. Nutritional risk is a clinical predictor of postoperative mortality and morbidity in surgery for colorectal cancer. J Br Surg. 2010;97(1):92–97. doi:10.1002/bjs.6805
5. Alifano M, Mansuet-Lupo A, Lococo F, et al. Systemic inflammation, nutritional status and tumor immune microenvironment determine outcome of resected non-small cell lung cancer. PLoS One. 2014;9(9):e106914. doi:10.1371/journal.pone.0106914
6. Ramos R, Nadal E, Peiró I, et al. Preoperative nutritional status assessment predicts postoperative outcomes in patients with surgically resected non-small cell lung cancer. Eur J Surg Oncol. 2018;44(9):1419–1424. doi:10.1016/j.ejso.2018.03.026
7. Bo Y, Yao M, Zhang L, Bekalo W, Lu W, Lu Q. Preoperative nutritional risk index to predict postoperative survival time in primary liver cancer patients. Asia Pac J Clin Nutr. 2015;24(4):591–597. doi:10.6133/apjcn.2015.24.4.26
8. Guo Y, Wang R, Wu P, et al. Preoperative nutritional risk index predicts recurrence of oligometastatic prostate cancer in patients undergoing cytoreductive radical prostatectomy. Nutr Cancer. 2021;73(8):1440–1447. doi:10.1080/01635581.2020.1795694
9. Burtin C, Bezuidenhout J, Sanders KJC, et al. Handgrip weakness, low fat-free mass, and overall survival in non-small cell lung cancer treated with curative-intent radiotherapy. J Cachexia Sarcopenia Muscle. 2020;11(2):424–431. doi:10.1002/jcsm.12526
10. Celis-Morales CA, Welsh P, Lyall DM, et al. Associations of grip strength with cardiovascular, respiratory, and cancer outcomes and all cause mortality: prospective cohort study of half a million UK Biobank participants. BMJ. 2018;361:k1651. doi:10.1136/bmj.k1651
11. Ortega FB, Silventoinen K, Tynelius P, Rasmussen F. Muscular strength in male adolescents and premature death: cohort study of one million participants. BMJ. 2012;345:e7279. doi:10.1136/bmj.e7279
12. Fearon K, Strasser F, Anker SD, et al. Definition and classification of cancer cachexia: an international consensus. Lancet Oncol. 2011;12(5):489–495. doi:10.1016/s1470-2045(10)70218-7
13. Zhuang CL, Zhang FM, Li W, et al. Associations of low handgrip strength with cancer mortality: a multicentre observational study. J Cachexia Sarcopenia Muscle. 2020;11(6):1476–1486. doi:10.1002/jcsm.12614
14. Buzby GP, Williford WO, Peterson OL, et al. A randomized clinical trial of total parenteral nutrition in malnourished surgical patients: the rationale and impact of previous clinical trials and pilot study on protocol design. Am J Clin Nutr. 1988;47(2 Suppl):357–365. doi:10.1093/ajcn/47.2.357
15. Raposeiras Roubín S, Abu Assi E, Cespón Fernandez M, et al. Prevalence and prognostic significance of malnutrition in patients with acute coronary syndrome. J Am Coll Cardiol. 2020;76(7):828–840. doi:10.1016/j.jacc.2020.06.058
16. Aaronson NK, Ahmedzai S, Bergman B, et al. The European Organization for Research and Treatment of Cancer QLQ-C30: a quality-of-life instrument for use in international clinical trials in oncology. J Natl Cancer Inst. 1993;85(5):365–376. doi:10.1093/jnci/85.5.365
17. Nordin K, Steel J, Hoffman K, Glimelius B. Alternative methods of interpreting quality of life data in advanced Gastrointestinal cancer patients. Br J Cancer. 2001;85(9):1265–1272. doi:10.1054/bjoc.2001.2046
18. Kuzu MA, Terzioğlu H, Genç V, et al. Preoperative nutritional risk assessment in predicting postoperative outcome in patients undergoing major surgery. World J Surg. 2006;30(3):378–390. doi:10.1007/s00268-005-0163-1
19. Cross MB, Yi PH, Thomas CF, Garcia J, Della Valle CJ. Evaluation of malnutrition in orthopaedic surgery. J Am Acad Orthop Surg. 2014;22(3):193–199. doi:10.5435/jaaos-22-03-193
20. National Cancer Institute Surveillance, Epidemiology, and End Results Program. Lung cancer stat facts: lung and bronchus cancer. Available from: https://seer.cancer.gov/statfacts/html/lungb.html.
21. Oh J, Liu A, Tran E, et al. Association between nutritional risk index and outcomes for head and neck cancer patients receiving concurrent chemo-radiotherapy. Head Neck. 2020;42(9):2560–2570. doi:10.1002/hed.26315
22. Kubo Y, Naito T, Mori K, Osawa G, Aruga E. Skeletal muscle loss and prognosis of breast cancer patients. Support Care Cancer. 2017;25(7):2221–2227. doi:10.1007/s00520-017-3628-5
23. Xie H, Wei L, Liu M, Yuan G, Tang S, Gan J. Preoperative computed tomography-assessed sarcopenia as a predictor of complications and long-term prognosis in patients with colorectal cancer: a systematic review and meta-analysis. Langenbecks Arch Surg. 2021;406(6):1775–1788. doi:10.1007/s00423-021-02274-x
24. Sato S, Nagai E, Taki Y, et al. Hand grip strength as a predictor of postoperative complications in esophageal cancer patients undergoing esophagectomy. Esophagus. 2018;15(1):10–18. doi:10.1007/s10388-017-0587-3
25. Sato T, Aoyama T, Hayashi T, et al. Impact of preoperative hand grip strength on morbidity following gastric cancer surgery. Gastric Cancer. 2016;19(3):1008–1015. doi:10.1007/s10120-015-0554-4
26. Downs A. Blood, A study in general physiology. Can Med Assoc J. 1928;19(6):754.
 © 2022 The Author(s). This work is published and licensed by Dove Medical Press Limited. The
full terms of this license are available at https://www.dovepress.com/terms
and incorporate the Creative Commons Attribution
- Non Commercial (unported, 3.0) License.
By accessing the work you hereby accept the Terms. Non-commercial uses of the work are permitted
without any further permission from Dove Medical Press Limited, provided the work is properly
attributed. For permission for commercial use of this work, please see paragraphs 4.2 and 5 of our Terms.
© 2022 The Author(s). This work is published and licensed by Dove Medical Press Limited. The
full terms of this license are available at https://www.dovepress.com/terms
and incorporate the Creative Commons Attribution
- Non Commercial (unported, 3.0) License.
By accessing the work you hereby accept the Terms. Non-commercial uses of the work are permitted
without any further permission from Dove Medical Press Limited, provided the work is properly
attributed. For permission for commercial use of this work, please see paragraphs 4.2 and 5 of our Terms.