Back to Journals » Cancer Management and Research » Volume 12
Combination of Haemoglobin and Prognostic Nutritional Index Predicts the Prognosis of Postoperative Radiotherapy for Esophageal Squamous Cell Carcinoma
Authors Wang B ![]() , Jiang X, Tian D, Zhou N, Geng W
, Jiang X, Tian D, Zhou N, Geng W ![]()
Received 10 June 2020
Accepted for publication 21 August 2020
Published 18 September 2020 Volume 2020:12 Pages 8589—8597
DOI https://doi.org/10.2147/CMAR.S266821
Checked for plagiarism Yes
Review by Single anonymous peer review
Peer reviewer comments 2
Editor who approved publication: Dr Antonella D'Anneo
Bei Wang, Xiao-wen Jiang, Da-long Tian, Ning Zhou, Wei Geng
Department of Radiotherapy Oncology, The Affiliated Yancheng First Hospital of Nanjing University Medical School, The First People’s Hospital of Yancheng, Yancheng 224000, Jiangsu Province, People’s Republic of China
Correspondence: Wei Geng
Department of Radiotherapy Oncology, The Affiliated Yancheng First Hospital of Nanjing University Medical School, The First People’s Hospital of Yancheng, Yancheng 224000, Jiangsu Province, People’s Republic of China
Tel +86-515-6669-6817
Email [email protected]
Purpose: To investigate the predictive effect of the combined markers of haemoglobin and prognostic nutritional index (PNI) on the long-term survival of patients undergoing postoperative radiotherapy for esophageal squamous cell carcinoma (ESCC).
Patients and Methods: A total of 238 patients were included in this retrospective analysis. PNI was calculated as the serum albumin level (g/L) + 5 × absolute lymphocyte count, and the cut-off values of PNI and haemoglobin were calculated by receiver operating characteristic (ROC) curve analysis. Then, we combined haemoglobin and PNI, named the H-PNI score, as a predictor of tumour prognosis. The patients were divided into three groups: H-PNI score of 2 (having both hyper-haemoglobin and high PNI), H-PNI score of 1 (having one of these haematological abnormalities), and H-PNI score of 0 (having neither hyper-haemoglobin nor high PNI). The overall survival (OS) rate was calculated using the Kaplan–Meier method, and survival differences between groups were evaluated using the Log rank test. Cox proportional hazards models were used for univariate and multivariate analyses. P values < 0.05 indicated statistical significance.
Results: The cut-off values of haemoglobin and PNI were 132.5 (g/L) and 46.55, respectively. Kaplan–Meier analysis showed that patients with high haemoglobin and PNI levels had a significantly better prognosis than those with low haemoglobin and PNI levels (P = 0.015 and P = 0.002, respectively). Similarly, the survival rate was significantly lower in patients with an H-PNI score of 0 than in those with an H-PNI score of 1– 2 (P=0.000). Univariate analysis indicated that differentiation, T and N classification, and H-PNI score were significantly associated with OS. Finally, differentiation (P=0.002), T and N classification (P=0.000), and H-PNI score (P=0.01) were independent prognostic factors for ESCC patients undergoing postoperative radiotherapy.
Conclusion: The H-PNI score was an independent prognostic factor for ESCC patients undergoing postoperative radiotherapy.
Keywords: retrospective analysis, haematological markers, nutritional status, overall survival
Introduction
Esophageal cancer is one of the most common malignancies of the digestive tract, and its mortality ranks 4th among all malignant tumours. Especially in China, the morbidity and mortality rates are among the highest in the world.1,2 Because there are no obvious symptoms in the early stage, many patients are not diagnosed until the middle or advanced stage, so the average five-year survival rate is only 17%.3 Current treatments include radical surgery, radiotherapy, chemotherapy and concurrent chemoradiotherapy. Although these treatments can be effective in relieving clinical symptoms, anorexia, vomiting and radiation oesophagitis may occur during chemoradiotherapy. At the same time, due to swallowing difficulties caused by the disease, many patients suffer from malnutrition, which affects their prognosis.4,5
It has been reported that nutritional status is related to the clinical treatment outcomes of patients with Esophageal cancer,6 and nutritional intervention before chemoradiotherapy can improve the survival of patients with locally advanced esophageal cancer.7 Moreover, during chemoradiotherapy, the clinical efficacy of patients with good nutritional status was better than those with poor nutritional status.8 To date, several potential blood markers have been used to assess the nutritional status of cancer patients. The prognostic nutritional index (PNI) consists of serum albumin and absolute lymphocyte count,9 and it has been used to assess preoperative nutritional status, surgical risk, and postoperative complications in patients undergoing surgery. Researchers extended PNI to the field of tumours and found that PNI was associated with the prognosis of colorectal cancer, stomach cancer, lung cancer and breast cancer.10–13 Haemoglobin also has value in nutritional evaluation; however, the cumulative effect of haemoglobin and PNI on tumour patients has not been investigated. At the same time, there is no study on the correlation between the nutritional index and the survival of patients with postoperative radiotherapy for esophageal cancer. Therefore, this study investigated the effect of the combined markers of haemoglobin and PNI on the long-term survival of patients undergoing postoperative radiotherapy for esophageal cancer.
Materials and Methods
Patients
In this retrospective study, we enrolled postoperative radiotherapy patients with esophageal cancer who were admitted to the Affiliated Yancheng First Hospital of Nanjing University Medical School from January 2010 to December 2018. All patients were treated with oesophagectomy and postoperative radiotherapy. The inclusion criteria for this study were as follows: (1) patients with histologically confirmed esophageal squamous cell carcinoma (ESCC); (2) patients who underwent postoperative radiotherapy (RT) only or concurrent chemoradiotherapy (CCRT); and (3) patients with no distant metastasis. The exclusion criteria for this study were as follows: (1) patients who underwent neoadjuvant chemotherapy (n=1); (2) patients with incomplete histopathological data or preoperative haematologic examination (n=28); (3) patients who had interrupted radiation therapy (n=3); and (4) patients who could not be contacted (n=21). Finally, 238 patients were included in this study. Due to the retrospective nature of the study, the requirement for informed consent was waived, and the study was approved by the ethics committee of the Affiliated Yancheng First Hospital of Nanjing University Medical School. This study was conducted in accordance with the Declaration of Helsinki, and all information was anonymized prior to analysis.
Treatment
Radiotherapy was performed by 6 MV X-ray irradiation. First, the neck and chest were fixed with a piece of thermoplastic sheet. Imaging data from previous computed tomography (CT) simulation scans were transmitted to the RT treatment planning system to delineate tumour areas and organs at risk. The target volume included the postoperative tumour bed and high-risk lymphatic drainage area, and the total dose was 50 to 66 Gy, 1.8 to 2.0 Gy/fraction, 5 times/week. A high dose of 60–66 Gy was administered in some patients due to suspicious metastatic lymph nodes found on the medical image before radiotherapy. The restricted dose of normal tissues included a bi-lung V20 ≤20%, an average bi-lung dose of ≤20 Gy, a bi-lung V5 of <50%, a heart V30 of ≤30%, and a maximum dose to the spinal cord of <45 Gy. We used 3-dimensional conformal radiotherapy (3D-CRT) or intensity-modulated radiotherapy (IMRT). Patients with severe postoperative complications were excluded. Among them, 65 patients received CCRT, and 173 patients received postoperative RT only. The chemotherapy regimens consisted mainly of 5-fluorouracil (1000 mg/m2, days 1–3 and 29–31), single-agent S-1 (tegafur, gimeracil, and oteracil) (40–60 mg bid orally), or capecitabine tablets (1.5 g qd orally).
Definition of PNI
PNI was calculated as the serum albumin level (g/L) + 5 × the absolute lymphocyte count.14–16
Grading System for H-PNI
The cut-off values of haemoglobin and PNI were calculated by receiver operating characteristic (ROC) curve analysis. The haemoglobin and prognostic nutritional index (H-PNI) score was classified into three groups according to each cut-off value of haemoglobin and PNI as follows: H-PNI score of 2 (both hyper-haemoglobin and high PNI), H-PNI score of 1 (one of these haematological abnormalities), and H-PNI score of 0 (neither hyper- nor high PNI).
Follow-Up
All patients were examined every 3 months for the first 2 years, every 6 months from the third year, and then once a year. We contacted the patients by telephone or letter, and the last follow-up time was May 31, 2020. Overall survival (OS) was defined as the time between surgery and patient death or the last follow-up. The median follow-up time for all patients was 35 months (range 3.3–132.1 months). The median follow-up time of the surviving patients was 58.5 months (range 19.3–132.1 months).
Statistical Analysis
Statistical Package for Social Sciences version 17.0 (SPSS Inc., Chicago, IL, USA) was used for statistical analysis. The cut-off values were calculated by ROC curve analysis. Pearson’s chi-square test was used to estimate the correlation between different categorical variables. The OS rate was calculated using the Kaplan–Meier method, and survival differences between groups were evaluated using the Log rank test. Cox proportional hazards models were used for univariate and multivariate analyses. P values <0.05 indicated statistical significance.
Results
Patient Characteristics
A total of 238 patients were included in this study, and their characteristics are shown in Table 1. Among the 238 patients, 162 were male and 76 were female, with a male:female ratio of 2.13:1. The median age was 64 years (range from 44 to 80). Well, moderate and poor tumour differentiation was found in 81, 90 and 67 patients, respectively. There were 46, 116 and 76 patients with stage I, II and III disease, respectively.
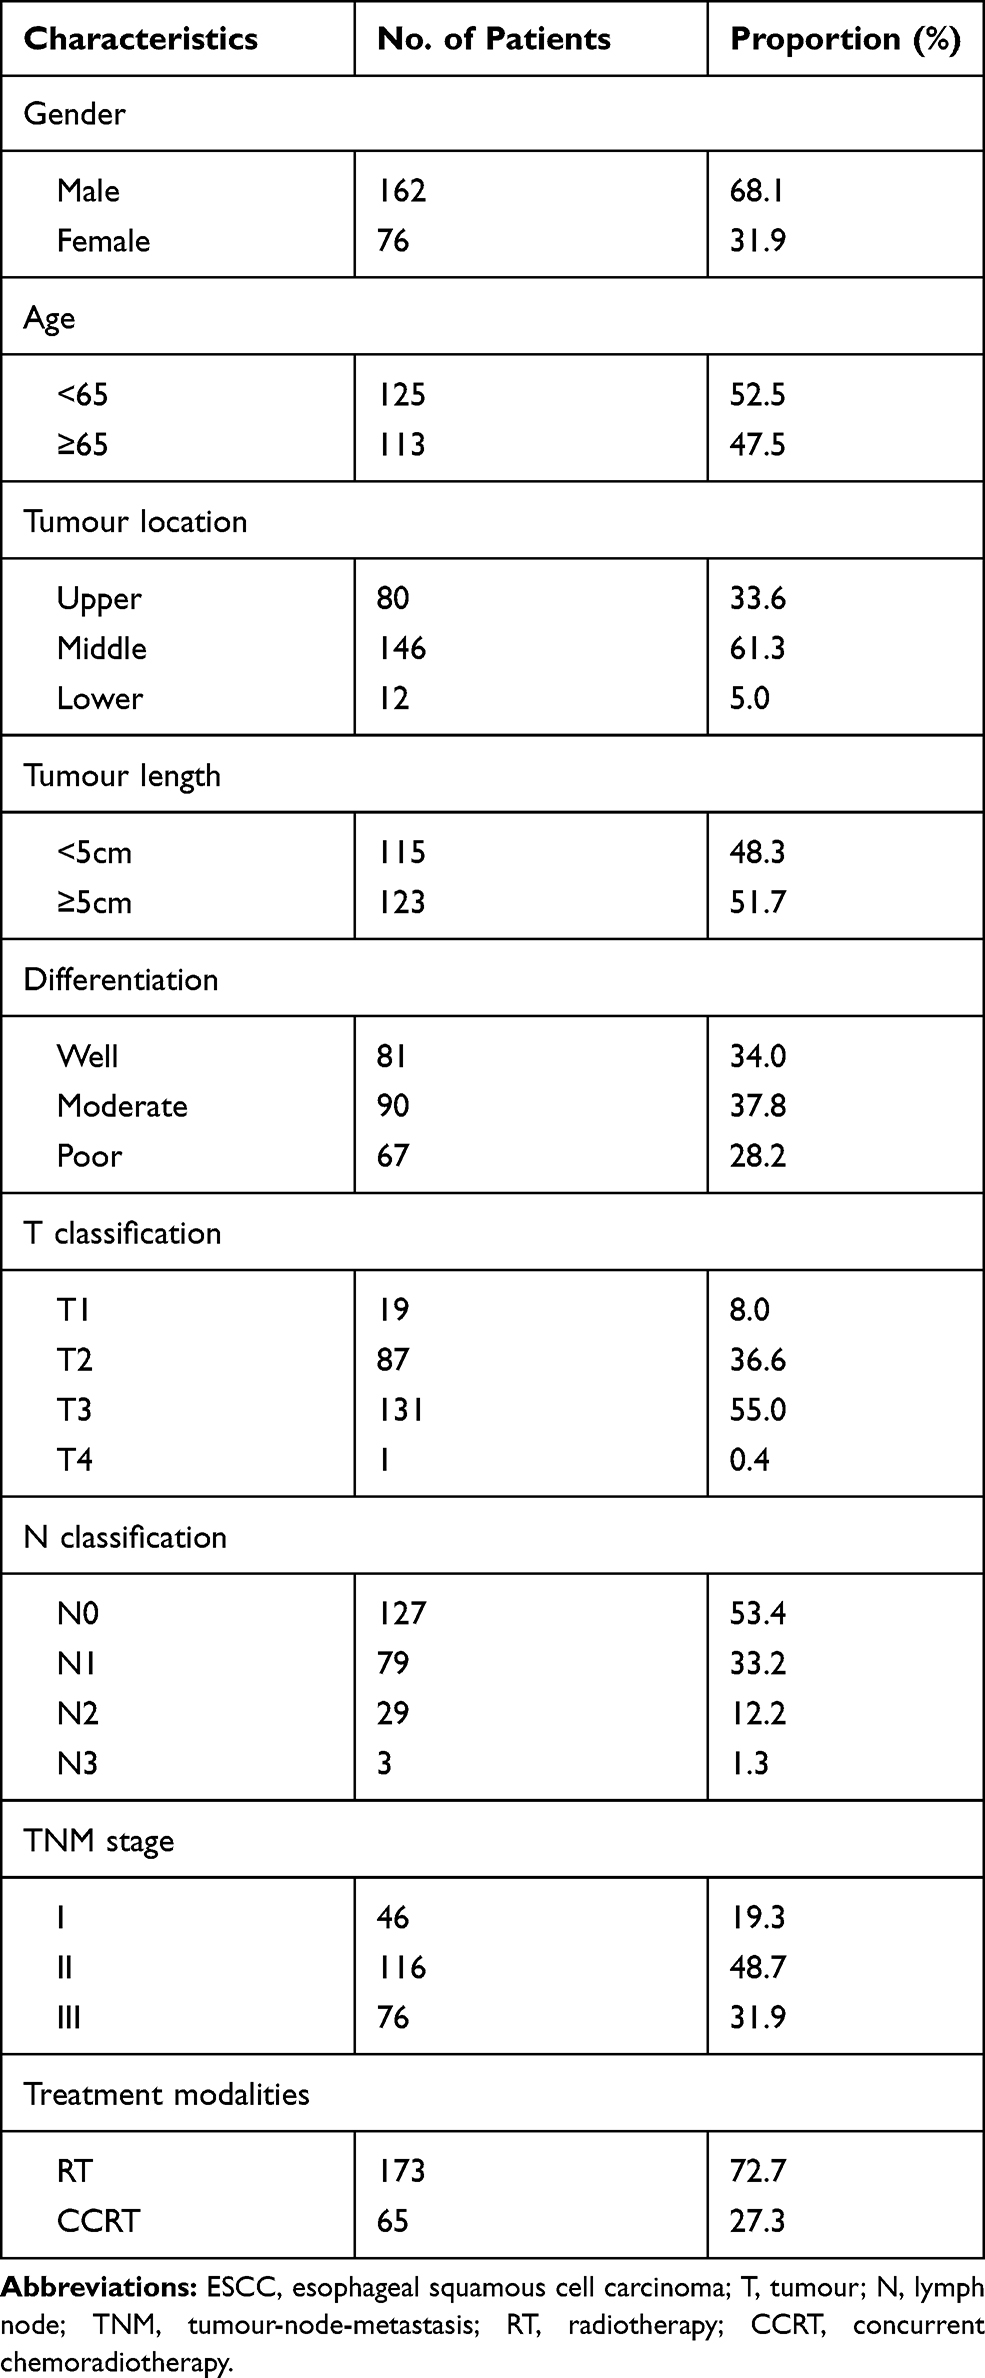 |
Table 1 Baseline Characteristics of the Patients with ESCC (n=238) |
Up to the follow-up, a total of 113 patients died, 45 of whom died of uncertain reasons. Sixty-eight patients died from the following causes: tumour progression (n=21), malnutrition (n=13), and tumour progression and malnutrition (n=34). A total of 18 of the 68 patients had complications, including 6 patients with gastrointestinal bleeding, 9 patients with pulmonary infection, 1 patient with heart failure, 1 patient with pulmonary infection complicated with heart failure and 1 patient with kidney failure. These data were obtained from the patients’ last hospitalization and follow-up records. The incidence of malnutrition was as high as 69% among patients with known causes of death.
Cut-off Value of Haemoglobin and PNI
According to ROC curve analysis, haemoglobin =132.5 (g/L) was selected as the evaluation cut-off point. There were 115 patients in the high haemoglobin group (haemoglobin greater than or equal to 132.5) and 123 patients in the low haemoglobin group (haemoglobin less than 132.5). Taking PNI=46.55 as the optimal cut-off point, 161 patients were included in the high PNI group (PNI greater than or equal to 46.55), and 77 patients were included in the low PNI group (PNI less than 46.55). The area under the curve of haemoglobin was 0.653 (P=0.001), while the area under the curve of PNI was 0.604 (P=0.018) (Figure 1).
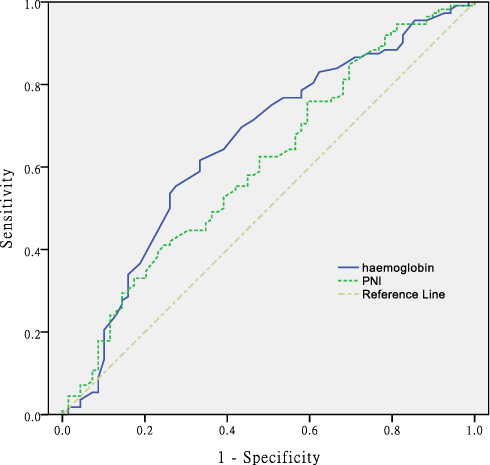 |
Figure 1 The ROC curve grouped by haemoglobin and PNI. |
Correlations Between the H-PNI Score and Clinicopathological Parameters
The associations of the H-PNI score and clinicopathological characteristics are presented in Table 2. According to the grading system of the H-PNI score, 59 (24.8%), 82 (34.5%), and 97 (40.7%) patients had H-PNI scores of 0, 1, and 2, respectively. The results showed that the H-PNI score was highly associated with sex (P=0.000) and age (P=0.000). No significant correlations were identified between H-PNI and tumour location, tumour length or other parameters.
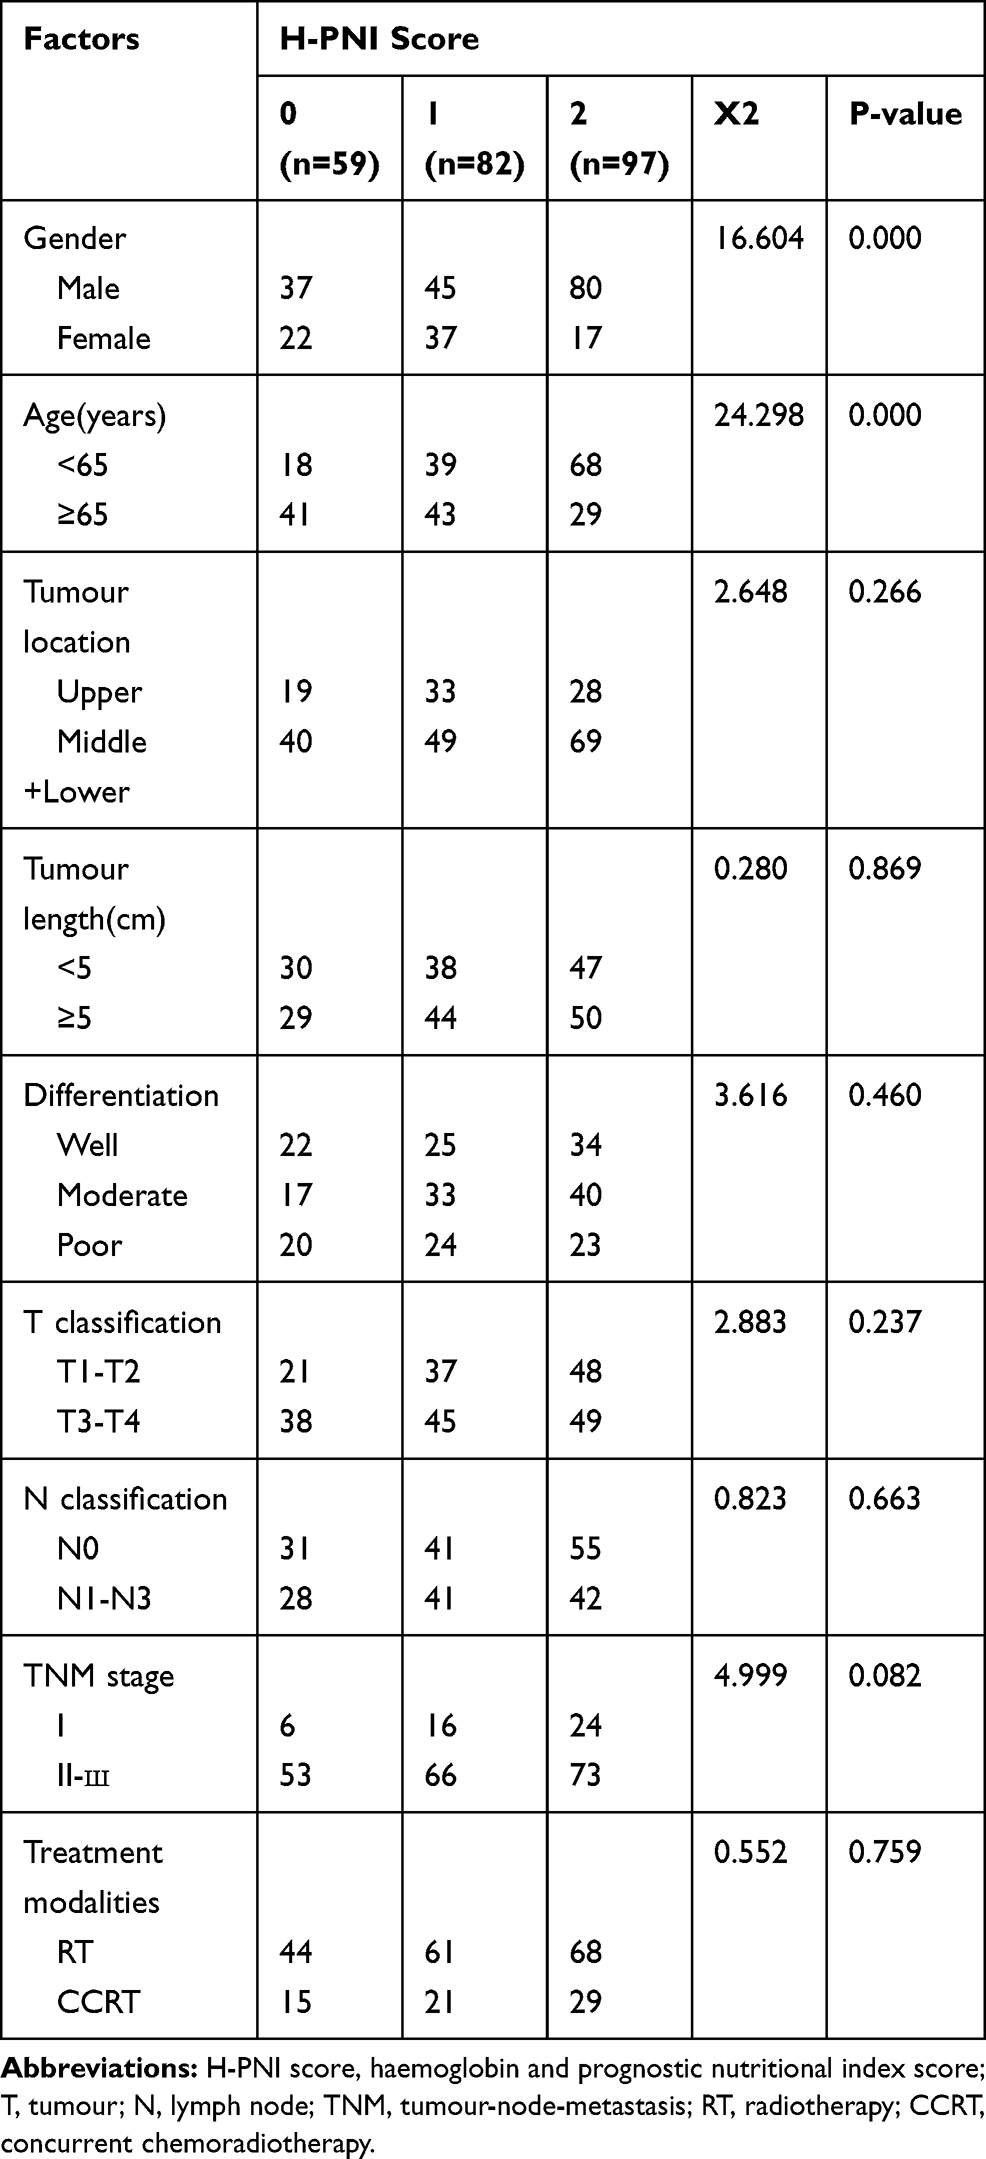 |
Table 2 Relationship Between H-PNI Score and Clinicopathological Characteristics (n = 238) |
Survival Analysis Based on Haemoglobin, PNI Levels or H-PNI Score
Based on the cut-off value of the haemoglobin level, 115 and 123 patients were classified into groups with high (≥132.5 g/L) or low (<132.5 g/L) haemoglobin levels, respectively. Furthermore, 161 and 77 patients had high (≥46.55) and low (<46.55) PNI levels, respectively, according to the determined cut-off value for PNI. Patients with high haemoglobin and PNI levels had a significantly better prognosis than those with low haemoglobin and PNI levels (P = 0.015 and P = 0.002, respectively; Figure 2A and B). Similarly, 59 and 179 patients had H-PNI scores of 0 and 1–2, respectively. The survival rate was significantly lower in patients with an H-PNI score of 0 than in those with an H-PNI score of 1–2 (P=0.000, Figure 2C).
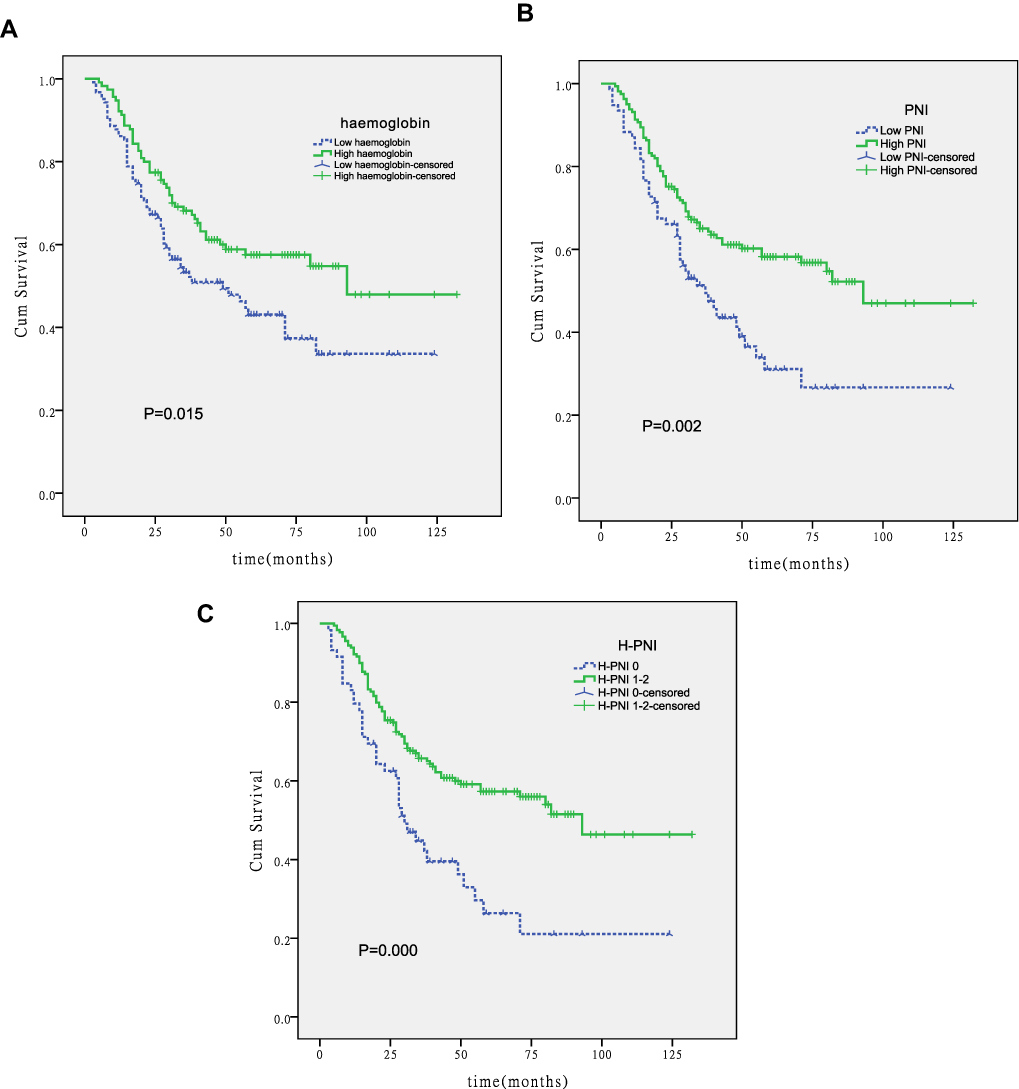 |
Figure 2 Kaplan–Meier curves for OS stratified according to haemoglobin, PNI, and H-PNI. (A) OS curves grouped by haemoglobin cut-off value (P=0.015). (B) OS curves stratified according to PNI cut-off value (p=0.002). (C) OS curves stratified by H-PNI score (P=0.000). |
Univariate and Multivariate Prognostic Analyses
Our results showed that differentiation, T and N classification, and H-PNI score were significantly associated with OS using univariate analysis. The results of multivariate analysis indicated that these factors were all independent prognostic factors (Table 3).
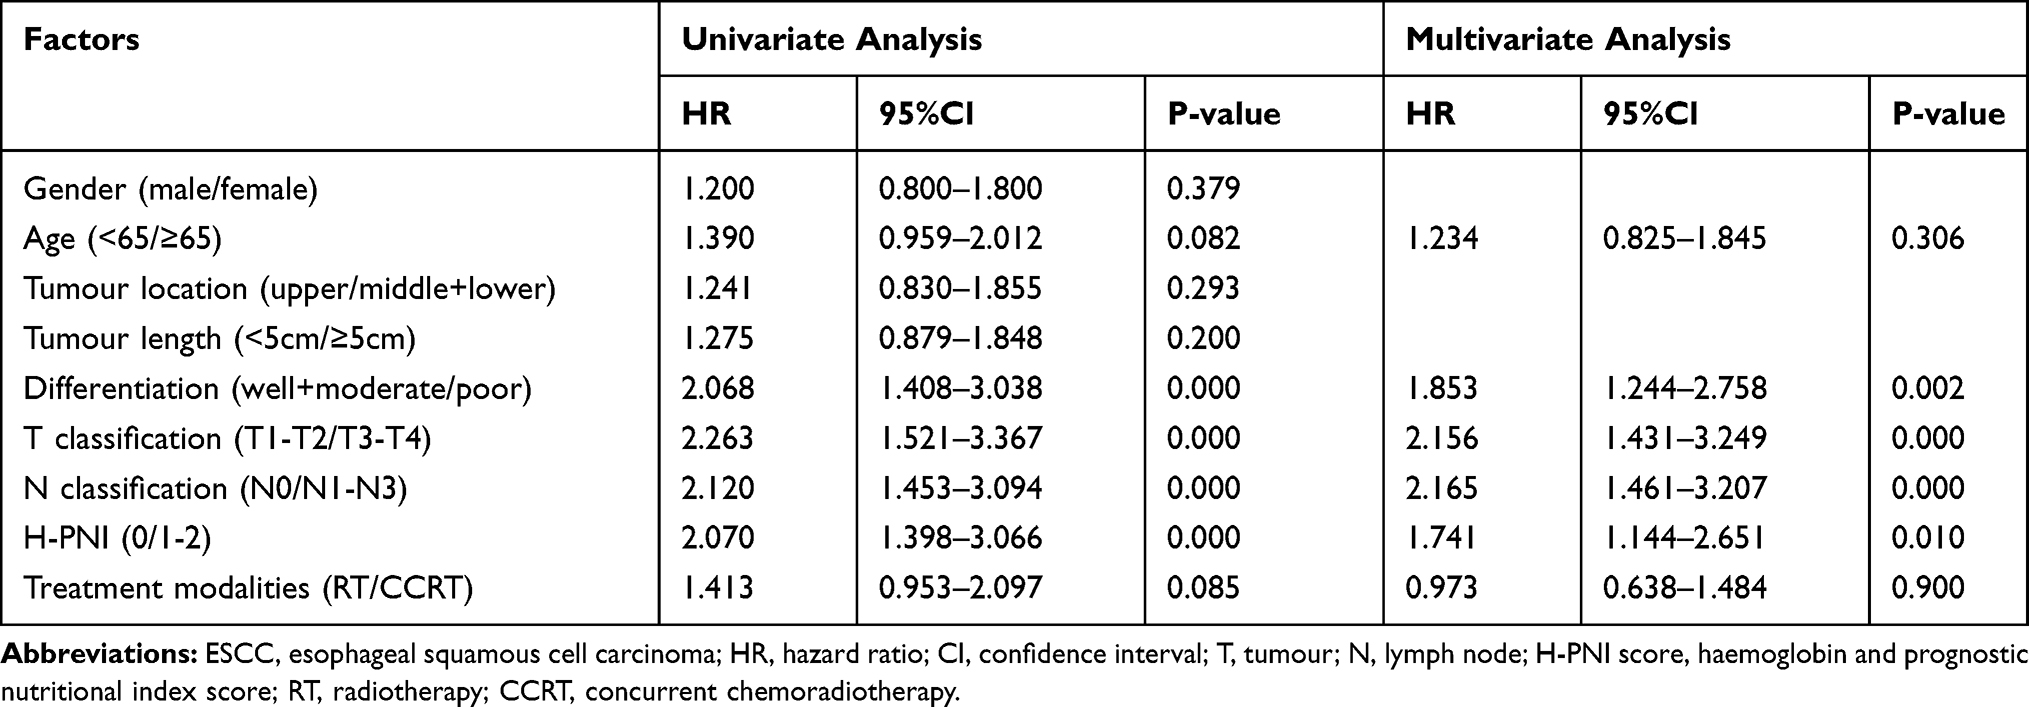 |
Table 3 Univariate and Multivariate Analyses for the Prediction of Overall Survival in Patients with ESCC (n=238) |
Discussion
Malnutrition is very common in ESCC patients. Early nutritional risk screening and timely nutritional intervention are of great significance to improve the quality of life and prolong the survival time of patients. At present, the commonly used nutrition screening tools are the Patient Generated-Subjective Global Assessment (PG-SGA), Nutritional Risk Screening 2002 (NRS-2002), Controlling Nutritional Status (CONUT) score, etc.17 The PG-SGA is a nutritional assessment tool recommended by the American Society of Parenteral Enteral Nutrition (ASPEN) and has been used to evaluate other nutritional assessment tools. It includes patient self-assessment and medical staff assessment, consisting of body mass, food intake, symptoms, activity, physical function, disease, stress status and physical examination, with a high degree of professionalism, sensitivity and specificity.18,19 The PG-SGA has the unique advantage of the unification of qualitative evaluation and quantitative evaluation, which differs from other nutrition evaluation tools. The NRS-2002 focuses on patients’ nutritional status and disease severity to assess the impact of nutritional interventions on clinical outcomes. The Chinese Society of Clinical Oncology (CSCO) recommended the NRS-2002 as the preferred tool for nutritional screening in hospitals. Its evaluation mainly includes three aspects: the degree of malnutrition, the severity of the disease, and whether the age of the patient is greater than 70 years. The NRS-2002 has a high positive detection rate for patients at nutritional risk and can be used as a reliable nutritional screening tool.20–22 The CONUT score is a screening tool for the early detection of malnutrition in hospitalized patients. It is mainly an indicator based on serum albumin, total cholesterol concentration and peripheral blood lymphocyte count. It is a simple and economical method to objectively and comprehensively predict prognosis.23 In addition, weight is the easiest and most intuitive indicator for nutritional assessment. Weight loss is common in patients with esophageal cancer and reflects changes in the balance of energy and protein. Therefore, body mass index (BMI) is often calculated to assess patients’ nutritional status.
In this study, we evaluated the prognostic value of preoperative haemoglobin and PNI levels in ESCC patients undergoing postoperative radiotherapy. Previous studies have indicated that preoperative nutritional risk screening has predictive value for the prognosis of patients with esophageal cancer, and prognostic nutritional indicators can objectively reflect the nutritional status of patients through the calculation of haematological parameters, thus indicating the long-term survival of patients.24–27 PNI was calculated from the serum albumin level and lymphocyte count. Serum albumin reflects the total protein content of the body and is an appropriate biomarker for monitoring protein energy malnutrition in cancer patients. Thus, a lack of serum albumin indicates poor nutritional status and poor outcomes.28–31 Lymphocytes inhibit tumour cell proliferation, migration, and angiogenesis, so a low lymphocyte count can lead to undesirable results and is a sign of impaired immune defence due to malnutrition.32–34 Numerous previous studies have linked inflammatory responses to cancer progression and lower survival rates. For example, the neutrophil-to-lymphocyte ratio (NLR) is an inflammatory response indicator. A higher preoperative NLR was found to increase the risk of recurrence in patients with esophageal cancer resection.35 In another study, an increased platelet-to-lymphocyte ratio (PLR) indicated a poorer prognosis in ESCC patients.36,37 Low haemoglobin is common in a variety of tumours, such as lung,38 breast,39 and gastric cancers,40 but the specific mechanism has not been thoroughly studied. It has been proposed that soluble molecules secreted by tumour cells, such as interleukin-6 (IL-6) and tumour necrosis factor-alpha (TNF-alpha), can reduce haemoglobin levels by changing the haematopoietic environment.41 To our knowledge, this is the first study to examine the relationship between preoperative haemoglobin levels and prognosis in patients with ESCC. Furthermore, we simultaneously studied haemoglobin and PNI to explore the relationship between these indicators and the prognosis of ESCC patients undergoing postoperative radiotherapy.
The most unique aspect of this study is that we evaluated the clinical significance of the H-PNI score, which combines the haemoglobin level and PNI, in ESCC patients who underwent surgery and postoperative radiotherapy. The results of our study showed that the median survival times were 30 and 93 months in patients with H-PNI scores of 0 and 1–2, respectively (P =0.000). This result suggested that patients with a high H-PNI score have a better prognosis. Moreover, univariate and multivariate prognostic analyses showed that the H-PNI score was an independent prognostic factor for patients (P=0.010). In addition to the H-PNI score, differentiation and T and N classification were also independent prognostic factors.
This study had some limitations. First, the patients enrolled in this retrospective study were treated in a single institution. Second, the blood parameters related to the H-PNI score were collected only at a time point before the surgery, and they were not fully recorded and analysed during the treatment and follow-up. This is noteworthy because blood parameters can be affected by a variety of pathological conditions during or after treatment and change over time. Third, only 238 ESCC patients were enrolled in this study, and the sample size was insufficient. Finally, this study is a retrospective analysis. Due to the limited medical records and the lack of clinical expertise of patients’ family members, it is impossible to make an accurate judgement on the cause of death of the patients, so there is insufficient evidence to support whether malnutrition was the main cause of death. Based on the above limitations, large-scale multi-centre clinical studies are needed to confirm the study’s findings.
Conclusion
The H-PNI score is an independent prognostic factor for ESCC patients. Since it is determined by blood examinations, using the H-PNI score to predict the prognosis of patients is a simple and economical method. For patients with low preoperative H-PNI scores, nutritional support can be provided as early as possible to improve the survival time and quality of life of patients.
Acknowledgment
This study was supported by the Medical Science and Technology Development Project of Yancheng (YK2019007).
Disclosure
The authors report no conflicts of interest in this work.
References
1. Siegel RL, Miller KD, Jemal A. Cancer statistics, 2015. CA Cancer J Clin. 2015;65(1):5–29. doi:10.3322/caac.21254
2. Ferlay J, Shin HR, Bray F, et al. Estimates of worldwide burden of cancer in 2008: GLOBOCAN 2008. Int J Cancer. 2010;127(12):2893–2917. doi:10.1002/ijc.25516
3. Zhang Y. Epidemiology of esophageal cancer. World J Gastroenterol. 2013;19(34):5598–5606. doi:10.3748/wjg.v19.i34.5598
4. Natsugoe S, Matsumoto M, Okumura H, et al. Initial metastatic, including micrometastatic, sites of lymph nodes in esophageal squamous cell carcinoma. J Surg Oncol. 2005;89(1):6–11. doi:10.1002/jso.20172
5. Zhang Z, Zong L, Xu B, et al. Observation of clinical efficacy of application of enhanced recovery after surgery in perioperative period on esophageal carcinoma patients. J BUON. 2018;23(1):150–156. doi:10.1016/j.bone.2018.05.013
6. Sakanaka K, Fujii K, Ishida Y, et al. Nutritional and clinical outcomes of chemoradiotherapy for clinical T1N0M0 esophageal carcinoma. Cancer Manag Res. 2019;11:3623–3630. doi:10.2147/CMAR.S189518
7. Cox S, Powell C, Carter B, et al. Role of nutritional status and intervention in oesophageal cancer treated with definitive chemoradiotherapy: outcomes from SCOPE1. Br J Cancer. 2016;115(2):172–177. doi:10.1038/bjc.2016.129
8. Di Fiore A, Lecleire S, Gangloff A, et al. Impact of nutritional parameter variations during definitive chemoradiotherapy in locally advanced oesophageal cancer. Dig Liver Dis. 2014;46(3):270–275. doi:10.1016/j.dld.2013.10.016
9. Zhang H, Shang X, Ren P, et al. The predictive value of a preoperative systemic immune-inflammation index and prognostic nutritional index in patients with esophageal squamous cell carcinoma. J Cell Physiol. 2019;234(2):1794–1802. doi:10.1002/jcp.27052
10. Malik HZ, Prasad KR, Halazun KJ, et al. Preoperative prognostic score for predicting survival after hepatic resection for colorectal liver metastases. Ann Surg. 2007;246(5):806–814. doi:10.1097/SLA.0b013e318142d964
11. Migita K, Takayama T, Saeki K, et al. The prognostic nutritional index predicts long-term outcomes of gastric cancer patients independent of tumor stage. Ann Surg Oncol. 2013;20(8):2647–2654. doi:10.1245/s10434-013-2926-5
12. Okada S, Shimada J, Kato D, et al. Clinical significance of prognostic nutritional index after surgical treatment in lung cancer. Ann Thorac Surg. 2017;104(1):296–302. doi:10.1016/j.athoracsur.2017.01.085
13. Yang Z, Zhang B, Hou L, et al. Pre-operative prognostic nutritional index predicts the outcomes for triple-negative breast cancer. Tumour Biol. 2014;35(12):12165–12171. doi:10.1007/s13277-014-2524-6
14. Li B, Lu Z, Wang S, et al. Pretreatment elevated prognostic nutritional index predicts a favorable prognosis in patients with prostate cancer. BMC Cancer. 2020;20(1):361. doi:10.1186/s12885-020-06879-1
15. Xia LJ, Li W, Zhai JC, et al. Significance of neutrophil-to-lymphocyte ratio, platelet-to-lymphocyte ratio, lymphocyte-to-monocyte ratio and prognostic nutritional index for predicting clinical outcomes in T1-2 rectal cancer. BMC Cancer. 2020;20(1):208. doi:10.1186/s12885-020-6698-6
16. Akgül Ö, Çetinkaya E, Yalaza M, et al. Prognostic efficacy of inflammation-based markers in patients with curative colorectal cancer resection. World J Gastrointest Oncol. 2017;9(7):300–307. doi:10.4251/wjgo.v9.i7.300
17. Lyu J, Li T, Xie C, et al. Enteral nutrition in esophageal cancer patients treated with radiotherapy: a Chinese expert consensus 2018. Future Oncol. 2019;15(5):517–531. doi:10.2217/fon-2018-0697
18. Kim JY, Wie GA, Cho YA, et al. Development and validation of a nutrition screening tool for hospitalized cancer patients. Clin Nutr. 2011;30(6):724–729. doi:10.1016/j.clnu.2011.06.001
19. Persson C, Sjoden PO, Glimelius B. The Swedish version of the patient-generated subjective global assessment of nutritional status: gastrointestinal vs urological cancers. Clin Nutr. 1999;18(2):71–77. doi:10.1016/S0261-5614(99)80054-5
20. Ye XJ, Ji YB, Ma BW, et al. Comparison of three common nutritional screening tools with the new European Society for Clinical Nutrition and Metabolism (ESPEN) criteria for malnutrition among patients with geriatric gastrointestinal cancer: a prospective study in China. BMJ Open. 2018;8(4):e019750. doi:10.1136/bmjopen-2017-019750
21. Almeida AI, Correia M, Camilo M, Ravasco P. Nutritional risk screening in surgery: valid, feasible, easy! Clin Nutr. 2012;31(2):206–211. doi:10.1016/j.clnu.2011.10.003
22. Ryu SW, Kim IH. Comparison of different nutritional assessments in detecting malnutrition among gastric cancer patients. World J Gastroenterol. 2010;16(26):3310–3317. doi:10.3748/wjg.v16.i26.3310
23. Ignacio de Ulíbarri J, González-Madroño A, de Villar NG, et al. CONUT: a tool for controlling nutritional status. First validation in a hospital population. Nutr Hosp. 2005;20(1):38–45.
24. Dai Y, Fu X, Li T, et al. Long-term impact of prognostic nutritional index in cervical esophageal squamous cell carcinoma patients undergoing definitive radiotherapy. Ann Transl Med. 2019;7(8):175. doi:10.21037/atm.2019.03.60
25. Sun HJ, Guo XW, Ji SJ, et al. [Prognostic influence of preoperative Nutritional Risk Screening −2002 (NRS-2002) score for patients with thoracic esophageal squamous cell carcinoma receiving surgery]. Zhonghua Zhong Liu Za Zhi. 2018;40(12):917–921. doi:10.3760/cma.j.issn.0253-3766.2018.12.009. Chinese.
26. Wang J, Yu B, Ye Y, et al. Predictive value of nutritional risk screening 2002 and prognostic nutritional index for esophageal cancer patients undergoing definitive radiochemotherapy. Nutr Cancer. 2018;70(6):879–885. doi:10.1080/01635581.2018.1470656
27. Matsumoto Y, Zhou Q, Kamimura K, et al. The prognostic nutrition index predicts the development of hematological toxicities in and the prognosis of esophageal cancer patients treated with cisplatin plus 5-fluorouracil chemotherapy. Nutr Cancer. 2018;70(3):447–452. doi:10.1080/01635581.2018.1445765
28. Miller KR, Bozeman MC. Nutrition therapy issues in esophageal cancer. Curr Gastroenterol Rep. 2012;14(4):356–366. doi:10.1007/s11894-012-0272-6
29. Laviano A, Di Lazzaro L, Koverech A. Nutrition support and clinical outcome in advanced cancer patients. Proc Nutr Soc. 2018;77(4):388–393. doi:10.1017/S0029665118000459
30. Kühn T, Sookthai D, Graf ME, et al. Albumin, bilirubin, uric acid and cancer risk: results from a prospective population-based study. Br J Cancer. 2017;117(10):1572–1579. doi:10.1038/bjc.2017.313
31. Wang CY, Hsieh MJ, Chiu YC, et al. Higher serum C-reactive protein concentration and hypoalbuminemia are poor prognostic indicators in patients with esophageal cancer undergoing radiotherapy. Radiother Oncol. 2009;92(2):270–275. doi:10.1016/j.radonc.2009.01.002
32. Seager RJ, Hajal C, Spill F, et al. Dynamic interplay between tumour, stroma and immune system can drive or prevent tumour progression. Converg Sci Phys Oncol. 2017;3(3):034002. doi:10.1088/2057-1739/aa7e86
33. Fang P, Jiang W, Davuluri R, et al. High lymphocyte count during neoadjuvant chemoradiotherapy is associated with improved pathologic complete response in esophageal cancer. Radiother Oncol. 2018;128(3):584–590. doi:10.1016/j.radonc.2018.02.025
34. Davuluri R, Jiang W, Fang P, et al. Lymphocyte nadir and esophageal cancer survival outcomes after chemoradiation therapy. Int J Radiat Oncol Biol Phys. 2017;99(1):128–135. doi:10.1016/j.ijrobp.2017.05.037
35. Sharaiha RZ, Halazun KJ, Mirza F, et al. Elevated preoperative neutrophil:lymphocyte ratio as a predictor of postoperative disease recurrence in esophageal cancer. Ann Surg Oncol. 2011;18(12):3362–3369. doi:10.1245/s10434-011-1754-8
36. Feng JF, Huang Y, Chen QX. Preoperative platelet lymphocyte ratio (PLR) is superior to neutrophil lymphocyte ratio (NLR) as a predictive factor in patients with esophageal squamous cell carcinoma. World J Surg Oncol. 2014;12:58. doi:10.1186/1477-7819-12-58
37. Zhang H, Guo XW, Yin XX, Liu YC, Ji SJ. Nomogram-integrated C-reactive protein/albumin ratio predicts efficacy and prognosis in patients with thoracic esophageal squamous cell carcinoma receiving chemoradiotherapy. Cancer Manag Res. 2019;11:9459–9468. doi:10.2147/CMAR.S228113
38. Holgersson G, Sandelin M, Hoye E, et al. Swedish lung cancer radiation study group: the prognostic value of anaemia, thrombocytosis and leukocytosis at time of diagnosis in patients with non-small cell lung cancer. Med Oncol. 2012;29(5):3176–3182. doi:10.1007/s12032-012-0247-3
39. Ray-Coquard I, Morère JF, Scotté F, et al. Management of anemia in advanced breast and lung cancer patients in daily practice: results of a French survey. Adv Ther. 2012;29(2):124–133. doi:10.1007/s12325-011-0093-2
40. Vannella L, Lahner E, Osborn J, Annibale B. Systematic review: gastric cancer incidence in pernicious anaemia. Aliment Pharmacol Ther. 2013;37(4):375–382. doi:10.1111/apt.12177
41. Banzet S, Sanchez H, Chapot R, et al. Interleukin-6 contributes to hepcidin mRNA increase in response to exercise. Cytokine. 2012;58(2):158–161. doi:10.1016/j.cyto.2012.01.006
 © 2020 The Author(s). This work is published and licensed by Dove Medical Press Limited. The
full terms of this license are available at https://www.dovepress.com/terms
and incorporate the Creative Commons Attribution
- Non Commercial (unported, 3.0) License.
By accessing the work you hereby accept the Terms. Non-commercial uses of the work are permitted
without any further permission from Dove Medical Press Limited, provided the work is properly
attributed. For permission for commercial use of this work, please see paragraphs 4.2 and 5 of our Terms.
© 2020 The Author(s). This work is published and licensed by Dove Medical Press Limited. The
full terms of this license are available at https://www.dovepress.com/terms
and incorporate the Creative Commons Attribution
- Non Commercial (unported, 3.0) License.
By accessing the work you hereby accept the Terms. Non-commercial uses of the work are permitted
without any further permission from Dove Medical Press Limited, provided the work is properly
attributed. For permission for commercial use of this work, please see paragraphs 4.2 and 5 of our Terms.