Back to Journals » OncoTargets and Therapy » Volume 12
Collagen stiffness promoted non-muscle-invasive bladder cancer progression to muscle-invasive bladder cancer
Authors Zhu H, Chen H ![]() , Wang J, Zhou L, Liu S
, Wang J, Zhou L, Liu S ![]()
Received 14 November 2018
Accepted for publication 12 March 2019
Published 7 May 2019 Volume 2019:12 Pages 3441—3457
DOI https://doi.org/10.2147/OTT.S194568
Checked for plagiarism Yes
Review by Single anonymous peer review
Peer reviewer comments 3
Editor who approved publication: Prof. Dr. Geoffrey Pietersz
Huier Zhu,1,* Hui Chen,2,* Jizhong Wang,3,* Ling Zhou,4 Shaoyan Liu2
1Department of Emergency Surgery, The Third Affiliated Hospital of Guangzhou Medical University, Guangzhou Medical University, Guangzhou, Guangdong 510150, People’s Republic of China; 2Department of Pathology, The Third Affiliated Hospital of Guangzhou Medical University, Guangzhou Medical University, Guangzhou, Guangdong 510150, People’s Republic of China; 3Biomedicine Research Center, The Third Affiliated Hospital of Guangzhou Medical University, Guangzhou Medical University, Guangzhou, Guangdong 510150, People’s Republic of China; 4Special Clinic Center, Zhongshan People’s Hospital of Guangdong Province, Zhongshan, 528403, People’s Republic of China
*These authors contributed equally to this work
Purpose: Bladder cancer (BCa) is generally considered one of the most prevalent deadly diseases worldwide. Patients suffering from muscle-invasive bladder cancer (MIBC) possess dismal prognoses, while those with non-muscle-invasive bladder cancer (NMIBC) generally have a favorable outcome after local treatment. However, some NMIBCs relapse and progress to MIBC, with an unclarified mechanism. Hence, insight into the genetic drivers of BCa progression has tremendous potential benefits for precision therapeutics, risk stratification, and molecular diagnosis.
Methods: In this study, three cohorts profile datasets (GSE13507, GSE32584, and GSE89) consisting of NMIBC and MIBC samples were integrated to address the differently expressed genes (DEGs). Subsequently, the protein-protein interaction (PPI) network and pathway enrichment analysis of DGEs were performed.
Results: Six collagen members (COL1A1, COL1A2, COL5A2, COL6A1, COL6A2, and COL6A3) were up-regulated and gathered in the ECM-receptor interaction signal pathway identified by KEGG pathway analysis and GSEA. Evidence derived from the Oncomine and TCGA databases indicated that the 6 collagen genes promote the progression of BCa and are negatively associated with patient prognosis. Moreover, taking COL1A1 as a further research object, the results showed that COL1A1 was up-regulated in MIBC and its knockdown significantly inhibited the proliferation, migration, and invasion of 5637 and T24 cells by inhibiting epithelial-mesenchymal transition (EMT) process and the TGF-β signaling pathway.
Conclusion: With integrated bioinformatic analysis and cell experiments, we showed that 6 collagen family members are high progression risk factors and that they can be used as independent effective diagnostic and prognostic biomarkers for BCa.
Keywords: genomic analysis, bladder cancer, invasion, diagnostic marker, prognostic markers
Introduction
BCa is a common malignant urologic cancer worldwide, with approximately 76960 new cases and 16390 deaths in 2016 due to its poor clinical outcome.1,2 Approximately 80% of BCa patients have non-muscle invasive tumors (Ta, T1, and Tis).3 Unfortunately, 10 to 30% of NMIBCs progress to MIBCs(T2~T4).4 On account of the involvement of multistep accumulation of genetic and epigenetic factors and external elements, such as tobacco smoking, neutrophil-to-lymphocyte ratio, body mass index, residual T1 high-grade (HG)/G3 tumors, or other carcinogens,5–8 BCa can progress from a retrievable form of NMIBC into MIBC, an advanced crippling morphology compared to the former.9 In order to prevent postoperative bladder cancer recurrence and progression, some adjuvant means are applied such as chemotherapy, Chinese medicine, vaccine, etc.10–13
Many resources and tools have empowered in-depth studies on the mechanisms accounting for BCa progression, which provide more possibilities in providing ideal and reliable methods to identify important genetic or epigenetic modifications in cancer progression. At present, novel abnormally expressed genes and key signaling pathways can be addressed by advanced bioinformatics analysis, rendering many clinical evaluations for BCa studies.14 The field of identifying novel cancer susceptibility loci and some individual SNPs that account for the heritability of BCa has been advanced by GWAS (genome-wide association studies).15 Recently, using TCGA analysis, researchers found that MIBC has high overall mutation rates and some recurrent alterations in genes including TP53, PIK3CA, and FGFR3 genes, and also somatic TERT promoter mutations that present in the early process of BCa.16
BCa entails a complex process, through which a primary tumor progresses to a disseminated metastatic disease. Non-cellular surroundings, the extracellular matrix (ECM), interact with cancer cells at each step of the metastatic process.17 During cancer progression, the ECM regulates numerous cell functions, including proliferation, migration, invasion and protein synthesis.18 The ECM comprises approximately 300 proteins, of which collagen, elastin, and fibronectin are common.19 The ECM interacts with cells, and these interactions are mediated by transmembrane receptors, such as integrins, syndecans, CD44, discoidin domain receptor, and dystoglycan.20,21 In breast cancer, ECM proteins appear to be involved in the maintenance of tumor cell shape, migration and invasion by regulating the expression of the CD44 protein, known as a tumor prognostic factor, thus acting on tumor progression and metastasis.22 However, although ECM is closely related to tumor metastasis, the role of ECM proteins, especially collagens in the progression of non-invasive BCa into invasive cancer has not been extensively studied.
While many studies have been carried out, BCa progression is still poorly understood, with some more esoteric theories remaining unexplored. In this study, to address the potential markers and risk factors of BCa, the expression profiles of MIBC tissue and NMIBC tissue obtained from three GEO datasets were analyzed by using the limma package. Through KEGG pathway analysis and GSEA, the ECM–receptor interaction signaling pathway was identified. By further analyzing the Oncomine database, it was determined that 6 collagen family members that are located in the ECM–receptor interaction signaling pathway were positively correlated with BCa progression. Analyzing the Oncomine and the TCGA databases indicated that 6 collagen genes overexpressed in MIBC are significantly correlated with BCa progression, overall survival, and recurrence-free survival in patients with BCa. The pivotal protein COL1A1 is further disposed with expression silencing to determine its more profound functions or roles in the tumor cell growth, proliferation, invasion and migration in BCa. The results revealed that the 6 collagen family members and the ECM-receptor interaction signaling pathway play a significant role and that the 6 collagen family members may be effective, independent prognostic biomarkers of BCa progression.
Materials and methods
Microarray data information and degs identification
NMIBC and MIBC tissue gene expression profiles of GSE13507, GSE32584 and GSE89 were all obtained from NCBI-GEO (
Construction of protein-protein interaction (PPI) network
PPI analysis was used to search core genes and gene modules related to carcinogenesis. DEGs were committed to STRING version 10.5 (Search Tool for the Retrieval of Interacting Genes; string.embl.de) to find interaction associations of the proteins with the confidence score>0.4 used as the threshold criterion.26 Then, Cytoscape software (cytoscape.org) was performed to construct a PPI network of DEGs and analyze the interaction relationship of DEGs encoding proteins in BCa.27
Functional and pathway enrichment analysis
Gene ontology (GO) analysis is a common method for analyzing the functions of many genes.28 Kyoto Encyclopedia of Genes and Genomes (KEGG) is the major recognized pathway-related database resource for biological interpretation of high-throughput data. GO and KEGG analyses are available in the DAVID database (
Gene set enrichment (GSEA) analysis
GSEA is a method to identify classes of genes in a big set of genes that may have a correlation with disease phenotypes. These genes are grouped together by their involvement in the same biological pathway or by proximal location on a chromosome. Generally, the enrichment score (ES) indicates the degree to which the genes are over-represented at either the top or bottom of the list, corresponding to the largest differences in genes expression between the MIBC and NMIBC tissues, is first calculated. Then, the estimated statistical significance of the ES before the enrichment scores for each set are normalized, and a false discovery rate is counted.29 The normalized enrichment score (NES) and nominal p-value were applied to rank the pathways enriched in each phenotype.
Oncomine and TCGA analysis
Oncomine database (
Tissue samples and immunohistochemistry (IHC) staining
In this study, a total of 30 tisuue samples(15 NMIBC and 15 MIBC) were collected from BCa patients who received surgery at the Third Affiliated Hospital, Guangzhou Medical University. All patients provided wirtten informed consent for the use of their tissue for research. All patients were confirmed to have BCa via histopathological evaluations. None of the patients received treatment before surgery. This study was approved by the Internal Research Ethics Board at the Third Affiliated Hospital of Guangzhou Medical University and was conducted in accordance with the Declaration of Helsinki. Paraffin-embedded sections (3 µm) from 30 BCa samples were deparaffinized, rehydrated and blocked as previously described30 After being incubated with a goat anti-human monoclonal COL1A1 antibody (1:200; ab138492, Abcam, Cambridge, UK), sections were incubated with a biotin-labeled rabbit anti-goat antibody. Sections were visualized with streptavidin-conjugated horseradish peroxidase and 3, 3-diaminobenzidine (DAB). According to the number of cells stained (≤5% positive cells, 0; 6–25% positive cells,1; 25–50% positive cells,2; 50–80% positive cells,3; >80% positive cells, 4) and the staining intensity (no staining, 0; mild staining, 1; moderate staining, 2; severe staining, 3), each sample was scored. The final score was the sum of the positive cell percentage score and the staining intensity score.
Cell culture and RNAi
5637 and T24 BCa cells were purchased from the Institute of Cell Research, Chinese Academy of Sciences, Shanghai, China. The 5637 and T24 cells were cultured in RPMI-1640 medium (Invitrogen, Carlsbad, CA, USA) with 10% fetal bovine serum. Plates were then placed at 37 °C in a humidified atmosphere of 5% CO2 in an incubator. The siRNAs against COL1A1 gene with RNAiMAX (Invitrogen) were transfected into 5637 and T24 cells for 48h. The following siRNA sequences were used: COL1A1#NC, sense: 5‘-ACUGCCGUUGUUAAGGUGUTT-3′, antisense: 5′-ACACCUUAACAACGGCAGUTT-3′, COL1A1#1, sense: 5′-GUACGUCCGGUUGUAUGUATT-3′, antisense: 5′-UACAUACAACCGGACGUACTT-3′, COL1A1#2, sense:5′-GGUGUUGUGCGAUGACGUGTT-3′, antisense: 5′-CACGUCAUCGCACAACACCTT-3′.
qRT-PCR
Total RNA was extracted from Treated 5637 and T24 cells using Trizol lysis method. cDNA synthesis was performed using the PrimeScript™Reverse Transcription System (Takara). RNA levels of COL1A1were detected using qRT-PCR according to the manufacturer’s protocol. Expression of COL1A1 and GAPDH were measured using the 2-ΔΔCt method. The following primer sequences were used: COL1A1, forward: GAGACCTGCGTGTACCCCACT, reverse: GTCATGCTCTCGCCGAACCAG; GAPDH, forward: CCCACTCCTCCACCTTTGAC, reverse: TCTTCCTCTTGTGCTCTTGC.
Western blotting
Total cell lysates were separated by 8% or 10% SDS-PAGE and then electroblotted and transferred onto PVDF membranes.31 After incubation with primary antibodies specific for COL1A1 (1:1000; sc-293182, Santa Cruz, TX, USA), CD44 (1:2000; #37259, CST, Boston, USA), E-cadherin (1:2000; #14472, CST, Boston, USA), vimentin (1:2000; #5741, CST, Boston, USA), TGFBI(1:1000; 10188–1-AP, proteintech, IL, USA), MMP9 (1:2000; #15561, CST, Boston, USA) and β-actin (1:4000,sc-81178, Santa Cruz, TX, USA) at 4 °C overnight, the blots were incubated with the corresponding secondary antibodies at room temperature, and the proteins were detected with an ECL kit.
Cell proliferation assay
5637 and T24 BCa cells were transfected with the indicated siRNAs for 48 h; 1×10⁴ cells were seeded into 24-well plates. The cells were counted for the number of viable cells at 24, 48, 72, 96, and 120 h. After being transfected with the indicated siRNAs for 48 h, the cells were analyzed with an EdU Kit (C10310-1, RiboBio) according to the manufacturer’s protocol. The results were detected with an inverted fluorescence microscope (Nikon).
Colony formation assays
For colony formation assays, 500 5637 or T24 cells were seeded and cultured in RPMI 1640 medium containing 10% FBS for 12 or 7 days, respectively. Clones were fixed with methanol and stained with 0.5% crystal violet.
Migration and invasion assays
For transwell migration assays, 1×10⁵ 5637 or T24 cells were plated in the top transwell chamber (8-µm pore size, BD, NY, USA) and were cultured in RPMI 1640 medium containing 0.1% FBS for 36 or 24 h, respectively. The chambers were placed in RPMI 1640 medium containing 10% FBS. Then, the chambers were fixed with methanol and stained with 0.5% crystal violet. The results were detected with an inverted microscope (Nikon).
For invasion assays, chamber inserts were coated with 100 μl/ml of Matrigel (BD, Biosciences, MA, USA) with RPMI 1640 media and dried for 1 h at 37°C. Then, 20×104 5637 or T24 cells were plated in the top transwell chamber and were cultured in RPMI 1640 medium containing 0.1% FBS for 96 or 48 h, respectively. The same staining and detecting method for the migration assay was used.
Statistics
Statistical analysis was performed using GraphPad Prism 5. The survival curve between the groups was described by the Kaplan-Meier plot and was evaluated using the log-rank test. Differences in quantitative data were compared between the two groups using Student’s t-test. All experiments were performed three times independently. *p<0.05, **p<0.01, or ***p<0.001 was considered to be significant.
Results
The ECM-receptor interaction signal pathway may promote BCa progression
By utilizing gene expression microarray analysis, DEGs (491 in GSE13507, 418 in GSE32584, and 529 in GSE89) were identified, and 45 genes were found in all three datasets (Figure 1A). These 45 genes were shown in Table 1, including 30 up-regulated genes and 15 down-regulated genes in the MIBC tissues compared with NMIBC tissues (Table 1). PPI network was performed using the STRING database, and the results are presented in Figure 1B. Analysis of the PPI sub-network demonstrated that COL1A1, COL1A2, COL5A2, COL6A1, COL6A2, COL6A3, MMP9, THY1, TAGLN, VIM, CTGF, PDGFRB, ACTA2, SPP1, and TPM2 interacted closely with each other (Figure 1B).
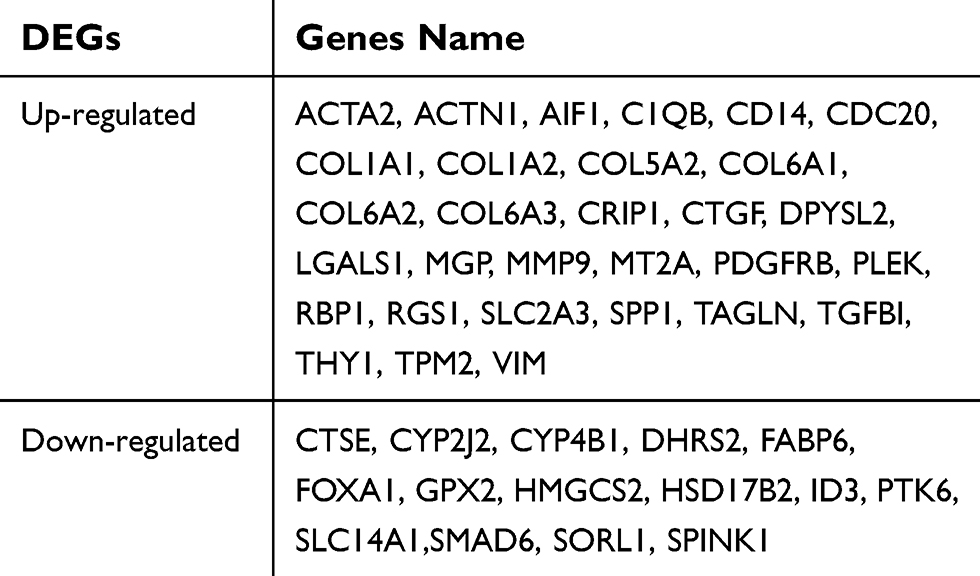 | Table 1 Forty-five DEGs were identified from GSE89, GSE13507, and GSE32548 expression profile datasets |
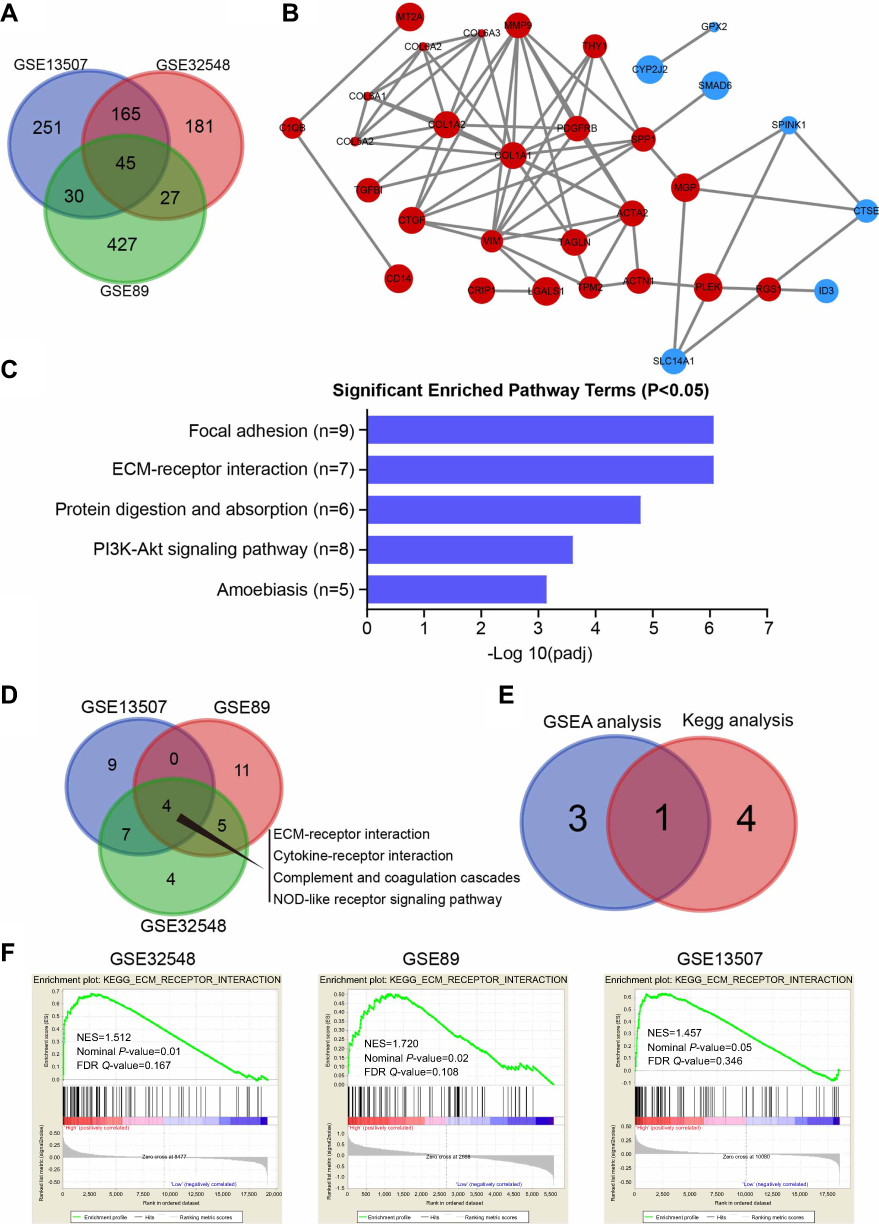 | Figure 1 The ECM-receptor interaction signal pathway may promote BCa progression. (A) Venn diagram of DEGs from the three mRNA expression profiling datasets GSE89, GSE13507, and GSE32548. (B) The protein–protein interaction (PPI) network of DEGs was constructed using the String website (available online: |
For further analyzing the candidate DEGs’ functions and pathway enrichment, both GO and KEGG analyses were conducted using DAVID. All DGEs were classified into three groups, cellular component (CC), biological processes (BP) and molecular function (MF), and the results are shown in Table 2. Specifically, regarding the cellular component (CC), the upregulated DEGs were enriched in proteinaceous extracellular matrix, extracellular exosomes, and collagen. As for biological processes (BP), the upregulated DEGs were mainly involved in extracellular matrix organization, cell adhesion, and skeletal system development. Moreover, for molecular function, the upregulated DEGs were mainly enriched in extracellular matrix structural constituent and platelet-derived growth factor binding. In addition, the downregulated DEGs were mainly enriched in steroid metabolic processes and electron carrier activity. Furthermore, KEGG pathway analysis revealed that the upregulated DEGs were mainly involved in focal adhesion and ECM-receptor interaction (Figure 1C), and both of the former two signaling pathways contained 7 common genes, COL6A1, COL6A2, COL6A3, COL5A2, COL1A1, COL1A2, and SPP1(osteopontin) (Table 3). However, the downregulated DEGs were not enriched.
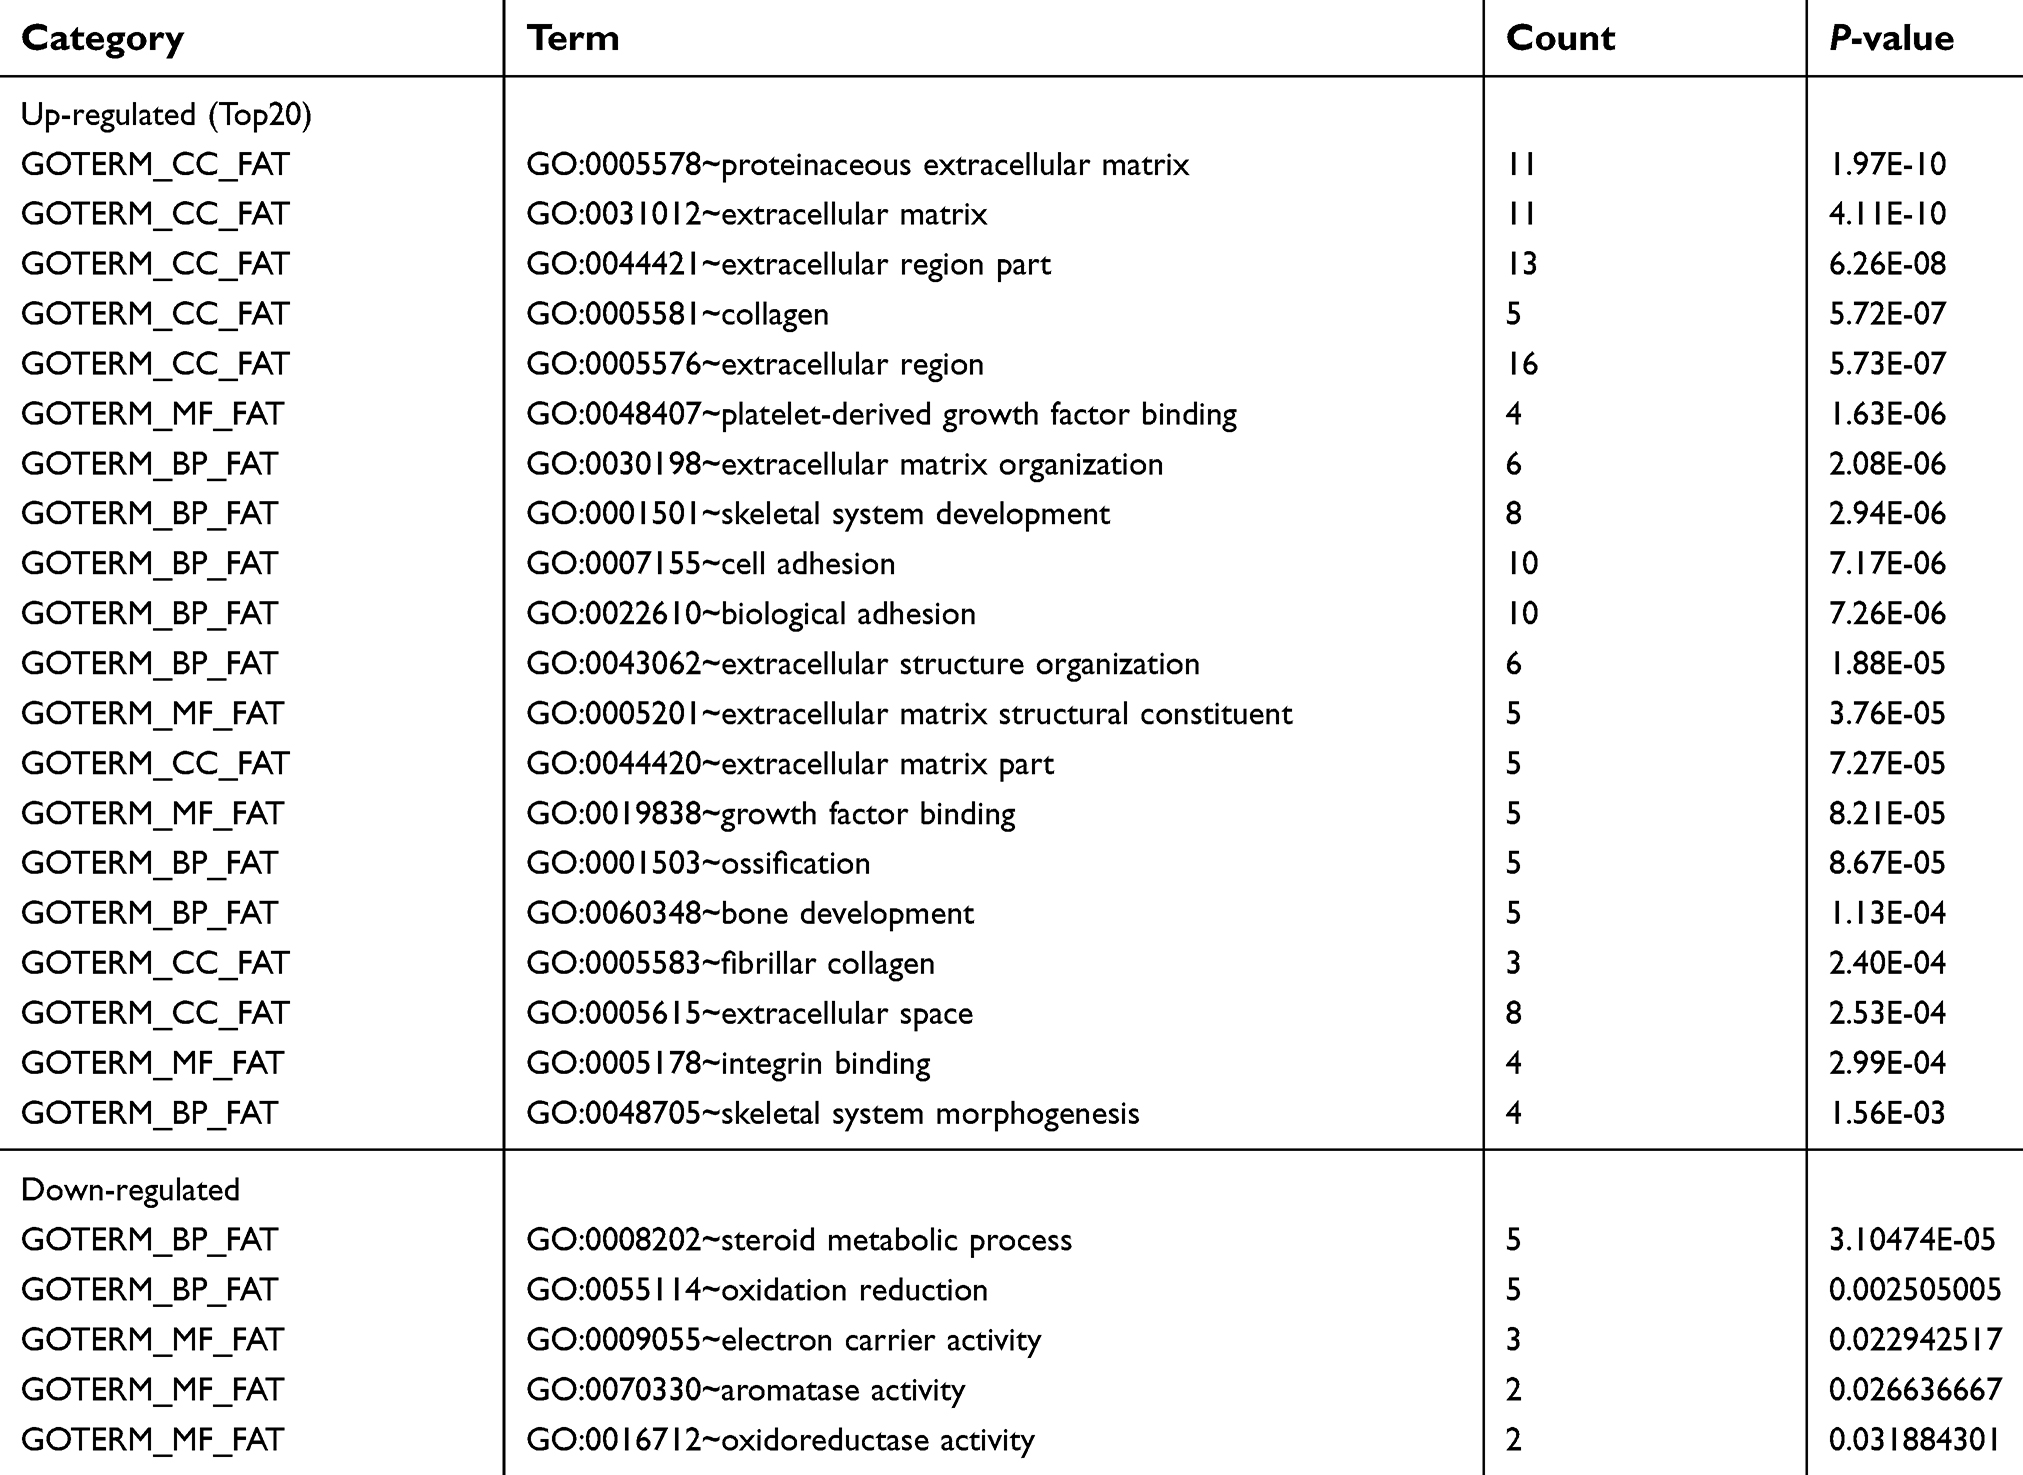 | Table 2 The significant GO terms analysis of DEGs |
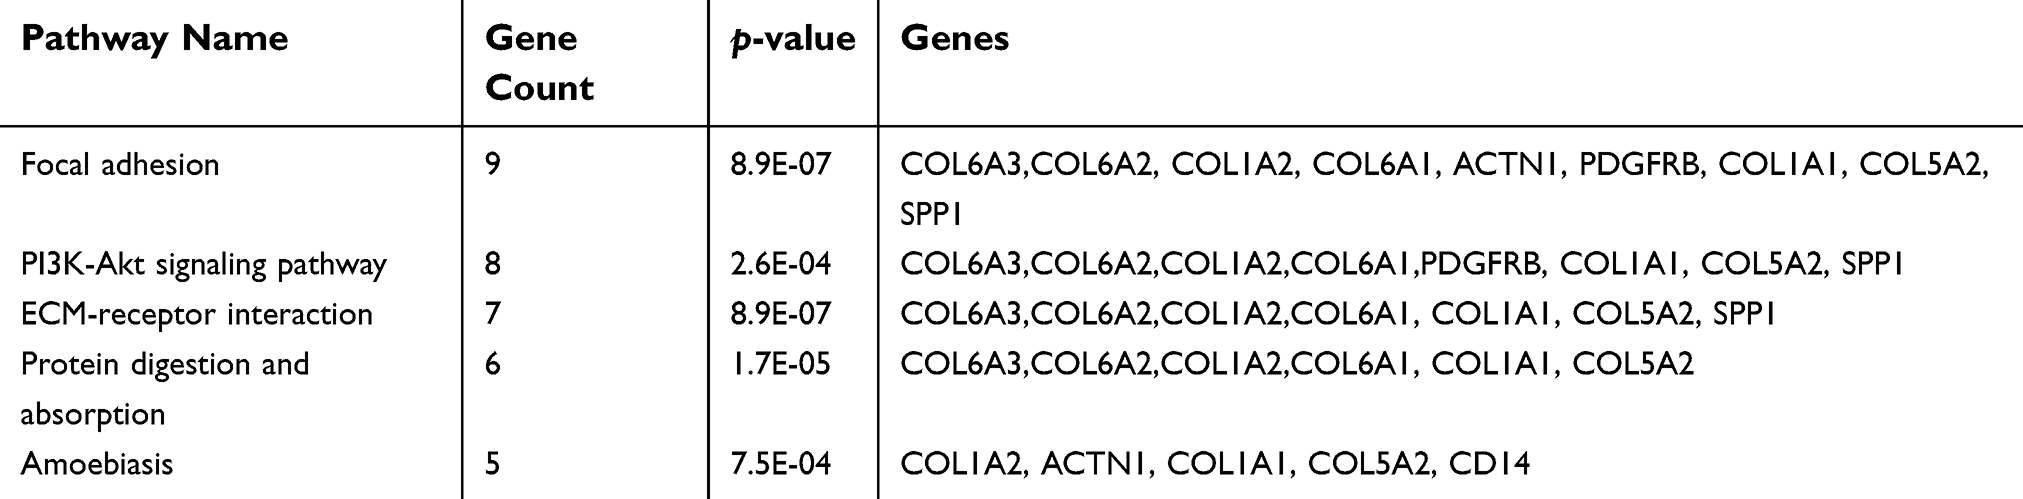 | Table 3 The significant signaling pathway enrichment analysis of DEGs functions |
To further identify signaling pathways that are obviously activated in MIBC compared to NMIBC, we performed GSEA in the three expression datasets (GSE13507, GSE32584, and GSE89). Compared to the NMIBC phenotype, the top 20 positively correlated gene signatures for NES values were enriched in MIBC. Among them, 4 gene signatures were found in all three datasets, including ECM-receptor interaction, cytokine-receptor interaction, complement, coagulation cascades and NOD-like receptor signaling pathways (Figure 1D). Among them, the ECM-receptor interaction signaling pathway was found in GSEA and KEGG analysis in common (Figure 1E). The ECM-receptor interaction signaling pathway was differentially enriched in the NMIBC phenotype based on the GSE13507, GSE32584, and GSE89 gene sets (Figure 1F and Figure S1).
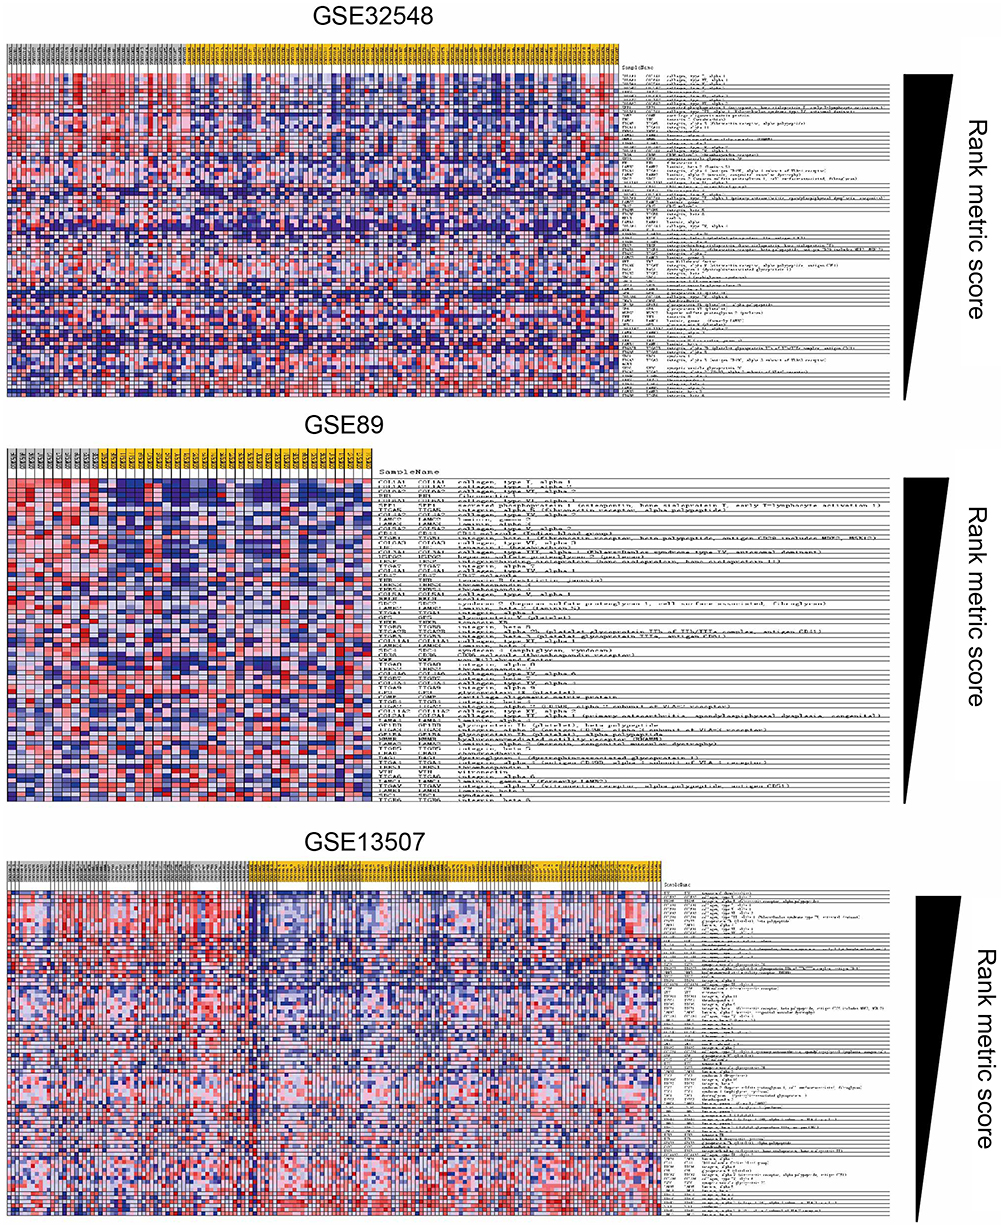 | Figure S1 Blue-pink O’gram of the ECM-receptor interaction pathway in the three datasets GSE89, GSE13507, and GSE32548. |
Over-expression of 6 collagen genes in muscle-invasive bca
Based on GSEA and KEGG analysis, we hypothesized that up-regulation of genes located in the ECM-receptor interaction signal pathway may be important in the progression of NMIBC into MIBC. In order to ascertain the roles collagen genes played and investigate whether the genes belonging to the ECM-receptor interaction signal pathway are amplified in MIBC, mRNA levels in both types of BCa were analyzed using the Oncomine database. Significantly higher mRNA levels of all 6 genes were found in MIBC tissues compared to NMIBC tissues (Figure 2A). Similarly, higher mRNA levels were also found in MIBC tissues in the Sanchez-Carbayo bladder database (Figure 2B). These observations indicate that the COL6A3, COL6A2, COL6A1, COL5A2, COL1A2, and COL1A1 genes are amplified in MIBC. Collectively, these results demonstrate that the ECM-receptor interaction signaling pathway collagen genes may be critical for BCa progression, even having the possibility of clinical treatment.
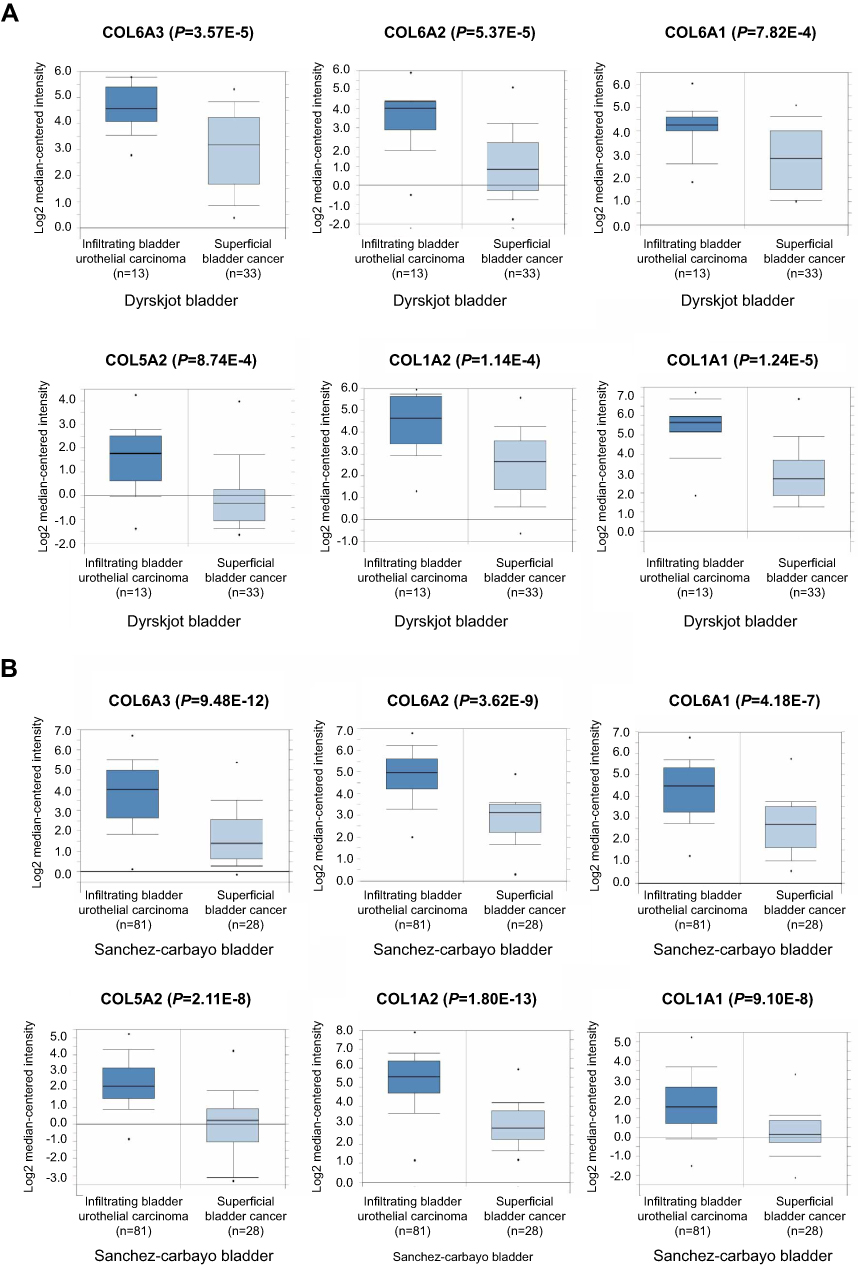 | Figure 2 Over-expression of COL6A3, COL6A2, COL6A1, COL5A2, COL1A2, and COL1A1 genes in MIBC tissues compared to NMIBC tissues. (A) COL6A3, COL6A2, COL6A1, COL5A2, COL1A2, and COL1A1 mRNA levels were up-regulated in MIBC compared to NMIBC based on the Dyrskjot bladder database from Oncomine. (B) COL6A3, COL6A2, COL6A1, COL5A2, COL1A2, and COL1A1 mRNA levels were increased in the MIBC compared to NMIBC in the Sanchez-Carbayo bladder database. |
Higher expression of 6 collagen genes involved in the ECM–receptor interaction signaling pathway promoted mortality in BCa patients
By comparing the 6 collagen gene expression levels between the MIBC and NMIBC tissues, all mRNA levels turned out to be extraordinary similar with the former exhibiting a higher level relative to the latter. This indicated that higher expression levels of the genes located in the ECM-receptor interaction signal pathway might increase the progression possibility of NMIBC into MINBC. However, correlation of the upregulation of these 6 genes with the recurrence-free survival and overall survival for BCa patients remained unclear. The results showed that the overall survival rates of BCa patients were negatively correlated with the levels of all 6 collagen genes (Figure 3A), and the same was observed for the recurrence-free survival (Figure 3B). The results showed that 6 collagen genes were negatively correlated with the prognosis of BCa patients, and may become an independent prognostic marker.
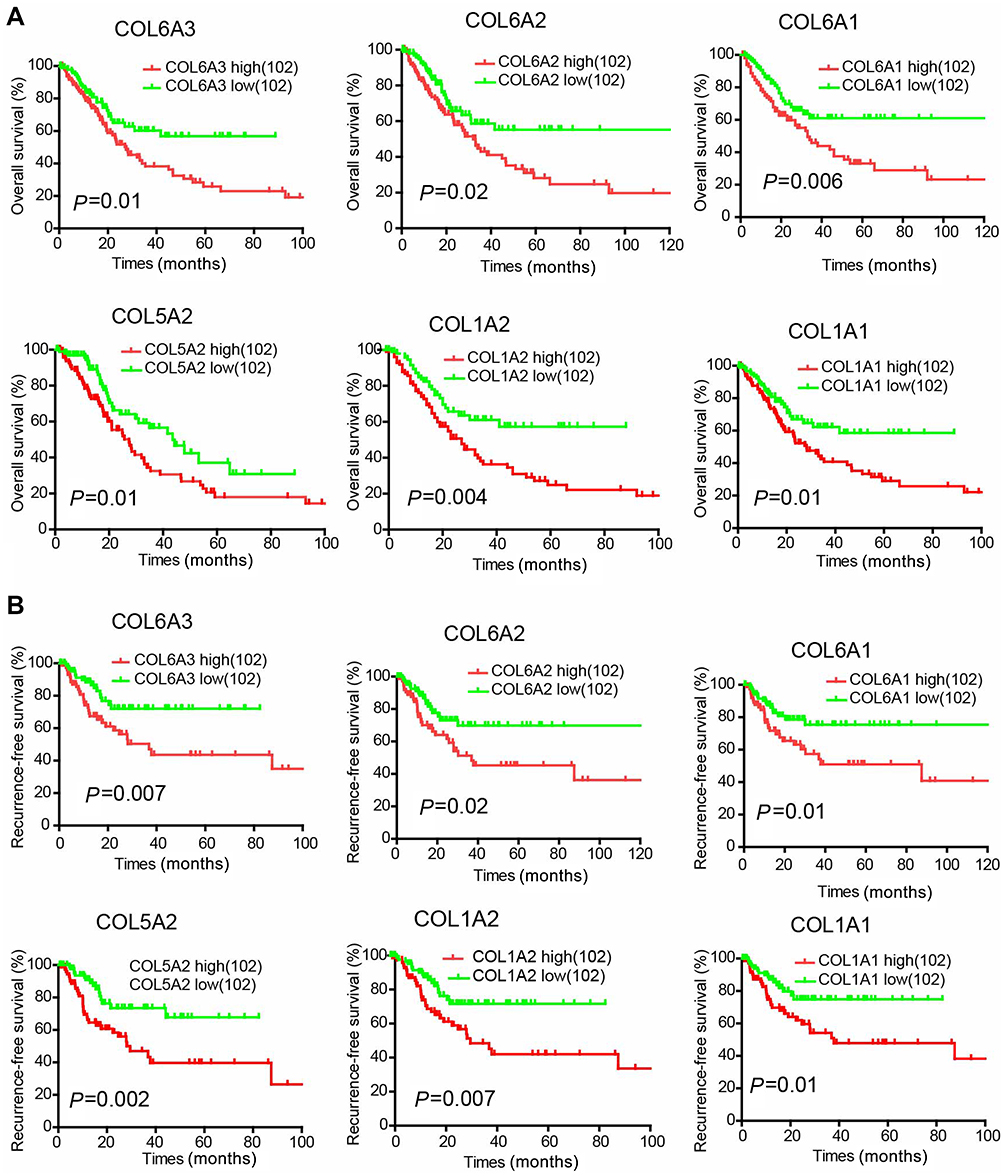 | Figure 3 Increased COL6A3, COL6A2, COL6A1, COL5A2, COL1A2 and COL1A1 mRNA levels correlate with poor survival rates in BCa patients. (A) Kaplan-Meier analysis of overall survival for BCa patients with high (the upper 25%) or low (the lower 25%) COL6A3, COL6A2, COL6A1, COL5A2, COL1A2 and COL1A1 expression (102 patients per subgroup). (B) Kaplan-Meier analysis of recurrence-free survival for BCa patients with high (the upper 25%) or low (the lower 25%) COL6A3, COL6A2, COL6A1, COL5A2, COL1A2 and COL1A1 expression (102 patients per subgroup). |
Upregulation of COL1A1 protein is positively correlated with the progression of NMIBC to MIBC
We evaluated the expression level of 6 collagen genes involved in the ECM–receptor interaction signaling pathway with GAPDH as the internal control, based on the GSE13507, GSE32584, and GSE89 gene sets. The result showed that the mRNA level of COL1A1 was the highest, relative to the other five collagen genes, in MIBC, leading us to speculate that COL1A1 plays a more key role in the progression of BCa (Figure S2). Therefore, we regard it as a future research object. To examine the role of COL1A1 in the progression of BCa, COL1A1 levels in 15 NMIBC tissues and 15 MIBC tissues were analyzed with IHC staining (Figure 4A and B). We found that 73.33% (11/15) of the MIBC tissues were stained positively forCOL1A1, including 2 cases of severely positive samples, 2 cases of moderately positive samples and 7 cases of highly positive samples but only 40.0% (6 of 15) of the NMIBC tissues were positive (Figure 4B).
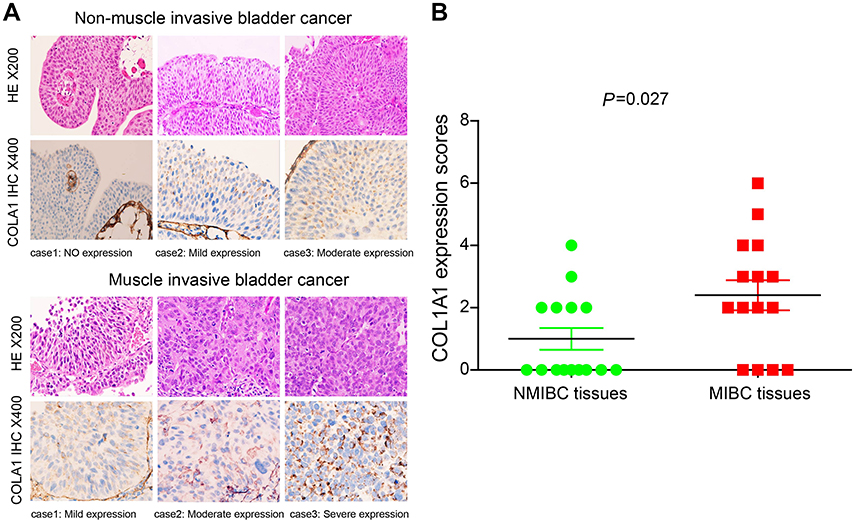 | Figure 4 Compared with NMIBC tissue samples, the COL1A1 protein was upregulated in MIBC tissue samples. (A) Representative IHC images of COL1A1 expression in the NMIBC and MIBC tissue samples. (B) Differences in COL1A1 expression scores between NMIBC tissues (n=15) and MIBC tissues (n=15) are shown as a scatter plot. |
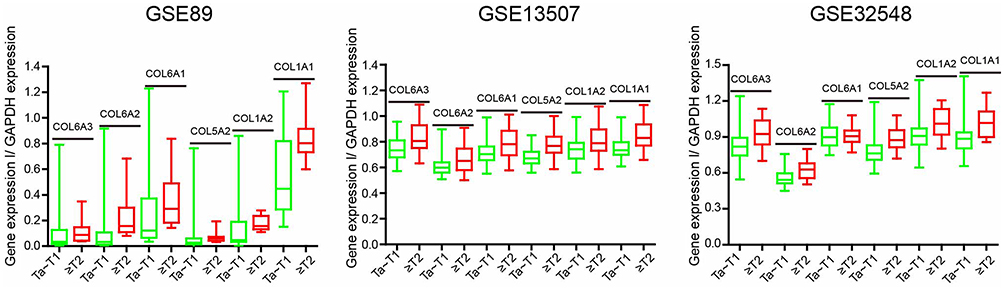 | Figure S2 Analysis of the three datasets (GSE89, GSE13507, and GSE32548) for mRNA expression levels of COL6A3, COL6A2, COL6A1, COL5A2, COL1A2 and COL1A1 in the MIBC and NMIBC samples. |
Silencing of COL1A1 inhibits both migration and invasion of tumors in vitro
Features of tumor progression generally consist of the dysregulation of cell proliferation, invasiveness, and metastasis.32,33 To further investigate the role of COL1A1 in the progression of BCa, COL1A1 was targeted with RNA interference in 5637 and T24 cells. The results showed that both mRNA and protein expression levels of COL1A1in 5637 and T24 cells were significantly reduced compared to the control groups (Figure 5A and B). We also found that silencing of COL1A1 downregulated the expression level of CD44 in both cells (Figure 5B). During tumor metastasis, epithelial-mesenchymal transition (EMT) is a key process. E-cadherin and vimentin are regarded as improtant EMT markers.34 We demonstrated that silencing COL1A1 downregulated the expression levels of E-cadherin and Vimentin. Binding of collagen to integrin is mediated by TGFBI.35 In addition, TGFBI can activate matrix metalloproteinase (MMP) secretion and promote invasion.36 We found that silencing COL1A1 down-regulated the expression levels of TGFBI and MMP9. We found that silencing COL1A1 in 5637 and T24 cells inhibited cell growth (Figure 5C and D). Silencing COL1A1 also inhibited cell colony formation in 5637 and T24 cells (Figure 5E). Silencing COL1A1 caused various degrees of reduction in both cell lines’ invasion and migration (Figure 5F). Taken together, we demonstrated that COL1A1 promotes BCa cell malignant phenotypes, which matches the poor prognosis in BCa patients.
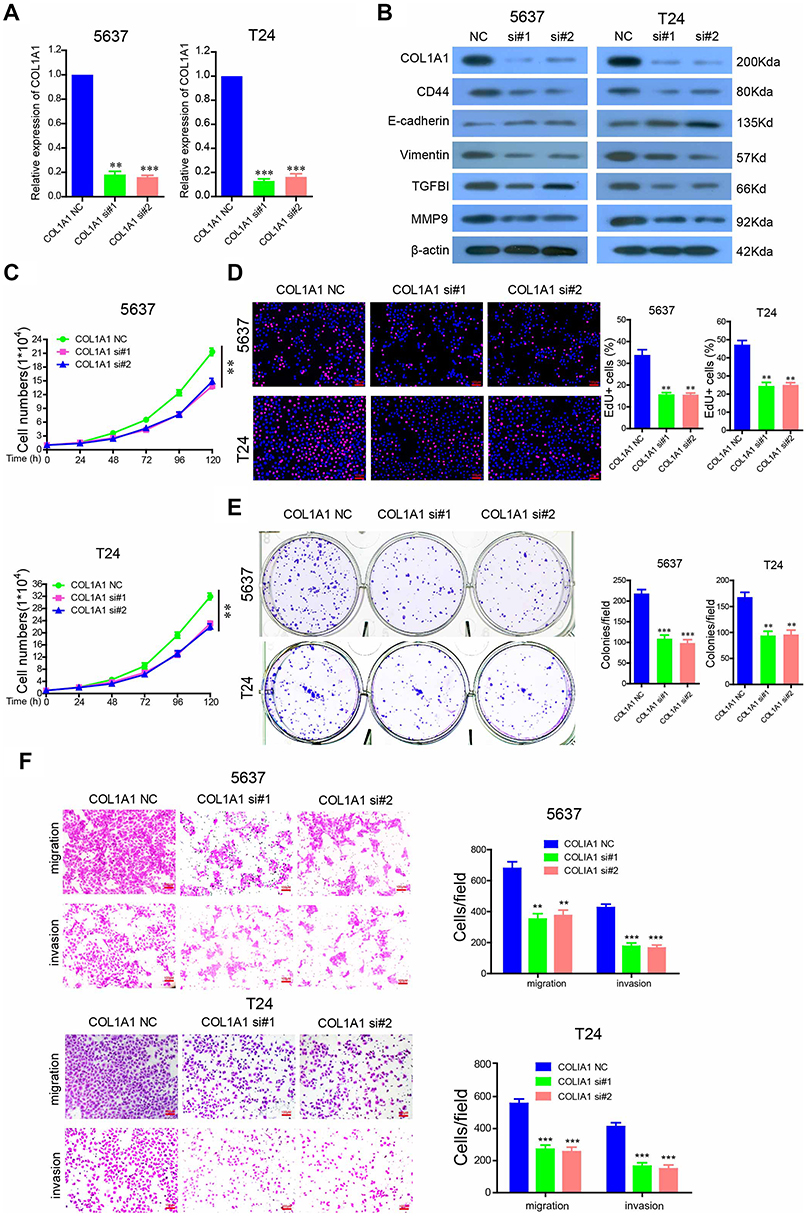 | Figure 5 COL1A1 is required for tumorigenesis and metastasis of BCa cells. (A) The mRNA levels of COL1A1 in COL1A1-silenced 5637 and T24 cells. (B) 5637 and T24 cells were transfected with 100 nM anti-COL1A1 siRNA, and the protein levels of COL1A1, CD44, E-cadherin, vimentin, Snail and TGFBI were analyzed by western blotting. (C) The effects of COL1A1 silencing on 5637 and T24 cell growth after being transfected with the indicated siRNAs for 48 h. (D) Cell proliferation was measured using EdU immunofluorescence assays in COL1A1-silenced 5637 and T24 cells.(E) Colony formation assays of COL1A1 silenced 5637 and T24 cells. (F) Migration and invasion of COL1A1-silenced 5637 and T24 cells. |
Discussion
Plenty of studies have been implemented to clarify the unique mechanisms of BCa formation and progression, whereas the clinical incidence and mortality of BCa still maintains a severe status. Since most efforts have concentrated on a individual genetic research, little attention has been paid to integrated processes for radical exploration by systematic bioinformatics methods and medical molecular biology technologies. In the present study, gene expression profiling was utilized to investigate the molecular mechanisms underlying BCa progression. A set of 30 up-regulated and 15 down-regulated DEGs were identified between the NMIBC samples and MIBC samples. Furthermore, results from the KEGG analysis and GSEA collectively focused on the ECM–receptor interaction signaling pathway. ECM, as a key component in the modulation of cancer cell invasion, is considered as necessary to maintain the integrity of the impermeable bladder surface.37 The interaction between membrane receptors of tumor cells and ECM proteins plays a crucial role in tumor invasion and metastasis.38
Collagens, major components of ECM, are involved in regulating tumor cell proliferation, migration, and invasion. COL1A1, as a major component of collagen type I, has been well-identified by researchers as an oncogene in the progression of colon cancer .39 In addition, high COL1A1 and COL1A2 mRNA expression levels are significantly associated with survival in patients with NMIBC.40 Moreover, researchers have discovered that COL3A1 is involved in many clinical diseases and that it could function as one translocation partner gene in lipomatous tumors and influence cell migration and invasion in nasopharyngeal carcinoma progression.41,42 It could also interfere with malignant development in renal cell carcinoma and act as one of the etiologically linked genes in aortic dissected aneurysm.43 COL5A2 is also widely studied, and previous evidence indicated that COL5A2 might be associated with the pathological processes of several human cancers. For example, the expression of COL5A2 was determine to be up-regulated in invasive breast cancer compared with ductal carcinoma in situ, indicating that COL5A2 is related to tumor progression in breast cancer.44 COL5A2 is also considered as a diagnostic marker for osteosarcoma and might affect the growth of BC cells by ECM remodeling.45 COL6A1, an oncogene in the progression of cervical cancer, is highly correlated with poor prognosis in cervical cancer patients.46 In this study, we demonstrated upregulation of the ECM–receptor interaction signaling pathway by 6 collagen genes, COL1A1, COL1A2, COL5A2, COL6A1, COL6A2, and COL6A3, favoring NMIBC progression to MIBC. Our data reveal that the expression of the 6 collagen genes was highly correlated with high pathological stages, poor recurrence-free survival rates, and poor overall survival rates. These findings indicated the potentially important roles of 6 collagen genes in the diagnosis and prognosis of BCa patients. It has been reported that constitutive expression of SPP1 is involved in tumorigenesis and metastasis of BCa.47 We also found that higher expression of SPP1 was involved in the ECM–receptor interaction signaling pathway and was highly correlated with poor pathological stages of BCa and poor survival rates of patients with BCa (Figure S3).
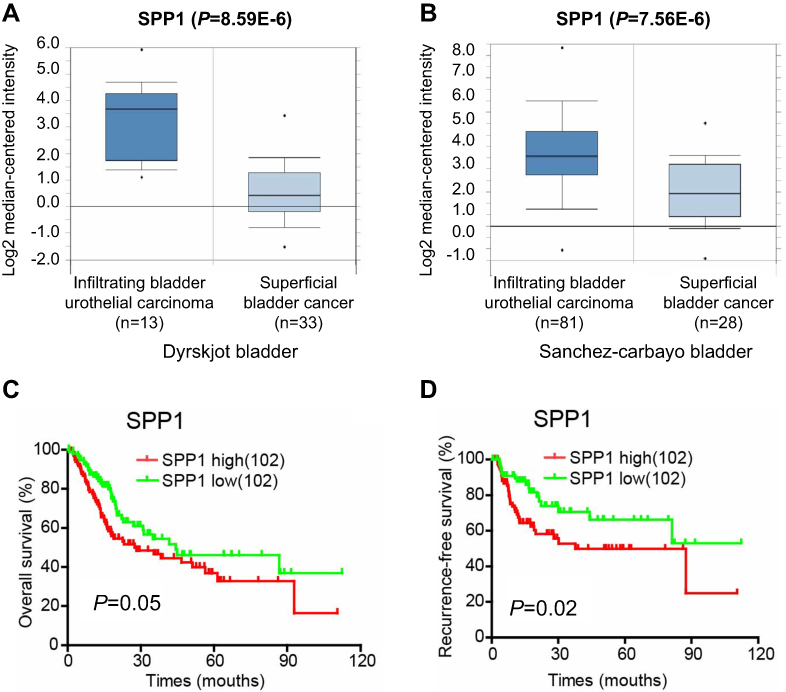 | Figure S3 SPP1 was highly correlated with poor pathological stages of BCa and poor survival rates. (A and B) The mRNA levels of SPP1 were upregulated in MIBC compared to NMIBC by analyzing the Dyrskjot and the Sanchez-Carbayo bladder databases from Oncomine. (C and D) Kaplan-Meier analysis of overall survival and recurrence-free survival for BCa patients with high (the upper 25%) or low (the lower 25%) SPP1 expression (102 patients per subgroup). |
To further explore the function and mechanism of collagen genes in promoting bladder cancer progression, we used COL1A1 as a further research object. The results showed that the suppression of COL1A1 decreased the growth, migration, and invasion of BCa cells. CD44 plays an important role in the ECM-receptor interaction signal pathway and is evidently increased in tumor cells cultured in 3D collagen scaffolds.48,49 Our results showed that COL1A1 knockdown inhibited the expression of CD44. COL1A1 is closely related to EMT and the transforming growth factor β (TGF-β, a common stimulator of EMT) pathway. COL1A1 directly stimulates EMT of pancreatic,50 lung,51 and breast52 carcinoma cells via TGF-β signaling. TGFBI, which is induced by TGF-β1 protein, is an ECM protein that activates matrix metalloproteinase (MMP) secretion. Logan A. et al showed that inhibiting the expression of COL1A1 with siRNA inhibited EMT and cell migration induced by TGF-β1in HK-2 cells. EMT is characterized by changes in the expression of biochemical markers, a decrease in epithelial markers like E-cadherin and an increase in mesenchymal markers such as vimentin and N-cadherin.34 First, we discovered that COL1A1 is a key effector of CD44 in the regulation of BCa progression. Further, we found that inhibiting the expression of COL1A1 activated the transcription of E-cadherin and inhibited the expression of vimentin. Finally, we determined that inhibiting the expression of COL1A1 also inhibited the expression of TGFBI and MMP9. Therefore, we believe that COL1A1 is an important EMT mediator and effector of TGF-β-induced expression via interacting with CD44 in BCa progression. Interestingly, vimentin, TGFBI, and MMP9 are also significantly upregulated DEGs. These data are mutually confirmed with the results of our cellular experiments. Meanwhile, relevant studies have shown that other collagen genes, such as COL1A2, COL5A2, and COL6A3, are important EMT mediators.53–55
Our findings provide novel insights into NMIBC progression to MIBC. In summary, the present study determined gene expression profiles and identified 6 collagen proreins(COL1A1, COL1A2, COL5A2, COL6A1, COL6A2, and COL6A3) involved in the ECM–receptor interaction signaling pathway in BCa progression. The 6 collagen genes can be used as independent effective prognostic biomarkers for BCa. In addition, the 6 collagen genes may be an independent potential indicator of whether NMIBC patients need further treatment after surgery to prevent the recurrence and progression of the disease.
Abbreviation list
Bca, Bladder cancer; DEGs, Differently expressed genes; NMIBC, Non-muscle-invasive bladder cancer; MIBC, Muscle-invasive bladder cancer; EMT, Epithelial-mesenchymal transition.
Acknowledgments
This work was supported by the Third Affiliated Hospital of Guangzhou Medical University Youth fund (grant no.2014Y10).
Disclosure
The authors declare no conflicts of interest in this work.
References
1. Cancer Facts & Figures 2016 [Internet]. Atlanta (GA): American Cancer Society; 2016. [
2. Li HT, Duymich CE, Weisenberger DJ, Liang G. Genetic and epigenetic alterations in bladder cancer. Int Neurourol J. 2016;20(Suppl 2):S84–94. doi:10.5213/inj.1632752.376
3. Lee JS, Leem SH, Lee SY, et al. Expression signature of E2F1 and its associated genes predict superficial to invasive progression of bladder tumors. J Clin Oncol. 2010;28(16):2660–2667. doi:10.1200/JCO.2009.25.0977
4. Kamat AM, Hahn NM, Efstathiou JA, et al. Bladder cancer. The Lancet. 2016;388(10061):2796–2810. doi:10.1016/S0140-6736(16)30512-8
5. Vartolomei MD, Ferro M, Cantiello F, et al. Validation of neutrophil-to-lymphocyte ratio in a multi-institutional cohort of patients with T1G3 non-muscle-invasive bladder cancer. Clin Genitourin Cancer. 2018;16(6):445–452. doi:10.1016/j.clgc.2018.07.003
6. Ferro M, Di Lorenzo G, Buonerba C, et al. Predictors of residual T1 high grade on re-transurethral resection in a large multi-institutional cohort of patients with primary T1 high-grade/grade 3 bladder cancer. J Cancer. 2018;9(22):4250–4254. doi:10.7150/jca.26129
7. Ferro M, Vartolomei MD, Russo GI, et al. An increased body mass index is associated with a worse prognosis in patients administered BCG immunotherapy for T1 bladder cancer. World J Urol. 2019;37(3):507–514. doi:10.1007/s00345-018-2397-1
8. Ferro M, Vartolomei MD, Cantiello F, et al. High-grade T1 on re-transurethral resection after initial high-grade T1 confers worse oncological outcomes: results of a multi-institutional study. Urol Int. 2018;101(1):7–15. doi:10.1159/000490765
9. Eich ML, Dyrskjøt L, Netto GJ. Toward personalized management in bladder cancer: the promise of novel molecular taxonomy. Virchows Arch. 2017;471(24):1–10. doi:10.1007/s00428-017-2119-x
10. Bassi PF, Volpe A, D‘Agostino D, et al. Paclitaxel-hyaluronic acid for intravesical therapy of bacillus calmette-guerin refractory carcinoma in situ of the bladder: results of a phase I study. J Urol. 2011;185(2):445–449. doi:10.1016/j.juro.2010.09.073
11. Rosato A, Banzato A, De Luca G, et al. HYTAD1-p20: a new paclitaxel-hyaluronic acid hydrosoluble bioconjugate for treatment of superficial bladder cancer. Urol Oncol. 2006;24(3):207–215. doi:10.1016/j.urolonc.2005.08.020
12. Ferro M, Giuberti G, Zappavigna S, et al. Chondroitin sulphate enhances the antitumor activity of gemcitabine and mitomycin-C in bladder cancer cells with different mechanisms. Oncol Rep. 2012;27(2):409–415. doi:10.3892/or.2011.1526
13. Li T, Xu K, Liu Y. Anticancer effect of salidroside reduces viability through autophagy/PI3K/Akt and MMP-9 signaling pathways in human bladder cancer cells. Oncol Lett. 2018;16(3):3162–3168. doi:10.3892/ol.2018.8982
14. Beisser D, Klau GW, Dandekar T, Muller T, Dittrich MT. BioNet: an R-Package for the functional analysis of biological networks. Bioinformatics. 2010;26(8):1129–1130. doi:10.1093/bioinformatics/btq089
15. Rothman N, Garcia-Closas M, Chatterjee N, et al. A multi-stage genome-wide association study of bladder cancer identifies multiple susceptibility loci. Nat Genet. 2010;42(11):978–984. doi:10.1038/ng.687
16. Inamura K. Bladder cancer: new insights into its molecular pathology. Cancers. 2018;10(4). doi:10.3390/cancers10110400
17. Venning FA, Wullkopf L, Erler JT. Targeting ECM disrupts cancer progression. Front Oncol. 2015;5:224. doi:10.3389/fonc.2015.00224
18. Malandrino A, Mak M, Kamm RD, Moeendarbary E. Complex mechanics of the heterogeneous extracellular matrix in cancer. Extreme Mech Lett. 2018;21:25–34. doi:10.1016/j.eml.2018.02.003
19. Hynes RO, Naba A. Overview of the matrisome–an inventory of extracellular matrix constituents and functions. Cold Spring Harb Perspect Biol. 2012;4(1):a004903. doi:10.1101/cshperspect.a004903
20. Xu R, Boudreau A, Bissell MJ. Tissue architecture and function: dynamic reciprocity via extra- and intra-cellular matrices. Cancer Metastasis Rev. 2009;28(1–2):167–176. doi:10.1007/s10555-008-9178-z
21. Zhu J, Xiong G, Trinkle C, Xu R. Integrated extracellular matrix signaling in mammary gland development and breast cancer progression. Histol Histopathol. 2014;29(9):1083–1092. doi:10.14670/HH-29.1083
22. Gomezcontreras PC, Domann FE, Weigel RJ, Lal G. Extracellular matrix 1 (ECM1) knockdown alters cellular characteristics, CD44 expression and other metastasis associated genes in breast cancer cells. Cancer Res. 2013;73(24Supplement):
23. Gupta RA, Shah N, Wang KC, et al. Long non-coding RNA HOTAIR reprograms chromatin state to promote cancer metastasis. Nature. 2010;464(7291):1071–1076. doi:10.1038/nature08975
24. Yang J, Sung E, Donlin-Asp PG, Corces VG. A subset of drosophila myc sites remain associated with mitotic chromosomes colocalized with insulator proteins. Nat Commun. 2013;4:1464. doi:10.1038/ncomms2469
25. Dyrskjot L, Thykjaer T, Kruhoffer M, et al. Identifying distinct classes of bladder carcinoma using microarrays. Nat Genet. 2003;33(1):90–96. doi:10.1038/ng1061
26. Franceschini A, Szklarczyk D, Frankild S, et al. STRING v9.1: protein-protein interaction networks, with increased coverage and integration. Nucleic Acids Res. 2013;41(Databaseissue):D808–815. doi:10.1093/nar/gks1094
27. Saito R, Smoot ME, Ono K, et al. A travel guide to Cytoscape plugins. Nat Methods. 2012;9(11):1069–1076. doi:10.1038/nmeth.2212
28.
29. Subramanian A, Tamayo P, Mootha VK, et al. Gene set enrichment analysis: a knowledge-based approach for interpreting genome-wide expression profiles. Proc Natl Acad Sci U S A. 2005;102(43):15545–15550. doi:10.1073/pnas.0506580102
30. Chen R, Zhang M, Li Q, et al. Retraction: the Epstein-Barr Virus-encoded miR-BART22 targets MAP3K5 to promote host cell proliferative and invasive abilities in nasopharyngeal carcinoma. J Cancer. 2017;8(16):3130. doi:10.7150/jca.22507
31. Zhao C, Chen X, Zang D, et al. A novel nickel complex works as a proteasomal deubiquitinase inhibitor for cancer therapy. Oncogene. 2016;35(45):5916–5927. doi:10.1038/onc.2016.114
32. Jiang L, Yu L, Zhang X, et al. miR-892b silencing activates NF-kappaB and promotes aggressiveness in breast cancer. Cancer Res. 2016;76(5):1101–1111. doi:10.1158/0008-5472.CAN-15-1770
33. Zheng LL, Li JH, Wu J, et al. deepBase v2.0: identification, expression, evolution and function of small RNAs, LncRNAs and circular RNAs from deep-sequencing data. Nucleic Acids Res. 2016;44(D1):D196–D202. doi:10.1093/nar/gkv1273
34. Dong C, Yuan T, Wu Y, et al. Loss of FBP1 by Snail-mediated repression provides metabolic advantages in basal-like breast cancer. Cancer Cell. 2013;23(3):316–331. doi:10.1016/j.ccr.2013.01.022
35. Kim JE, Kim SJ, Lee BH, Park RW, Kim KS, Kim IS. Identification of motifs for cell adhesion within the repeated domains of transforming growth factor-beta-induced gene, betaig-h3. J Biol Chem. 2000;275(40):30907–30915. doi:10.1074/jbc.M002752200
36. Shang D, Song B, Liu Y. Epirubicin suppresses proliferative and metastatic potential by downregulating transforming growth factor-beta-induced expression in urothelial carcinoma. Cancer Sci. 2018;109(4):980–987. doi:10.1111/cas.13403
37. Wilson CB, Leopard J, Cheresh DA, Nakamura RM. Extracellular matrix and integrin composition of the normal bladder wall. World J Urol. 1996;14(Suppl 1):S30–S37.
38. Guiet R, Van Goethem E, Cougoule C, et al. The process of macrophage migration promotes matrix metalloproteinase-independent invasion by tumor cells. J Immunol. 2011;187(7):3806–3814. doi:10.4049/jimmunol.1101245
39. Zou X, Feng B, Dong T, et al. Up-regulation of type I collagen during tumorigenesis of colorectal cancer revealed by quantitative proteomic analysis. J Proteomics. 2013;94:473–485. doi:10.1016/j.jprot.2013.10.020
40. Brooks M, Mo Q, Krasnow R, et al. Positive association of collagen type I with non-muscle invasive bladder cancer progression. Oncotarget. 2016;7(50):82609–82619. doi:10.18632/oncotarget.12089
41. Yoshida H, Miyachi M, Ouchi K, et al. Identification of COL3A1 and RAB2A as novel translocation partner genes of PLAG1 in lipoblastoma. Genes Chromosomes Cancer. 2014;53(7):606–611. doi:10.1002/gcc.22170
42. Qiu F, Sun R, Deng N, et al. miR-29a/b enhances cell migration and invasion in nasopharyngeal carcinoma progression by regulating SPARC and COL3A1 gene expression. PLoS One. 2015;10(3):e0120969. doi:10.1371/journal.pone.0120969
43. Su B, Zhao W, Shi B, et al. Let-7d suppresses growth, metastasis, and tumor macrophage infiltration in renal cell carcinoma by targeting COL3A1 and CCL7. Mol Cancer. 2014;13:206. doi:10.1186/1476-4598-13-206
44. Vargas AC, McCart Reed AE, Waddell N, et al. Gene expression profiling of tumour epithelial and stromal compartments during breast cancer progression. Breast Cancer Res Treat. 2012;135(1):153–165. doi:10.1007/s10549-012-2123-4
45. Zeng XT, Liu XP, Liu TZ, Wang XH. The clinical significance of COL5A2 in patients with bladder cancer: A retrospective analysis of bladder cancer gene expression data. Medicine. 2018;97(10):e0091. doi:10.1097/MD.0000000000010091
46. Hou T, Tong C, Kazobinka G, et al. Expression of COL6A1 predicts prognosis in cervical cancer patients. Am J Transl Res. 2016;8(6):2838–2844.
47. Pignot G, Vieillefond A, Vacher S, et al. Hedgehog pathway activation in human transitional cell carcinoma of the bladder. Br J Cancer. 2012;106(6):1177–1186. doi:10.1038/bjc.2012.55
48. Chen L, Xiao Z, Meng Y, et al. The enhancement of cancer stem cell properties of MCF-7 cells in 3D collagen scaffolds for modeling of cancer and anti-cancer drugs. Biomaterials. 2012;33(5):1437–1444. doi:10.1016/j.biomaterials.2011.10.056
49. Sapudom J, Ullm F, Martin S, et al. Molecular weight specific impact of soluble and immobilized hyaluronan on CD44 expressing melanoma cells in 3D collagen matrices. Acta Biomater. 2017;50:259–270. doi:10.1016/j.actbio.2016.12.026
50. Imamichi Y, Konig A, Gress T, Menke A. Collagen type I-induced Smad-interacting protein 1 expression downregulates E-cadherin in pancreatic cancer. Oncogene. 2007;26(16):2381–2385. doi:10.1038/sj.onc.1210012
51. Shintani Y, Maeda M, Chaika N, Johnson KR, Wheelock MJ. Collagen I promotes epithelial-to-mesenchymal transition in lung cancer cells via transforming growth factor-beta signaling. Am J Respir Cell Mol Biol. 2008;38(1):95–104. doi:10.1165/rcmb.2007-0071OC
52. Gilles C, Polette M, Seiki M, Birembaut P, Thompson EW. Implication of collagen type I-induced membrane-type 1-matrix metalloproteinase expression and matrix metalloproteinase-2 activation in the metastatic progression of breast carcinoma. Lab Invest. 1997;76(5):651–660.
53. Huang Y, Li G, Wang K, et al. Collagen type VI alpha 3 chain promotes epithelial-mesenchymal transition in bladder cancer cells via Transforming Growth Factor beta (TGF-beta)/smad pathway. Med Sci Monit. 2018;24:5346–5354. doi:10.12659/MSM.909811
54. Sonnylal S, Xu S, Jones H, et al. Connective tissue growth factor causes EMT-like cell fate changes in vivo and in vitro. J Cell Sci. 2013;126(Pt 10):2164–2175. doi:10.1242/jcs.111302
55. Shi JW, Liu W, Zhang TT, et al. The enforced expression of c-Myc in pig fibroblasts triggers mesenchymal-epithelial transition (MET) via F-actin reorganization and RhoA/Rock pathway inactivation. Cell Cycle. 2013;12(7):1119–1127. doi:10.4161/cc.24164
Supplementary material
 © 2019 The Author(s). This work is published and licensed by Dove Medical Press Limited. The
full terms of this license are available at https://www.dovepress.com/terms
and incorporate the Creative Commons Attribution
- Non Commercial (unported, 3.0) License.
By accessing the work you hereby accept the Terms. Non-commercial uses of the work are permitted
without any further permission from Dove Medical Press Limited, provided the work is properly
attributed. For permission for commercial use of this work, please see paragraphs 4.2 and 5 of our Terms.
© 2019 The Author(s). This work is published and licensed by Dove Medical Press Limited. The
full terms of this license are available at https://www.dovepress.com/terms
and incorporate the Creative Commons Attribution
- Non Commercial (unported, 3.0) License.
By accessing the work you hereby accept the Terms. Non-commercial uses of the work are permitted
without any further permission from Dove Medical Press Limited, provided the work is properly
attributed. For permission for commercial use of this work, please see paragraphs 4.2 and 5 of our Terms.