
Back to Journals » International Journal of Nanomedicine » Volume 20
CoFe2O4-Based Multifunctional Nanozymes Remodel Tumor Redox Balance for Enhanced Osteosarcoma Treatment
Authors Yang Y, Gu H, Qin S, Liu J, Xue J, Hu Y, Xue Q, Liu X
Received 25 July 2025
Accepted for publication 7 November 2025
Published 14 November 2025 Volume 2025:20 Pages 13741—13758
DOI https://doi.org/10.2147/IJN.S556295
Checked for plagiarism Yes
Review by Single anonymous peer review
Peer reviewer comments 4
Editor who approved publication: Professor Lijie Grace Zhang
Yang Yang,1,2,* Hongmei Gu,3,* Shuheng Qin,4,* Jiajia Liu,2 Jianhua Xue,2 Yong Hu,4 Qiang Xue,3 Xianchen Liu3
1Department of Emergency Medicine, Affiliated Hospital of Nantong University, Nantong, Jiangsu, 226001, People’s Republic of China; 2Department of Chemistry, School of Science, China Pharmaceutical University, Nanjing, Jiangsu, 226001, People’s Republic of China; 3Department of Radiation Oncology, Affiliated Hospital of Nantong University, Nantong, Jiangsu, 226001, People’s Republic of China; 4College of Engineering and Applied Sciences, Nanjing University, Nanjing, 210023, People’s Republic of China
*These authors contributed equally to this work
Correspondence: Xianchen Liu, Email [email protected] Qiang Xue, Email [email protected]
Background: Developing nanodrugs with passive targeting capabilities that can effectively overcome the oxidative-redox homeostasis-inhibiting microenvironment of tumors offers new insights into the precise treatment of osteosarcoma.
Methods: CoFe2O4 nanoparticles were synthesized via the hydrothermal method and modified with polyethylene glycol 4000 on their surface, obtaining CF@P nanozymes with multi-catalytic activities similar to catalase (CAT), peroxidase (POD), oxidase (OD), and glutathione peroxidase (GPx). These nanozymes could overcome the hypoxic microenvironment and redox homeostasis in osteosarcoma treatment.
Results: CF@P has a size of approximately 100 nm and can stably exist under physiological conditions. It exhibits excellent photothermal effects under near-infrared II (1064 nm) laser irradiation, synergistically enhancing its catalytic activity. CF@P alleviates hypoxia by decomposing endogenous H2O2 within tumors to generate oxygen and hydroxyl radicals (·OH). Meanwhile, it consumes reduced glutathione (GSH) within tumors, inducing ferroptosis and apoptosis. CF@P exhibits low toxicity to normal cells (HUVEC) and selective killing ability against osteosarcoma cells (U2OS). In vivo, it accumulates in tumor tissues via the enhanced permeability and retention (EPR) effect, significantly inhibiting tumor growth in combination with photothermal therapy without causing significant organ toxicity, thereby prolonging the survival of tumor-bearing mice.
Conclusion: The CF@P nanozyme integrates the properties of multi-enzyme catalysis and photothermal therapy, disrupting the oxidative-redox homeostasis of tumor tissues, generating highly toxic hydroxyl radicals, and efficiently inducing apoptosis in osteosarcoma cells. This approach provides a new, efficient, and safe strategy for the precise treatment of hypoxic solid tumors like osteosarcoma.
Keywords: cobalt ferrite (CoFe2O4), nanozyme, reactive oxygen species, photothermal effect, osteosarcoma
Introduction
Osteosarcoma is a highly aggressive primary malignant bone tumor that predominantly affects adolescents during periods of rapid skeletal growth.1–3 Despite significant advancements in surgical resection combined with chemotherapy for osteosarcoma treatment in recent years, the prognosis for patients remains unsatisfactory. This is primarily attributed to the high concentrations of endogenous hydrogen peroxide (H2O2), acidic conditions, and hypoxic microenvironments within tumor tissues, which severely limit the efficacy of conventional chemotherapy, photodynamic therapy, and radiotherapy.4,5 Furthermore, the high heterogeneity, propensity for metastasis, and recurrence of osteosarcoma further exacerbate the challenges associated with treatment.6 Current research on the molecular mechanisms of osteosarcoma remains insufficient, particularly regarding the role of the IL-1β–NF-κB signaling pathway in osteosarcoma carcinogenesis.7 Previous studies have shown that IL-1β can downregulate miR-506 by activating NF-κB, thereby promoting tumor cell proliferation and malignant progression, suggesting that inflammation-related pathways may play a critical role in the development of osteosarcoma. Therefore, the development of novel therapeutic strategies with targeting capabilities that can effectively overcome the immunosuppressive tumor microenvironment has become an urgent need in osteosarcoma treatment.
The advancement of nanomedicine offers new opportunities for the precise treatment of malignant tumors.8 Although targeted therapy methods are better than passive targeted therapy with multifunctional nanoparticles, they also face many problems.9 Due to their unique size effects, nanodrugs can passively accumulate in tumor tissues through the enhanced EPR effect. Additionally, they can achieve active targeting by surface modification with specific ligands or responsive functional groups, thereby overcoming tumor heterogeneity, improving drug efficacy, and reducing systemic toxicity.10,11 In recent years, researchers have developed various intelligent nanodrugs capable of responding to and modulating the tumor microenvironment (TME) to address the immunosuppressive conditions.12 Among these, nanozyme materials with multiple catalytic activities, such as POD, CAT, and OD, have garnered significant attention.13,14 These nanozymes can catalyze the conversion of highly expressed H2O2 in tumor tissues into highly toxic ·OH, triggering lipid peroxidation and other reactions that induce ferroptosis in tumor cells, thereby achieving chemodynamic therapy (CDT). The CDT strategy based on reactive oxygen species (ROS) has demonstrated tremendous potential in osteosarcoma treatment.15–17
ROS-regulated cell death pathways, including autophagy-dependent ferroptosis, play critical roles in osteosarcoma by enhancing antitumor immunity and overcoming chemoresistance, underscoring the therapeutic potential of precisely controlled ROS generation. More intriguingly, the introduction of high-oxidation-state metal ions (eg, Fe3⁺) into nanozymes can confer them with glutathione peroxidase (GPx)-like activity, enabling efficient consumption of the highly expressed reduced GSH within tumor cells. As a key intracellular antioxidant, the depletion of GSH prevents its scavenging of therapeutic ROS, thereby significantly enhancing the efficacy of CDT.18
Cobalt ferrite (CoFe2O4), a transition metal oxide, is widely used in environmental catalysis and energy conversion due to its excellent redox properties, making it an ideal candidate material for nanozymes.19,20 Iron (Fe) and cobalt (Co), as essential elements for the human body (involved in hemoglobin and vitamin B12 synthesis, respectively), exhibit good biocompatibility, suggesting the potential of CoFe2O4 for tumor CDT.21–23 In this study, we synthesized CoFe2O4 nanoparticles (CF NPs) via the hydrothermal method and modified their surfaces with PEG4000 to enhance their stability and dispersibility in physiological environments, obtaining CF@P nanozymes (CF@P NPs) with multiple enzymatic activities (Scheme 1A). In both in vitro cellular experiments and in vivo antitumor studies, the CF@P nanozymes exhibited multiple catalytic activities: (1) POD-like and OD-like activities: catalyzing the generation of ·OH and O2•− from H2O2, respectively, inducing strong cellular oxidative stress and apoptosis; (2) GPx-like activity: consuming intracellular GSH and disrupting cellular redox homeostasis; (3) CAT-like activity: decomposing endogenous H2O2 into O2, effectively alleviating the hypoxic microenvironment within tumors, providing substrates for continuous ROS generation, and potentially enhancing the efficacy of other oxygen-dependent therapies.24 Additionally, the CF@P nanozymes demonstrated excellent photothermal conversion performance under near-infrared II (NIR,1064 nm) laser irradiation. This property not only enables photothermal therapy but also generates localized hyperthermia at the tumor site, accelerating electron transfer processes within the CF@P nanozymes and synergistically enhancing their catalytic activity, thereby effectively augmenting their in vivo antitumor effects (Scheme 1B).
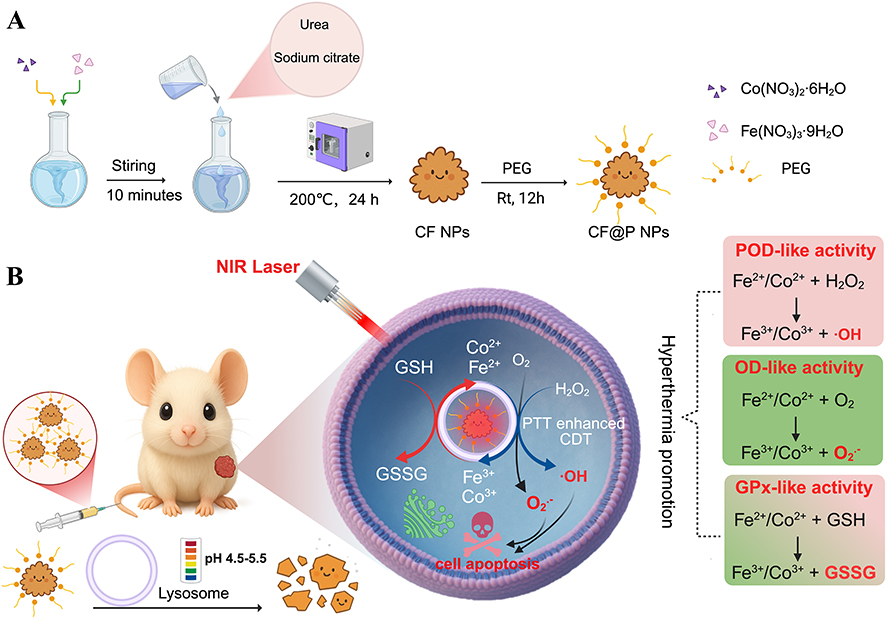 |
Scheme 1 Photothermally accelerated treatment of osteosarcoma with CF@P nanozymes. (A) Schematic diagram of the synthesis routine of CF@P NPs. (B) The anti-tumor mechanism of photothermally enhanced CF@P-mediated enzymatic CDT. |
The CF@P nanozymes developed in this study ingeniously combines photothermal effects with multiple biomimetic catalytic abilities, effectively overcoming the hypoxic and immunosuppressive microenvironment limitations in osteosarcoma treatment and efficiently inducing tumor cell apoptosis. This approach provides a new perspective for the precise treatment of osteosarcoma.
Materials and Methods
Materials
Co(NO3)2·6H2O, Fe(NO3)3·9H2O, sodium citrate dihydrate (C6H5O7Na3·2H2O), urea, 3,3′,5,5′-Tetramethylbenzidine (TMB), 5,5′-Dithio bis-(2-nitrobenzoic acid) (DTNB), thiazolyl blue tetrazolium bromide (MTT, 98%), hydrogen peroxide (H2O2), calcein-AM, propidium iodide (PI), Dulbecco’s Modified Eagle Medium (DMEM), penicillin-streptomycin solution (10,000 U/mL and 10,000 μg/mL, respectively), fetal bovine serum (FBS), dimethyl sulfoxide (DMSO), and reactive oxygen species (ROS) assay kit (DCFH-DA) were purchased from Shanghai Aladdin Bio-Chem Technology Co. Ltd. (China). TUNEL apoptosis assay kit was obtained from Shanghai Yuanye Bio-Technology Co., Ltd. (China). All reagents were used as received without further purification.
Synthesis of CF@P Nanozyme
To synthesize the CoFe2O4 catalyst, a solution was prepared by dissolving 0.109 g of Co(NO3)2·6H2O and 0.303 g of Fe(NO3)3·9H2O in 20 mL of deionized water. Subsequently, 0.66 g of C6H5O7Na3·2H2O was added as a chelating agent, followed by the incorporation of 0.2 g of urea to assist the slow release of hydroxide ions. The resulting homogeneous mixture was stirred vigorously for 1 hour at ambient temperature and then sealed in a 50 mL Teflon-lined stainless-steel autoclave. The solvothermal reaction was carried out at 200 °C for 24 hours. After naturally cooling to room temperature, the precipitate was thoroughly rinsed with distilled water and ethanol to remove any residual impurities and then dried at 80 °C overnight to obtain the final CoFe2O4 (CF) NPs. To improve dispersion and biological safety, PEG4000 was coated onto the CF NPs. Specifically, 0.4 g of CF NPs were dissolved in 20 mL of water and ultrasonicated for 30 minutes. Then, 0.175 g of PEG4000 was added to the system and stirred at room temperature for 12 hours to obtain CF@P nanozyme. Afterward, the CF@P nanozyme were separated by centrifugation at 8000 RPM, washed three times with PBS, and dried in an oven to obtain the final product for further use.
Characterization
Transmission electron microscopy (TEM, JEOL TEM-100) was used to characterize the size and morphology of the samples. The size distribution and zeta potential were measured by dynamic light scattering (DLS) using a NanoZS90 instrument (Malvern). UV-Vis absorption curves were recorded with a UV-vis-NIR spectrophotometer (JASCO V-670). Fluorescence imaging was performed using an Olympus fluorescence microscope or Leica microscope. In vivo imaging was conducted using a PerkinElmer IVIS® Lumina III small animal in vivo imaging system. The X-ray diffraction (XRD) patterns of the powder samples were measured using a diffractometer with Cu Kα radiation (Rigaku Ultima III, Japan). X-ray photoelectron spectroscopy (XPS) spectra were collected using a PHI 5000 Versa Probe XPS microscope (Ulvac-Phi, Japan).
Evaluation of Catalytic Activities
Oxidase-Like (OD) Activity
CF@P were incubated with 3,3′,5,5′-tetramethylbenzidine (TMB, 250 μg mL−1) at a concentration of 100 μg mL−1 in phosphate-buffered saline (PBS, pH 5.5, 0.1 M). The OD enzyme activity was analyzed by monitoring changes in UV-Vis spectroscopy at different times (0–15 minutes).
Peroxidase-Mimicking (POD) Activity
To investigate the POD-like catalytic performance of CF@P, experiments were conducted using TMB (250 μg mL−1) as the chromogenic substrate in the presence of varying concentrations of hydrogen peroxide (H2O2). The concentration of CF@P was 100 μg/mL. All reactions were carried out in 20 mM sodium acetate buffer (pH 5.5) to maintain acidic conditions optimal for POD activity. The catalytic reaction progress was monitored by measuring absorbance at 650 nm at different times (0–15 minutes).
Effect of Temperature on POD Activity
To investigate the effect of temperature (20, 37, and 45 °C) on the POD catalytic performance of CF@P, experiments were conducted at different temperatures using TMB (250 μg mL−1) as the chromogenic substrate. The final concentration of CF@P was 100 μg/mL. All reactions were carried out in 20 mM sodium acetate buffer (pH 5.5) to maintain optimal acidic conditions for POD activity. The catalytic reaction process was monitored by measuring absorbance at 650 nm after 10 minutes.
Catalase-Mimicking Activity
To assess the CAT-like activity, CF@P (0, 50, 100, and 200 μg/mL) were introduced into H2O2 solutions at a final concentration of 2 mM. The decomposition of H2O2 was evaluated by monitoring the generation of dissolved oxygen in real-time using a dissolved oxygen meter. Measurements were recorded every 30 seconds over a 25-minute period to determine the catalytic performance.
GSH Depletion Performance
1 mM GSH in PBS was mixed with 3 mL of CF@P dispersion (400 μg mL−1). The mixture was subjected to NIR laser irradiation (1064 nm, 1.32 W/cm2) for 5 minutes. Subsequently, 4 μL of 5,5′-dithiobis (2-nitrobenzoic acid) (DTNB, 1 mg/mL) was added as the chromogenic reagent at different time points, and the absorbance of the solution was recorded using a UV-Vis spectrophotometer to assess the extent of GSH consumption based on the decrease in DTNB absorbance.
Stability of CF@P NPs
CF@P were incubated in an acidic solution (pH 4.5) with continuous stirring for different times. At predetermined time points, a small amount of solution was taken out for TEM measurements.
MTT Assay for Cytotoxicity Evaluation
To assess the cytotoxicity of CF@P, a standard MTT assay was conducted. U2OS cells were seeded into 96-well plates and allowed to grow until reaching approximately 70% confluency. At this point, the culture medium was replaced with fresh medium containing CF@P at varying concentrations. After a 2-hour incubation, the incubation medium was discarded, and each well was replenished with 100 μL of fresh complete medium. The cells were then exposed to NIR laser irradiation (1064 nm, 1.32 W/cm2) and subsequently incubated for an additional 24 hours. Following this, 20 μL of MTT reagent (5 mg mL−1 in DMEM) was introduced into each well, and the plates were incubated for 4 hours at 37 °C. After incubation, the supernatant was carefully removed, and 100 μL of DMSO was added to dissolve the formazan crystals. The absorbance was measured at 490 nm using a microplate reader (Bio-Rad) to determine cell viability.
Photothermal Imaging
Photothermal imaging of PBS and CF@P was performed using infrared cameras. Thermal imaging at different time points of irradiation was monitored under the irradiation of a 1064 nm laser (with a laser power of 1.32 W/cm2 and an irradiation time of 5 minutes, unless otherwise specified). The temperature changes at different times were recorded.
FITC Labeling of CF@P Nanoparticles
CF@P nanoparticles were dispersed in phosphate-buffered saline (PBS, pH 8.5) at a concentration of 1 mg/mL. The suspension was sonicated for 15 min to ensure uniform dispersion. FITC was dissolved in DMSO at 1 mg/mL as a stock solution. FITC solution was slowly added to the nanoparticle suspension at a mass ratio of ~1:20 (FITC: CF@P). The reaction mixture was stirred gently in the dark at room temperature for 12 h. The isothiocyanate group of FITC reacts with amino groups on the PEGylated surface of CF@P, forming a stable thiourea bond. The labeled nanoparticles were collected by centrifugation (8000 g, 10 min). The pellet was washed with PBS three times until no free FITC was detected in the supernatant (checked by fluorescence). In the end, FITC-labeled CF@P nanoparticles were resuspended in PBS and stored at 4 °C in the dark until further use.
Intracellular ROS Detection Assay
To evaluate intracellular ROS levels, U2OS cells were seeded into 6-well plates at a density of 2 × 10⁵ cells per well and cultured in acidified DMEM supplemented with 10% fetal bovine serum (FBS) under standard conditions (37 °C, 5% CO2) for 24 hours. Cells were then incubated with 1 mL of CF@P suspension (100 μg mL−1), with or without the addition of 100 μM H2O2 for an additional 12 hours. For the laser-treated group, cells were irradiated with a 1064 nm NIR laser at a power density of 1.32 W/cm2 for 5 minutes. Following treatment, the culture medium was discarded and replaced with serum-free DMEM containing 10 μM DCFH-DA probe. After a 20-minute incubation period at 37 °C, cells were washed thoroughly with PBS three times to remove excess probe. The fluorescence signal of oxidized DCF was visualized using a fluorescence microscope to assess ROS generation within the cells.
Photothermal Performance of CF@P
The photothermal conversion efficiency of CF@P was systematically evaluated under 1064 nm NIR laser irradiation. For concentration-dependent studies, 2 mL of cell culture medium containing various concentrations of CF@P (0, 50, 100, 200, and 400 μg mL−1) was irradiated with a 1064 nm NIR laser at a power density of 1.32 W/cm2. For power density-dependent studies, 2 mL of medium containing 100 μg/mL CF@P NPs was exposed to NIR laser irradiation at different power densities (0, 0.74, 0.98, 1.32, and 1.47 W cm−2) for 10 minutes. Real-time temperature changes were monitored using an infrared thermal imaging camera.
To assess photothermal stability, CF@P samples (100 μg/mL in 2 mL) were subjected to two cycles of laser irradiation (10 min ON) followed by natural cooling to room temperature (20 min OFF). The temperature profiles were recorded to evaluate thermal durability under repeated NIR exposure.
Flow Cytometry Analysis
U2OS cells were subjected to treatment according to six experimental groups. After treatment, the cells were harvested and washed thoroughly with PBS (pH 7.4) to remove residual medium. These cells were then digested using EDTA-free trypsin, centrifuged, and washed three times with PBS. Subsequently, cells were stained with Annexin V-FITC and propidium iodide (PI) for 30 minutes in the dark. The stained samples were analyzed using a flow cytometer (Beckman Coulter Inc.). Based on fluorescence signals, the cells were categorized into viable, apoptotic, and necrotic populations, and the apoptosis rate was quantified accordingly.
Cell Culture
U2OS cells were purchased from American Type Culture Collection (ATCC, America) and maintained in Dulbecco’s Modified Eagle Medium (DMEM) supplemented with 10% fetal bovine serum (FBS) and 1% penicillin–streptomycin solution. Cells were incubated in a humidified atmosphere at 37 °C with 5% CO2. All cell culture reagents were obtained from TIANHANG (China).
Establishment of Osteosarcoma Mouse Model
Five-week-old female BALB/c nude mice (20 g) were obtained from Qinglongshan Laboratory Animal Center (Nanjing, China). The animals were kept in ventilated cages and exposed to light for approximately 10 hours daily. The ambient temperature was controlled at 22 °C, and the humidity was maintained between 50% and 60%. To establish the tumor model, 1 × 10⁶ U2OS cells (in 0.1 mL of saline) were subcutaneously injected into the dorsal flank of each mouse. All animal experiments were conducted in accordance with ethical guidelines and approved by the Institutional Animal Care and Use Committee (IACUC) and the Animal Welfare Ethics Review Committee of Nanjing University (IACUC-D2103066).
In vivo Antitumor Experiment
U2OS tumor-bearing mice were randomly divided into four groups (n = 10 per group): (1) Control group: 0.1 mL of PBS; (2) NIR group: 0.1 mL of PBS plus 10 minutes’ laser irradiation (by 1064 nm) on the first and fifth days; (3) CF@P group: 0.1 mL of 0.5 mg/mL CF@P NPs; (4) CF@P+NIR group: 0.1 mL of 0.5 mg/mL CF@P NPs plus 10 minutes’ laser irradiation (by 1064 nm) on the first and fifth days. The treatments were administered via tail vein injection every five days for a total of two times. Mouse body weight and tumor size were measured every two days to evaluate the antitumor efficacy of the treatments.
Histological Analysis
After 14 days of treatment, the mice were euthanized, and their tumors, hearts, livers, spleens, lungs, and kidneys were collected, washed with saline, and fixed in 4% paraformaldehyde. Organs and tumors from each group were randomly selected for pathological sectioning and Hematoxylin and Eosin (H&E) staining. Representative images of each group were captured using an optical microscope.
Statistical Analysis
All results are expressed as the mean ± standard deviation (SD) based on at least three independent biological replicates, each yielding consistent outcomes. Statistical evaluations were conducted using GraphPad Prism 9.0 (GraphPad Software), while additional analyses and graphing were performed using OriginPro 2021. Differences between groups were assessed using one-way analysis of variance (ANOVA), with statistical significance set at p < 0.05.
Results and Discussion
Synthesis and Characterization of CF@P Nanozyme
CoFe2O4 NPs were successfully prepared by using the hydrothermal method. To enhance their stability and dispersibility in water, these CoFe2O4 NPs were surface-modified with PEG4000, resulting in the formation of CF@P nanozyme. Transmission electron microscopy (TEM) images revealed that the CoFe2O4 NPs exhibited a spherical morphology with an average particle size of approximately 100 nm. Notably, the surface of these CoFe2O4 NPs displayed distinct spiky structures, which effectively increased the surface area and provided more active sites for catalytic reactions (Figure 1A). After modification with PEG4000, the CF@P maintained its spherical structure with negligible changes in particle size (Figure 1B). High-resolution TEM images further confirmed the presence of spiky structures on the surface of CF@P (Figure 1C), indicating that PEG modification did not alter the structural integrity of CoFe2O4 NPs.
 |
Figure 1 Characterization of CF@P nanozyme. (A) Representative TEM images of CF. (B) Representative low-magnification TEM photographs of CF@P and (C) larger magnification of CF@P NPs. (D) Hydrodynamic size of CF@P NPs. (E) Zeta potential of CF, CF@P NPs and PEG NPs, (n = 3 independent samples, mean ± SD). (F) XRD curves of CF and CF@P NPs. (G–I) XPS spectra of CF@P NPs (G), Co 2p (H) and Fe 2p (I). (J) TEM Images of CF@P NPs Degradation at Different Time Intervals Under pH 5.5 buffer. (K) Schematic diagram of degradation of CF@P NPs in an acidic environment. |
The hydrodynamic diameter of CF@P was approximately 103.3 ± 6.9 nm (Figure 1D), which was consistent with the TEM data. Stability studies demonstrated that CF@P maintained a hydrodynamic diameter of 109.8 ± 5.2 nm after 7 days of storage in PBS buffer (pH 7.4), indicating their excellent stability under physiological conditions (Figure S1). The zeta potential of CoFe2O4 NPs was −12.4 ± 2.8 mV, while that of PEG4000 solution was −3.6 ± 1.1 mV. After combination, the zeta potential of CF@P was −5.3 ± 1.5 mV (Figure 1E). This change in zeta potential confirmed the successful modification of CoFe2O4 NPs with PEG, which reduced the surface charge of CF@P. In addition, infrared spectroscopy also indicates the loading of PEG on CF nanoparticles (Figure S2). The negatively charged CF@P is less likely to be captured by the reticuloendothelial system (RES) in vivo, thereby prolonging their circulation time in the bloodstream and enhancing the enhanced EPR effect, which is beneficial for their accumulation in tumor tissues.
The X-ray diffraction (XRD) pattern of CoFe2O4 NPs exhibited characteristic peaks of CoFe2O4 at 30.08°, 35.30°, 43.03°, 53.47°, and 62.81°, corresponding to the crystal planes of (220), (311), (400), (511), and (440), respectively (JCPDS Card No. 03-0864) (Figure 1F).23 However, these peaks were broad, suggesting that the crystal structure of CF was not perfectly ordered. The chemical composition of CF@P was further analyzed using X-ray photoelectron spectroscopy (XPS). The XPS spectrum displayed characteristic elemental peaks for C1s, O1s, Co2p, and Fe2p (Figure 1G). The C1s peak originated from organic molecules such as PEG4000 and citric acid present in CF@P. Detailed XPS spectra revealed the binding energies of Co2⁺ (781.1 and 797.5 eV) (Figure 1H), Fe2⁺ (710.04 and 723.4 eV), and Fe3⁺ (712.6 and 726.6 eV) (Figure 1I). Furthermore, the XPS peak in the O 1s core layer at 532.1 eV clearly confirmed the existence of the metal oxide (Figure S3). These results, along with the XRD data, confirmed the successful synthesis of CF@P with the presence of a small amount of Fe2⁺ in the structure.
Considering that the pH within tumor cell lysosomes ranges from 4.5 to 5.5, we investigated the stability of CF@P in a pH 5.5 buffer solution by TEM (Figure 1J). TEM analysis can not only observe the surface changes of CF@P nanoparticles during the degradation process, but also analyze their particle size changes and observe whether there are agglomeration and other phenomena during the degradation process. Notably, CF@P rapidly degraded in the acidic buffer. After 2 hours of incubation, the nanoparticles still maintained their basic spherical structure. However, as the incubation time increased, the degree of degradation became more pronounced. By 24 hours, almost no intact CF@P nanozymes were observed. Figure 1K illustrates the degradation process of CF@P. This acidic pH-responsive degradation behavior of CF@P suggests its potential for controlled release of therapeutic agents within tumor tissues, thereby minimizing off-target effects and enhancing therapeutic efficacy.
Photothermal Effect of CF@P Nanozyme
To endow CF@P with enhanced catalytic activity through photothermal effects, we investigated its ultraviolet-visible (UV-Vis) absorption spectrum. The UV-Vis spectrum of CF@P revealed a broad absorption range across the UV region. Notably, at a concentration of 100 μg/mL, CF@P exhibited strong absorption capabilities even beyond 1000 nm, indicating its potential for NIR photothermal conversion (Figure S4).
The photothermal properties of CF@P were further explored through irradiation by a 1064 nm laser with an intensity of 1.32 W/cm2. As depicted in Figure 2A and B, upon laser irradiation for 10 minutes in PBS buffer, the temperature of the solution increased from 20 °C to 36 °C, demonstrating a baseline temperature rise due to laser exposure. In contrast, CF@P displayed a pronounced photothermal effect. At a concentration of 100 μg/mL, laser irradiation for the same duration elevated the temperature of the solution to 48 °C. Moreover, the photothermal effect of CF@P was concentration-dependent; at a higher concentration of 400 μg/mL, the temperature rose to 62 °C under identical laser conditions. Additionally, the photothermal response of CF@P was directly proportional to the laser power, with higher power leading to faster temperature increases (Figure 2C). Importantly, CF@P demonstrated excellent photothermal stability. Even after multiple cycles of laser irradiation (1064 nm, 1.32 W/cm2), CF@P (100 μg/mL) maintained their robust photothermal conversion efficiency (Figure 2D). This stability is crucial for ensuring consistent and reliable performance during repeated therapeutic applications.
 |
Figure 2 (A and B) Infrared photography (A) and temperature records (B) of different concentration of CF@P NPs (0, 50, 100, 200 and 400 μg/mL) under NIR laser irradiation (1064 nm, 1.32 W/cm2). (C) The temperature curves under different laser power densities (0.74, 0.98, 1.32 and 1.47 W/cm2) for CF@P NPs (100 μg/mL). (D) Temperature profiles of CF@P NPs (100 μg/mL) under repeated NIR irradiation cycles (1064 nm, 1.32 W/cm2). |
Based on these findings, considering factors such as the amount of CF@P used, the rate of temperature increase, and the safety of laser power, we opted to use 100 μg/mL of CF@P, a 1064 nm laser wavelength, and a power intensity of 1.32 W/cm2 for subsequent photothermal effect studies. This optimized setup allows us to harness the photothermal properties of CF@P effectively while minimizing potential risks associated with excessive heat generation or laser exposure.
Multienzyme Activity of CF@P Nanozymes
CF@P exhibits multiple enzyme activities. The OD-, POD-like activities of CF@P were tested by oxidation of 3,3′,5,5′-tetramethylbenzidine (TMB), which produces blue products with maximum absorption at 652 nm. First, we investigated the POD enzyme activity of CF@P. CF@P decomposes H2O2 into highly oxidizing ·OH, which oxidize TMB to form ox-TMB (Figure 3A). Figure 3C demonstrates the ability of CF@P to oxidize TMB in the presence of H2O2. No absorption peak was observed at 650 nm in either the CF@P solution alone or the H2O2+NIR system, indicating the absence of hydroxyl radicals. In the CF@P+H2O2 system, a distinct absorption peak appeared at 650 nm, signifying the generation of ·OH, which oxidized colorless TMB to yellow ox-TMB. The CF@P+H2O2+NIR system exhibited the strongest absorption peak at 650 nm, indicating the highest production of ·OH. Compared to the CF@P+H2O2 system, the laser irradiation in CF@P+H2O2+NIR elevated the system temperature, enhancing the POD catalytic activity of CF@P and resulting in increased ·OH production and TMB oxidation to ox-TMB. Thus, the catalytic activity of CF@P is temperature-sensitive. Under either air or H2O2-containing conditions, CF@P efficiently catalyzed the oxidation of TMB, producing a distinct blue oxidized product. The OD- and POD-like activities were strongly influenced by both pH and temperature. Therefore, we first evaluated the effect of pH on nanozyme activity (Figure S5), which revealed that CF@P exhibited optimal activity at pH 4.5. In addition, temperature was found to markedly affect the catalytic performance, with the highest POD-like activity observed at 45 °C (Figure S6). Building on this, we examined the ability of CF@P to catalyze the decomposition of H2O2 into ·OH at different temperatures. Higher temperatures led to stronger absorption peaks at 650 nm in the TMB solution, indicating increased TMB oxidation and confirming that higher temperatures enhance the POD activity of CF@P (Figure 3D).
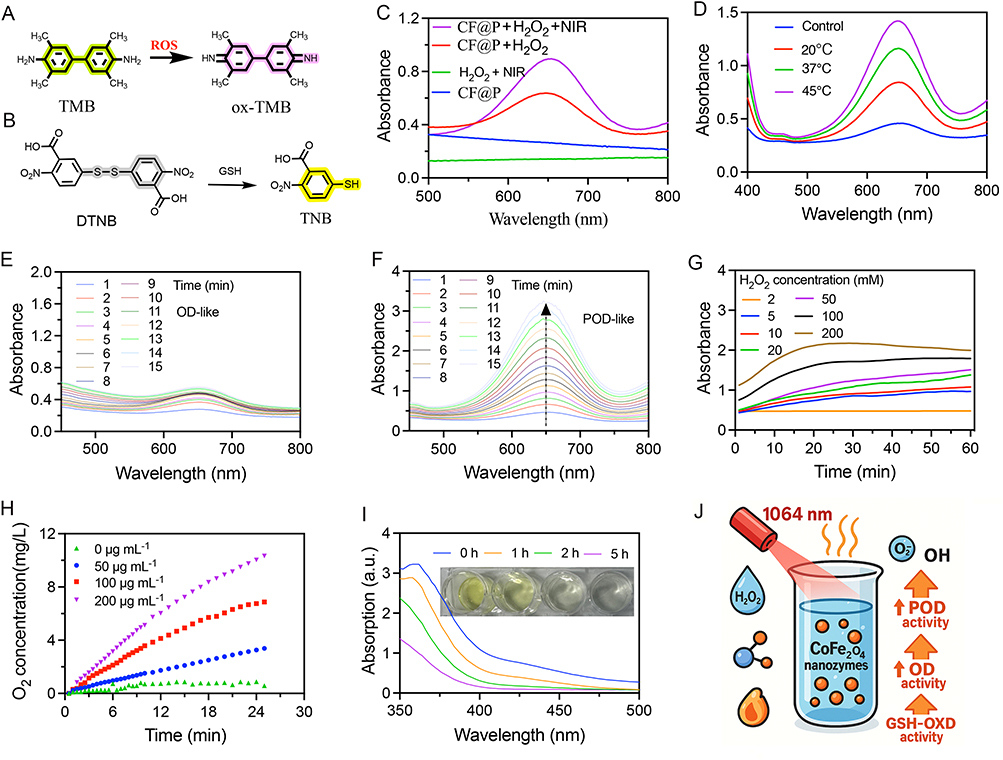 |
Figure 3 (A) The ROS detection mechanism of CF@P NPs. (B) The GSH consumption of CF@P NPs was monitored by the fluorescent probe DTNB. (C) TMB was used to detect ultraviolet absorption curves of CF@P NPs (100 μg/mL) under different conditions in pH 5.5 buffer (1064 nm, 1.32 W/cm2). (D) The influence of temperature on the activity of CF@P NPs (100 μg/mL). (E and F) Monitoring of ROS production by CF@P NPs at different times with or without H2O2. In the absence of H2O2: CF@P showed OD-like enzyme activity; in the presence of H2O2: CF@P showed POD-like enzyme activity. (G) Monitoring of ROS produced by CF@P NPs in different concentrations of H2O2 at different times (0–60 min). (H) Continuously monitoring CAT enzyme activity at different concentrations of CF@P NPs (0, 50, 100 and 200 μg/mL) catalyzing O2 production from 1 mM H2O2. (I) Time-dependent consumption of GSH by CF@P NPs after NIR Laser irradiation for 10 minutes. (J) Schematic diagram of different enzyme-like activities of CF@P NPs under NIR laser irradiation. |
Interestingly, when CF@P was dispersed in an oxygen-saturated PBS solution (pH 5.5), a faint ultraviolet absorption peak was observed at 650 nm even in the absence of H2O2. This peak gradually intensified over time (Figure 3E), attributed to the OD catalytic activity of CF@P, which oxidizes oxygen to O2•−. O2•− then oxidizes TMB to ox-TMB, producing the ultraviolet absorption peak at 650 nm. We further investigated the persistence of the POD activity of CF@P. Dispersed in a solution containing H2O2 and TMB, CF@P exhibited a progressively intensifying absorption peak at 650 nm over time, indicating continuous H2O2 decomposition and ·OH generation (Figure 3F). The amount of H2O2 substrate also influenced ·OH production. Increasing H2O2 concentrations led to higher ultraviolet absorption intensities at 650 nm, with sustained growth over time, consistent with the results in Figure 3F and G.
In the aforementioned studies, we confirmed that CF@P possess significant POD and OD catalytic properties, enabling H2O2 decomposition to produce ·OH for ferroptosis and oxygen oxidation to generate O2•− for apoptosis, thereby achieving CDT effects. However, considering the high GSH concentration in tumor tissues, which can consume ·OH and O2•−, and the hypoxic state of tumor tissues, which enhances treatment resistance, we investigated CF@P’s ability to deplete GSH and decompose H2O2 to produce oxygen, alleviating tumor hypoxia. In a 1 mM H2O2 aqueous solution, CF@P generated oxygen, demonstrating apparent CAT catalytic characteristics. Increasing CF@P dosage and reaction time resulted in higher oxygen production (Figure 3H). Thus, CF@P exhibits CAT catalytic properties, decomposing the high H2O2 concentration in tumor tissues to produce oxygen and alleviate tumor hypoxia. 5,5′-Dithiobis-(2-nitrobenzoic acid) (DTNB) is reduced by GSH to form yellow 2-thio-5-nitrobenzoate (TNB), causing a noticeable change in ultraviolet absorption at 412 nm (Figure 3B). Dispersing CF@P in a GSH buffer and irradiating with a laser for 5 minutes, followed by DTNB addition at different time points, revealed a gradual decrease in ultraviolet absorption at 412 nm, indicating the GSH depletion. Two hours post-incubation, the solution exhibited no yellow color, signifying complete GSH consumption (Figure 3I). This may be due to Fe3⁺ in CF@P being reduced to Fe2⁺ by consuming GSH. To verify this, we co-cultured CF@P and GSH solutions, adding 1,10-phenanthroline, which forms a red chelate with Fe2⁺ and absorbs strongly at 510 nm. Over time, the absorption peak at 510 nm intensified, indicating increased Fe2⁺ production (Figure S7). The generated Fe2⁺, in the presence of H2O2, undergoes a Fenton reaction, producing more ·OH. Therefore, under laser irradiation, CF@P simultaneously exhibits CAT and POD activities, catalyzing H2O2 to generate oxygen and ·OH, alleviating tumor hypoxia, and exerting CDT effects to kill tumor cells. It also demonstrates GPx catalytic properties, consuming GSH in tumor tissues and enhancing CDT efficacy (Figure 3J).
In vitro Cellular Uptake and Toxicity Testing of CF@P NPs
CF@P exhibits good multi-enzyme activity, enabling it to catalyze the decomposition of H2O2 to generate •OH, which kills tumor cells and exerts a CDT effect. Therefore, we investigated the in vitro cytotoxicity of CF@P. Even when cultured at a concentration of 50 μg/mL for 48 hours, CF@P did not show significant cytotoxicity towards normal human umbilical vein endothelial cells (HUVECs) (Figure 4A). For U2OS osteosarcoma cells, obvious cytotoxicity was observed when CF@P was at a concentration of 12.5 μg/mL and cultured for 24 hours. When the concentration of CF@P NPs was 37.5 μg/mL and incubated for 24 hours, the cell viability was below 60%. Moreover, the cytotoxicity increased with prolonged incubation time (Figure 4B). When the concentration of CF@P was 37.5 μg/mL and incubated for 24 hours after laser irradiation, the cell viability was below 30% (Figure 4C). These results indicate that CF@P is non-toxic to normal cells but exhibits significant cytotoxicity towards U2OS tumor cells, and laser irradiation enhances the cytotoxicity of CF@P. The cytotoxicity of nanomedicines related to the ability of cellular uptake ability. Laser confocal microscopy was employed to study the uptake of CF@P by U2OS tumor cells and its distribution within the tumor cells (Figure 4D). After co-culturing CF@P with U2OS tumor cells for 4 hours, the green-labeled CF@P highly coincided with the red lysosomes, showing distinct yellow in the overlay image. In the linear fluorescence distribution plot, the green CF@P signal and the red lysosome signal almost completely overlapped (Figure 4E). These data suggest that CF@P are primarily distributed in the lysosomes of cells.
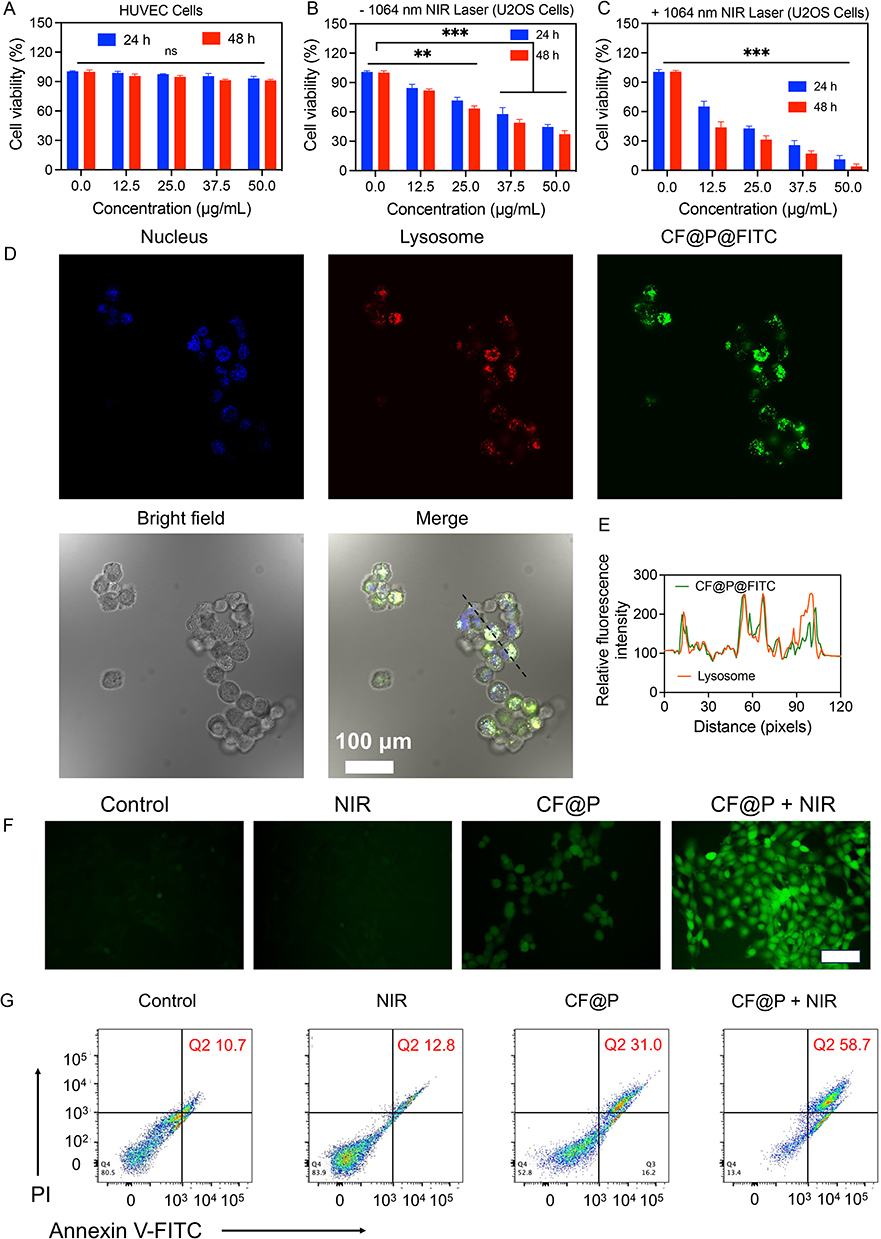 |
Figure 4 In vitro nanozyme catalysis performance of CF@P NPs. (A) HUVEC cells viability with different treatments at 24 and 48h. (B and C) Analysis of cell activity of U2OS cells after treatment with different concentrations of CF@P NPs without (B) or with (C) near-infrared laser irradiation. (D) Fluorescence images of CF@P marked with FITC NPs after 4 h incubation. FITC fluorescence (green), Lyso-Tracker Red (detect lysosome) and DAPI (blue). (E) Plot profile analysis of Lyso-Tracker co-localization with CF@P marked with FITC NPs. (F) CLSM images of U2OS cells subjected to different treatments and subsequent staining with DCFH-DA. (G) Flow cytometric detection of U2OS cells co-stained with Annexin V-FITC and PI. |
 |
Figure 5 Biodistribution and in vivo photothermal effect of CF@P NPs. (A) Fluorescence images of U2OS tumor-bearing mice after intravenous injection of free ICG (0–24 h). The tumor was marked by red circle, and (B) the fluorescence signal intensity of the tumor site in (A). (C) Fluorescence images of U2OS tumor-bearing mice after intravenous injection of CF@P@ICG (0–24 h) and (D) the fluorescence signal intensity of the tumor site in (C). (E) Fluorescence images of isolated mouse organs 24 h post-injection of intravenous injection of CF@P@ICG. (F) Fluorescence images of isolated mouse organs 24 h post-injection of intravenous injection of ICG. (G) Fluorescence signal intensity of different organs after injection of ICG or CF@P@ICG NPs in U2OS tumor-bearing mice. (H) IR thermal images of U2OS tumor-bearing mice 4 hours post the injection after the laser irradiation with various exposing time. (power density: 1.32 W cm−2). (I) Time-dependent temperature increase profiles of tumor sites after various treatments were measured by IR thermal images (n = 3). Data are presented as mean ± SD. |
CF@P can generate ROS in tumor cells to kill them. We used the DCFH-DA probe to investigate the ROS content in U2OS tumor cells after treatment with different samples (Figure 4F). Almost no green fluorescence signal was detected in the Control and NIR groups, indicating no ROS production. Green ROS signals appeared in cells treated with CF@P. Furthermore, the intracellular green fluorescence signal was significantly enhanced in U2OS tumor cells co-incubated with CF@P and subjected to laser irradiation, suggesting that laser irradiation facilitates ROS generation. The GSH content in cells also changed significantly after treatment with different samples. Compared with Control group, the intracellular GSH content in the NIR group remained almost unchanged. The GSH content in cells in the CF@P group was only about 50% of that in the Control group. In contrast, the intracellular GSH content in the CF@P+NIR group was less than 20% of that in the Control group (Figure S8). This result also confirms that CF@P can efficiently deplete GSH in tumor cells, facilitating ROS-based CDT. The apoptosis of U2OS tumor cells after treatment with different samples was investigated by staining them with Annexin V-FITC and PI. In the Control and NIR groups, most cells were viable, with only 10.7% and 12.8% of U2OS tumor cells in the late apoptosis stage (Q2), respectively. In the CF@P NPs group, 31.0% of the cells were in the late apoptosis stage. In the CF@P+NIR group, 58.7% of the cells were in the late apoptosis stage (Figure 4G). This result is consistent with the in vitro cytotoxicity data. It confirms that the photothermal effect effectively enhances the peroxidase (POD) catalytic activity of CF@P, thereby enhancing the anti-tumor CDT effect.
In vivo Biodistribution and Photothermal Effect of CF@P NPs
Given CF@P’s particle size of around 100 nm and its ability to target tumor tissues via the EPR effect, we investigated the distribution and metabolism of CF@P loaded with ICG (CF@P@ICG) in tumor-bearing mice. One hour after injecting free ICG, no ICG signal was observed at the tumor site. Between 2 and 8 hours, a weak ICG signal appeared at the tumor site, which nearly disappeared after 24 hours (Figure 5A and B). In contrast, mice injected with CF@P@ICG showed a clear ICG signal at the tumor site 1 hour post-injection, peaking at 4 hours and gradually decreasing thereafter (Figure 5C and D). To accurately assess CF@P’s distribution in tumor-bearing mice, major organs and tumors were isolated 24 hours post-injection and their fluorescence signals were measured. Mice injected with CF@P@ICG exhibited strong ICG signals in the tumor tissue 24 hours later, with minimal signals in other tissues (Figure 5E and G). In contrast, mice injected with free ICG showed only weak ICG signals in the tumor tissue, with no signals in other tissues (Figure 5F and G). These results demonstrate that CF@P@ICG effectively accumulates in tumor tissues and maintains a prolonged residence time, facilitating subsequent tumor treatment.
Since the photothermal effect can enhance CF@P’s catalytic activity, we investigated its photothermal effect in mice. After injecting different samples into the tumor tissue and irradiating them with a laser for varying duration times, the tumor tissue temperature was monitored. The Control group (PBS) showed a gradual temperature increase upon laser irradiation, reaching below 37 °C after 8 minutes. In contrast, mice injected with 0.1 mL of 50 μg/mL CF@P showed a rapid temperature increase in the tumor tissue upon laser irradiation, exceeding 43 °C after 8 minutes. Mice injected with 0.1 mL of 100 μg/mL CF@P exhibited even higher tumor tissue temperatures, exceeding 46 °C after 8 minutes (Figure 5H and I). These data demonstrate that CF@P exhibits good photothermal performance in mice, enhancing its CDT anti-tumor effects.
In vivo Antitumor Efficacy of CF@P
Considering CF@P has the ability to accumulate in tumors and its photothermal performance in mice, we investigated its antitumor effects in a U2OS tumor model. When the tumors reached 100 mm3, the mice were divided into four groups and injected with different samples. Four hours later, the tumor tissues were irradiated with a laser for 10 minutes. On day 5, the procedure was repeated. Tumor volume and mouse weight were monitored throughout the experiment (Figure 6A). The Control and NIR groups exhibited rapid tumor growth, reaching 15 times of the initial volume after 12 days (Figure 6B and D). In contrast, mice treated with CF@P showed greatly inhibited tumor growth, with volumes reaching approximately 6 times of the initial value after 12 days. The CF@P+NIR group exhibited the best tumor suppression, with volumes only reaching 2 times of the initial value after 12 days (Figure 6B and D). On day 12, the tumor weight in the Control group was five times of that in the CF@P+NIR group (Figure 6C). The survival curve of tumor-bearing mice indicated that the Control group started experiencing deaths on day 16, with all mice succumbing by day 32. In contrast, the CF@P+NIR group exhibited the longest survival time, with the first death occurring on day 35. These data demonstrate that CF@P+NIR significantly inhibits tumor growth and prolongs the survival of tumor-bearing mice. Throughout the treatment, no significant weight changes was observed in any treatment group, indicating that these treatments did not cause acute harm to the mice (Figure S9).
 |
Figure 6 Antitumor efficacy of CF@P-mediated SDT. (A) Schedules of 4T1-tumor model establishment and CF@P-mediated treatment. (B) The changes of relative U2OS tumor volume after different treatments. (C) Weight of excised tumor from orthotopic U2OS tumor-bearing mice after various treatments. (D) Photograph of excised tumors from orthotopic U2OS tumor-bearing mice after various treatments. (E) The survival of U2OS tumor-bearing mice after various treatment. Abbreviation: ns, not significant. Notes: **p < 0.01; ***p < 0.001. |
In vivo Safety Assessment of CF@P NPs
To further investigate the biosafety of CF@P, various physiological indicators in mouse blood samples were measured on day 14 of the animal experiment. Compared to the Control group, no significant differences were observed in blood biochemical indicators such as alanine aminotransferase (ALT), albumin (ALB), alkaline phosphatase (ALP), urea (UREA), creatinine (CREA), and uric acid (UA) across different groups, all remaining within normal ranges (Figure 7A–F). Hematoxylin and eosin (H&E) staining of major organs (heart, liver, spleen, lung, and kidney) collected from mice after different treatments revealed intact tissue structures, with no apparent apoptosis, necrosis, or inflammation observed (Figure 7G). These data indicate that CF@P, when used in combination with laser irradiation for osteosarcoma treatment, exhibit good biosafety.
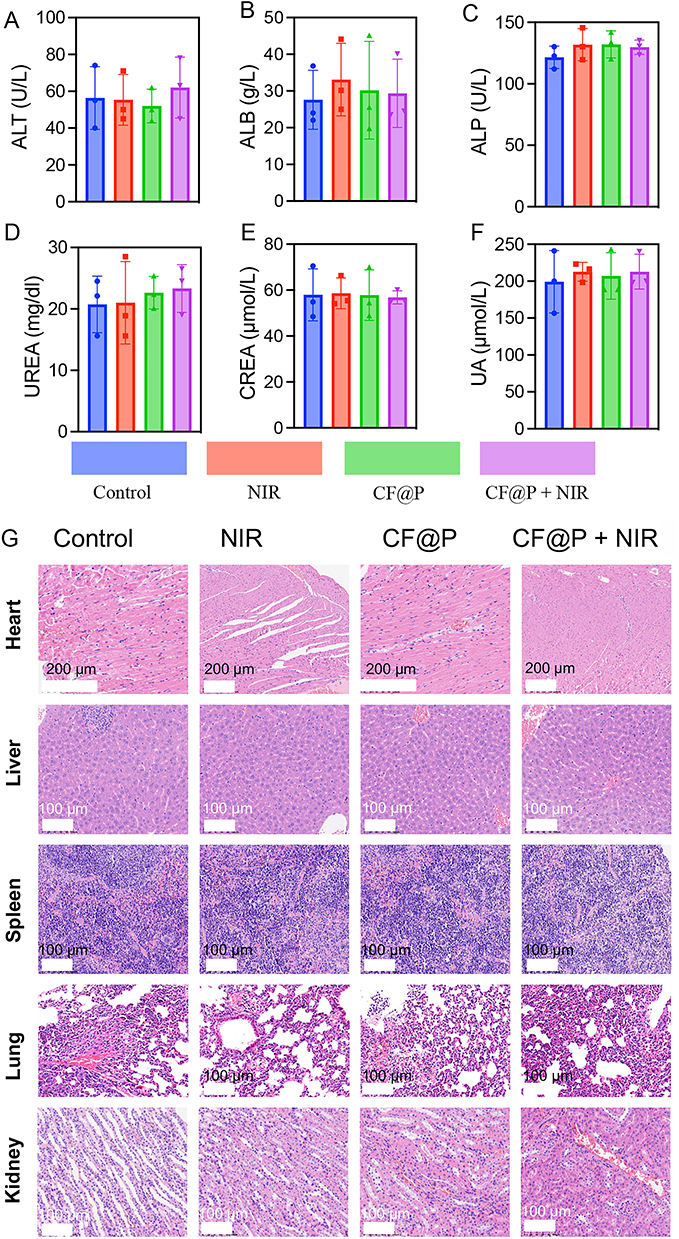 |
Figure 7 In vivo safety assessments of the CF@P NPs. Serum biochemical index measurements, such as (A) alanine aminotransferase (ALT); (B) albumin (ALB); (C) alkaline phosphatase (ALP); (D) Urea (UREA); (E) creatinine (CREA); (F) urine acid (UA). (G) Hematoxylin and eosin (H&E) staining of major organs collected from mice after different treatments. |
Conclusion
This study successfully developed cobalt ferrite nanozymes (CF@P) that integrate multi-enzyme activities (CAT for hypoxia relief, POD/OD for ROS generation, and GPx for GSH depletion) with NIR photothermal effects, achieving a synergistic therapeutic mechanism of “hypoxia relief–ROS cascade generation–antioxidant defense disruption.” The superior catalytic activity of CF@P originates from its nanoflower-like structure with a large surface area, enabling full substrate contact, and from the synergistic Fe/Co dual sites that enhance POD activity while mitigating H2O2 inhibition of Co-based OD activity. This design ensures efficient •OH production, the most cytotoxic ROS species, which is critical for tumor ablation. In addition, PEG-assisted hydrothermal synthesis improved physiological stability and tumor accumulation, while the acidic microenvironment-responsive degradation addressed bioaccumulation concerns. In vitro studies confirmed selective cytotoxicity toward U2OS osteosarcoma cells without harming HUVECs, and in vivo experiments demonstrated efficient tumor accumulation via the EPR effect. Under NIR laser synergistic treatment, CF@P significantly improved tumor suppression and prolonged survival. Overall, this nanozyme system overcomes the limitations of conventional CDT—such as hypoxia, GSH-mediated ROS scavenging, and poor efficacy—offering a safe and highly effective precision therapeutic platform for osteosarcoma and other solid tumors.
Data Sharing Statement
No data was used for the research described in the article.
Acknowledgments
This work was supported by grant from Jiangsu Provincial Research Hospital (YJXYY202204), and the Science and Technology Project of Nantong Municipal Health Commission (MS2023016).
Disclosure
The authors declare that they have no known competing financial interests or personal relationships that could have appeared to influence the work reported in this paper.
References
1. Zhang L, Liu Y, Yao Y, et al. Injectable rhein-assisted crosslinked hydrogel for efficient local osteosarcoma chemotherapy. Int J Pharm. 2023;634:122–637. doi:10.1016/j.ijpharm.2023.122637
2. Wang Y, Williams GR, Zheng Y, et al. Polydopamine-cloaked Fe-based metal organic frameworks enable synergistic multidimensional treatment of osteosarcoma. J Colloid Interface Sci. 2023;651:76–92. doi:10.1016/j.jcis.2023.07.146
3. Jin J, Yuan P, Yu W, et al. Mitochondria-targeting polymer micelle of dichloroacetate induced pyroptosis to enhance osteosarcoma immunotherapy. ACS Nano. 2022;16(7):10327–10340. doi:10.1021/acsnano.2c00192
4. Jonathan G, Richard G. Advancing therapy for osteosarcoma. Nat Rev Clin Oncol. 2021;18(10):09–624. doi:10.1038/s41571-021-00519-8
5. Gu W-Y, Wu C-Y, Chen J-Z. Nanotechnology in the targeted drug delivery for bone diseases and bone regeneration. Int J Nanomed. 2013;8:2305–2317. doi:10.2147/IJN.S44393
6. Kansara M, Teng MW, Smyth MJ, et al. Smyth Translational biology of osteosarcoma. Nat Rev Cancer. 2014;14(11):722–735. doi:10.1038/nrc3838
7. Hu M, Yuan X, Liu Y, et al. IL-1β-induced NF-κB activation down-regulates miR-506 expression to promotes osteosarcoma cell growth through JAG1. Biomed Pharmacother. 2017;95:1147–1155. doi:10.1016/j.biopha.2017.08.120
8. Fakhar UD, Waqar A, Izhar U. Effective use of nanocarriers as drug delivery systems for the treatment of selected tumors. Int J Nanomed. 2017;12:7291–7309. doi:10.2147/IJN.S146315
9. Wang Y, Xu Y, Song J, et al. Tumor cell-targeting and tumor microenvironment–responsive nanoplatforms for the multimodal imaging-guided photodynamic/photothermal/chemodynamic treatment of cervical cancer. Int J Nanomed. 2024;2024:5837–5858. doi:10.2147/IJN.S466042
10. Huo D, Jiang X, Hu Y. Recent advances in nanostrategies capable of overcoming biological barriers for tumor management. Adv Mater. 2020;32(27):e1904337. doi:10.1002/adma.201904337
11. Liu S, Ren Z-D, Yan M-Q, et al. Strategies to enhance the penetration of nanomedicine in solid tumors. Biomaterials. 2025;321:123315. doi:10.1016/j.biomaterials.2025.123315
12. Zhang H-C, Montesdeoca N, Tang D-S, et al. Tumor-targeted glutathione oxidation catalysis with ruthenium nanoreactors against hypoxic osteosarcoma. Nat Commun. 2024;15(1):9405. doi:10.1038/s41467-024-53646-y
13. Jia X-N, Wang E, Wang J. Rational design of nanozymes for engineered cascade catalytic cancer therapy. Chem Rev. 2025;125(5):2908–2952. doi:10.1021/acs.chemrev.4c00882
14. Huang -Y-Y, Ren J-S, Qu X-G. Nanozymes: classification, catalytic mechanisms, activity regulation, and applications. Chem Rev. 2019;119(6):4357–4412. doi:10.1021/acs.chemrev.8b00672
15. Lin L-S, Song J, Song L, et al. Simultaneous fenton-like ion delivery and glutathione depletion by MnO2-based nanoagent to enhance chemodynamic therapy. Angew Chem Int Ed. 2018;57(18):4902–4906. doi:10.1002/anie.201712027
16. Song Q-C, Zhang Y-R, Hu H-Z, et al. Augment of ferroptosis with photothermal enhanced Fenton reaction and glutathione inhibition for tumor synergistic nano-catalytic therapy. Int J Nanomed. 2024;19:11923–11940. doi:10.2147/IJN.S480586
17. Wu H, Xie L, Wang S, et al. Synthesis of an “all-in-one” nanotherapeutic platform for triple-amplification chemodynamic therapy of osteosarcoma. Colloid Surf A. 2023;673:131788. doi:10.1016/j.colsurfa.2023.131788
18. Qin S-H, Zhao H-Y, Luo X-Y, et al. Photothermally reinforced nanozyme remodeling tumor microenvironment of redox and metabolic homeostasis to enhance ferroptosis in tumor therapy. ACS Nano. 2024;18:32235–32254. doi:10.1021/acsnano.4c13087
19. Lu X-F, Gu L-F, Wang J-W, et al. Bimetal-organic framework derived CoFe2O4/C porous hybrid nanorod arrays as high-performance electrocatalysts for oxygen evolution reaction. Adv Mater. 2017;29(3):1604437. doi:10.1002/adma.201604437
20. Guo X, Yang F, Jing L, et al. In-situ generation of highly active and four-in-one CoFe2O4/H2PPOP nanozyme: mechanism and its application for fast colorimetric detection of Cr (VI). J Hazard Mater. 2022;431:128621. doi:10.1016/j.jhazmat.2022.128621
21. Arora K, Ledwani L, Komal. A comprehensive review on the synthesis and therapeutic potential of cobalt ferrite (CoFe2O4) Nanoparticles. Chemistryselect. 2025;10:
22. Balakrishnan PB, Silvestri N, Fernandez-Cabada T, et al. Exploiting unique alignment of cobalt ferrite nanoparticles, mild hyperthermia, and controlled intrinsic cobalt toxicity for cancer therapy. Adv Mater. 2020;32:2003712. doi:10.1002/adma.202003712
23. Tian L, Zhang Y, Wang L, et al. Ratiometric dual signal-enhancing-based electrochemical biosensor for ultrasensitive kanamycin detection. ACS Appl Mater Interfaces. 2020;12:52713–52720. doi:10.1021/acsami.0c15898
24. Chang J-H, Chen Y, Deng Y, et al. Oxygen-independent radiodynamic therapy: radiation-boosted chemodynamics for reprogramming the tumor immune environment and enhancing antitumor immune response. ACS Appl Mater Interfaces. 2024;16(17):21546–21556. doi:10.1021/acsami.4c00793
 © 2025 The Author(s). This work is published and licensed by Dove Medical Press Limited. The
full terms of this license are available at https://www.dovepress.com/terms
and incorporate the Creative Commons Attribution
- Non Commercial (unported, 4.0) License.
By accessing the work you hereby accept the Terms. Non-commercial uses of the work are permitted
without any further permission from Dove Medical Press Limited, provided the work is properly
attributed. For permission for commercial use of this work, please see paragraphs 4.2 and 5 of our Terms.
© 2025 The Author(s). This work is published and licensed by Dove Medical Press Limited. The
full terms of this license are available at https://www.dovepress.com/terms
and incorporate the Creative Commons Attribution
- Non Commercial (unported, 4.0) License.
By accessing the work you hereby accept the Terms. Non-commercial uses of the work are permitted
without any further permission from Dove Medical Press Limited, provided the work is properly
attributed. For permission for commercial use of this work, please see paragraphs 4.2 and 5 of our Terms.