Back to Journals » International Journal of Nanomedicine » Volume 12
Co-delivery nanoparticles with characteristics of intracellular precision release drugs for overcoming multidrug resistance
Authors Zhang DD, Kong YY, Sun JH, Huo SJ, Zhou M, Gui YL, Mu X, Chen H, Yu SQ ![]() , Xu Q
, Xu Q
Received 26 November 2016
Accepted for publication 27 January 2017
Published 16 March 2017 Volume 2017:12 Pages 2081—2108
DOI https://doi.org/10.2147/IJN.S128790
Checked for plagiarism Yes
Review by Single anonymous peer review
Peer reviewer comments 3
Editor who approved publication: Professor Lei Yang
DanDan Zhang,1 Yan Yan Kong,1 Jia Hui Sun,1 Shao Jie Huo,1 Min Zhou,2 Yi Ling Gui,1 Xu Mu,1 Huan Chen,1 Shu Qin Yu,1 Qian Xu3
1Jiangsu Province Key Laboratory for Molecular and Medical Biotechnology, College of Life Sciences, Nanjing Normal University, Nanjing, 2School of Pharmacy, Jiangsu Food and Pharmaceutical Science College, Huai’an, 3Ministry of Education Key Laboratory of Environmental Medicine and Engineering, School of Public Health, Southeast University, Nanjing, People’s Republic of China
Abstract: Combination chemotherapy in clinical practice has been generally accepted as a feasible strategy for overcoming multidrug resistance (MDR). Here, we designed and successfully prepared a co-delivery system named S-D1@L-D2 NPs, where denoted some smaller nanoparticles (NPs) carrying a drug doxorubicin (DOX) were loaded into a larger NP containing another drug (vincristine [VCR]) via water-in-oil-in-water double-emulsion solvent diffusion-evaporation method. Chitosan-alginate nanoparticles carrying DOX (CS-ALG-DOX NPs) with a smaller diameter of about 20 nm formed S-D1 NPs; vitamin E D-α-tocopheryl polyethylene glycol 1000 succinate-modified poly(lactic-co-glycolic acid) nanoparticles carrying VCR (TPGS-PLGA-VCR NPs) with a larger diameter of about 200 nm constituted L-D2 NPs. Some CS-ALG-DOX NPs loaded into TPGS-PLGA-VCR NPs formed CS-ALG-DOX@TPGS-PLGA-VCR NPs. Under the acidic environment of cytosol and endosome or lysosome in MDR cell, CS-ALG-DOX@TPGS-PLGA-VCR NPs released VCR and CS-ALG-DOX NPs. VCR could arrest cell cycles at metaphase by inhibiting microtubule polymerization in the cytoplasm. After CS-ALG-DOX NPs escaped from endosome, they entered the nucleus through the nuclear pore and released DOX in the intra-nuclear alkaline environment, which interacted with DNA to stop the replication of MDR cells. These results indicated that S-D1@L-D2 NPs was a co-delivery system of intracellular precision release loaded drugs with pH-sensitive characteristics. S-D1@L-D2 NPs could obviously enhance the in vitro cytotoxicity and the in vivo anticancer efficiency of co-delivery drugs, while reducing their adverse effects. Overall, S-D1@L-D2 NPs can be considered an innovative platform for the co-delivery drugs of clinical combination chemotherapy for the treatment of MDR tumor.
Keywords: combination chemotherapy, co-delivery, multidrug resistance, pH-sensitive nanoparticle, intracellular precision release, nuclear drug delivery
Introduction
Chemotherapy is still one of the most widely used therapeutic strategies, which can significantly reduce the mortality rate of different types of cancers. However, conventional single-drug chemotherapy may cause serious adverse effects and toxicity, lose anticancer sensitivity, and engender multidrug resistance (MDR).1 Various reasons for the emergence of MDR include that cancer cells lessen intracellular drug concentration induced by decreasing the uptake and increasing the efflux associated with P-glycoprotein (P-gp) overexpression, alter the target or metabolic pathway of the drug, activate DNA repair function, and so on. Owing to MDR, single-drug chemotherapy may need clinical treatment schemes with higher dose and longer course, which lead to intolerable toxicity eventually. Therefore, single-drug chemotherapy cannot completely eradicate cancers.
To achieve superior therapeutic efficacy, combination chemotherapy with two or more anticancer drugs in clinical practice has been generally accepted as a feasible strategy. The major principle of combination chemotherapy is the combined application of drugs with different pharmacological mechanisms to obtain synergistic efficacy and to decrease MDR, or with nonoverlapping toxicities to minimize the adverse effects on the normal organs.2,3 On account of the concept of combination chemotherapy, co-delivery of anticancer drugs with nanotechnology gradually becomes a desired strategy and one of the research frontiers on modern drug delivery.4,5 Over the last two decades, the application of nanodelivery drug system (NDDS) has achieved rapid development in cancer chemotherapy. NDDS is recognized to have the advantages of breaking through the biological barrier, improving the target property, and enhancing penetration ability on tumor tissues. NDDS can ameliorate the therapeutic efficacy of loaded drug and reduce its systemic toxicity. However, currently most NDDSs are loaded with a single anticancer drug. Similar to the single-drug chemotherapy, the deficiency of single-delivery NDDS is self-evident.
In recent years, the co-delivery NDDS (Co-NDDS), which loads at least two anticancer drugs with different physicochemical and pharmacological properties into a combination delivery system for the purpose of clinical combination chemotherapy, has achieved rapid development.6–9 Some co-delivery nanoparticles (NPs) have been established to load two small-molecule anticancer drugs, for example, pirarubicin and paclitaxel,10 doxorubicin (DOX) and paclitaxel,11 or cisplatin and rapamycin,12 or a small-molecule drug plus a macromolecule anticancer drug, such as, protein,13 miRNA,14 DNA,15 or gene agents.5 Co-NDDS synergistically inhibited the growth of the tumor compared with free drugs. However, these studies on Co-NDDS just focused on their preparation technique, physicochemical characterization, the release property of loaded drugs in the tissues and cells of cancer, and the in vitro or/and in vivo anticancer effect.
Because of pharmacological targets of some anticancer drugs locating at the cytoplasm or the nucleus of MDR cell, it is imperfect that Co-NDDS only carries these drugs to the domain of cancer tissue or the cytoplasm. Intracellular target delivery and precise release of the loaded drugs should be the ultimate goal of Co-NDDS. Some intracellular barriers, for example, the efflux associated with P-gp, the detention from endosome or lysosome, and the obstruction of the nuclear envelope, will affect the realization of the goal.
Although Co-NDDS relies on the concept of combination chemotherapy, there are some differences between them. For example, in clinical practice, because the drugs for combination chemotherapy are administered by rarely mixing in the same infusion bottle, the pharmaceutical incompatibility of drugs associated with physicochemical properties is usually not taken into account. In this condition, there is less influence on the pharmacokinetic characteristics of the drugs.3 However, Co-NDDS makes drugs enter the blood circulation at the same time. Hence, it is a feasible approach for cancer chemotherapy that an excellent Co-NDDS with a sequential and precision release characteristic can transport anticancer drugs to their pharmacological targets.16,17
As mentioned, drugs in Co-NDDS should have different pharmacological target points. So, we selected two small-molecule anticancer chemotherapeutic agents, vincristine (VCR) and DOX, as the model drugs for this study. VCR and DOX can be used in chemotherapy of lung cancer, Hodgkin’s lymphoma, soft tissue sarcoma, and osteosarcoma in the therapeutic prescription of single chemotherapy or combination chemotherapy. VCR is an inhibitor of microtubule polymerization targeting tubulin to arrest at the metaphase of cell mitosis.18,19 DOX, as an antibiotic agent, can induce DNA damage and apoptosis of cancer cell by inhibiting DNA topoisomerase II.20 However, both VCR and DOX are recognized as P-gp substrates.21,22 Many traditional NDDSs-loaded P-gp substrate can carry and release it in the microenvironment or cytoplasm of cancer. Jiang et al reported an innovative core-shell NP with sequential and site-specific delivery for co-delivery of TRAIL and DOX, which can release TRAIL in the cell membrane and DOX in the cytoplasm.13 Zhang et al reported that co-delivery NPs of DOX and curcumin could simultaneously release the drugs in the acidic microenvironment of cancer cells.23 However, even if these drugs are transported to the cytoplasm, they still face the difficulty of escaping the fate of efflux associated with P-gp. Therefore, the intracellular precision release of NDDS-loaded P-gp substrates is still a demanding issue. There were a variety of drug delivery techniques to reduce the efflux associated with P-gp, such as using biological materials with interference of P-gp function, like vitamin E D-a-tocopheryl polyethylene glycol 1000 succinate (TPGS), and adding P-gp inhibitor,24–27 like verapamil. Recently, we have reported that a type of NPs can carry a drug as the P-gp substrate into the nucleus and release it in the nucleus of MDR cell.28
Co-NDDS with intracellular precise release depends on the physiochemical characters of biomaterials and the preparative technique of NDDS. Based on the characteristics of cytoplasm acidic pH values (pH 5.8) and nucleus base pH values (pH 7.4) in MDR cell,29,30 we designed and prepared a Co-NDDS named S-D1@L-D2 NPs, which implied that some smaller NPs carrying a drug were loaded into a larger NP packaged with another drug. In this research, smaller chitosan-alginate nanoparticles carrying DOX (CS-ALG-DOX NPs) formed S-D1 NPs; larger TPGS-modified poly(lactic-co-glycolic acid) (PLGA) nanoparticles carrying VCR (TPGS-PLGA-VCR NPs) constituted S-D2 NPs. Some CS-ALG-DOX NPs loaded into TPGS-PLGA-VCR NPs formed CS-ALG-DOX@TPGS-PLGA-VCR NPs. After successfully preparing Co-NDDS (S-D1@L-D2 NPs), we testified that S-D1@L-D2 NPs could accurately release loaded drugs to their pharmacological targets in subcellular region of MDR cell, and improve pharmacodynamics action effectively by preventing the drug efflux to overcome MDR. Furthermore, we also explored the mechanism on the intracellular precision release. The synergistic antitumor effect of S-D1@L-D2 NPs in a xenograft tumor model was also confirmed. Therefore, S-D1@L-D2 NPs provide a promising strategy to overcome MDR in cancer chemotherapy.
Materials and methods
Materials
PLGA (Mw =30 kDa, lactic acid:glycolic acid =50:50) was purchased from Daigang Biomaterial (Jinan, People’s Republic of China). VCR and DOX were acquired from MedChem Express (Monmouth Junction, NJ, USA). Paclitaxel (Taxol) was obtained from Knowshine Pharmachemicals (Shanghai, People’s Republic of China). TPGS was obtained from Sigma-Aldrich (St Louis, MO, USA). Chitosan (CS, Mw =150 kDa) and coumarin-6 (C6) were obtained from TCI (Tokyo, Japan). Sodium alginate (ALG, low viscosity) was purchased from J&K Scientific (Beijing, People’s Republic of China). Calcium chloride dihydrate (CaCl2, MW 110.99) was purchased from Xilong Chemical (Guangzhou, People’s Republic of China). In total, 4% of paraformaldehyde solution and bovine serum albumin (BSA) were obtained from Solarbio (Beijing, People’s Republic of China). Hoechst 33342, cell cycle and apoptosis analysis kit, WST-1 cell proliferation and cytotoxicity analysis kit, tubulin-tracker red, actin-tracker green, lyso-tracker green DND-26, and 1,1′-dioctadecyl-3,3,3′,3′-tetramethylindotricarbocyanine iodide (DiR) were bought from Beyotime (Nantong, People’s Republic of China). Annexin fluorescein isothiocyanate/propidium iodide (V-FITC/PI) apoptosis detection kit was acquired from Becton-Dickinson (Nanjing, People’s Republic of China). Cell culture medium (Roswell Park Memorial Institute [RPMI] 1640 and Dulbecco’s Modified Eagle’s Medium [DMEM]), trypsin EDTA, penicillin, streptomycin, and fetal bovine serum (FBS) were provided from Thermo Scientific (Waltham, MA, USA). All the other reagents used were of analytical grade and used without further purification.
Preparation of NPs
Preparation of empty NPs
We prepared two types of empty NPs (CS-ALG NPs and CS-ALG@TPGS-PLGA NPs). CS-ALG NPs were prepared based on published literature.31,32 First, ALG and CaCl2 solutions were dissolved in distilled water, and the pH of the ALG solution was modified to pH 5.1 with HCl (1.0 mol/mL). CS was dissolved in 1% acetic acid solution and pH was modified to 5.4 with NaOH (1.0 mol/mL). The NPs were prepared by ionotropic pre-gelation of an ALG core followed by CS polyelectrolyte complexation. Aqueous CaCl2 (2 mL of 3.5 mg/mL) was added dropwise to 10 mL aqueous ALG (3.0 mg/mL) while stirring at 1,200 rpm for 30 min with a magnetic stirrer (IKA, Königswinter, Germany), and then 4 mL CS solution (0.8 mg/mL) was added into the resultant calcium alginate pre-gel and stirred for an additional 1 h. The opalescent suspension was equilibrated overnight to form uniform CS-ALG NPs.
The preparation of CS-ALG@TPGS-PLGA NPs was based upon our previous procedure via water-in-oil-in-water (W/O/W) double-emulsion solvent diffusion-evaporation method.28 CS-ALG NP (1 mL) as the water phase was added dropwise to PLGA solution (100 mg in 5 mL acetone) stirring at 1,000 rpm by a magnetic stirrer. Subsequently, the mixture results as the oil phase were collected and added dropwise in TPGS solution (0.18 mg in 60 mL water) at 3,000 rpm under a homogenizer (IKA). So as to acquire uniform resultant, the obtained W/O/W emulsion was stirred at 1,500 rpm for 4 h at room temperature by a magnetic stirrer, and the organic solvent of mixture was eliminated using a rotary vacuum evaporation (Dongxi Refrigeration Equipment, Shanghai, People’s Republic of China). In order to harvest and purify the resultant, the mixture was centrifuged three times at 13,500 rpm for 45 min at 4°C by a refrigerated micro-centrifuge (5418R, Eppendorf, Hamburg, Germany) and washed with distilled water every time. Finally, the ultimate precipitation was lyophilized using a freeze dryer (FL-60 system) to obtain CS-ALG@TPGS-PLGA NPs for further research.
Preparation of drug-loaded NPs
DOX (2 mg, dissolved with distilled water) was incorporated into 0.035% CaCl2 solution. Then, the other processes were the same as the preparation of empty NPs to get drug-loaded NPs, CS-ALG-DOX NPs. VCR solution (2 mg, dissolved with acetone) was mixed with PLGA solution. The mixture solution was treated with a digital control ultrasonic cleaner (KQ-500DE; Kunshan Ultrasonic Instrument, Beijing, People’s Republic of China) for 3 min in an ice-water bath to gain a regular organic phase. Then, the other processes were the same as the preparation of empty NPs to get TPGS-PLGA-VCR NPs, CS-ALG-DOX@TPGS-PLGA NPs, CS-ALG@TPGS-PLGA-VCR NPs, and CS-ALG-DOX@TPGS-PLGA-VCR NPs.
Preparation of tracing NPs
We also prepared C6-labeled NPs (CS-ALG-DOX@TPGS-PLGA-C6 NPs) for tracing the intracellular distribution of loaded materials. The preparation method was exactly the same as that of drug-loaded NPs, except that VCR was replaced by 0.1 mg C6.
Physical and chemical characterization
Surface morphological characteristics of empty NPs and drugs-loaded NPs were examined by a scanning electron microscope (SEM; S4800; Hitachi, Tokyo, Japan) and a transmission electron microscope (TEM; H7650; Hitachi, Tokyo, Japan). For the analysis of TEM, the samples were diluted with deionized water and dropped onto a copper grid coated with a carbon membrane. The grid was allowed to dry at room temperature before characterization. To prove that the smaller NPs were distributed in the larger NPs, the fluorescence images of the NPs were visualized under a confocal laser scanning microscopy (CLSM, A1; Nikon, Tokyo, Japan). The size and size distribution of these NPs and their zeta potential were determined with dynamic light scattering (DLS; Malvern Zeta Potential Analyzer; Malvern Instruments, Malvern, UK). Before measurement, the NPs were re-suspended into deionized water. All tested samples need to be measured in triplicates. The chemical structure of the raw materials, empty NPs, and drug-loaded NPs was analyzed by Fourier transform infrared spectroscopy (FT-IR; Thermo Fisher Scientific, Waltham, MA, USA).
Pharmaceutical characterization
Encapsulation efficiency (EE) and loading efficiency (LE)
For DOX, the tested sample was added to 1 mL deionized water (pH 7.5) and treated with a digital control ultrasonic cleaner for 15 min. After that, the dispersion was centrifuged at 13,500 rpm for 10 min at 4°C with a refrigerated micro-centrifuge. The concentration of DOX in water phase was compared against a calibration curve obtained at 480 nm with an ultraviolet-visible spectrophotometer (Shimadzu, Kyoto, Japan).
TPGS-PLGA-VCR NPs, CS-ALG-DOX@TPGS-PLGA NPs, CS-ALG@TPGS-PLGA-VCR NPs, or CS-ALG-DOX@TPGS-PLGA-VCR NPs (2 mg) were dissolved in dichloromethane (1 mL), and then ultrasonic method was used to disrupt the NPs. After sonication for 20 min, dimethyl sulfoxide (8 mL) was added to dissolve VCR or/and DOX fully. Then, the dispersion was centrifuged at 13,500 rpm for 10 min at 4°C with a refrigerated micro-centrifuge, and the supernatant and precipitate were retained, respectively. The supernatant was collected to analyze the concentration of VCR at 298 nm or/and DOX at 480 nm with an ultraviolet-visible spectrophotometer. LE and EE were calculated as listed below formulas (1) and (2).
|
|

|
|

Biphasic release pattern of drugs in vitro
Empty CS-ALG@TPGS-PLGA NPs were used to monitor the release of inner smaller NPs from larger NPs with TEM technique. CS-ALG@TPGS-PLGA NPs (0.1 mg) were re-suspended in phosphate-buffered saline (PBS; 2 mL, 0.1% w/v Tween 80, pH 5.8, pH 7.4) for 6 h in 37°C thermostatic water baths with 100 rpm shaking. Then the re-suspension was gathered for the analysis of TEM.
VCR release profile in vitro from CS-ALG@TPGS-PLGA-VCR NPs was researched using the classical dialysis bag method.31 Briefly, CS-ALG@TPGS-PLGA-VCR NPs (4 mg) were re-suspended in PBS (2 mL, 0.1% w/v Tween 80, pH 5.8 or pH 7.4) to simulate the cancer cytoplasmic environment (pH 5.8) and the physiological environment (pH 7.4). Subsequently, the re-suspension was transferred into a dialysis bag (molecular weight cut off 3 kDa; Millipore, Billerica, MA, USA), which was immersed in PBS (20 mL) and incubated in 37°C thermostatic water bath with 100 rpm shaking. At a designated time interval, 5 mL of the release solution was taken out to detect the concentration of VCR at 298 nm using an ultraviolet spectrophotometer. At the same time, isometric fresh PBS was added into the release medium.
DOX release profile in vitro from CS-ALG-DOX NPs was researched using the classical dialysis bag method. The precipitate was re-suspended in PBS (2 mL, 0.1% w/v Tween 80, pH 5.0, pH 5.8, or pH 7.4). Then the similar method was conducted, except that the detection wavelength was 480 nm, to confirm the concentration of DOX. The tests were repeated in triplicates.
In vitro biological effect experiment
Cell culture
A549 human lung adenocarcinoma cell line (A549 cell) and its MDR cell line (A549/taxol cell) (Shanghai Cell Bank, Chinese Academy of Sciences) were used for biological effect research. Tested cells were cultured in DMEM supplemented with 10% FBS and 1% penicillin and streptomycin under a humidified atmosphere containing 5% CO2 in a CO2 incubator (8000 WJ; Thermo fisher Scientific). To retain MDR, A549/taxol cells were maintained with Taxol (200 ng/mL) for 48 h and further cultured with taxol-free RPMI 1640 for 48 h before starting the following experiments.
In vitro cell viability and apoptosis analysis of empty NPs
The cytotoxicity of empty NPs against A549 cell and A549/taxol cell was evaluated using WST-1 assay.33 Briefly, A549 cell and A549/taxol cell were seeded onto 96-well plates at a density of 5.0×10⁴ cells per well and cultured with 100 μL of DMEM medium at 37°C in 5% CO2 atmosphere for 24 h in overnight cultures. Then, the original medium was removed and the cells were incubated with fresh medium containing empty nanoparticles at different concentration, respectively. After 12 h and 24 h of incubation, 10 μL of WST-1 solution was added to each well and cultured for additional 4 h. Afterward, the cell viability was determined by measuring the absorbance at 450 nm using a micro-plate reader (Model 680; Bio-Rad, Hercules, CA, USA). The relative cell viability (%) was calculated using the following equation (3):
|
|

For apoptosis analysis, A549/taxol cell (1×10⁶) was seeded on 6-well plates and cultured with various concentrations of CS-ALG@TPGS-PLGA NPs at 37°C. After 48 h of incubation, the cells were harvested by trypsin digestion and centrifugation. Then the cells were washed three times with PBS. Finally, Annexin V-FITC/PI apoptosis detection kit (Becton-Dickinson, NJ, USA) was used to analyze the apoptotic efficacy by a flow cytometer (FACSCalibur).
In vitro cytotoxicity of drug-loaded NPs
The cytotoxicity of free drugs, drug-loaded NPs against A549 cell, and A549/taxol cell was evaluated using the standard WST-1 assays. Briefly, A549 cell and A549/taxol cell were seeded onto 96-well plates at a density of 5.0×10⁴ cells per well and cultured for overnight 24 h with 100 μL of DMEM medium or RPMI 1640 medium at 37°C in 5% CO2 atmosphere. Then, removing the original medium, tested cells were incubated, respectively, with fresh medium containing free DOX, free VCR, free (DOX plus VCR), CS-ALG@TPGS-PLGA-VCR NPs, CS-ALG-DOX@TPGS-PLGA NPs, and CS-ALG-DOX@TPGS-PLGA-VCR NPs at different concentrations. After 12 h and 24 h of incubation, 10 μL of WST-1 solution was added to each well and cultured for additional 4 h. Afterward, the cell viability was determined by measuring the absorbance at 450 nm using a microplate reader (Model 680; Bio-Rad). The relative cell viability (%) was estimated using the same equation (3).
The half maximal inhibitory concentration (IC50) values and the combination index (CI) were calculated according to equation (4).34
|
|

Where, DA and DB represent concentrations of drugs used in combination to achieve x% effectiveness; DX.A and DX.B represent concentration of single drug to achieve x% drug effect, respectively. The CI, as mathematical indicator for drug combination efficacy, is more accurate than a simple efficacy commentary.
The microtubule and the microfilament imaging analysis
A549 cell or A549/taxol cell was seeded on a coverslip in a 6-well plate (1×10⁵ cells/well) and incubated overnight in a 5% CO2 incubator at 37°C for attachment. Then the cells were washed and cultured with TPGS-PLGA (0.2 mg/mL) NPs, free VCR (5 μg/mL), and TPGS-PLGA-VCR NPs (5 μg/mL VCR-loaded NPs) for a given time at 37°C, respectively. Cells without treatment were used as control group. Tested cells were washed with PBS and treated with Hoechst 33342 (10 mg/mL) for 20 min. Subsequently, the cells were fixed with 4% paraformaldehyde at room temperature for 10 min, permeated with 1% BSA (Solarbio) in phosphate buffered saline containing 0.1% Tween-20 (PBST) for l h.
The cells were then exposed to tubulin-tracker red (1:250, diluted in PBST containing 1% BSA, for the microtubule) or actin-tracker green (8 unit/mL, diluted in PBST containing 1% BSA, for the microfilament) at 4°C for 20 min in the dark room. Then, the original medium containing tubulin-tracker red or actin-tracker green was removed and the cells were washed with ice-cold PBS. Finally, the microtubule or the microfilament of the cells was visualized under a CLSM.
Analysis of cell cycle
The cell cycle induced by empty NPs, free VCR, and drug-loaded NPs on A549/taxol cell was evaluated with cell cycle and apoptosis analysis kit. The cells were seeded at a density of 5×10⁵ cells per well in 6-well plates for 24 h at 37°C, and then treated, respectively, with the fresh medium containing TPGS-PLGA NPs (0.2 mg/mL), free VCR (5 μg/mL), and TPGS-PLGA-VCR NPs (dose of VCR 5 μg/mL). The cells without treatment were used as control. After incubating for 24 h, the cells were harvested by trypsin digestion and centrifugation. Subsequently, the obtained cells were fixed with 70% cold ethanol and stored at 4°C for 24 h. Ultimately, the cells were centrifuged again, washed with cold PBS twice, and stained with 0.5 mL of the staining solution at 37°C for 30 min in the dark. The stained cells were analyzed using a flow cytometer system (FACSCalibur). Each experiment was performed in triplicates.
Cellular drugs internalization
To clarify the cellular internalization of S@L NPs, we applied DOX’s intrinsic red fluorescence and a green fluorescent molecule C6 to visualize internalization and intracellular location of drugs or tracing NPs in cells. In all, 1×10⁵ A549 cell or A549/taxol cell was seeded on a coverslip in a 6-well plate and incubated overnight in a 5% CO2 incubator at 37°C for attachment. Then the cells were washed with PBS and treated, respectively, with 2 mL free DOX (5 μg/mL) or CS-ALG-DOX@TPGS-PLGA-C6 NPs (5 μg/mL DOX and C6-loaded NPs) for 2 h, 6 h, 12 h, and 24 h. Thereafter, the original medium was removed and the cells were treated with Hoechst 33342 (10 mg/mL) for 20 min to stain the nuclei. Finally, the cells were washed thrice with ice-cold PBS to remove residual Hoechst 33343 for CLSM visualization.
Lysosomal escape
To show the process of drug escape lysosomes, A549/taxol cell was treated with CS-ALG-DOX@TPGS-PLGA NPs (DOX concentration of 5 μg/mL) for 2 h, 6 h, 12 h, and 24 h at 37°C, respectively. Subsequently, the cells were treated with lyso-tracker green DND-26 (50 nM, diluted in PBST containing 1% BSA) for 60 min and Hoechst 33342 (10 mg/mL) for 20 min to stain, respectively, the lysosomes and the nucleus in a dark room. Finally, the cells were washed three times with ice-cold PBS for CLSM visualization.
Animal experiment
Animal
All procedures concerning animal experiments were carried out according to the National Institute of Health Guide for the Care and Use of Laboratory Animals (NIH publication 86-23, revised 1986), and were approved by the Animal Care and Use Committee of Nanjing Normal University and Animal Ethics Committee of Nanjing Normal University.
STOCK-Foxn1nu/Nju mice (5 weeks, 18–22 g) were purchased from Nanjing Biomedical Research Institute of Nanjing University (Nanjing, People’s Republic of China). The animals were maintained on a 12:12 h light-dark cycle with food and water provided ad libitum under constant temperature and humidity in a barrier facility.
Tumor-bearing mice model and administration procedure
A549 cells of the logarithmic growth phase were harvested by centrifugation and re-suspend in PBS to form cell suspension (5×10⁷ cells/mL). A 100 μL A549 cell (5×10⁶ cells/mL) suspension was injected on the roots of the upper thigh of tested nude mice.
The preparation period of tumor model needs about 7–10 days. Based on tumor size and physiological state, tumor-bearing mice were randomly divided into three groups (n=5): negative control group (saline), positive control group (free DOX plus VCR; DOX 2 mg/kg + VCR 2 mg/kg), and tested group (CS-ALG-DOX@TPGS-PLGA-VCR NPs, dose DOX 2 mg/kg + VCR 2 mg/kg).
The day of administration was defined as day 0 (D0). Following 18 days, saline or the formulations of drugs were administered by the tail intravenous injection for 7 times in an interval of 3 days.
Evaluation of antitumor efficiency
General conditions and weight gain of animals were observed during the administration period. At 24 h (D19) of the last drug administration, the mice were imaged with an in vivo imaging system (In-vivo DXS/F/FX PRO; Bruker). Then, animals were sacrificed, and then their some organs and tumor tissues were resected and weighed. Ratio of organ to body weight is defined as organic coefficient.
For antitumor efficiency evaluation, the size and appearance of tumor tissues were observed and photographed. Tumor tissues were weighed and the tumor coefficient was calculated. Tumor growth inhibition ratio (TGIR, %) was calculated with the following formula (5):35
|
|
where WC and WT are the constants of tumor growth in the control group and the tested group, respectively.
Then, the tumor was fixed with 4% paraformaldehyde solution, embedded in paraffin, and routine section and hematoxylin and eosin (H&E) staining were done for pathological examination under an optical microscope (Eclipse TI-SR; Nikon). In addition, cell apoptosis of tumor tissues was detected with transferase-mediated deoxyuridine triphosphate-biotin nick end labeling (TUNEL) method. TUNEL was performed using an in situ cell death detection kit (Roche Diagnostics, Basel, Switzerland) according to the manufacturer’s protocol. The result of apoptosis was observed under an optical microscope (Eclipse CI; Nikon).
Evaluation of organs toxicity
Some important organs, including heart, liver, spleen, kidney, and intestine, were collected for toxicity evaluation. After these samples were weighed and the organ coefficient (except intestine) was calculated, they were fixed with formalin, routine sections made, and stained with H&E staining solution for pathological examination under an optical microscope.
In vivo biodistribution of drugs
We also evaluated the in vivo tissue distribution of co-delivery NPs in tumor-bearing mice by quantitatively detecting the DiR fluorescence intensity in tumor tissues and some important organs. For the research, the near-infrared (IR) dye DiR was encapsulated into TPGS-PLGA NPs from TPGS-PLGA-DiR NPs. The preparation method of DiR-loaded NPs was the same as that of VCR-loaded NPs, except that VCR was replaced by 1 mg DiR.
Based on tumor size and physiological state, tumor-bearing mice were randomly divided into DiR group and TPGS-PLGA-DiR NP group (n=3). After administration with the formulations via tail vein injection, the mice were sacrificed at 24 h to collect tumor tissues and organs (liver, kidney, spleen, heart, and tumor) for further ex vivo fluorescence density analysis with an In-Vivo Imaging System.
Statistical analysis
All experiments were performed at least three times and presented as mean values ± standard deviation. Statistical significances were analyzed using the Student’s t-test. P<0.05 was considered statistically significant, and P<0.01 was considered highly significant.
Results and discussion
Preparation of NPs
In the study, based on some previous reports by other researchers,36 we designed and carried out pre experimental research. We set the ratios of VCR/DOX (1:1, 3:1, 5:1) to study the inhibitory effect of A549 cell under different ratios. We found that cell survival rate was 40.8% when the ratio of VCR/DOX was 1:1. However, when the ratios of VCR/DOX are in 3:1 and 5:1, the cell survival rate were 52.3% and 54.1%, respectively. Finally, we chose the group of 1:1 for future study.
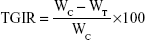
We prepared CS-ALG-DOX@TPGS-PLGA-VCR NPs by double-emulsion method and the coaxial electro-dropping technique founded in our previous approach (Figure 1).28 First, the electrostatic interaction between DOX (positively charged amino) and ALG (negatively charged carboxyl) was tailored to form DOX-loaded inner NPs (CS-ALG-DOX NPs). During the first emulsion, CS-ALG-DOX NPs (in deionized water) that served as an aqueous phase were encapsulated in a mixture of PLGA and the hydrophobic drug VCR (in acetone) to form the water-in-oil framework. During the second emulsion, TPGS (in deionized water) emerged as an emulsifier covered in the surface of the resultant to form the water-in-oil-water structure (CS-ALG-DOX@TPGS-PLGA-VCR NPs).
 | Figure 1 Preparation scheme of co-delivery nanoparticles. |
Physical and chemical characterization
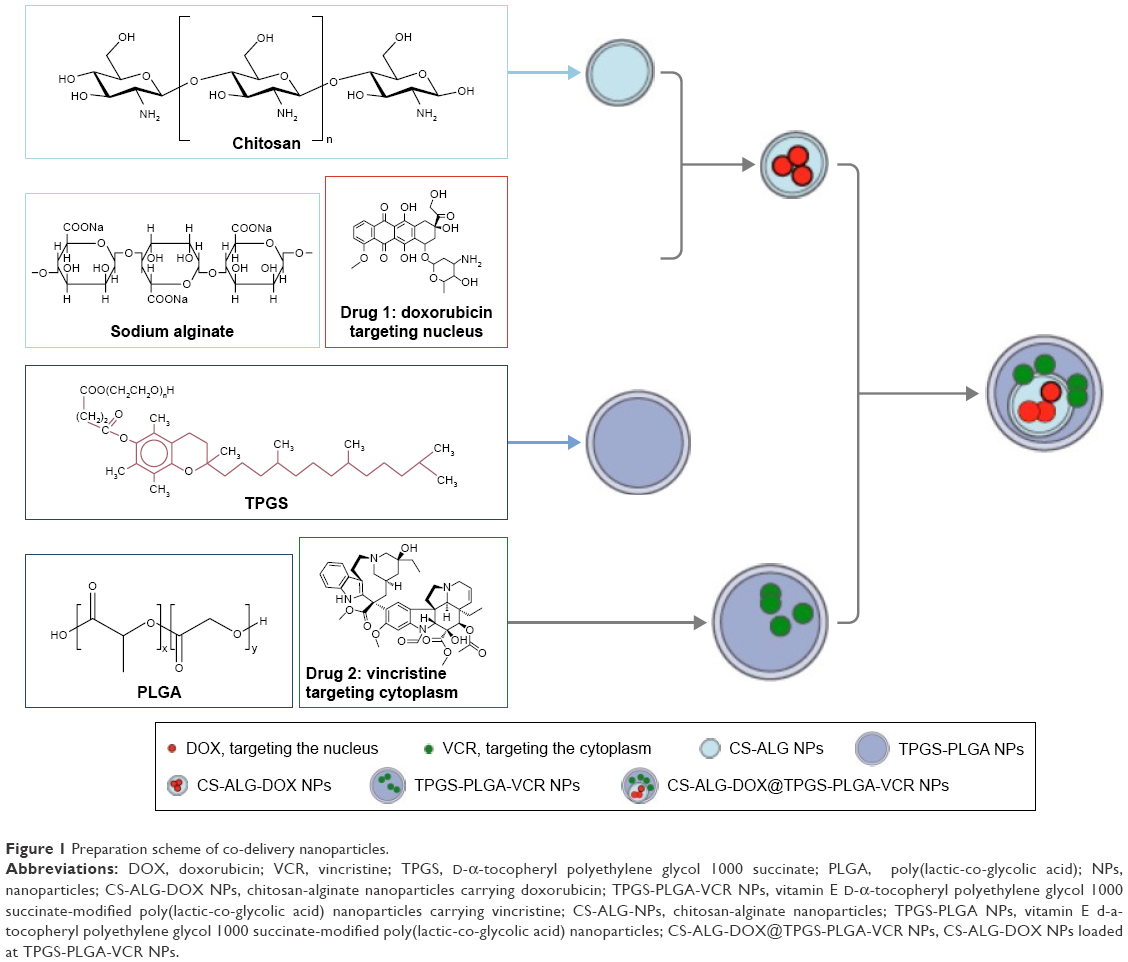
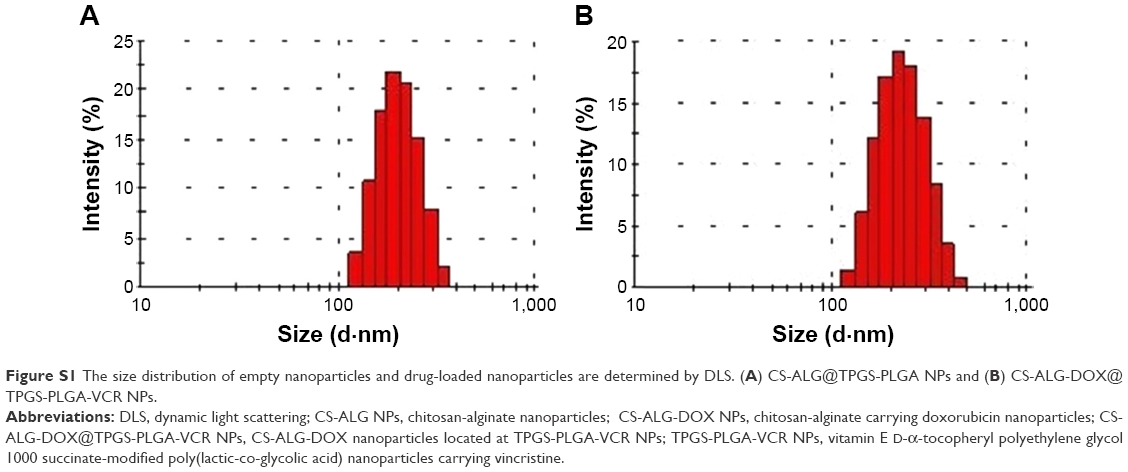
The surface properties of empty NPs (CS-ALG NPs, CS-ALG@TPGS-PLGA NPs) and drug-loaded NPs (CS-ALG-DOX NPs, CS-ALG-DOX@TPGS-PLGA-VCR NPs) were observed under TEM (Figure 2A) and SEM (Figure 2B). As showing in Figure 2A, CS-ALG NPs were approximately spherical in shape with a diameter of 10–40 nm. CS-ALG@TPGS-PLGA NPs were well-proportioned smooth spheres with a diameter of about 200 nm. Furthermore, morphology and diameter were almost unsusceptible by the presence of two anticancer drugs (Figure 2B). In addition, DLS results demonstrated that the size and monodispersity of S-D1@L-D2 NPs were not affected by the incorporation of the inner NPs and hydrophobic drug VCR (Figure S1A and B, Table S1).
 | Figure 2 Physicochemical characterization of empty nanoparticles and drug-loaded nanoparticles. (A) TEM and SEM images of CS-ALG NPs and CS-ALG@TPGS-PLGA NPs. (B) TEM and SEM images of CS-ALG-DOX NPs and CS-ALG-DOX@TPGS-PLGA-VCR NPs. (C) The fluorescence images of CS-ALG-DOX@TPGS-PLGA-C6 NPs with CLSM. |
Because VCR does not have fluorescence property, we had synthesized CS-ALG-DOX@TPGS-PLGA-C6 NPs to prove that CS-ALG-DOX NPs and hydrophobic drug VCR are being co-encapsulated into a single outer NP. In this fluorescent tracer system, C6 and DOX appear as green and red fluorescence, respectively. As shown in Figure 2C, yellow fluorescence appeared at the center site of the NPs, which denoted the superimposition of red (DOX) and green (C6) fluorescence. As a result, we could conclude that CS-ALG-DOX NPs and hydrophobic drug were co-encapsulated into the outer nanoparticles (PLGA-TPGS NPs). The image of electron microscope displayed that the S-D1@L-D2 NPs has the appropriate size approximately 200 nm in diameter. It is propitious for S-D1@L-D2 NPs to transport through blood vessels and retain in circulation for long periods, as well as internalize by means of endocytosis.25,37,38 Its inner smaller NPs of approximately 20 nm are suitable for entering the nucleus through the nuclear pore of MDR cell.39 Fluorescence tracer technique proved that the small NPs certainly existed in the large NP.
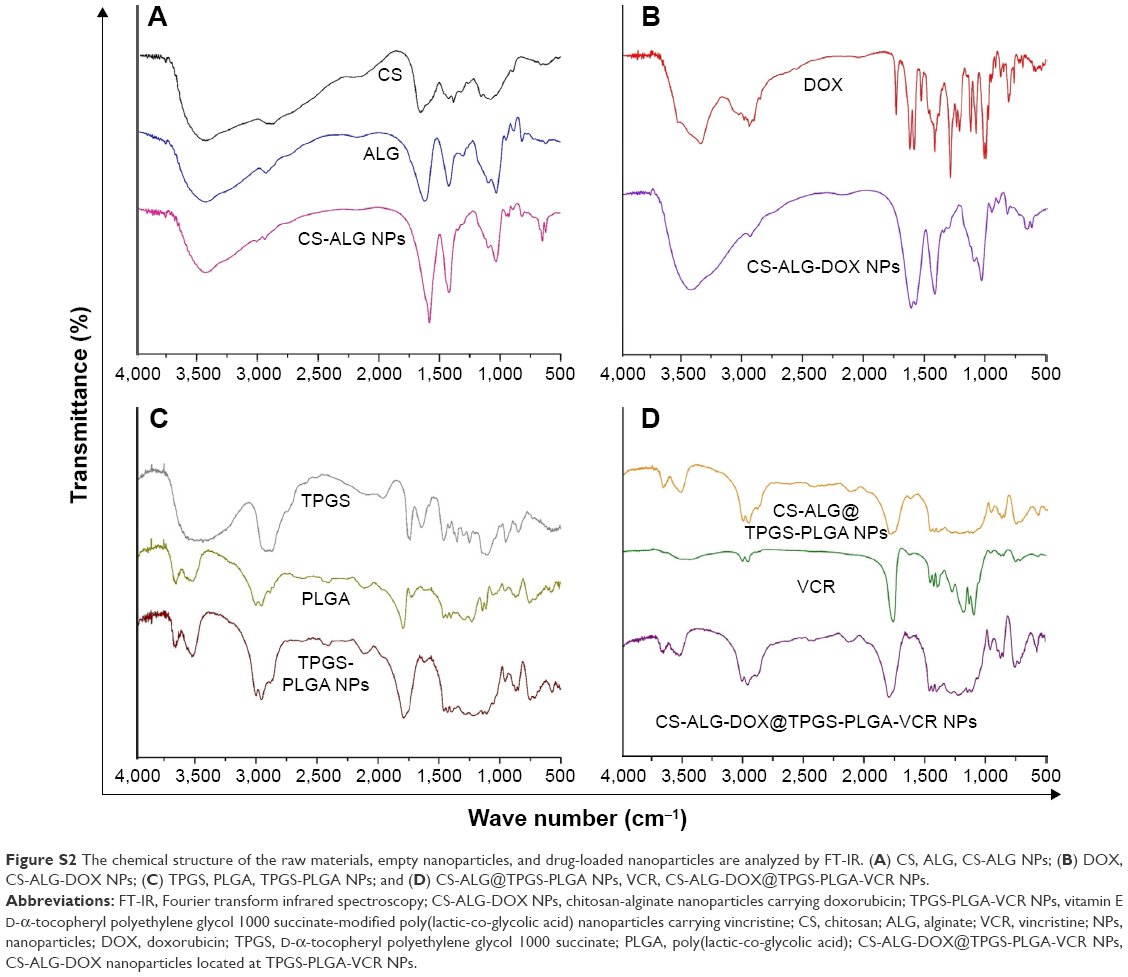
The chemical characterization of the raw materials, empty NPs, and drugs-loaded NPs was testified by FT-IR (Figure S2). FT-IR was adopted to characterize the potential interactions of biomaterials in these NPs. FT-IR spectra of ALG, CS, DOX, CS-ALG NPs, and CS-ALG-DOX NPs are shown in Figure S2A and B. The IR spectrum of ALG shows the basic peaks at 1,618 cm−1 and 1,427 cm−1, assigned to the asymmetric and symmetric stretching of carboxylate salt groups. Additionally, a band around 1,099 cm−1 (C-O-C stretching) can be attributed to its saccharide structure. The characteristic peaks of CS locate at 3,444 cm−1 (O-H stretch and N-H stretch, overlap), 2,885 cm−1 (C-H stretch), 1,164 cm−1 (bridge-O-stretch), and 1,078 cm−1 (C-O stretch), respectively. From the IR spectrum of CS-ALG NPs, the asymmetrical stretching of -COO- groups is moved to 1,579 cm−1, and the symmetrical stretching of -COO- groups is shifted to 1,419 cm−1. The stretching vibrations of -OH and -NH2 at 3,444 cm−1 shift to 3,434 cm−1. DOX shows characteristic peaks at 1,581 cm−1 and 1,617 cm−1 (C=C of the benzene ring). A band around 2,911 cm−1 of DOX is attributed to the stretching of the methyl groups. DOX also displays a characteristic peak of C-O at 1,286 cm−1 and a band of O-H abound 3,326 cm−1, which are evidences of the presence of a phenolic hydroxyl group. The peak at 1,729 cm−1 (C=O stretching) attributes to its cyclic ketone structure. The characteristic absorption bands of DOX appear in CS-ALG-DOX NPs, which probably indicates that DOX is filled in the polymeric network. These results manifest that the carboxylic groups of ALG are associated with the amine groups of CS through electrostatic interactions to form the polyelectrolyte complex.
FT-IR spectra of TPGS, PLGA, VCR, and TPGS-PLGA NPs are given in Figure S2C and D. In the spectrum of TPGS, the broad band at 3,471 cm−1 is due to –OH stretching. The absorption band of the stretching of CH3 in the ester group and the benzene ring locates at 2,896 cm−1; the peaks at 1,739 cm−1 and 1,249 cm−1 belong to the C=O and C-O stretching of the ester group. In the spectrum of PLGA, the broad band at 3,648 cm−1 is caused by –OH stretching. The peaks found at 1,610 cm−1 and 1,294 cm−1 are the C=O and C-O stretching of carboxylic acid. Peaks at 1,791 cm−1 and 1,224 cm−1 belong to the C=O and C-O stretching of the ester group. In the spectrum of TPGS-PLGA NPs, the C=O and C-O stretching of carboxylic acid shifts to 1,614 cm−1 and 1,298 cm−1, respectively, the C=O and C-O stretching of the ester group shifts to 1,791 cm−1 and 1,282 cm−1, respectively. VCR displays a characteristic peak at 3,002 cm−1 (C-H stretching vibration of aromatic hydrogen); the peaks at 1,758 cm−1 and 1,633 cm−1 belong to the COO- stretching vibration and C=O stretching of the amide group. FT-IR spectra showed that S-D1@L-D2 NP was not a physical blend of various carrier materials with drugs but a chemical combination of them. In summary, the results of these physicochemical characteristics indicated that a novel Co-NDDS had been successfully prepared.
Zeta potential l of CS-ALG-DOX NPs was +10.6 mV, and the zeta potential of TPGS-PLGA-VCR NPs was −35.6 mV. The zeta potentials of CS-ALG-DOX@TPGS-PLGA NPs and CS-ALG-DOX@TPGS-PLGA-VCR NPs were increased to −27.6 mV and −24.6 mV, respectively. This was possibly due to the presence of excess positive charges in CS and DOX (Table S1).
The EE and LE of various NPs are summarized in Table S1. The EE and the LE of CS-ALG-DOX@TPGS-PLGA NPs, CS-ALG@TPGS-PLGA-VCR NPs, and CS-ALG-DOX@TPGS-PLGA-VCR NPs could reach around 82%–89% and 5%, respectively.
These results of physical and chemical characterization indicated that our co-delivery NPs were successfully prepared on our previously approach.
Biphasic release pattern of drugs in vitro
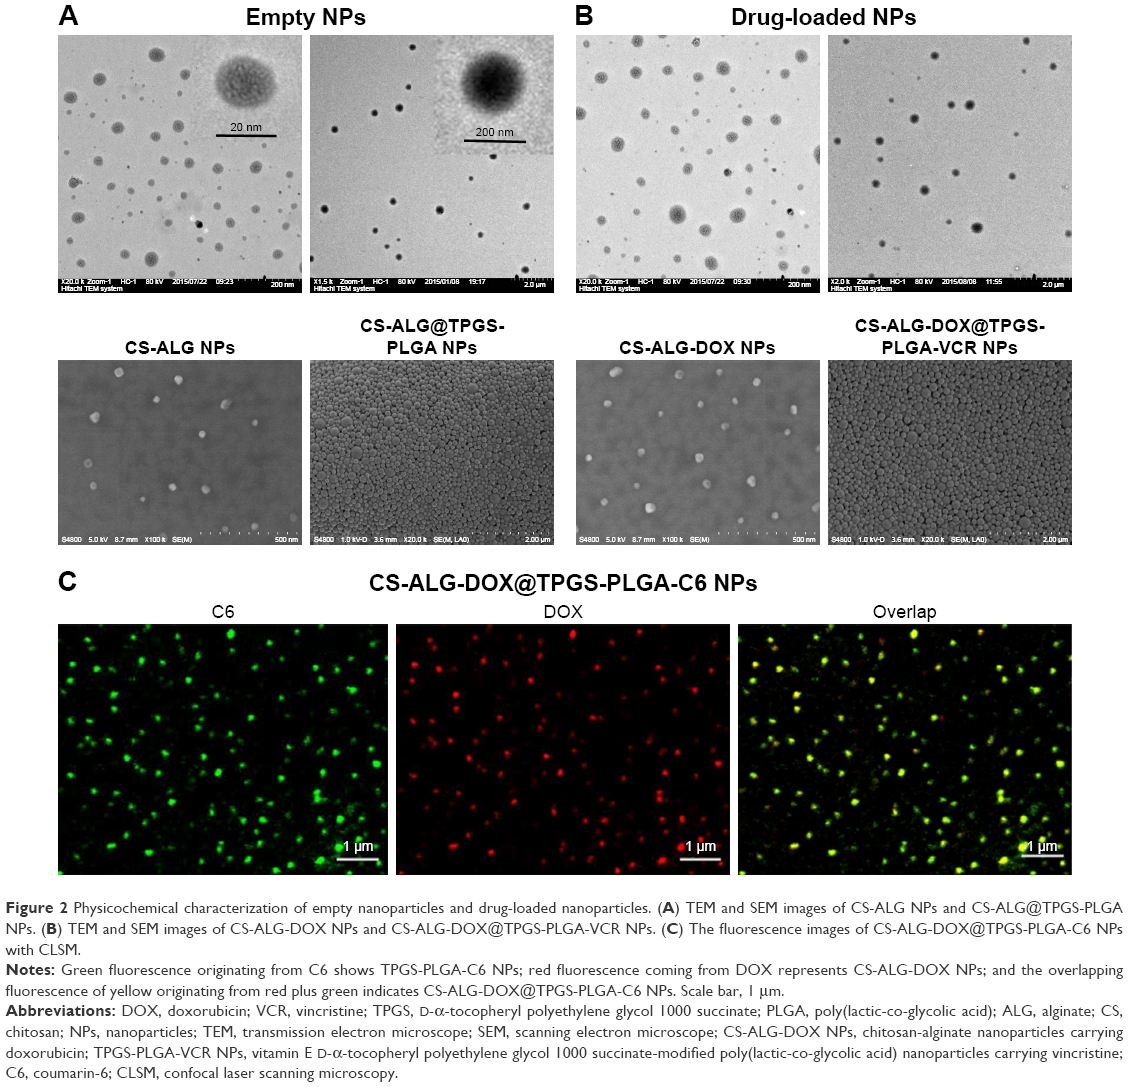
Figure 3 shows in vitro release pattern of inner NPs and drugs from S@L NPs (CS-ALG@TPGS-PLGA NPs and CS-ALG@TPGS-PLGA-VCR NPs) and CS-ALG-DOX NPs at different pH values.
 | Figure 3 In vitro release characteristics of the nanoparticles with pH sensitivity. (A) TEM images of CS-ALG@TPGS-PLGA NPs incubated with PBS at pH 7.4 for 6 h. (B) TEM images of CS-ALG@TPGS-PLGA NPs incubated with PBS at pH 5.0 for 6 h. (C) The release curve of VCR from CS-ALG@TPGS-PLGA-VCR NPs in PBS (pH 7.4 and pH 5.8). (D) The release curve of DOX from CS-ALG-DOX NPs in PBS (pH 7.4, pH 5.8, and pH 5.0). |
First, the release characteristic of inner smaller NPs from CS-ALG@TPGS-PLGA NPs was determined at pH 7.4 (a pH condition of blood or normal organs) or pH 5.8 (a pH condition of cancer cytoplasm) under TEM. At pH 7.4, S@L NPs presented a faultless spherical form and maintained the original diameter of about 200 nm. It indicated that inner NPs had not been released from S@L NPs (Figure 3A). However, at pH 5.8, slight swelling and apparent cleavage appeared in CS-ALG@TPGS-PLGA NPs. Thus, we could find some smaller NPs, which released from the larger NPs (Figure 3B). These results indicated that CS-ALG@TPGS-PLGA NPs could retain stability in a neutral blood environment and release inner small NPs in an acidic tumor cell environment.
Second, we detected drug release pattern of used drug-loaded NPs (CS-ALG@TPGS-PLGA-VCR NPs and CS-ALG-DOX NPs) in simulant extracellular and intracellular pH environment with the classical method of cumulative drug release.40–42 Figure 3C indicates the characteristic of VCR released from outer NP at pH values of the cancer cytoplasm (pH 5.8) and blood or normal organs (pH 7.4). Under a condition of pH 5.8, the cumulative release amount of VCR released from CS-ALG@TPGS-PLGA-VCR NPs was 63.8% during 24 h and 78.6% during 60 h. Nevertheless, the cumulative release amount of VCR only was 14.9% at 24 h and 19.5% at 60 h under a condition of pH 7.4.
Figure 3D presents the characteristic of DOX released from inner NPs (CS-ALG-DOX NPs) at pH values of the intracellular environment, including the lysosomes (pH 5.0), the cytoplasm (pH 5.8), and the nucleus (pH 7.4). Under a condition of pH 7.4, the cumulative release amount of DOX was 68.1% for 24 h, and reached 82.9% for 60 h. For comparison, during 60 h, CS-ALG-DOX NPs released only the DOX cumulative amount of 36.8% and 21.9% at pH 5.8 and pH 5.0, respectively.
Our results elucidated that S-D1@L-D2 NPs were typical pH-sensitive NPs with the character of biphasic and sequence release. The outer NPs and inner NPs exhibited different release characteristics. While S-D1@L-D2 NPs were transported in blood and normal organs, they slightly unloaded VCR and did not release inner smaller NPs, CS-ALG-DOX NPs. Furthermore, after the S-D1@L-D2 NPs entered the cancer cytoplasm, smaller NPs and loaded VCR would be released rapidly from larger NP in the cytoplasm with acidic pH conditions. This moment, VCR exerted the anticancer effect by acting on its pharmacological target microtubules, and CS-ALG-DOX NPs in the cytoplasm would undergo the influence of acidic pH value from the cytoplasm, lysosomes, and endosomes. In fact, CS-ALG NP is stable in the acidic cytoplasm of the cancer cell lines from our result. However, it released the loaded drug in the pH value of physiological environments.31,43,44 Our research also demonstrated that CS-ALG NP released a great deal of DOX at pH 7.4 (also as a pH value of the nucleus). These results intimated that CS-ALG NP was not suitable as a nanodelivery carrier of anticancer drug. However, if CS-ALG NPs are assembled into a larger NP such as TPGS-PLGA NPs, it will be an intelligent idea to keep stable in a physiological environment. Various studies reported that TPGS-PLGA NPs had a pH-triggered drug-release behavior under acidic pH environment.27,45–47 As CS-ALG-DOX NPs enter the nucleus, the release of DOX in the nucleus with pH 7.4 would produce the cytotoxic effect on DNA.
From the in vitro drug release experiment, we had proved that S-D1@L-D2 NP was a Co-NDDS with pH-sensitive and biphasic release pattern of drugs in vitro, and preliminary conjectured that it could reduce the toxic and adverse effects on the normal organs and increase the anticancer effects of drugs.
In vitro biological effect
Cell viability of empty NPs
Cell viability of empty NPs is presented in Figure S3. Figure S3A and B shows the cytotoxicity of empty NPs (CS-ALG NPs and CS-ALG@TPGS-PLGA NPs) on A549 cell and A549/taxol cell. CS-ALG NPs exhibited negligible effect on the viability of A549 cell and A549/taxol cell at 12 h and at 24 h in wide range concentrations (from 0.0625 mg/mL to 1.0 mg/mL). However, after 24 h of exposure, CS-ALG@TPGS-PLGA NPs displayed slight cytotoxicity at the concentrations of 1 mg/mL on A549 cell and A549/taxol cell. It maybe for this reason that TPGS affected the generation of ATP energy by affecting the mitochondria.24,27,46
The effect of CS-ALG@TPGS-PLGA NPs on apoptosis of MDR cell was explored by flow cytometer technique. As shown in Figure S3C, the NPs had a mild apoptosis on A549/taxol cell at the concentration of 1.0 mg/mL for 24 h. The results proved that the empty NPs are basically safe.
Cytotoxicity of drug-loaded NPs
The cytotoxicity of model drugs in various pharmaceutical formations on A549 cell and A549/taxol cell was examined using WST-1 method (Figure S4).27 The results indicated that the cytotoxicity of all kinds of drug-loaded NPs was higher than that of the free drugs in the same concentration. The cytotoxicity of CS-ALG-DOX@TPGS-PLGA-VCR NPs with different concentrations at different times on A549 cell was stronger than that of free VCR plus DOX (Figure S4A). It is worth noting that the difference was very significant in lower concentrations from 0.1 to 1.0 μg/mL (P<0.01) and significant at 3.0 μg/mL (P<0.05); however, the toxicity inclined to similar at higher concentration of 10 μg/mL (P>0.05). For A549/taxol cell (Figure S4B), the co-delivery NPs at all the tested concentrations from 0.1 μg/mL to 10 μg/mL had superiority cytotoxicity at 12 h and 24 h compared with free VCR plus DOX (P<0.01).
In vitro cytotoxicity of drug-loaded NPs and IC50 and CI50 values of different formulations are presented in Table S2. We compared the in vitro cytotoxicity of loaded drug NPs with free drugs (VCR, DOX, VCR plus DOX) on A549 cell and A549/taxol cell based on IC50 value. For single loaded drug NPs, IC50 of the NPs on the tested cell lines was less than free drugs, except free DOX on A549 cell at 12 h. The possible reason was that the amount of DOX released from inner smaller NPs was limited at 12 h. The exciting result was that the cytotoxicity of CS-ALG-DOX@TPGS-PLGA-VCR NPs on A549 cell and A549/taxol cell at 12 h is 19.5 times and 5.23 times of free VCR plus DOX, respectively. At 24 h, the cytotoxicity of the co-delivery NPs on A549/taxol cell also had reached 6.24 times as much as that of two free loaded drugs.
Combination chemotherapy can result in synergistic, additive, or antagonistic interaction effects at different concentration ratios.3 Based on the CI,34 CS-ALG-DOX@TPGS-PLGA-VCR NPs had evident synergistic effects (CI <1); nevertheless, combination chemotherapy of free anticancer drugs only had slight synergistic effects (CI value is approximately equal to 1) (Table S2). This result meant that co-delivery S@L NPs could decrease the dose of anticancer drugs in combination chemotherapy and was expected to ameliorate the anticancer efficacy and reduce the adverse effect.
Microtubule imaging and cell cycle analysis
The potent synergistic effect of CS-ALG-DOX@TPGS-PLGA-VCR NPs was verified based on in vitro cytotoxicity test. Because VCR as a microtubule-destabilizing agent has the ability to advance the microtubule disassembly to arrest the cells in the metaphase phase of cell cycle,18,48 we ascertained the efficacy on the subcellular level with CLSM method and flow cytometer (Figure 4). We visualized, respectively, the structural modification of the microtubule and the microfilament in A549 cell and A549/taxol cell induced by TPGS-PLGA NPs, free VCR, and TPGS-PLGA-VCR NPs applying tubulin-tracker red and actin-tracker green as fluorescence probes (Figure 4A–D).
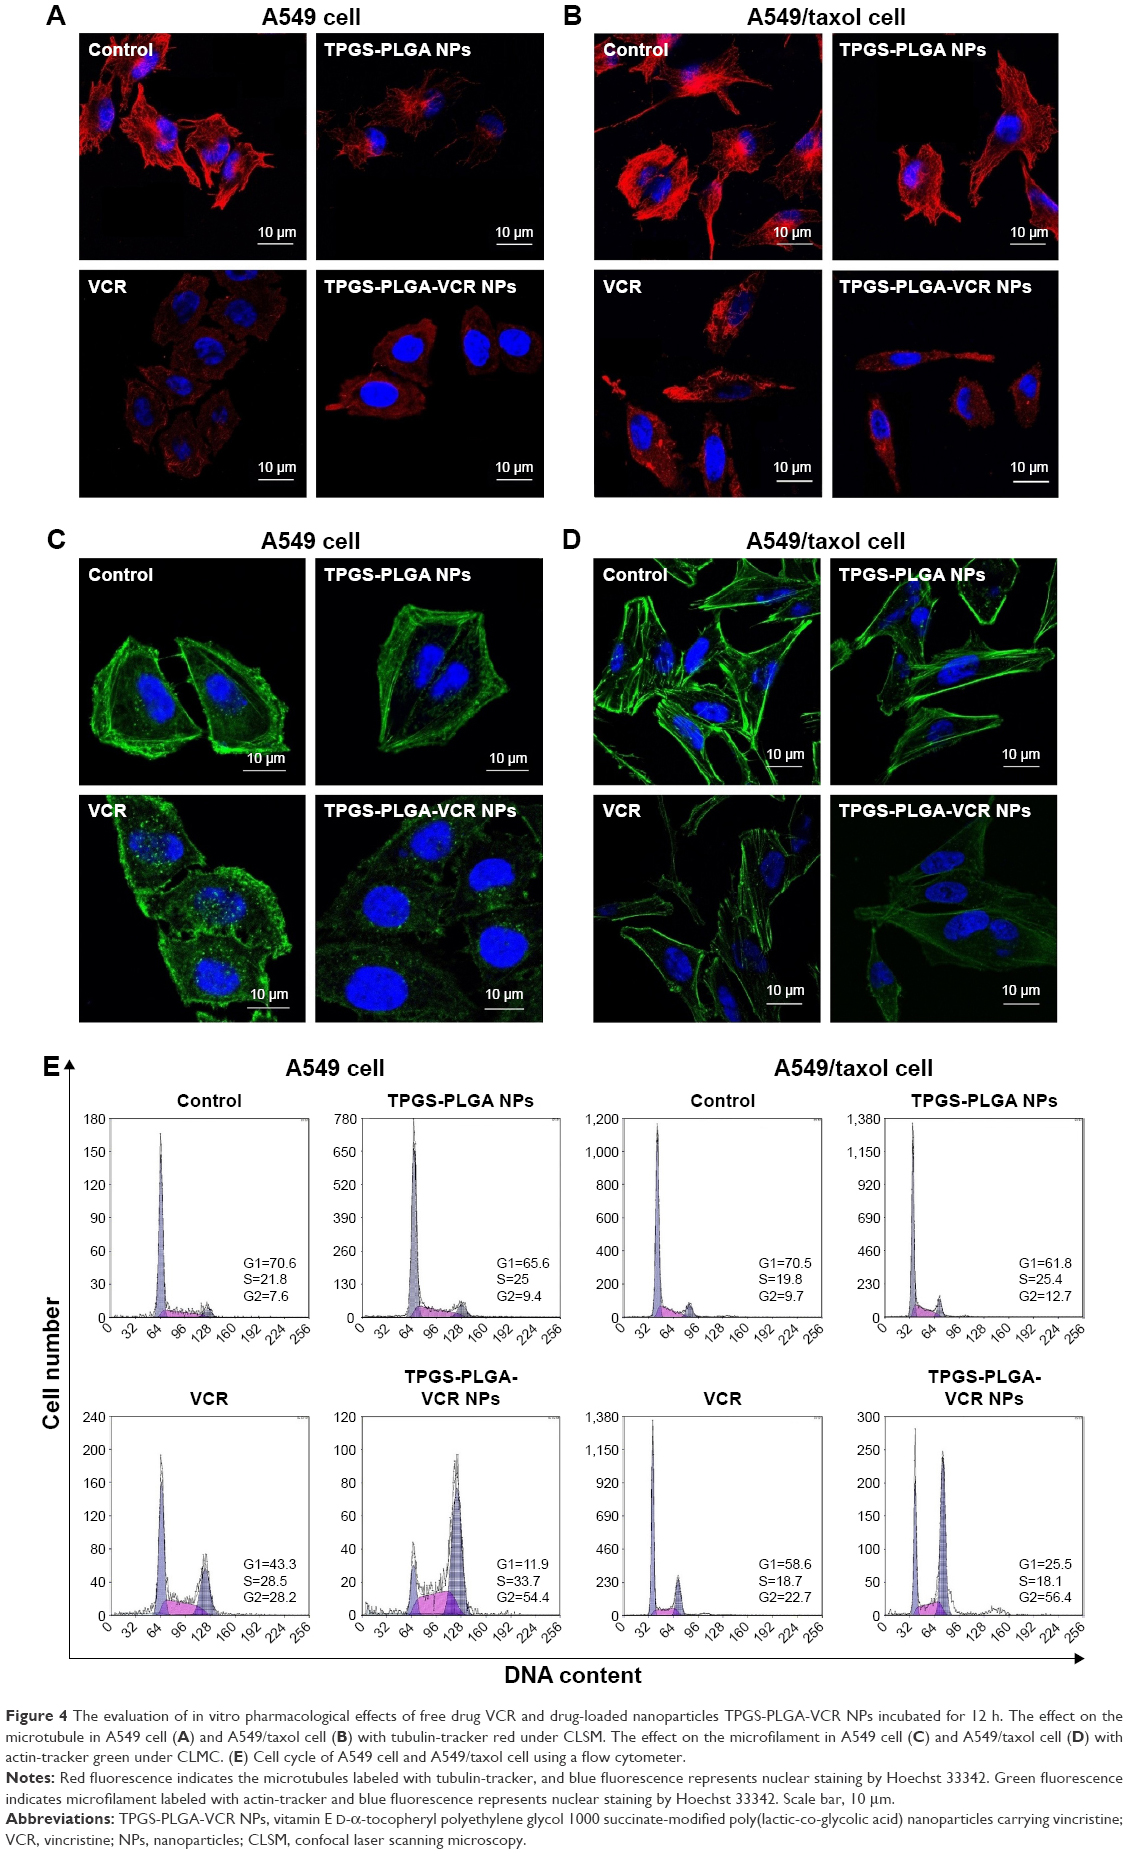 | Figure 4 The evaluation of in vitro pharmacological effects of free drug VCR and drug-loaded nanoparticles TPGS-PLGA-VCR NPs incubated for 12 h. The effect on the microtubule in A549 cell (A) and A549/taxol cell (B) with tubulin-tracker red under CLSM. The effect on the microfilament in A549 cell (C) and A549/taxol cell (D) with actin-tracker green under CLMC. (E) Cell cycle of A549 cell and A549/taxol cell using a flow cytometer. |
The well-structured microtubule in both the tested cell lines could be visualized in the control group. Moreover, the microtubule in A549 cell and A549/taxol cell still had an intact structure in the TPGS-PLGA NPs group. However, in the free VCR group, microtubules presented disorderly filamentous arrangement, curved shape, and disintegrated structure, especially in A549 cell. TPGS-PLGA-VCR NPs induced severe microtubule damage and cytotoxicity in both the tested cell lines compared with free VCR. These damages included the disappearance of microtubule filaments and appearance of nuclear condensation (Figure 4A and B).
In addition to binding on the tubulin, VCR can also affect the structure and function of the microfilament by combining actin in cancer cells. Therefore, we also observe the effect on microfilament (Figure 4C and D). As shown in Figure 4C, the broken and dispersed green fluorescence filaments indicated that free VCR had a significant impact on the microfilaments of A549 cell. Yet TPGS-PLGA-VCR NPs had an immense damage effect on the microfilaments, for example, filamentous structure presented mistiness and disappeared. In A549/taxol cell, the damage on the microfilaments structure induced by free VCR and TPGS-PLGA-VCR NPs is generally lighter than that of A549 cell (Figure 4D). The microfilaments were basically in the longitudinal direction and the damage of structure was not significant. It is worth noting that, in the same cell line, TPGS-PLGA-VCR NPs impelled more apparent damage on microfilaments compared with free VCR.
It is generally considered that VCR arrests cell cycle at the G2/M phase and does not obviously act on the S phase.19 So, the cell counts of the G2/M phase should increase obviously. Subsequently, we considered the effects of free VCR and TPGS-PLGA-VCR NPs on the cell cycle of A549 cell and A549/taxol cell (Figure 4E). Results showed that the control group and the TPGS-PLGA NPs group had almost no effect on the cell cycle of A549 cell and A549/taxol cell. However, it was gratifying that the cell count of the G2/M phase of the TPGS-PLGA-VCR NPs group was respectively near 2-folds and about 2.5-folds of free VCR group in A549 cell and A549/taxol cell. These results indicated that TPGS-PLGA-VCR NPs obviously improved the pharmacological effects of VCR.
In this section, we compared the pharmacological effects of VCR on A549 cell and A549/taxol cell using two types of formulation, TPGS-PLGA-VCR NPs and free VCR. Because VCR is a kind of P-gp substrate,49 we also selected a MDR cell line A549/taxol cell in this experiment.24 Although free VCR can enter into the cytoplasm and engender the effect by targeting the microtubule, the efflux related to P-gp may reduce the drug concentration in the cytoplasm to diminish the effect. Therefore, the damage of the microtubules and microfilaments in A549/taxol cell was weaker than that of A549 cell.
However, in the same cell line, the effect of TPGS-PLGA-VCR NPs on the microtubules and microfilaments was evidently stronger than that of free VCR. We considered that the biological materials in the Co-NDDS played a crucial role. While TPGS-PLGA-VCR NPs enter the cancer cell, following VCR release from TPGS-PLGA-VCR NPs, on the one hand, VCR bound to microtubule protein (tubulin) and microfilament protein (actin) induces the depolymerization of the microtubule and the sparseness of microfilament; on the other hand, TPGS-PLGA NPs can interfere with the structure and function of P-gp by affecting the mitochondria and the cytomembrane.24,27 In particular, TPGS has been recognized to modulate efflux pump activity as a P-gp interference agent, which can influence ATPase activity and cytomembrane fluidity.50,51 As a result, the concentration of VCR in the cells can be increased obviously, so that its effect is further enhanced.
Cellular internalization and subcellular location of loaded drugs
To investigate the detail internalization and intracellular location of drugs in cancer cell, CS-ALG-DOX@TPGS-PLGA-C6 NPs and free DOX were incubated with A549 and A549/taxol cell, respectively (Figures S5 and 5).
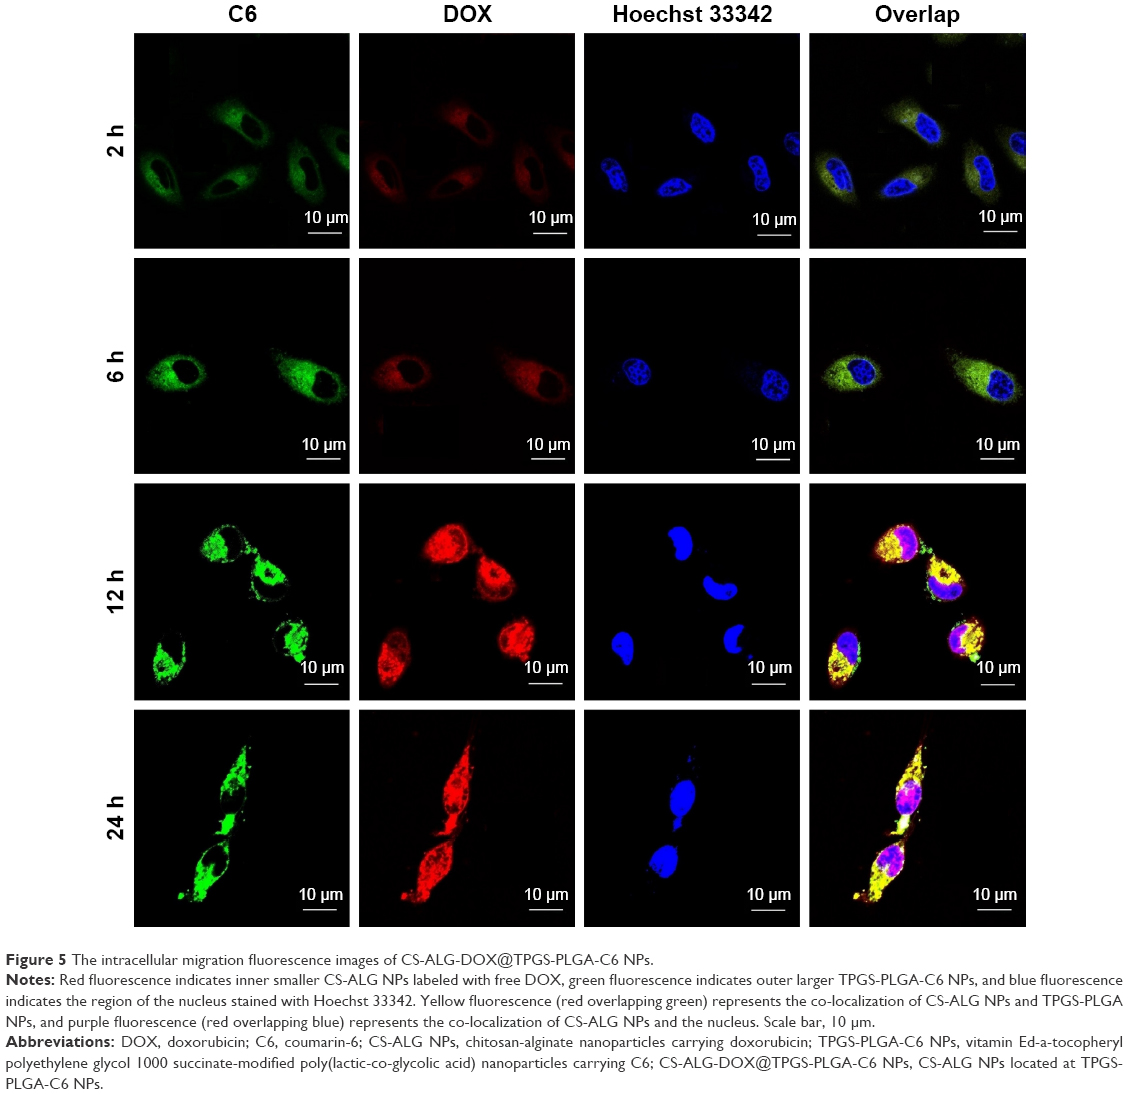 | Figure 5 The intracellular migration fluorescence images of CS-ALG-DOX@TPGS-PLGA-C6 NPs. |
First, we researched whether free DOX can enter into the nucleus in two kinds of tested cell lines, A549 cell and its MDR cell line A549/taxol cell (Figure S5). Under CLSM, DOX and Hoechst appear as red and blue fluorescence, respectively; and purple fluorescence implies the amalgamation of Hoechst 33342 with DOX fluorescence. In A549 cell, red fluorescence could be observed in the cytoplasm at 10 min, and purple fluorescence appeared in the nucleus at 1 h and was stronger and stronger from 1 h to 6 h. It was at its peak value at 2 h. The result indicated that free DOX could adequately enter the nucleus of A549 cell (Figure S5A). Yet for A549/taxol cell, the gradually increased red fluorescence in the cytoplasm represented the internalization procedure of free DOX from the uptake to the cytoplasmic location from 10 min to 2 h. The red fluorescence density in the cytoplasm reached the highest value at 2 h. At 6 h, the cytoplasmic red fluorescence density obviously dwindled. However, there was no noticeable purple fluorescence in the nucleus. The result suggested that it was sometimes difficult for free DOX to enter the nucleus of A549/taxol cell (Figure S5B).
Afterward, we inspected the internalization procedure and intracellular location of the drugs with S-D1@L-D2 NPs in A549/taxol cell using fluorescent tracer technique (Figure 5). Owing to VCR loaded in larger NPs without fluorescence property, we prepared CS-ALG-DOX@TPGS-PLGA-C6 NPs for the purpose of fluorescent tracing. In this fluorescent tracer system, C6 and DOX appear as green and red fluorescence, respectively. Furthermore, we utilized Hoechst 33342 to trace the nucleus of the MDR cell. So, under CLSM, yellow fluorescence is the overlap of red (DOX) and green (C6) fluorescence, and purple fluorescence represents the merging of blue (Hoechst 33342) with red (DOX) fluorescence. We could find that yellow fluorescence density becomes gradually stronger with prolonged incubation time in the cytoplasm from 10 min to 6 h. However, green fluorescence was never found in the nucleus of the MDR. DOX was mainly distributed in the cytoplasm from 10 min to 1 h. At 2 h, yellow fluorescence gathered in the cytoplasm and purple fluorescence had distributed and migrated around the nucleus. At 6 h, purple fluorescence had distributed in the nucleus.
The drugs’ precision release of Co-NDDS in subcellular domains is particularly important for cytotoxic drugs targeting different organelles, such as microtubule and mitochondria, and the nucleus.48 Moreover, while some anticancer drugs belonging to the P-gp substrates, such as DOX,46 were loaded into Co-NDDS; increasing intracellular concentration of the drugs became a pivotal challenge. Conventional countermeasures are increasing uptake and decreasing P-gp-related efflux.
However, for the drug targeting the nucleus, many NDDSs released loaded drug into the cytoplasm. In this condition, it was difficult for the released drug to escape the foreordination of efflux related to P-gp. It is one of the strategies to deliver directly drug-loaded NPs into the nucleus and then to release the drug here. Recently, we reported that CS/PAA/VP-16@TPGS/PLGA NPs can deliver CS/PAA/VP-16 NPs into the nucleus of A549/DDP cell and release the drug.28 On this basis, we prepared the co-delivery S-D1@L-D2 NPs with subcellular precision release as testified in the aforementioned in vitro release test and fluorescence tracer test. Our CS-ALG-DOX NPs released DOX directly into the nucleus instead of the cytoplasm, which was different from the drug release characteristic of core-shell based nano depot reported by Jiang et al.13 Therefore, S-D1@L-D2 NPs will deliver the drug into the nucleus by avoiding the P-gp correlative drug efflux. As a result, DOX can be efficiently accumulated in the nuclei to exert faultlessly its pharmacological effect. The result further proved that S-D1@L-D2 NP is a type of NPs with the character of precision release in subcellular domains of MDR cell.
Endosomal escape
Endosomal escape was considered one of primary restrictions in carrying drug from the extracellular domain into the nucleus of cancer cell.40 In the section, we investigated whether smaller NPs, CS-ALG-DOX NPs, could endure the acidic condition of cytoplasm and lysosome or endosome with lyso-tracker green DND-26 as a fluorescence probe (Figure 6). From 2 h to 24 h, red fluorescence coming from CS-ALG-DOX NPs increased gradually in the cytoplasm A549/taxol cell. In this process, the green fluorescence-labeled lysosomes overlapped the part of red fluorescence. This phenomenon suggested that CS-ALG-DOX NPs had been in the lysosome. However, the red fluorescence appeared in the nucleus from 12 h to 24 h. It showed that CS-ALG-DOX NPs had left the lysosome and had successfully entered the nucleus of MDR cell.
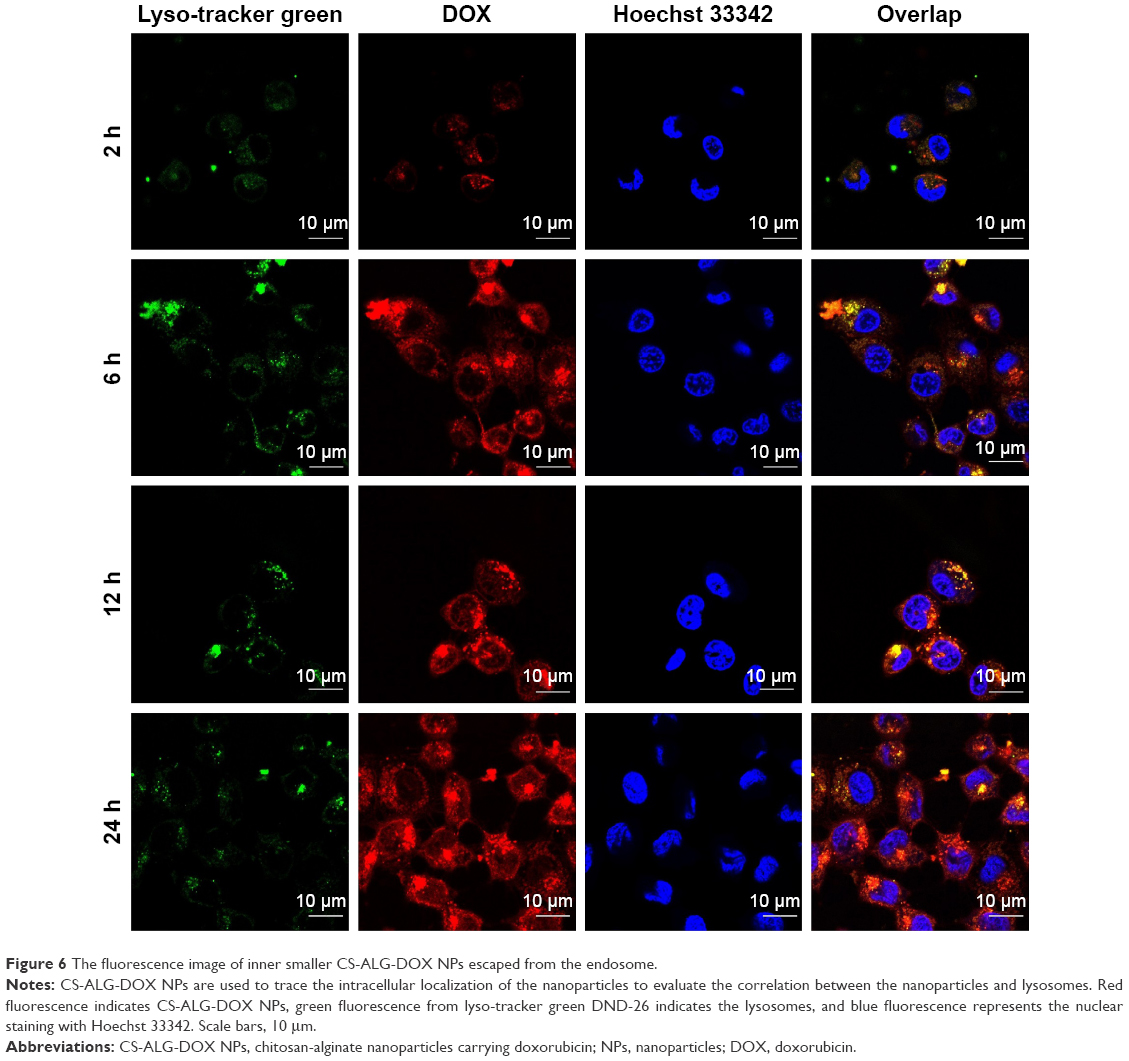 | Figure 6 The fluorescence image of inner smaller CS-ALG-DOX NPs escaped from the endosome. |
CS-ALG-DOX@TPGS-PLGA NPs with a diameter of about 200 nm were taken into the cytoplasm by virtue of endocytosis of MDR cell,27,37 and then released smaller NPs, CS-ALG-DOX NPs. Although CS-ALG-DOX NPs are propitious to DOX escape from P-gp-related efflux as demonstrated by the aforementioned experiments, the NPs in the cytoplasm may face another threat coming from the lysosome or endosome. CS-ALG-DOX NPs were stable in the acidic cytoplasm of the cancer cell as found in our in vitro drug release test, and the experiment further clarified that CS-ALG-DOX NPs had escaped successfully from detention within lysosomes and been transported to the nucleus. As a result, DOX also was carried into the nucleus of MDR cell.
Animal experiment
Most classical anticancer drugs as the clinical first-line chemotherapy are provided with unspecific biodistribution leading to unacceptable adverse effects on some normal organs, such as bone marrow, liver, and intestine.52 Combination chemotherapy and Co-NDDS are designed to ameliorate the efficacy and decrease the adverse effect of these anticancer drugs. After completing the in vitro experiments, we further evaluated the efficacy and toxicity of Co-NDDS in tumor-bearing mice model in vivo.
General state of tumor-bearing mice model
The animal experimental procedure is shown in Figure 7A. During the whole test period, the general condition of animals in three groups was favorable. There was no animal’s death in any of the groups. After the third administration, the body weight of mice in the negative control group increased normally (Figure 7B). There was almost no increase in body weight of mice in the free DOX plus VCR group, but body weight in the CS-ALG-DOX@TPGS-PLGA-VCR NPs group had slight growth. The result may be due to the intestinal absorption dysfunction induced by VCR plus DOX combination chemotherapy. However, Co-NDDS could reduce the intestinal toxicity of free drugs. The status of tested mice imaged with an In-vivo Imaging System is shown in Figure S6. The organ coefficient in the free drugs group had the trend of increasing compared with that of the negative control group (Figure 7C). The reason may be that the weight does not increase to make the relative weight of the organ increased.
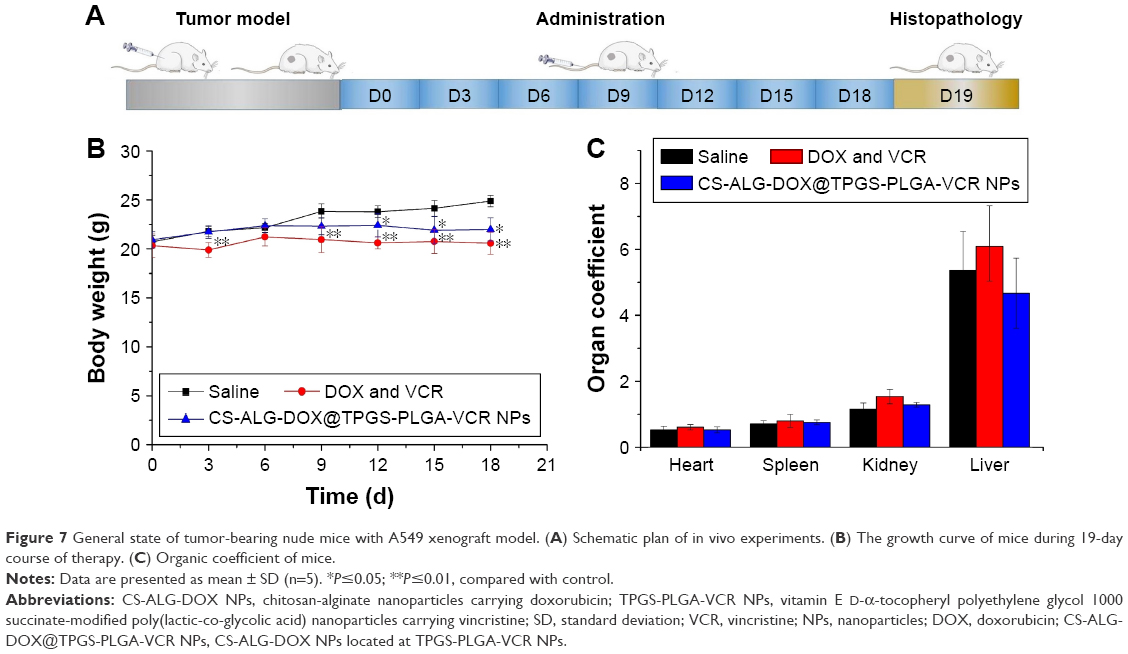 | Figure 7 General state of tumor-bearing nude mice with A549 xenograft model. (A) Schematic plan of in vivo experiments. (B) The growth curve of mice during 19-day course of therapy. (C) Organic coefficient of mice. |
Antitumor efficiency evaluation
One of the advantages of Co-NDDS is the improvement of antitumor efficiency of the drugs for combination chemotherapy due to synergistic efficiency.3 We had verified this concept according to in vitro antitumor experiments. Suitable tumor-bearing mice with tumor volume range of 50–150 mm3 were sorted randomly (5 animals per group). As shown in Figure S6, compared with the rapid tumor growth of saline treatment group, DOX plus VCR and CS-ALG-DOX@TPGS-PLGA-VCR NPs groups showed efficacy in inhibiting the tumor growth to different degrees. For the free drugs and the drug-loaded NP-treated groups, the CS-ALG-DOX@TPGS-PLGA-VCR NPs group showed better antitumor effect compared with free drug. Figure 8A shows the morphology characteristics and sizes of the excised A549 tumors after different treatments. Tumor size of the CS-ALG-DOX@TPGS-PLGA-VCR NPs group was significantly smaller than that of the control group and free drugs combination chemotherapy group. The excised tumors were weighed to evaluate treatment effect of each group as described in Figure 8B. These dates indicated that the Co-NDDS group inhibited remarkably the growth of A549 cell in a xenograft tumor model compared to free DOX plus VCR group. TGIR is a parameter commonly used to quantify efficiency for antitumor drug in tumor xenograft experiments.35 TGIR was 35.3% and 64.4% in the free VCR plus DOX group and the CS-ALG-DOX@TPGS-PLGA-VCR NPs group, respectively (Figure 8B). This result revealed that the anticancer effect of Co-NDDS increased by 82.3% compared with that of free drugs combination chemotherapy.
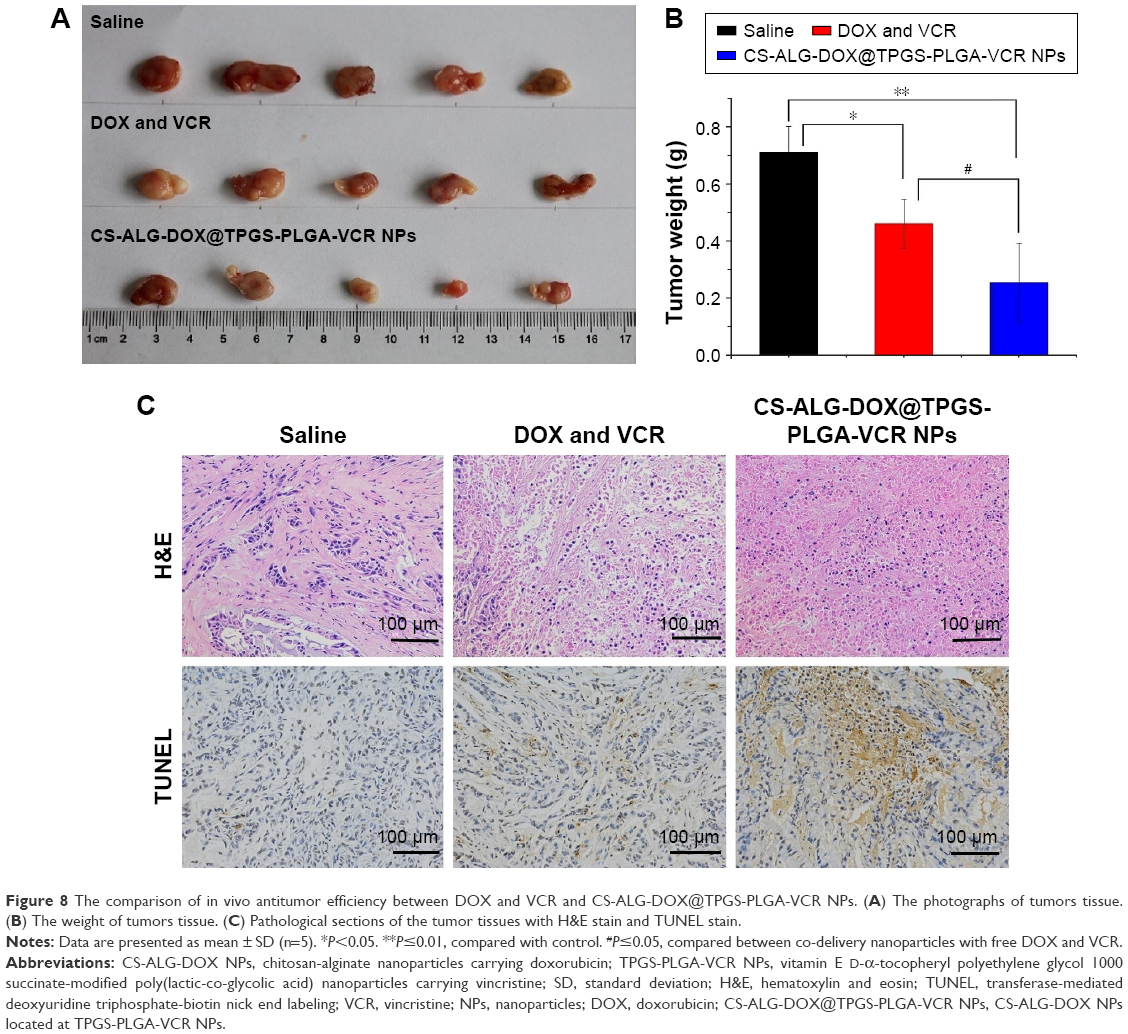 | Figure 8 The comparison of in vivo antitumor efficiency between DOX and VCR and CS-ALG-DOX@TPGS-PLGA-VCR NPs. (A) The photographs of tumors tissue. (B) The weight of tumors tissue. (C) Pathological sections of the tumor tissues with H&E stain and TUNEL stain. |
Figure 8C shows the pathologic evaluation images of the tumor section with H&E stain. Morphology and vitality of tumor cells were not influenced in the saline group. However, a larger area of necrosis and inflammatory cells were observed in the CS-ALG-DOX@TPGS-PLGA-VCR NPs group compared with the control group and the free DOX plus VCR group. Moreover, the images of in situ TUNEL assay presented a great quantity of apoptotic cells in the tumor tissues of the Co-NDDS group (Figure 8C). These results indicated that the prominent capability of tumor growth inhibition was due in part to the elevation of apoptosis level. Collectively, we have verified that the CS-ALG-DOX@TPGS-PLGA-VCR NPs can efficiently carry VCR and DOX to their pharmacological target sites to accomplish optimal synergistic anticancer efficacy.
Toxicity evaluation
Another objective of co-delivery NPs is to improve patient compliance by diminishing the toxicity to normal organs.3 There was no obvious toxicity on some important organs in the control group as found from pathological evaluation (Figure S7). However, a certain degree of pathological damage of some organs could be found in the free drugs group. In the small intestine, many mucous cells were shed into the enteric cavity. Because the intestinal epithelial cell is a typical cell with strong division ability, it could easily become the toxicity target of anticancer drugs. In the liver, hepatic cell cords presented disordered permutation. Hepatocytes appeared necrosis with cavitation at the edge area of hepatic lobule; yet, the morphological structure of hepatocytes near the central vein area was normal. These phenomena lied in the fact that the liver is the detoxification organ and actively growing liver cells are vulnerable to the attack of anticancer drug. In the spleen, the structure of the white pulp was chaotic without obvious germinal center. However, these changes of organ toxicity in the CS-ALG-DOX@TPGS-PLGA-VCR NPs group were significantly reduced. As there were no mucous cells in the intestinal lumen, liver cell structure was normal; the splenic germinal center was clearly visible. Therefore, our Co-NDDS could effectively reduce unwanted adverse effects at the same dose level.
Biodistribution evaluation
To investigate the biodistribution of our prepared NPs, ex vivo fluorescence imaging of tumors and major organs of the A549 tumor-bearing nude mice was performed at 24 h postinjection of free DiR and DiR-loaded NPs. Figure S8A shows the representative images of A549 xenograft tumor model in all the groups of mice at D19. Free DiR was used as the control group. As shown in Figure S8B, fluorescence intensity appeared in all over the tissues in the free DiR group, particularly in liver and spleen. This result demonstrated that free DiR was distributed in the liver and spleen, leading to the toxicity of these organs in mice. Similar to pathological findings, the fluorescence intensity of organs in the free DiR group is higher than that in the co-delivery NPs group. These results were able to support co-delivery NPs for improving therapeutic efficiency and reducing toxic and adverse effects of anticancer drugs in combination chemotherapy.
Conclusion
In summary, we designed and prepared a co-delivery S-D1@L-D2 NP that could load two small-molecule anticancer drugs into their separate domains. The S-D1@L-D2 NPs consisted of the smaller inner NPs carrying the anticancer drug DOX (CS-ALG-DOX NPs) that were loaded into the larger outer NPs containing another anticancer drug VCR (TPGS-PLGA-VCR NPs), thus forming CS-ALG-DOX@TPGS-PLGA-VCR NPs. The diameter of CS-ALG-DOX@TPGS-PLGA NPs was approximately 200 nm, while the diameter of the smaller NPs (CS-ALG-DOX NPs) was approximately 20 nm. After CS-ALG-DOX@TPGS-PLGA-VCR NPs had entered A549/taxol cell, VCR and the inner NPs were released at pH 5.8. The drug VCR would target microtubule in the cytoplasm, and CS-ALG-DOX NPs would enter the nucleus of MDR through the nuclear pores. The inner NPs could release DOX in the nucleus to target DNA in intra-nuclear alkaline environment (pH 7.4) (Figure 9). These results substantiated that S-D1@L-D2 NP was a co-delivery system of intracellular precision release loaded drugs with pH-sensitive characteristics. S-D1@L-D2 NPs obviously enhanced in vitro cytotoxicity and in vivo anticancer effects of the co-delivery drugs, meanwhile reducing their adverse effects. The S-D1@L-D2 NPs can be considered an innovative platform for the co-delivery of drugs in combination chemotherapy in the clinical treatment of MDR tumors.
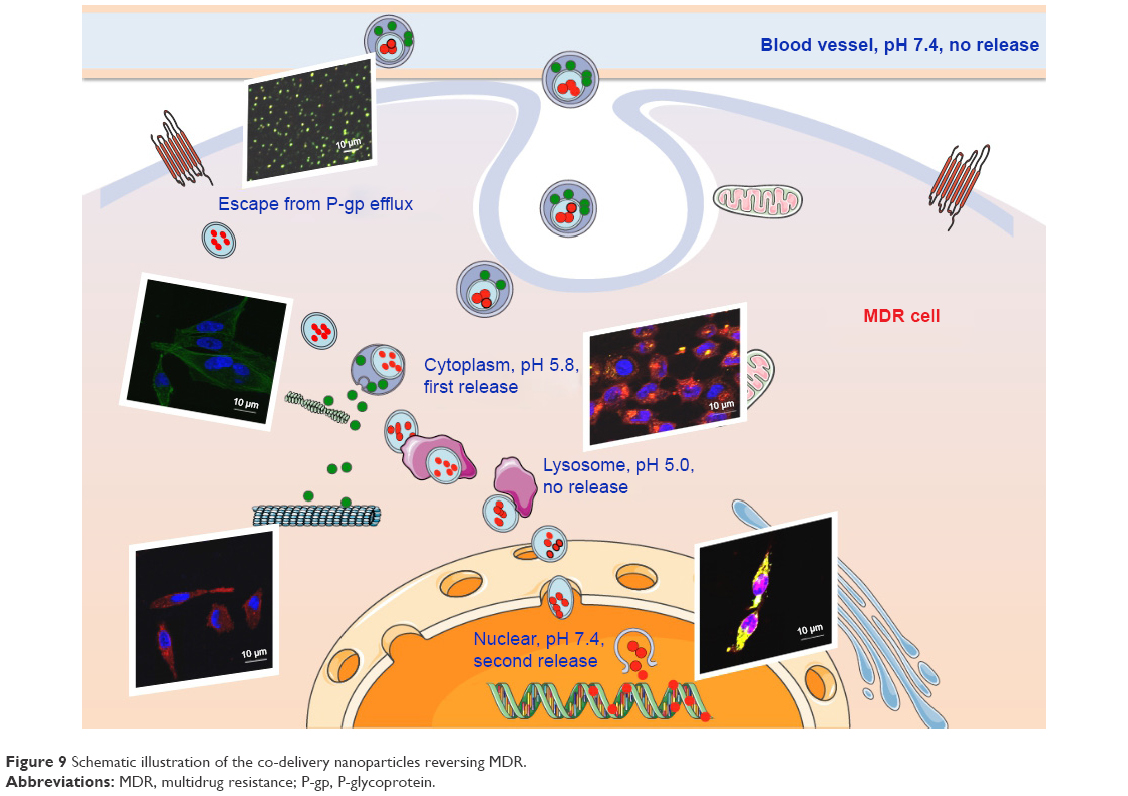 | Figure 9 Schematic illustration of the co-delivery nanoparticles reversing MDR. |
Acknowledgments
This work received financial support from the National Natural Science Foundation of China (Project number 81172721, Project number 81673214), National Natural Science Foundation of China for Talents Training in Basic Science (Project number J1210025), and Project Foundation of the Priority Academic Program Development of Jiangsu Higher Education Institutions.
Disclosure
The authors report no conflicts of interest in this work.
References
Gottesman MM, Fojo T, Bates SE. Multidrug resistance in cancer: role of ATP-dependent transporters. Nat Rev Cancer. 2002;2(1):48–58. | ||
Hu CM, Aryal S, Zhang L. Nanoparticle-assisted combination therapies for effective cancer treatment. Ther Deliv. 2010;1(2):323–334. | ||
Pinto AC, Moreira JN, Simões S. Combination chemotherapy in cancer: principles, evaluation and drug delivery strategies. In: Özdemir Ö, editor. Current Cancer Treatment–Novel Beyond Conventional Approaches. Croatia: InTech; 2011:693–714. | ||
Kang L, Gao Z, Huang W, Jin M, Wang Q. Nanocarrier-mediated co-delivery of chemotherapeutic drugs and gene agents for cancer treatment. Acta Pharm Sin B. 2015;5(3):169–175. | ||
Teo PY, Cheng W, Hedrick JL, Yang YY. Co-delivery of drugs and plasmid DNA for cancer therapy. Adv Drug Deliv Rev. 2016;98:41–63. | ||
Ramasamy T, Ruttala HB, Choi JY, et al. Engineering of a lipid-polymer nanoarchitectural platform for highly effective combination therapy of doxorubicin and irinotecan. Chem Commun (Camb). 2015;51(26):5758–5761. | ||
Ramasamy T, Kim JH, Choi JY, et al. pH sensitive polyelectrolyte complex micelles for highly effective combination chemotherapy. J Mater Chem B. 2014;2(37):6324–6333. | ||
Ramasamy T, Kim J, Choi HG, Yong CS, Kim JO. Novel dual drug-loaded block ionomer complex micelles for enhancing the efficacy of chemotherapy treatments. J Biomed Nanotechnol. 2014;10(7):1304–1312. | ||
Ramasamy T, Haidar ZS, Tran TH, et al. Layer-by-layer assembly of liposomal nanoparticles with PEGylated polyelectrolytes enhances systemic delivery of multiple anticancer drugs. Acta Biomater. 2014;10(12):5116–5127. | ||
Yi X, Lian X, Dong J, et al. Co-delivery of pirarubicin and paclitaxel by human serum albumin nanoparticles to enhance antitumor effect and reduce systemic toxicity in breast cancers. Mol Pharm. 2015;12(11):4085–4098. | ||
Lv S, Tang Z, Li M, et al. Co-delivery of doxorubicin and paclitaxel by PEG-polypeptide nanovehicle for the treatment of non-small cell lung cancer. Biomaterials. 2014;35(23):6118–6129. | ||
Guo S, Lin CM, Xu Z, Miao L, Wang Y, Huang L. Co-delivery of cisplatin and rapamycin for enhanced anticancer therapy through synergistic effects and microenvironment modulation. ACS Nano. 2014;8(5):4996–5009. | ||
Jiang T, Mo R, Bellotti A, Zhou J, Gu Z. Gel–liposome-mediated co-delivery of anticancer membrane-associated proteins and small-molecule drugs for enhanced therapeutic efficacy. Adv Funct Mater. 2014;24(16):2295–2304. | ||
Dai X, Tan C. Combination of microRNA therapeutics with small-molecule anticancer drugs: mechanism of action and co-delivery nanocarriers. Adv Drug Deliv Rev. 2015;81:184–197. | ||
Wang Y, Gao S, Ye WH, Yoon HS, Yang YY. Co-delivery of drugs and DNA from cationic core-shell nanoparticles self-assembled from a biodegradable copolymer. Nat Mater. 2006;5(10):791–796. | ||
He C, Tang Z, Tian H, Chen X. Co-delivery of chemotherapeutics and proteins for synergistic therapy. Adv Drug Deliv Rev. 2016;98:64–76. | ||
Kemp JA, Shim MS, Heo CY, Kwon YJ. “Combo” nanomedicine: co-delivery of multi-modal therapeutics for efficient, targeted, and safe cancer therapy. Adv Drug Deliv Rev. 2016;98:3–18. | ||
Kothari A, Hittelman WN, Chambers TC. Cell cycle-dependent mechanisms underlie vincristine-induced death of primary acute lymphoblastic leukemia cells. Cancer Res. 2016;76(12):3553–3561. | ||
Rathi A, Hittelman W, Chambers T. Distinct pathways of vincristine induced cell death in primary acute lymphoblastic leukemia cells. FASEB J. 2015;29(1 Suppl):884–883. | ||
Tacar O, Sriamornsak P, Dass CR. Doxorubicin: an update on anticancer molecular action, toxicity and novel drug delivery systems. J Pharm Pharmacol. 2013;65(2):157–170. | ||
Declèves X, Regina A, Laplanche JL, et al. Functional expression of P-glycoprotein and multidrug resistance-associated protein (Mrp1) in primary cultures of rat astrocytes. J Neurosci Res. 2000;60(5):594–601. | ||
Ohnishi T, Tamai I, Sakanaka K, et al. In vivo and in vitro evidence for ATP-dependency of P-glycoprotein-mediated efflux of doxorubicin at the blood-brain barrier. Biochem Pharmacol. 1995;49(10):1541–1544. | ||
Zhang Y, Yang C, Wang W, et al. Co-delivery of doxorubicin and curcumin by pH-sensitive prodrug nanoparticle for combination therapy of cancer. Sci Rep. 2016;6:21225. | ||
Wang DF, Rong WT, Lu Y, et al. TPGS2k/PLGA nanoparticles for overcoming multidrug resistance by interfering mitochondria of human alveolar adenocarcinoma cells. ACS Appl Mater Interfaces. 2015;7(7):3888–3901. | ||
Chen C, Xie XX, Zhou Q, et al. EGF-functionalized single-walled carbon nanotubes for targeting delivery of etoposide. Nanotechnology. 2012;23(4):045104. | ||
Guo M, Rong WT, Hou J, et al. Mechanisms of chitosan-coated poly(lactic-co-glycolic acid) nanoparticles for improving oral absorption of 7-ethyl-10-hydroxycamptothecin. Nanotechnology. 2013;24(24):245101. | ||
Wang Y, Guo M, Lu Y, et al. Alpha-tocopheryl polyethylene glycol succinate-emulsified poly(lactic-co-glycolic acid) nanoparticles for reversal of multidrug resistance in vitro. Nanotechnology. 2012;23(49):495103. | ||
Wang YY, Zhang DD, Kong YY, et al. CS/PAA@TPGS/PLGA nanoparticles with intracellular pH-sensitive sequential release for delivering drug to the nucleus of MDR cells. Colloids Surf B Biointerfaces. 2016;145:716–727. | ||
Webb BA, Chimenti M, Jacobson MP, Barber DL. Dysregulated pH: a perfect storm for cancer progression. Nat Rev Cancer. 2011;11(9):671–677. | ||
Ju C, Mo R, Xue J, et al. Sequential intra-intercellular nanoparticle delivery system for deep tumor penetration. Angew Chem Int Ed Engl. 2014;53(24):6253–6258. | ||
Li P, Dai YN, Zhang JP, Wang AQ, Wei Q. Chitosan-alginate nanoparticles as a novel drug delivery system for nifedipine. Int J Biomed Sci. 2008;4(3):221–228. | ||
Mukhopadhyay P, Chakraborty S, Bhattacharya S, Mishra R, Kundu PP. pH-sensitive chitosan/alginate core-shell nanoparticles for efficient and safe oral insulin delivery. Int J Biol Macromol. 2015;72:640–648. | ||
Wang H, Xie X, Zhang F, et al. Evaluation of cholesterol depletion as a marker of nephrotoxicity in vitro for novel β-cyclodextrin derivatives. Food Chem Toxicol. 2011;49(6):1387–1393. | ||
Chou TC. Drug combination studies and their synergy quantification using the Chou-Talalay method. Cancer Res. 2010;70(2):440–446. | ||
Orenstein A, Kostenich G, Roitman L, et al. A comparative study of tissue distribution and photodynamic therapy selectivity of chlorin e6, Photofrin II and ALA-induced protoporphyrin IX in a colon carcinoma model. Br J Cancer. 1996;73(8):937–944. | ||
Dong X, Wang W, Qu H, Han D, Zheng J, Sun G. Targeted delivery of doxorubicin and vincristine to lymph cancer: evaluation of novel nanostructured lipid carriers in vitro and in vivo. Drug Deliv. 2016;23(4):1374–1378. | ||
Mo R, Sun Q, Li N, Zhang C. Intracellular delivery and antitumor effects of pH-sensitive liposomes based on zwitterionic oligopeptide lipids. Biomaterials. 2013;34(11):2773–2786. | ||
Zhang W, Shen J, Su H, et al. Co-delivery of cisplatin prodrug and chlorin e6 by mesoporous silica nanoparticles for chemo-photodynamic combination therapy to combat drug resistance. ACS Appl Mater Interfaces. 2016;8(21):13332–13340. | ||
Fan W, Shen B, Bu W, et al. Design of an intelligent sub-50 nm nuclear-targeting nanotheranostic system for imaging guided intranuclear radiosensitization. Chem Sci. 2015;6(3):1747–1753. | ||
Martens TF, Remaut K, Demeester J, De Smedt SC, Braeckmans K. Intracellular delivery of nanomaterials: how to catch endosomal escape in the act. Nano Today. 2014;9(3):344–364. | ||
Hsiao MH, Lin KH, Liu DM. Improved pH-responsive amphiphilic carboxymethyl-hexanoyl chitosan-poly(acrylic acid) macromolecules for biomedical applications. Soft Matter. 2013;9(8):2458–2466. | ||
Wu W, Zhang Q, Wang J, et al. Tumor-targeted aggregation of pH-sensitive nanocarriers for enhanced retention and rapid intracellular drug release. Polym Chem. 2014;5(19):5668–5679. | ||
Azizi E, Namazi A, Haririan I, et al. Release profile and stability evaluation of optimized chitosan/alginate nanoparticles as EGFR antisense vector. Int J Nanomedicine. 2010;5:455–461. | ||
Li T, Shi XW, Du YM, Tang YF. Quaternized chitosan/alginate nanoparticles for protein delivery. J Biomed Mater Res A. 2007;83(2):383–390. | ||
Li Z, Qiu L, Chen Q, et al. pH-sensitive nanoparticles of poly(L-histidine)-poly(lactide-co-glycolide)-tocopheryl polyethylene glycol succinate for anti-tumor drug delivery. Acta Biomater. 2015;11:137–150. | ||
Qiu L, Qiao M, Chen Q, et al. Enhanced effect of pH-sensitive mixed copolymer micelles for overcoming multidrug resistance of doxorubicin. Biomaterials. 2014;35(37):9877–9887. | ||
Zhu H, Chen H, Zeng X, et al. Co-delivery of chemotherapeutic drugs with vitamin E TPGS by porous PLGA nanoparticles for enhanced chemotherapy against multi-drug resistance. Biomaterials. 2014;35(7):2391–2400. | ||
Binet S, Chaineau E, Fellous A, et al. Immunofluorescence study of the action of navelbine, vincristine and vinblastine on mitotic and axonal microtubules. Int J Cancer. 1990;46(2):262–266. | ||
Michaelis M, Rothweiler F, Klassert D, et al. Reversal of P-glycoprotein-mediated multidrug resistance by the murine double minute 2 antagonist nutlin-3. Cancer Res. 2009;69(2):416–421. | ||
Zhang Z, Tan S, Feng SS. Vitamin E TPGS as a molecular biomaterial for drug delivery. Biomaterials. 2012;33(19):4889–4906. | ||
Collnot EM, Baldes C, Wempe MF, et al. Mechanism of inhibition of P-glycoprotein mediated efflux by vitamin E TPGS: influence on ATPase activity and membrane fluidity. Mol Pharm. 2007;4(3):465–474. | ||
Ismael GF, Rosa DD, Mano MS, Awada A. Novel cytotoxic drugs: old challenges, new solutions. Cancer Treat Rev. 2008;34(1):81–91. |
Supplementary materials
The size distribution of empty nanoparticles (NPs) and drug-loaded NPs. The chemical structure of the raw materials, empty NPs, and drug-loaded NPs is analyzed by Fourier transform infrared spectroscopy; encapsulation efficiency and loading efficiency of NPs; cell viability of empty NPs; cytotoxicity of drug-loaded NPs; half maximal inhibitory concentration and combination index values of different formulations. The uptake and intracellular migration of free doxorubicin, toxicity evaluation, and biodistribution evaluation of the NPs in A549 xenograft tumors of the mice model.
 | Figure S1 The size distribution of empty nanoparticles and drug-loaded nanoparticles are determined by DLS. (A) CS-ALG@TPGS-PLGA NPs and (B) CS-ALG-DOX@TPGS-PLGA-VCR NPs. |
 | Table S1 EE and LE of nanoparticles |
 | Figure S2 The chemical structure of the raw materials, empty nanoparticles, and drug-loaded nanoparticles are analyzed by FT-IR. (A) CS, ALG, CS-ALG NPs; (B) DOX, CS-ALG-DOX NPs; (C) TPGS, PLGA, TPGS-PLGA NPs; and (D) CS-ALG@TPGS-PLGA NPs, VCR, CS-ALG-DOX@TPGS-PLGA-VCR NPs. |
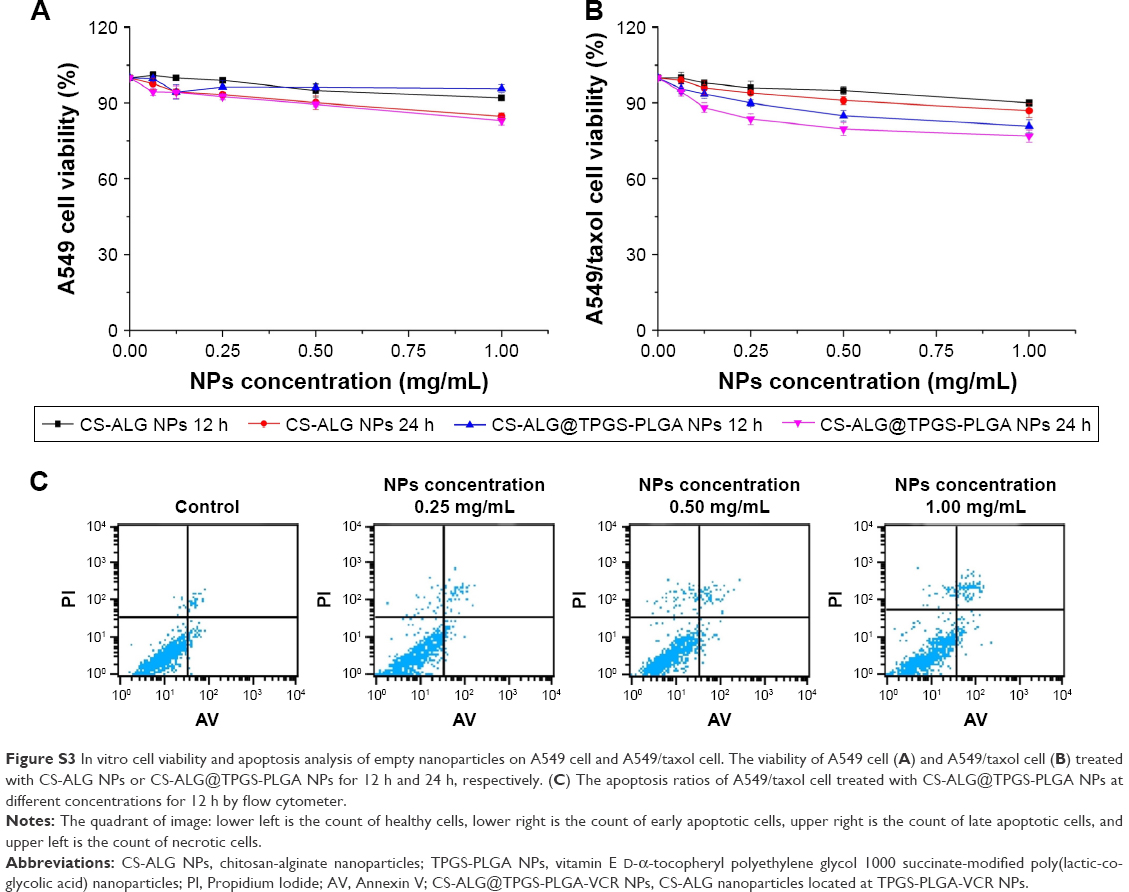 | Figure S3 In vitro cell viability and apoptosis analysis of empty nanoparticles on A549 cell and A549/taxol cell. The viability of A549 cell (A) and A549/taxol cell (B) treated with CS-ALG NPs or CS-ALG@TPGS-PLGA NPs for 12 h and 24 h, respectively. (C) The apoptosis ratios of A549/taxol cell treated with CS-ALG@TPGS-PLGA NPs at different concentrations for 12 h by flow cytometer. |
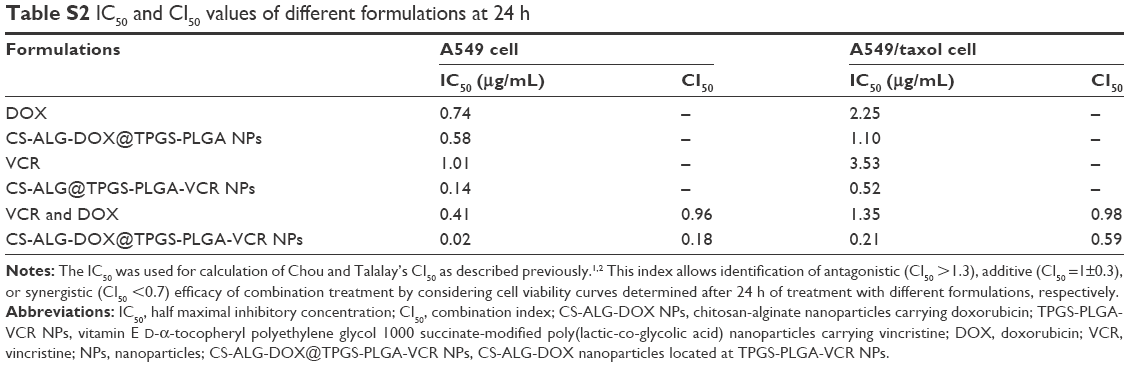 | Table S2 IC50 and CI50 values of different formulations at 24 h |
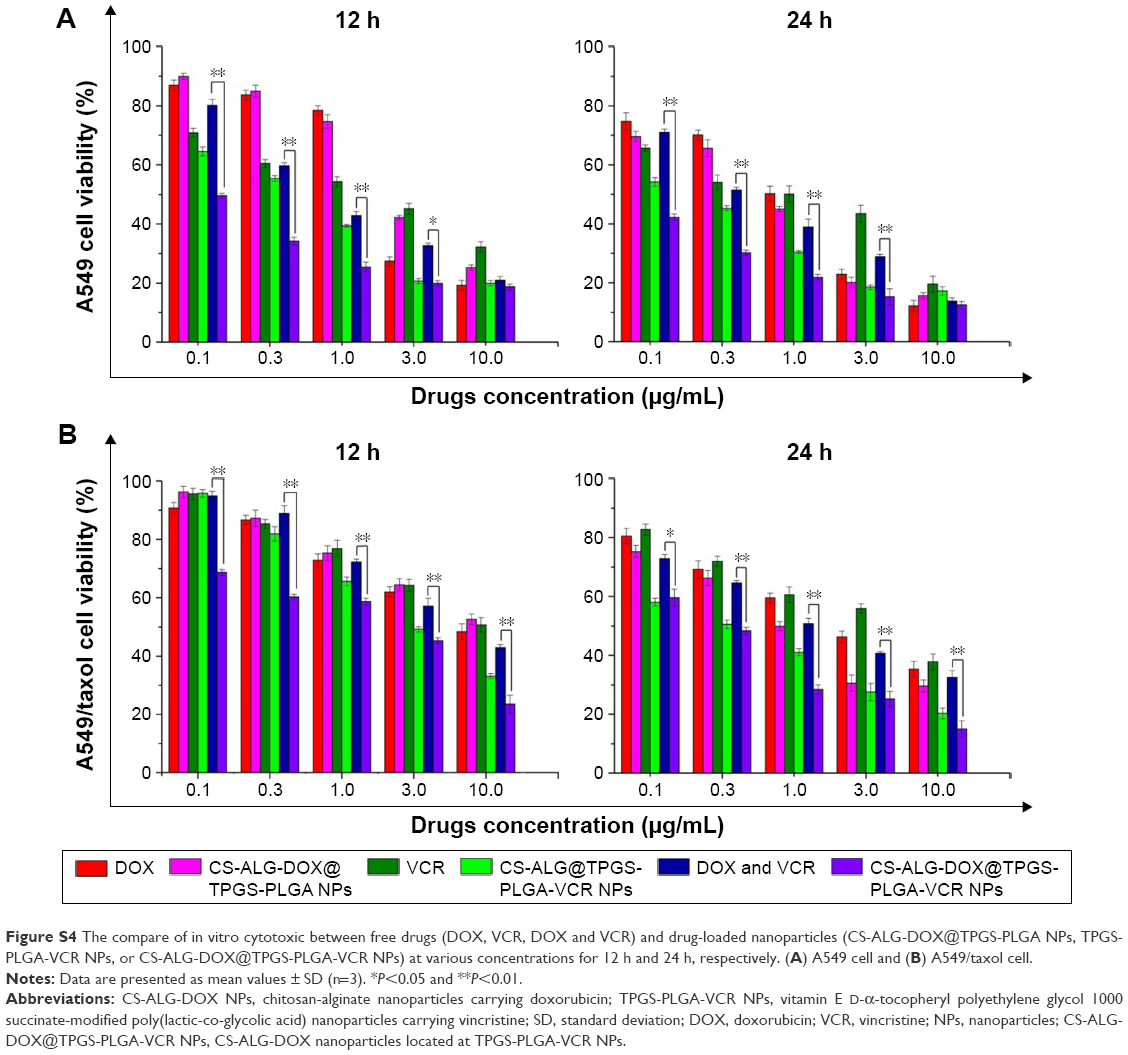 | Figure S4 The compare of in vitro cytotoxic between free drugs (DOX, VCR, DOX and VCR) and drug-loaded nanoparticles (CS-ALG-DOX@TPGS-PLGA NPs, TPGS-PLGA-VCR NPs, or CS-ALG-DOX@TPGS-PLGA-VCR NPs) at various concentrations for 12 h and 24 h, respectively. (A) A549 cell and (B) A549/taxol cell. |
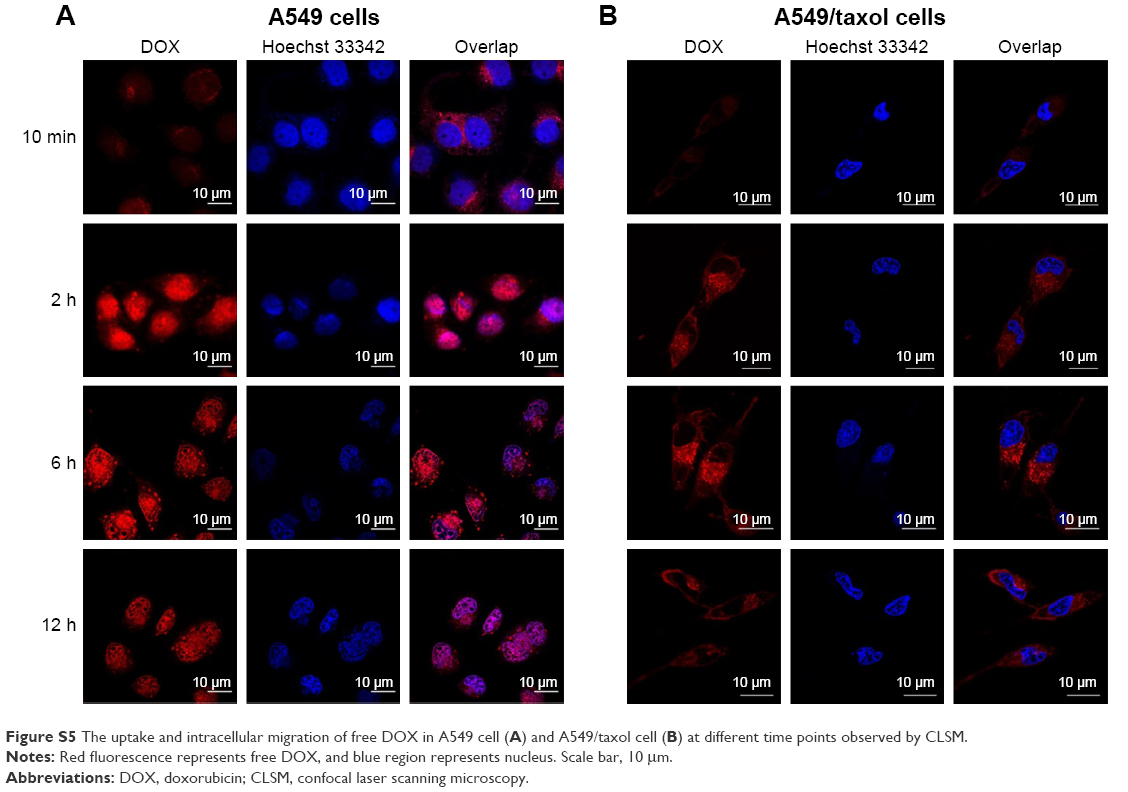 | Figure S5 The uptake and intracellular migration of free DOX in A549 cell (A) and A549/taxol cell (B) at different time points observed by CLSM. |
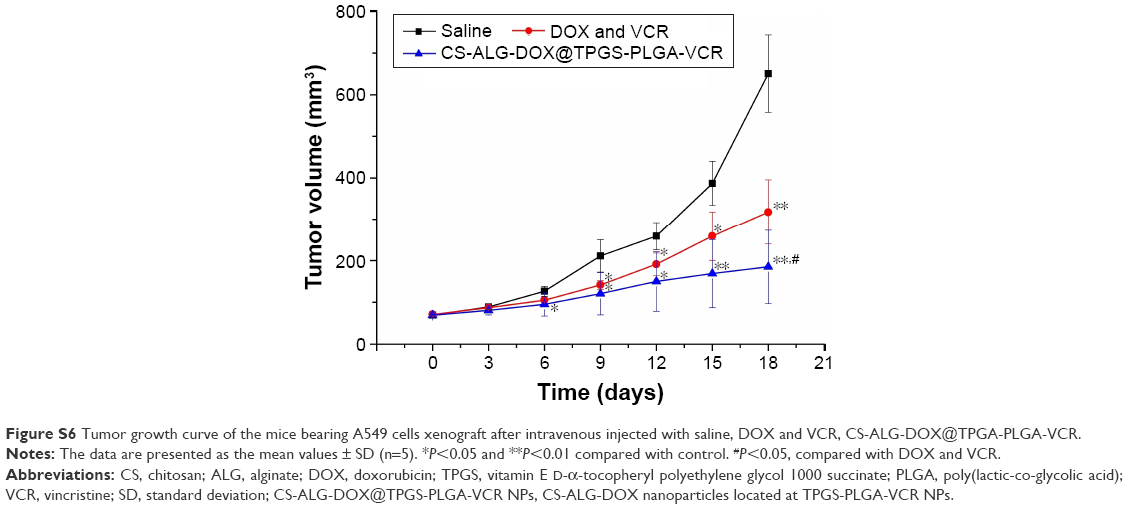 | Figure S6 Tumor growth curve of the mice bearing A549 cells xenograft after intravenous injected with saline, DOX and VCR, CS-ALG-DOX@TPGA-PLGA-VCR. |
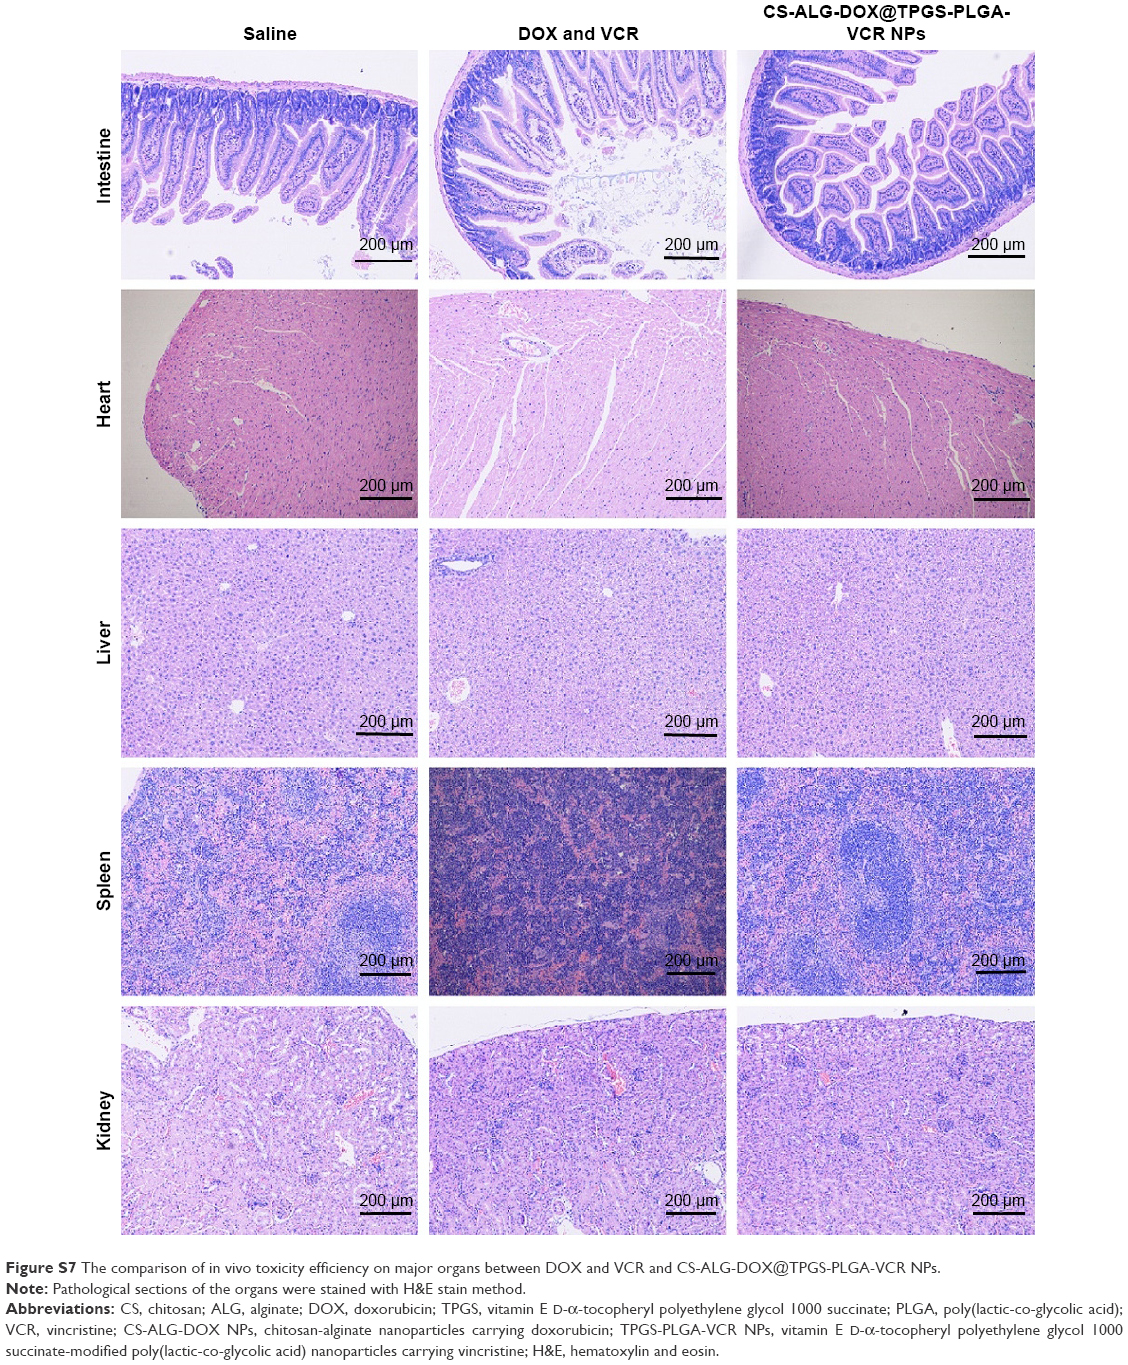 | Figure S7 The comparison of in vivo toxicity efficiency on major organs between DOX and VCR and CS-ALG-DOX@TPGS-PLGA-VCR NPs. |
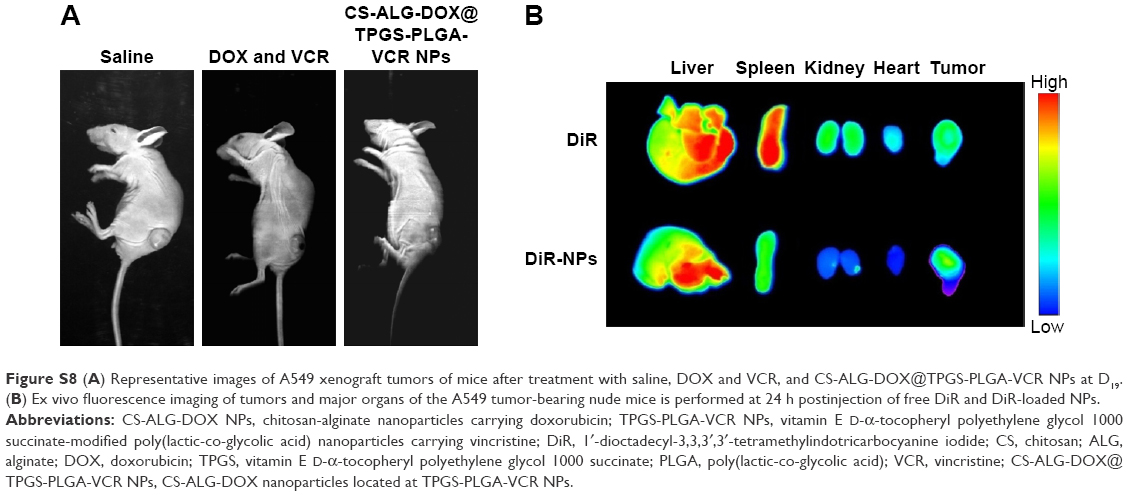 | Figure S8 (A) Representative images of A549 xenograft tumors of mice after treatment with saline, DOX and VCR, and CS-ALG-DOX@TPGS-PLGA-VCR NPs at D19. (B) Ex vivo fluorescence imaging of tumors and major organs of the A549 tumor-bearing nude mice is performed at 24 h postinjection of free DiR and DiR-loaded NPs. |
References
Weigert O, Pastore A, Rieken M, Lang N, Hiddemann W, Dreyling M. Sequence-dependent synergy of the proteasome inhibitor bortezomib and cytarabine in mantle cell lymphoma. Leukemia. 2007;21(3):524–528. | ||
Chou TC. Drug combination studies and their synergy quantification using the Chou-Talalay method. Cancer Res. 2010;70(2):440–446. |
 © 2017 The Author(s). This work is published and licensed by Dove Medical Press Limited. The
full terms of this license are available at https://www.dovepress.com/terms
and incorporate the Creative Commons Attribution
- Non Commercial (unported, 3.0) License.
By accessing the work you hereby accept the Terms. Non-commercial uses of the work are permitted
without any further permission from Dove Medical Press Limited, provided the work is properly
attributed. For permission for commercial use of this work, please see paragraphs 4.2 and 5 of our Terms.
© 2017 The Author(s). This work is published and licensed by Dove Medical Press Limited. The
full terms of this license are available at https://www.dovepress.com/terms
and incorporate the Creative Commons Attribution
- Non Commercial (unported, 3.0) License.
By accessing the work you hereby accept the Terms. Non-commercial uses of the work are permitted
without any further permission from Dove Medical Press Limited, provided the work is properly
attributed. For permission for commercial use of this work, please see paragraphs 4.2 and 5 of our Terms.