Back to Journals » Diabetes, Metabolic Syndrome and Obesity » Volume 13
Clustering of Elevated Blood Pressure, Elevated Blood Glucose, and Abdominal Obesity Among Adults in Dire Dawa: A Community-Based Cross-Sectional Study
Authors Mengesha MM ![]() , Ayele BH
, Ayele BH ![]() , Beyene AS
, Beyene AS ![]() , Roba HS
, Roba HS
Received 20 February 2020
Accepted for publication 28 May 2020
Published 16 June 2020 Volume 2020:13 Pages 2013—2024
DOI https://doi.org/10.2147/DMSO.S250594
Checked for plagiarism Yes
Review by Single anonymous peer review
Peer reviewer comments 2
Editor who approved publication: Prof. Dr. Juei-Tang Cheng
Melkamu Merid Mengesha,1 Behailu Hawulte Ayele,2 Addisu Shunu Beyene,3 Hirbo Shore Roba1
1Haramaya University, College of Health and Medical Sciences, School of Public Health, Department of Epidemiology and Biostatistics, Harar, Ethiopia; 2Haramaya University, College of Health and Medical Sciences, School of Public Health, Department of Public Health and Health Policy, Harar, Ethiopia; 3Haramaya University, College of Health and Medical Sciences, Department of Environmental Health Sciences, Harar, Ethiopia
Correspondence: Melkamu Merid Mengesha
College of Health and Medical Sciences, Harar, Ethiopia
Tel +251912094941
Email [email protected]
Background: Evidence shows that the presence of a single component of the metabolic syndrome (MetS) increases the risk of developing the MetS later in life. This study estimated the prevalence and associated factors of abdominal obesity, elevated blood pressure, elevated blood glucose, and the 3-factor MetS components among urban adults in Dire Dawa, East Ethiopia.
Methods: Community-based cross-sectional data were collected from 872 adults aged 25– 64 years. The joint interim statement (JIS) was used to define the MetS components. The dependent outcome variables were both the individual and the 3-factor MetS components. A robust variance Poisson regression model was used to directly estimate the prevalence ratio (PR) of risk factors.
Results: The prevalence of the 3-factor MetS components (abdominal obesity, elevated blood pressure, and elevated blood glucose) was 9.5% (95% CI: 7.7, 11.7). Women had two times higher prevalence of the 3-factor MetS components compared with men, 11.6% (95% CI: 9.2, 14.5) vs 5.2% (95% CI: 3.2, 8.5). A higher prevalence of abdominal obesity, 46.4% (95% CI: 43.1, 49.8), followed by a raised blood pressure, 42.7% (95% CI: 39.4, 46.0), was observed among study subjects. The presence of a single MetS component had an associated cluster of other components: 33.7% of subjects with elevated blood glucose, 22.3% with elevated blood pressure, and 20.5% with abdominal obesity had also the 3-factor MetS components. Age, sex, body mass index, waist circumference, and physical activity were significantly associated with the individual components or the 3-factor MetS components.
Conclusion: A higher prevalence of the individual components and the presence of clustering with a single factor identified call for the need of community screening. Interventions targeting both abdominal and general obesity through physical activity and lifestyle modification can contribute towards reducing cardiometabolic risk factors with due attention given to women and older adults.
Keywords: abdominal obesity, elevated blood pressure, elevated blood glucose, physical activity, metabolic syndrome components
Introduction
Noncommunicable diseases (NCDs) account for 41 million deaths each year, and over 85% of these deaths occur in low-and middle-income countries (LMICs).1 In 2017, globally, high systolic blood pressure accounted for 10.4 million deaths, followed by high fasting plasma glucose (6.53 million deaths), and high body-mass index (4.72 million deaths).2 Gouda and colleagues have shown that cardiovascular diseases (CVDs) lead the NCDs burden in sub-Saharan Africa (SSA) which was increased by 67% between 1990 and 2017.3 Furthermore, a study in 14 African and Middle East countries also reported a higher prevalence of CVD risk factors: dyslipidemia (70%), abdominal obesity (68%), hypertension (43%), and diabetes (25%).4
Abdominal obesity, hypertension, and diabetes oftentimes co-exist in a complex relationship.4–6 Alsheikh-Ali et al, in a multi-country study reported that 74% of adult outpatients had more than one CVD risk factor.4 Besides, large scale multi-country prospective studies in China and 9 LMICs reported that adults with abdominal obesity had a higher risk of developing both hypertension and diabetes.6,7 It is also reported that among type-II diabetes mellitus patients, abdominal obesity increases the risk of metabolic syndrome (MetS) which is defined when three of the following risk factors co-exist: hyperglycemia, raised blood pressure, elevated triglyceride levels, low high-density lipoprotein cholesterol, and obesity.8–10 A meta-analysis by Faijer-Westerink et al indicated a higher prevalence of the MetS in SSA that ranged from 11.1–23.9% based on criteria recommended by different health organizations.11
The co-existence of these CVD risk factors affects multiple organs including the heart and kidney.5,12,13 A study on the effect of co-existing obesity and hypertension on the heart by Kirzesinski et al reported that obese hypertensives had lower echocardiographic and impedance indices of left ventricular performance and a worse diastolic function.5 There is also evidence that MetS and its components are associated with an increase in proteinuria and albuminuria, kidney damage indicators, with a dose-response relationship between the number of MetS components and the risk of albuminuria.13,14 Li et al in their meta-analysis also reported that subjects with MetS had a higher recurrent stroke than those with the individual components alone except for hyperglycemia which was a stronger predictor of a recurrent stroke solely.12
The growing burden of obesity, hypertension, diabetes and other modifiable risk factors among young adults4 could result in a further surge of the NCDs burden and overwhelm countries in SSA which already have a weaker health system and have still been fighting the burden of communicable diseases.15,16 The World Health Organization developed a global action plan (2013–2020) for the prevention and control of NCDs which targeted to reduce premature mortality by 25% from CVDs and diabetes among others, reduce the prevalence of elevated blood pressure by 25%, and halt the rise in diabetes and obesity.17 However, a study by Nyaaba et al reported that Africa is off-track in achieving the NCDs global action plan by 2020 with more than half of countries did not achieve set targets for 2015 and 2016.18
In Ethiopia, NCDs are estimated to account for 39% of all deaths, which showed a 38% increase between 2000 and 2016, with 16% being from cardiovascular diseases.19,20 A meta-analysis by Kibret et al reported a 19.6% prevalence of hypertension among the adult population in Ethiopia with urban residents and men having a higher burden.21 Similarly, a meta-analysis by Tesfaye et al reported a 5% prevalence of diabetes in Ethiopia and found that diabetes mellitus is significantly associated with hypertension.22
Despite several studies assessed the cardiometabolic risk factors in Ethiopia, only a few studies reported the clustering of these cardiovascular risk factors.23–25 To complement the gap in the availability of data and aid in the tracking of the response to NCDs in Ethiopia, this study was aimed to estimate the prevalence of the individual and the 3-factor MetS components (abdominal obesity, elevated blood pressure, and elevated blood glucose) and also factors associated with the individual and the 3-factor MetS components.
Methods
Study Setting and Design
A community-based cross-sectional study was conducted in Dire Dawa city, eastern Ethiopia, from June 01/2017 to June 21/2017. The city has 4 districts with 9 urban kebeles (sub-district, the lowest administrative unit) and had a total population of 252, 279.26
Participants
Included in the study were adults aged 25 to 64 years who have lived in Dire Dawa city for at least six months before the survey. From each visited households, we randomly selected one adult to participate in the study. Pregnant women, bedridden adults, and adults with a disability that limit activity were excluded.
Sample Size Determination
The study sample size, 903, was calculated using OpenEpi version 2.3 software.27 The assumptions for sample size calculation were prevalence of MetS, P=17%;28 margin of error, d=3%; a design effect of 1.5 to compensate for a random error due to a multi-stage sampling, and 95% level of confidence. 872 subjects participated in the survey giving a response rate of 96.6%.
Sampling Technique
This study was conducted in five randomly selected urban sub-districts in Dire Dawa city. Households in these sub-districts were randomly selected from lists obtained from the city administration. The study sample was proportionally allocated according to the number of households in the selected sub-districts. Systematic random sampling was used to select households within a selected sub-districts, and a simple random sampling was used to select among eligible adults within a selected household when there were more than one.
Data Collection
The World Health Organization’s (WHO) STEPwise approach to Surveillance (STEPS) instrument was used to collect data.29 The STEPS instrument, originally prepared in English, was translated into Amharic and Afan Oromo, and then back-translated to the English version to check the consistency. The local translated instrument was pretested before the actual field activity. In this survey, we collected demographic data (age, sex, education, marital status, and occupation (main work in the past 12 months)) and data on the core items of the STEPS instrument: behavioral in Step 1 (information on tobacco smoke, alcohol consumption, diet, and physical activity (PA)), physical in Step 2 (included height, weight, waist circumference, and blood pressure), and biochemical measurements in Step 3 (we only measured fasting blood glucose). Data collectors who had a health background and completed at least a diploma level of education and received three days of orientation on the objectives of the study, the STEPS instrument, and interviewing techniques collected the data.
A digital portable scale was used to measure body weight, and height was measured using a stadiometer and the results are recorded to the nearest 0.5 cm (centimeters). Waist circumference was measured when subjects stood erect, with feet together and abdomen relaxed, and with their arms hanging by their sides. Measurement was taken at the point halfway between the lower border of the ribs and the iliac crest in a horizontal plane, and values were recorded to the nearest 0.1 cm. Three blood pressure measurements were taken using a digital blood pressure apparatus at 3 to 5-minutes apart, and the average of the second and the third blood pressure measurements was used in the analyses.
Definitions
The Joint Interim Statement (JIS) was used to define the components of MetS included in this study: elevated blood pressure, elevated blood glucose, and abdominal obesity.8 To define abdominal obesity, we used the cut-off recommended for sub-Saharan African: men, ≥94 cm, and women, ≥80 cm.8 Elevated blood pressure was defined when Systolic blood pressure ≥130 mmHg and/or Diastolic blood pressure ≥85 mmHg (antihypertensive drug treatment in a patient with a history of hypertension is an alternate indicator). Elevated blood glucose is defined when fasting glucose (drug treatment of elevated glucose is an alternate indicator) is ≥100mg/dL. Body mass index (BMI) is obtained from the weight and height measurements of a participant and defined as weight in kilograms divided by the square of the height in meters (kg/m2). Participant’s BMI was classified as: underweight (below 18.5 kg/m2), normal (healthy) weight (18.5 kg/m2 to 24.9 kg/m2), overweight (25.0 kg/m2 to 29.9 kg/m2), and obesity (≥30.0 kg/m2).30 Responses to the frequency of PA in a typical week and activity duration on a typical day are used to compute the total amount of time a person spent doing PA or metabolic equivalent tasks (MET) minutes per week. Detailed method description of PA measurements was reported in our previous publication on self-reported PA from the same data.31 The overall PA score is computed as the sum of all MET-minutes per week from moderate- to vigorous-intensity activities performed in the three activity domains. Participant’s level of PA was categorized into three: low, <600 MET-minutes per week; medium, at least 600 MET-minutes per week from any combination of moderate or vigorous intensity activities; and high, ≥3000 MET-minutes per week from any combination of walking, moderate-or vigorous-activities or ≥1500 MET-minutes per week from vigorous intensity activities.32
Statistical Analysis
EpiData version 3.0 was used for data entry and STATA version 14.2 statistical software for data management and analysis. Missing values of seven variables which accounted for 14.6% of the data were handled using multiple imputations by chained equations (MICE) method.33 Before imputation, we checked the pattern of missing, and the Little’s missing completely at random (MCAR) test in STATA supported that the missing observed in our data was MCAR (chi-square (df) =121.86 (98), p-value = 0.052). Estimates of the prevalence of joint occurrences of the MetS components were disaggregated by participants’ socio-demographic characteristics, and study findings were presented as means, percentages with their corresponding 95% CIs, and Chi-square tests. For the estimation of the age-adjusted prevalence of the joint occurrences of the MetS components and the individual components, the 2013 International Network for the Demographic Evaluation of Populations and Their Health (INDEPTH) standard population for LMICs was used.34 The dependent outcome variables include abdominal obesity, elevated fasting glucose, and raised blood pressure, and the joint occurrences of the MetS components. The responses to all the dependent outcome variables were coded 1=yes and otherwise 0=no.
When the prevalence of an event is not rare, research evidence suggests the use of prevalence ratio (PR) over the odds ratio in cross-sectional studies.35 Consequently, we used a robust variance Poisson regression model to directly estimate PR of risk factors against the binary outcomes. Chi-square for trend was also calculated to see if the prevalence of MetS and its components increase with age. P-value<0.05 was used to declare the statistical significance of all tests in this study.
Ethical Considerations
The Haramaya University College of Health and Medical Sciences’ Institutional Health Research Ethics Review Committee (IHRERC) approved the study with an approval number of IHRERC/003/2016. Written informed consent was obtained from each of the study participants before commencing data collection. Confidentiality of the information collected is maintained by keeping the anonymity of individual participants at all levels. Participants with unfavorable health outcomes related to the study topic received advice on modifiable risk factors and are referred to a nearby health facility for further investigation and management.
Results
Socio-Demographic Characteristics
A total of 872 adults participated in this study, and 67.2% were females. Adults below the age of 45 years constituted 64% of the study sample. Over 85% of the study participants attended some formal education ranging from some primary education to a college diploma or above. A substantial number of adults (43%) reported that they did not engage in any income-generating activities in the twelve months before the current survey (Table 1).
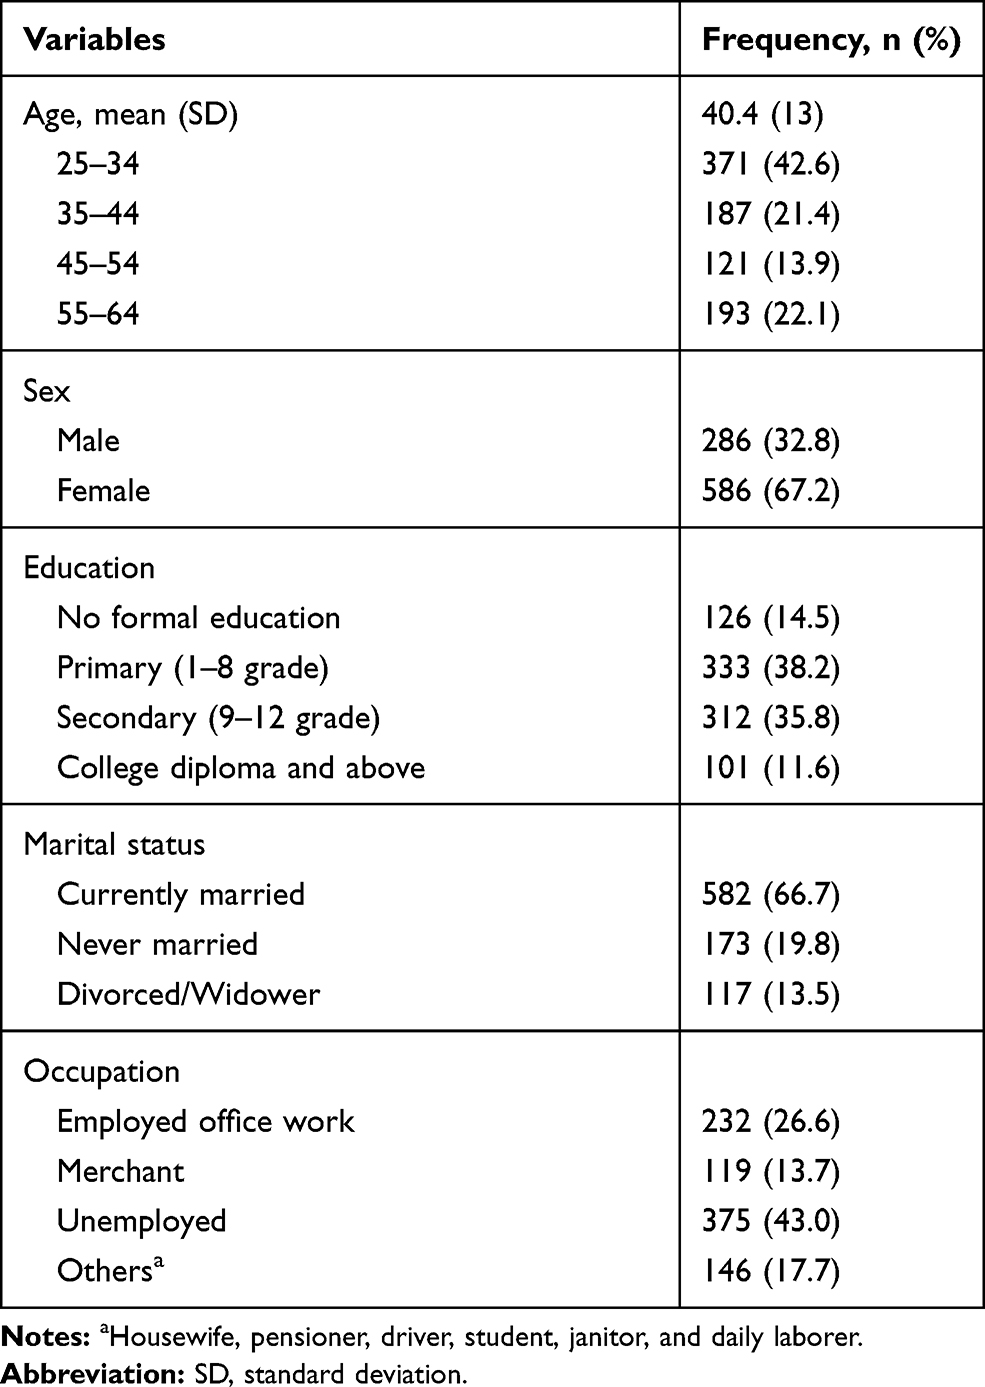 |
Table 1 Socio-Demographic Characteristics of Urban Adults in Dire Dawa, East Ethiopia, 2017 |
Behavioral and Anthropometric Measurements
The lifetime prevalence of alcohol drinking was 29.8% and ever cigarette smoking was 8.5%. Regarding PA, 44.7% of the participants were physically inactive (<600 MET-minutes per week) and only 37.5% engaged in a high-level PA. Adults with a BMI of ≥25 kg/m2 accounted for 39.0% of the study sample and 62% of women had waist circumference ≥80 cm. Only 1 serving of fruits and vegetables on average per day is consumed by adults in the study setting, with 12.8% consumed 5 or more servings of fruits and vegetables combined daily (Table 2).
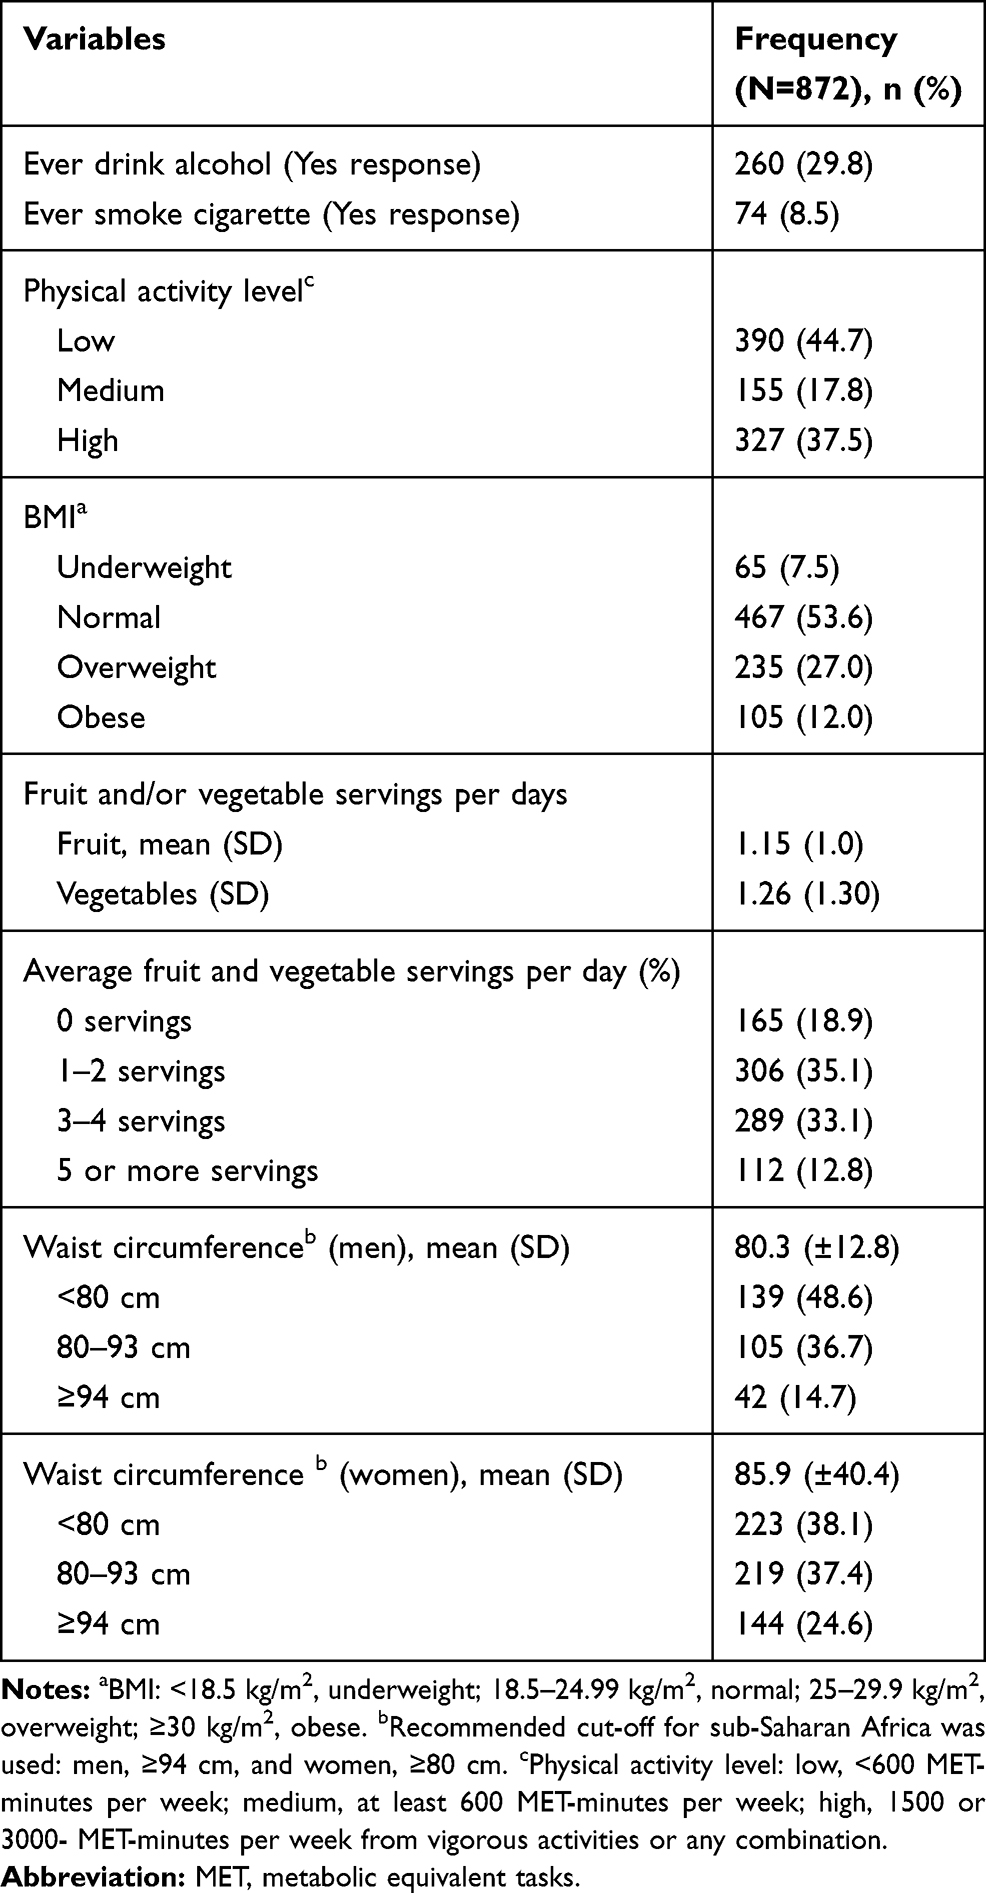 |
Table 2 Behavioral and Anthropometric Measurements of Urban Adults in Dire Dawa, East Ethiopia, 2017 |
Prevalence of Abdominal Obesity, Elevated Blood Pressure, and Raised Fasting Glucose
As shown in Table 3, the prevalence of both the individual and the 3-factor MetS components (abdominal obesity, elevated blood pressure, and raised fasting blood glucose) showed a positive trend with an increase in age and BMI. The prevalence of the 3-factor MetS components was 9.5% (95% CI: 7.7, 11.7), with more than six times higher prevalence among 55–64 years compared to 25–34 years. The most prevalent component in the study setting was abdominal obesity, 46.4% (95% CI: 43.1, 49.8), followed by elevated blood pressure, 42.7% (95% CI: 39.4, 46.0) (Table 3).
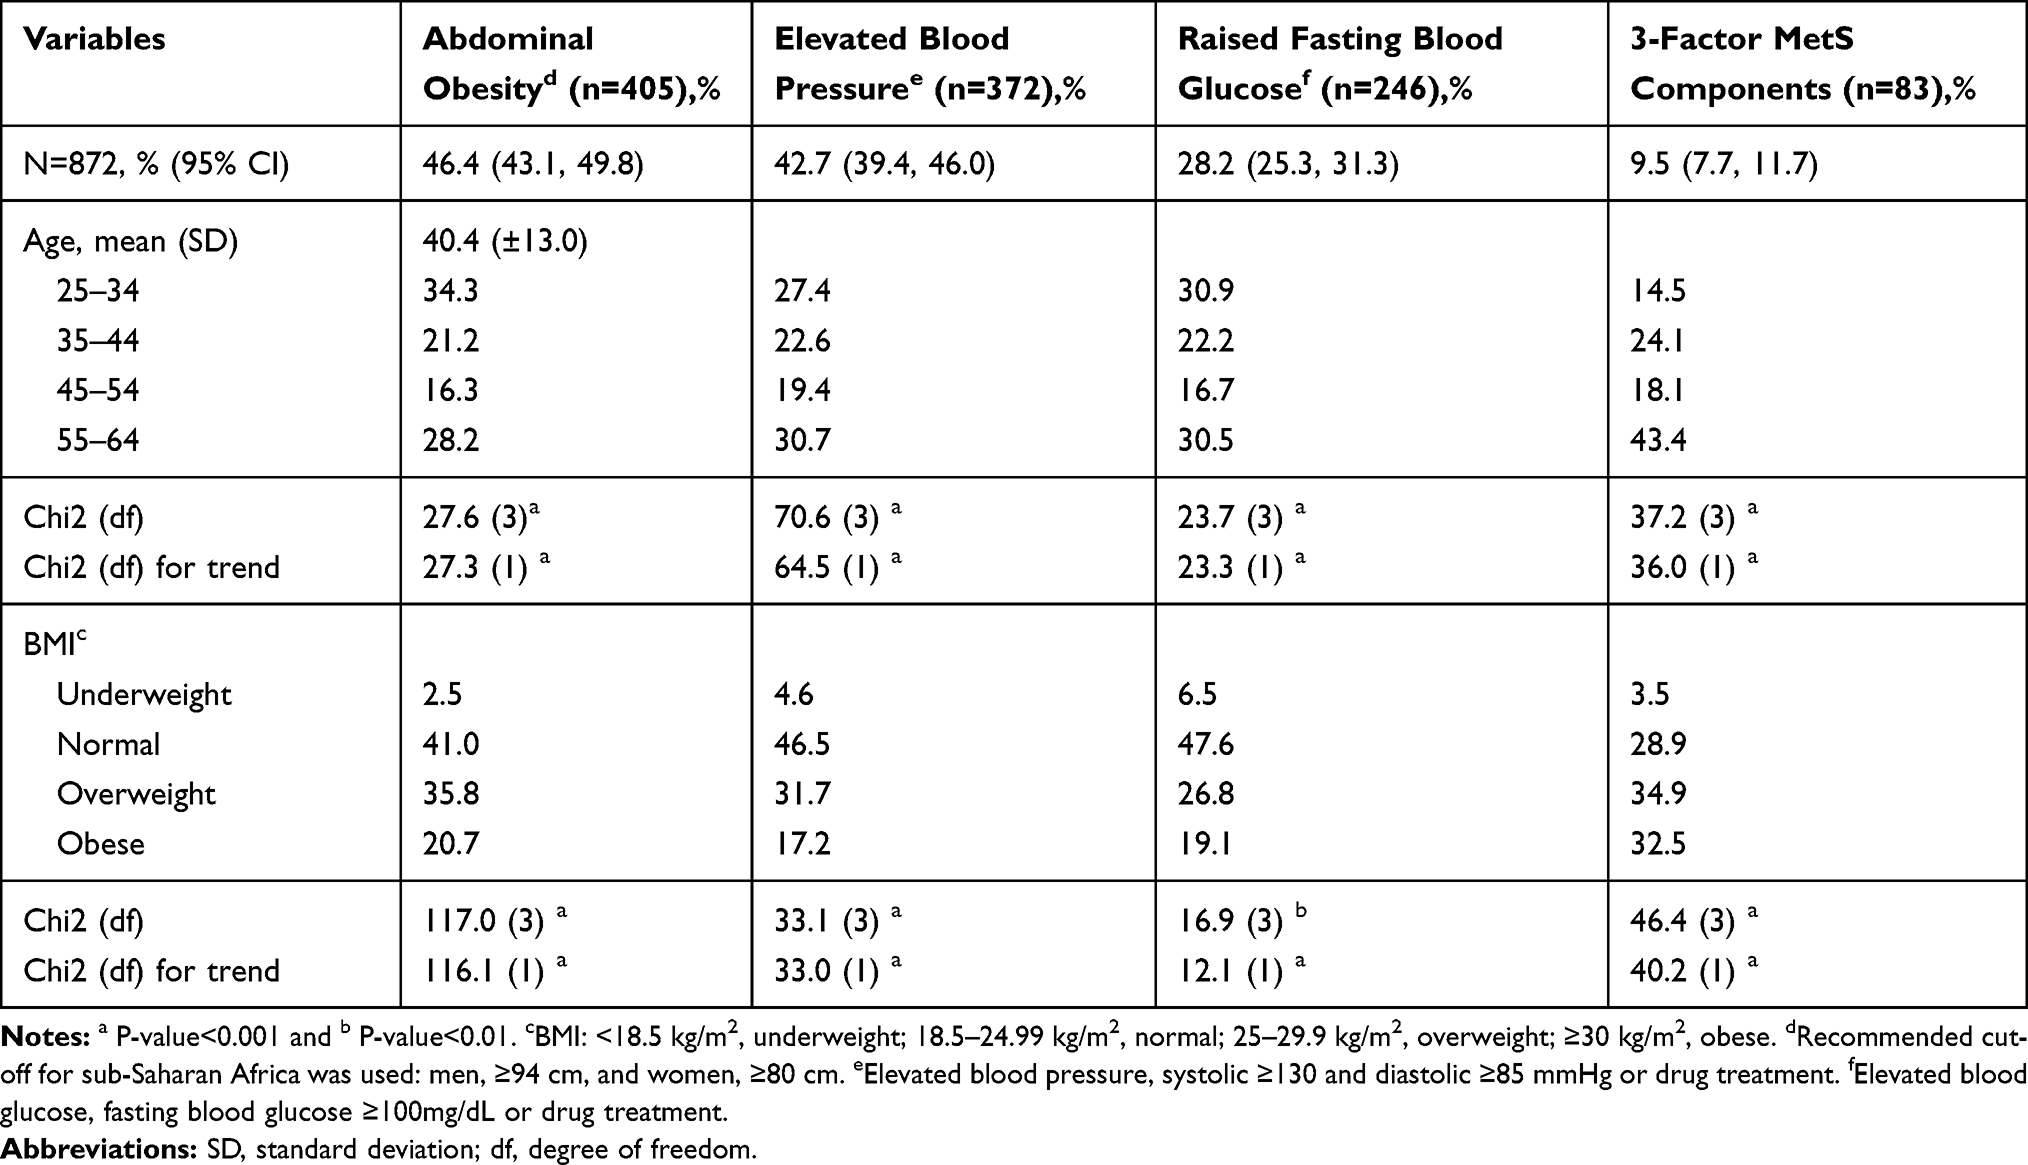 |
Table 3 The Prevalence of Abdominal Obesity, Elevated Blood Pressure, and Raised Fasting Blood Glucose and the 3-Factor MetS Components Among Urban Adults in Dire Dawa, East Ethiopia, 2017 |
The age-adjusted prevalence of the individual and the 3-factor MetS components was shown in Figure 1. Women had a higher burden of the 3-factor MetS components compared to men, (crude: 11.6%, 95% CI: 9.2, 14.5 vs 5.2%, 95% CI: 3.2, 8.5; age-adjusted: 11.4%, 95% CI: 8.7, 14.1 vs 5.2%, 95% CI: 2.6, 7.9) (Figure 1). The percent distribution of the 3-factor MetS components was higher in subjects with raised fasting blood glucose, 33.7% (83/246), followed by elevated blood pressure, 22.3% (83/372), and abdominal obesity, 20.5% (83/405).
 |
Figure 1 Age-adjusted prevalence of the individual and the 3-factor metabolic syndrome (MetS) components (abdominal obesity, elevated blood pressure, and raised fasting blood glucose) by sex among urban adults in Dire Dawa, eastern Ethiopia. The joint interim statement’s definition of the MetS components was used. Accordingly the following cut-offs were used: abdominal obesity (the cut-off recommended for sub-Saharan Africa): men, ≥94 cm, and women, ≥80 cm; Elevated blood pressure: systolic ≥130 and diastolic ≥85 mmHg or drug treatment; And elevated blood glucose: fasting blood glucose ≥100mg/dL or drug treatment. |
Factors Associated with the Individual and the 3-Factor MetS Components
Covariates with P-value <0.2 in the bivariate models were entered into the multivariable-adjusted robust variance Poisson regression model. Age, sex, education, marital status, PA, occupation, ever cigarette smoking, waist circumference, and BMI had some association with the individual and the 3-factor MetS components (Table 4).
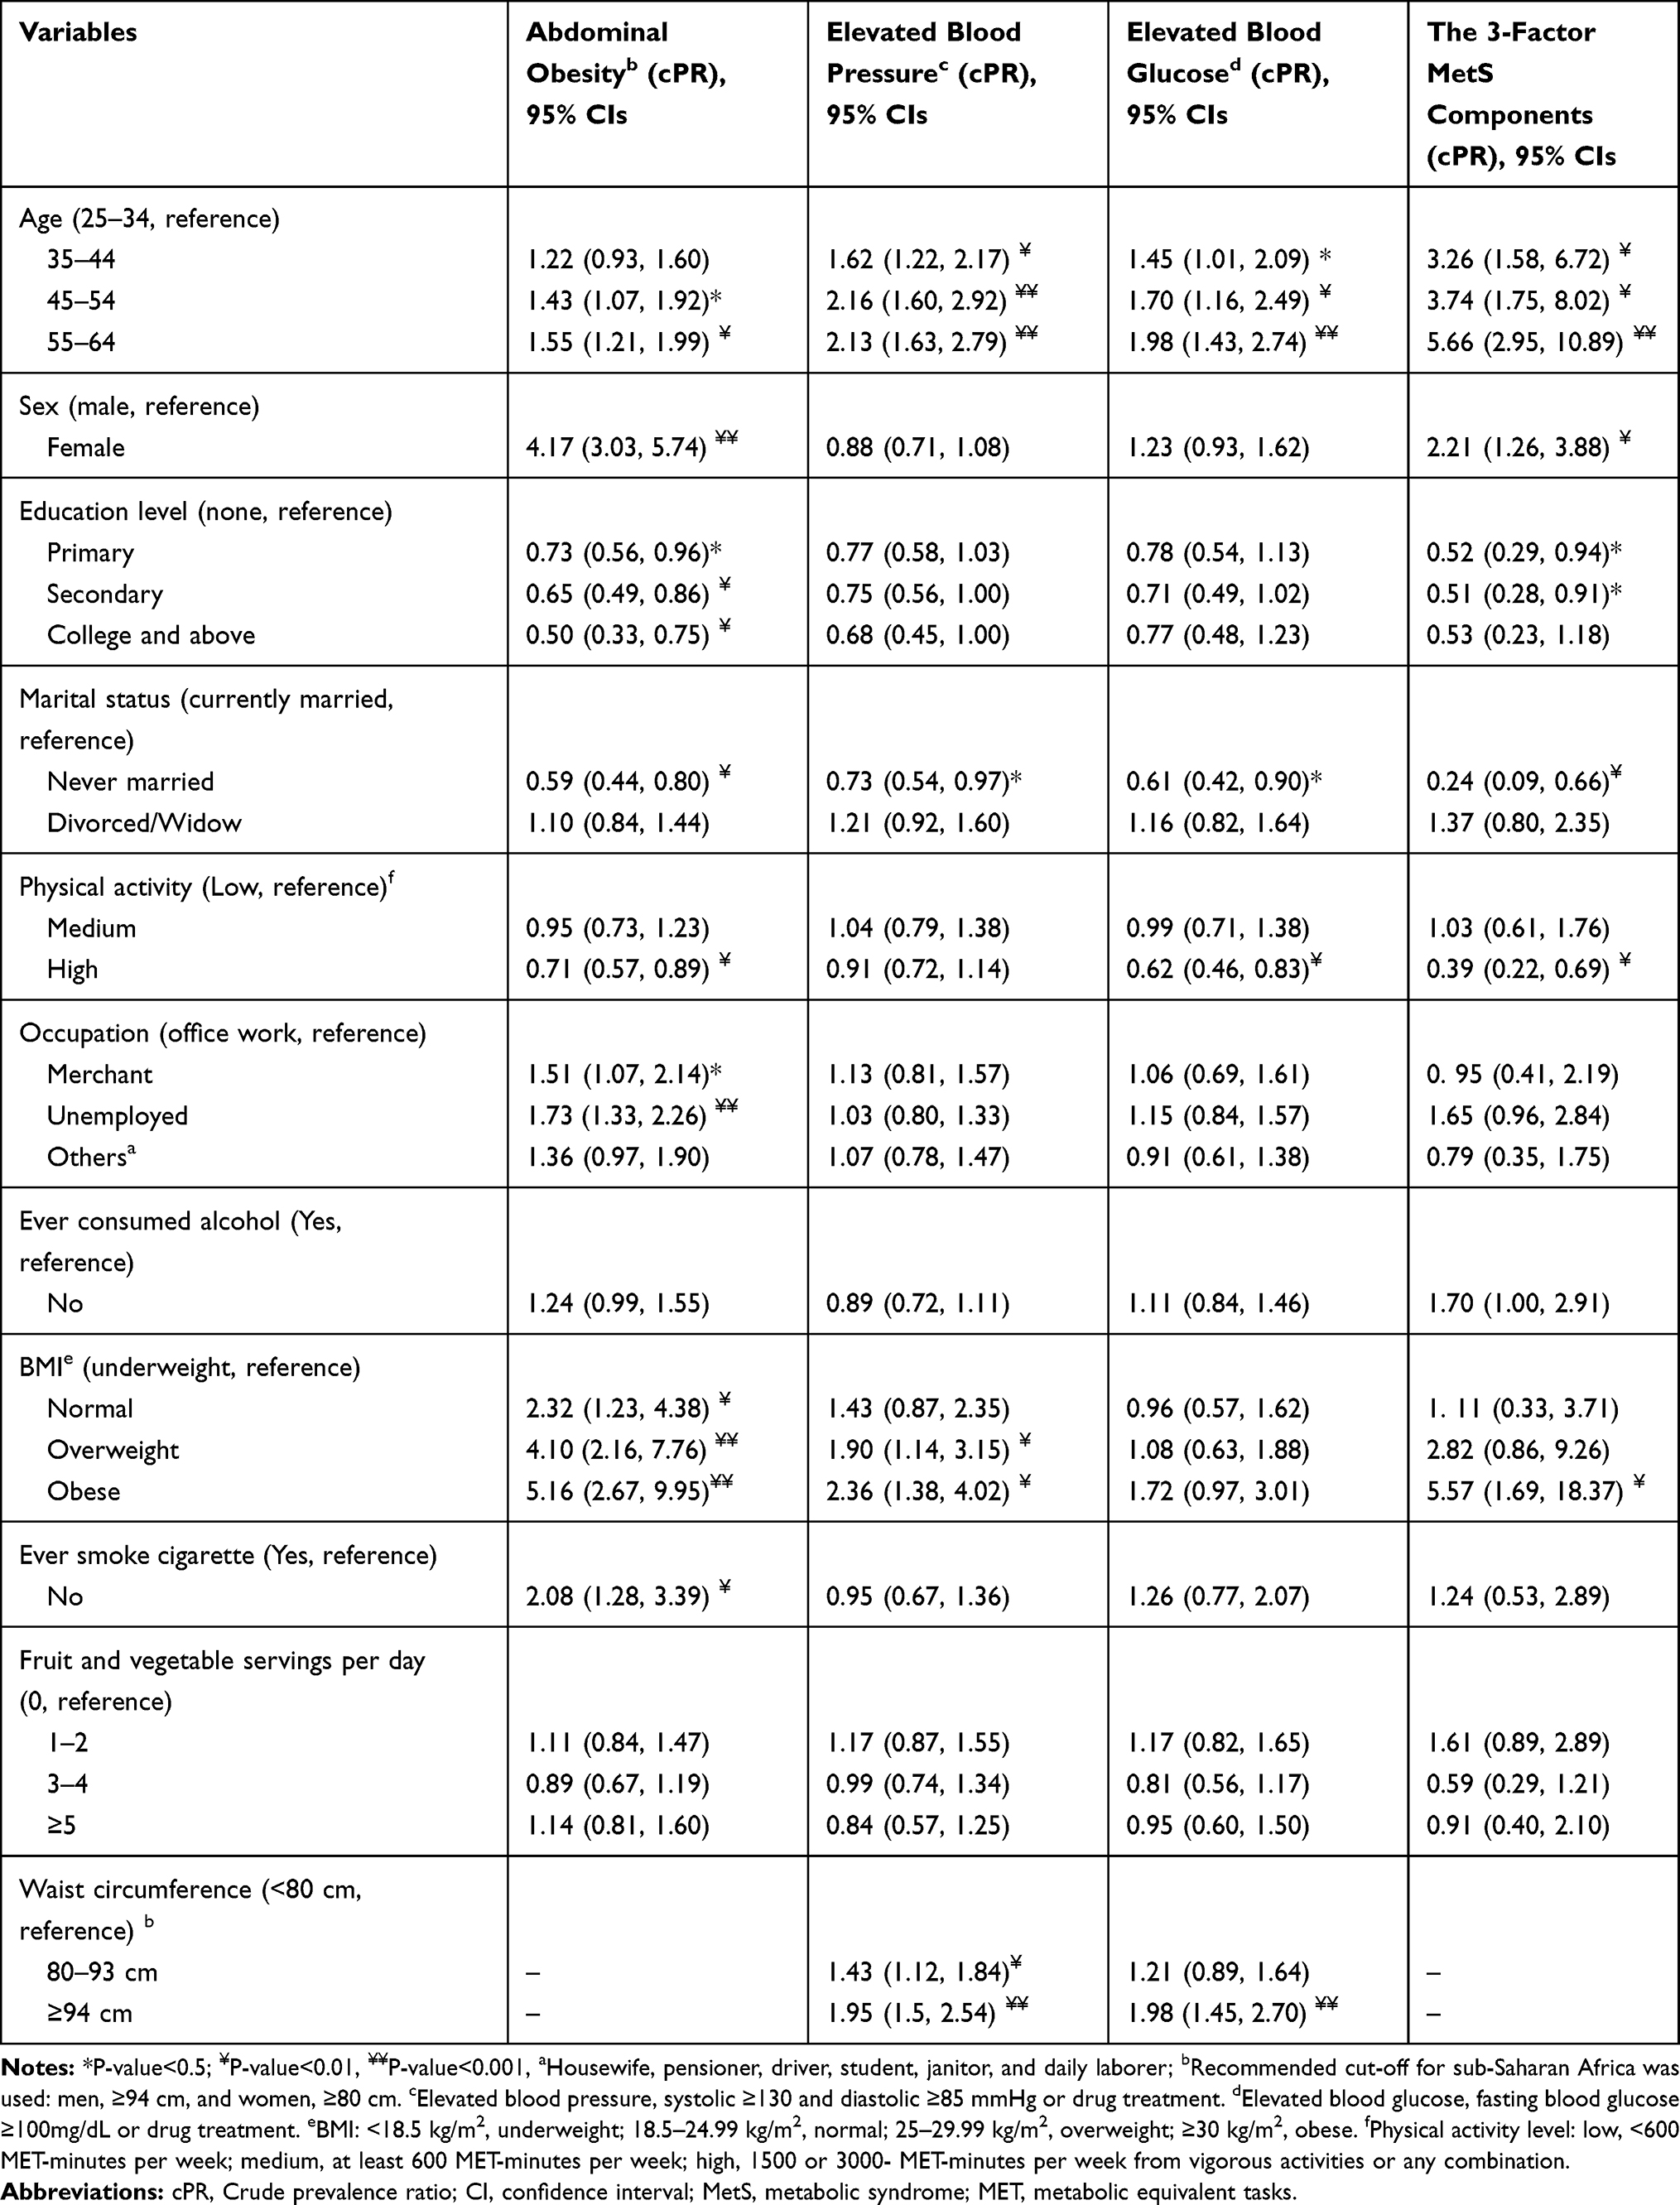 |
Table 4 Crude Prevalence Ratios for the Associations of Socio-Demographic and Behavioral Characteristics of Adults with the Individual and the 3-Factor Components of the Metabolic Syndrome in Dire Dawa City, East Ethiopia, 2017 |
In the multivariable robust variance Poisson regression model women were more than 3 times more likely of having a higher prevalence of abdominal obesity compared to men (aPR (adjusted prevalence ratio) =3.65, 95% CI: 2.59, 5.13). However, compared to men, women had a 22% lower prevalence of elevated blood pressure (aPR=0.78, 95% CI: 0.62, 0.98). Compared to younger age group, 25–34 years, older ages had over 85% higher prevalence of elevated blood pressure (45–54 years, aPR=1.85, 95% CI: 1.34, 2.56; 55–64 years, aPR=1.87, 95% CI: 1.37, 2.54), 65% higher prevalence of raised fasting blood glucose (55–64 years, aPR=1.65, 95% CI: 1.13, 2.39), and over 4 times higher prevalence of the 3-factor MetS components (55–64 years, aPR=4.37, 95% CI: 2.12, 9.04). Adults with a high-level PA had a significantly lower proportion of raised fasting blood glucose (aPR=0.69, 95% CI: 0.51, 0.94) and the 3-factor MetS components (aPR=0.56, 95% CI: 0.31, 1.01) compared to adults with no/or low-level of PA (Table 5).
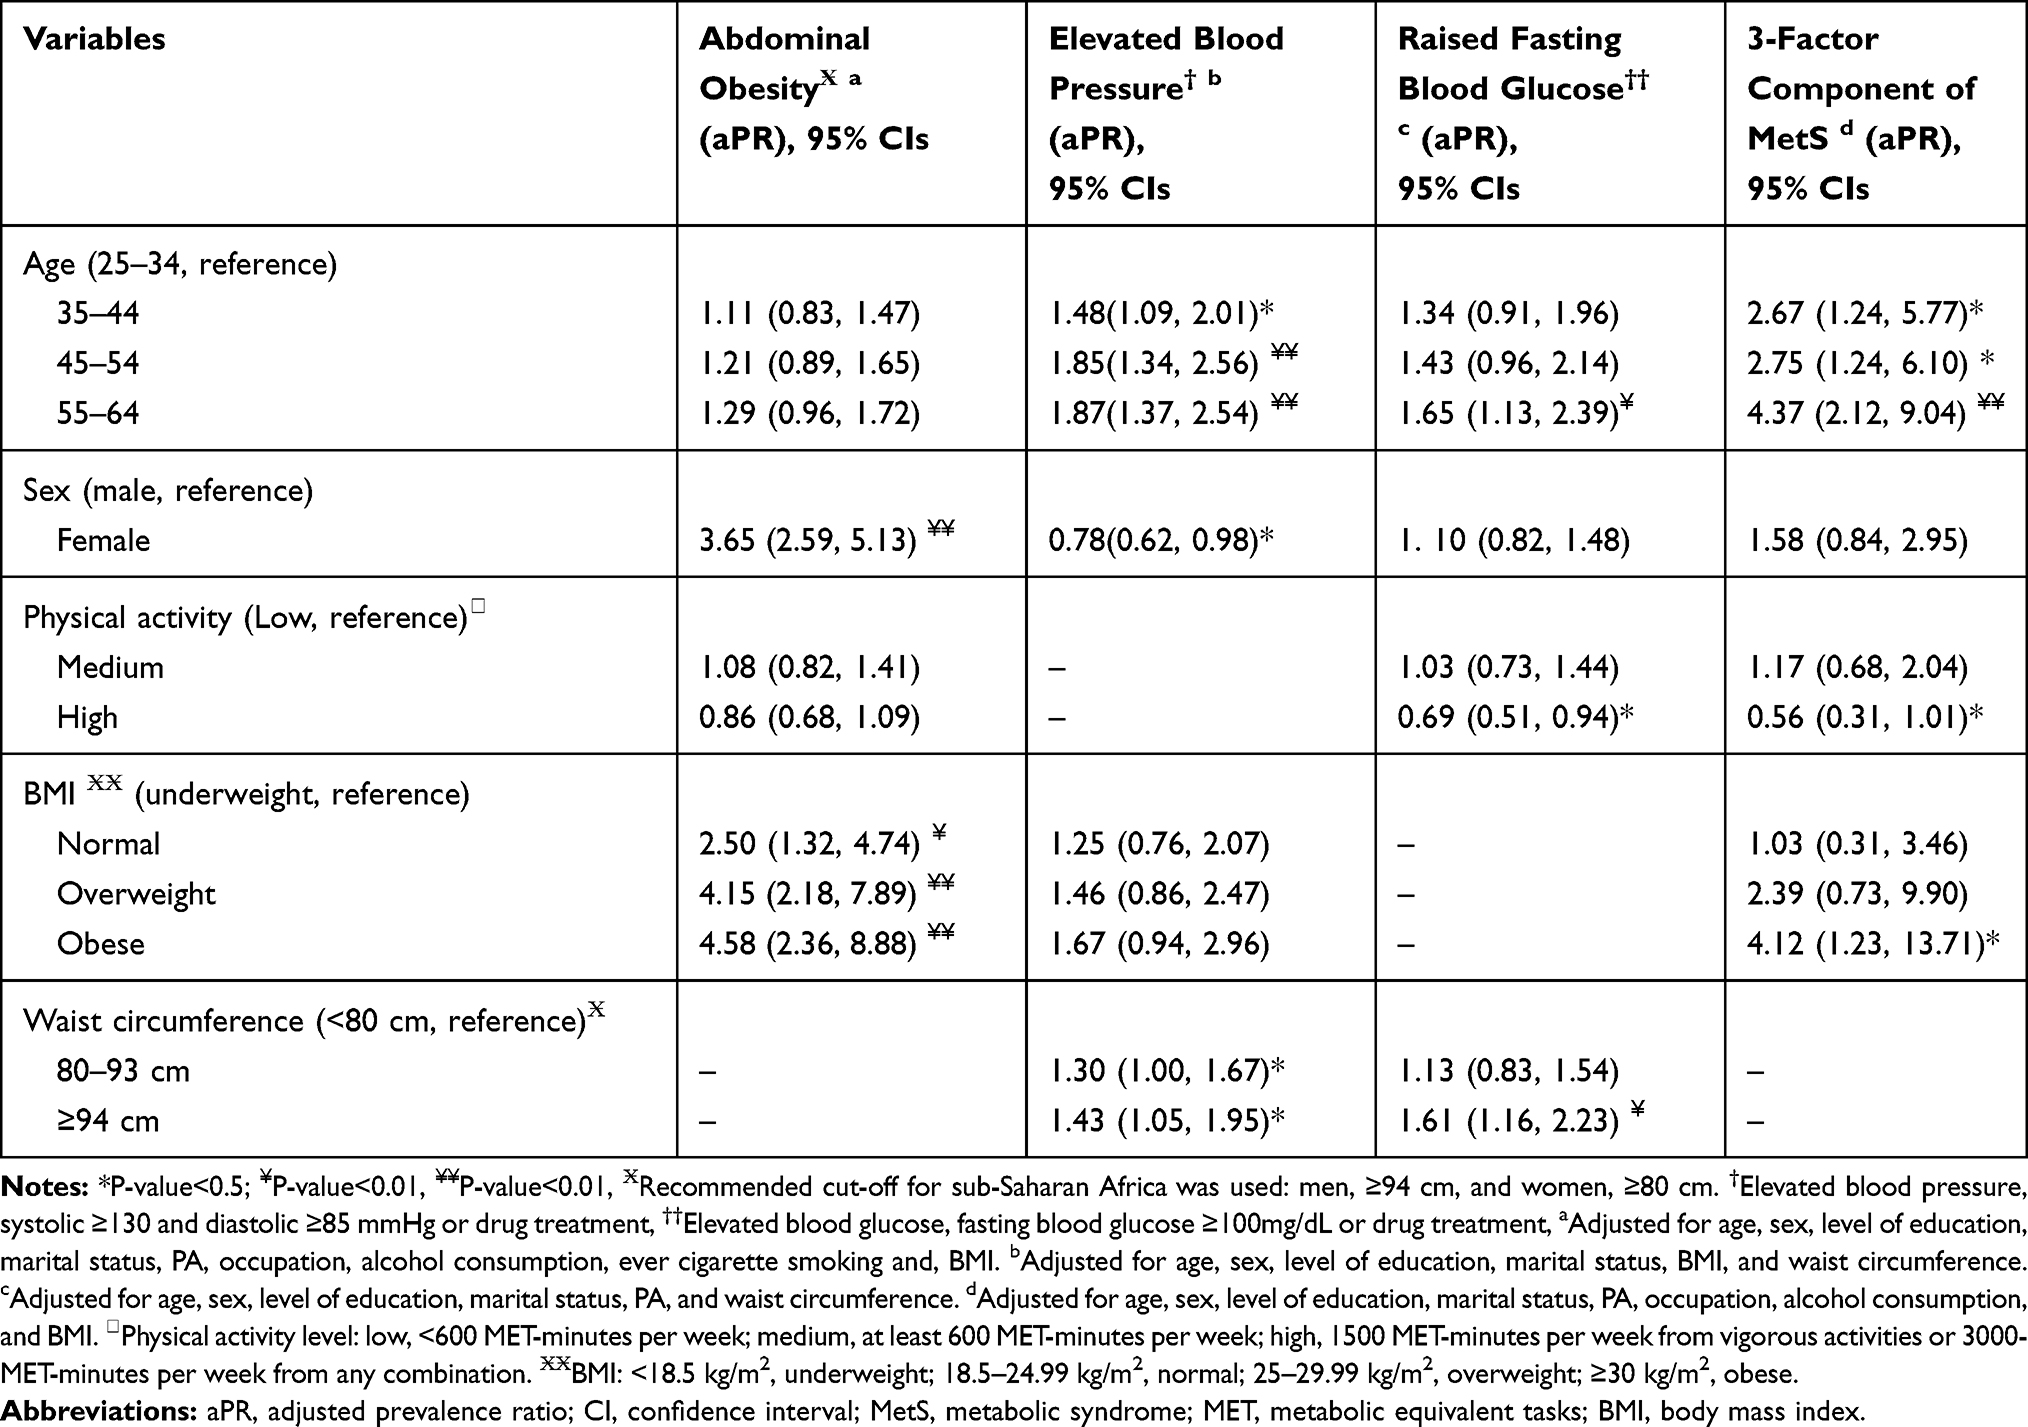 |
Table 5 Adjusted Prevalence Ratios for the Associations Between Sociodemographic Factors, The Individual, and the 3-Factor MetS Components Among Adults in Dire Dawa City, East Ethiopia, 2017 |
Adults with a BMI cut-off values of normal weight, overweight, and obese had 2.5 times, 4 times, and 4.6 times higher prevalence of abdominal obesity compared with those having a lean weight. Furthermore, adults with general obesity had 4 times more likely of having a higher prevalence of joint occurrence of the three MetS components (aPR=4.12, 95% CI: 1.23, 13.71) (Table 5).
Discussion
Evidence shows that the presence of a single component of the MetS increases the risk of developing the MetS later in life.36 In this study, using the JIS criteria,8 the estimated prevalence of the three individual components of MetS was 46.4% for abdominal obesity, 42.7% for elevated blood pressure, and 28.2% for raised fasting plasma glucose. The prevalence of the 3-factor MetS components was 9.5%. The correlates associated with either the joint occurrences of the three or the individual components were age, sex, self-reported high-level PA, waist circumference, and BMI.
The prevalence of abdominal obesity in the current study was 46.4% with a higher burden among women than men, 62 versus 14.7%. In a community-based study, Prakaschnadra et al reported a 54.9% prevalence of abdominal obesity among South African Asian-Indians.10 Studies in South Korean37 and Tanzanian adults38 reported an abdominal obesity prevalence of 35.1% in women and 23.8% among South Korean men37 and only 6.9% among Tanzanian men.38 The 2015 national STPES survey in Ethiopia reported that 39.8% of subjects with MetS had abdominal obesity.23 Consistent with our findings, studies reported a higher prevalence of abdominal obesity among women but the magnitude of the prevalence estimates varied as the studies used different definitions (waist circumference for men≥90 or 102 cm and women≥80 or 88 cm).10,37,38 Furthermore, differences in other behavioral characteristics including PA31 and healthy eating39,40 may explain the observed differences in the estimates.
We found a higher prevalence of both elevated blood pressure and elevated blood glucose in the study setting. The estimated elevated blood pressure was 42.7% with a higher prevalence among men than women, 46.5 versus 40.8%. Several studies reported consistent findings that men had a higher prevalence of elevated blood pressure. For example, Lee et al reported a prevalence of 43.9% with a higher rate among men than women in South Korea, 51.0 versus 37.3%.37 In other large Asian studies, which used similar definitions as with this study, the prevalence of elevated blood pressure was reported to be 44.1% in China and 64.5% in Indonesia.41,42 Adult prevalence of elevated fasting blood glucose in our study was 28.2% which was higher compared with the report by Guo et al among adults in China, 19%.41 Whereas, compared to the estimate in our study, Lee et al reported a higher prevalence of elevated blood glucose among men (34%) and a slightly lower prevalence among women (28.5%).37
The prevalence of the 3-factor MetS components (abdominal obesity, elevated blood pressure, and elevated blood glucose) in this study was 9.5%, with a higher prevalence among women compared to men, 11.6 versus 5.2%. A study of MetS across Europe estimated a 12.7% prevalence of a cluster of the above 3-factor MetS components.43 Prakaschandra et al reported an increased prevalence of 3-factor MetS components by age ranging between 19% and 23% among adults aged 25–64 years old.10 Another study on the prevalence of a three-factor MetS components separately excluding triglyceride and blood pressure reported: 29.5% versus 21.5% among 56–65 years and 24.1% versus 25% among 46–55 years, respectively.44 Evidence indicates that presence of a single MetS component increases the risk of developing the MetS later in life36 which in turn is reported to increase the risk of cardiovascular diseases (CVD) by 2.88 times, coronary heart diseases (CHD) by 2.54 times, and type II diabetes (T2DM) by 7-fold.45–47 Therefore, due to its effect on the development of important non-communicable diseases and a possible clustering of risk factors, the presence of a single component of the MetS should not be overlooked.
Demographic variables both age and sex were associated with elevated blood pressure and age was further associated with elevated blood glucose and cluster of the 3-factor MetS components. Furthermore, female sex is independently associated with a higher proportion of abdominal obesity. Our results iterated previous findings that reported an increase in age was associated with the presence of elevated blood pressure48,49 and elevated blood glucose50,51 or clustering of metabolic risk factors.10,52 The finding that elevated blood pressure was more likely among males than females was also reported in previous studies.53,54 Some studies reported no gender difference or a higher prevalence of hypertension among older women than men in Africa.48,55 We hypothesize that frequent regular Khat chewing, which was reported to be associated with elevated blood pressure and hypertension, among Ethiopian men that often clusters alcohol drinking and cigarette smoking56,57 could explain the observed gender difference. Concerning abdominal obesity and MetS, women were consistently reported to have a significantly higher burden of both in previous studies.4,11,37,41 However, we only found a higher proportion of abdominal obesity among women but the 3-factor components of MetS did not vary by gender.
Body mass index was strongly associated with abdominal obesity as had been reported in previous studies.54,58 A significant proportion of adults in this study with abdominal obesity, 41%, had normal body weight. Shen et al reported that 30.3% of adults with normal-weight had abdominal obesity.59 While general and abdominal obesity are independently associated with cardiometabolic risk factors, their co-occurrence establishes a stronger risk than the presence of either.59 Consistent with our findings, general obesity had also been reported to predict MetS.10 For example, Prakaschandra et al reported that adults with general obesity had an 8.5-fold more likely to develop MetS with the risk becoming 19-fold higher among those with abdominal obesity.10 Therefore, the presence of abdominal obesity among adults with a normal or lean weight and, most importantly, the co-existence of general obesity and abdominal obesity need a public health attention to contain the growing burden of cardiovascular diseases burden which accounted for 16% of all deaths in Ethiopia.20
A self-reported high-level PA was inversely associated with the 3-factor MetS components and elevated fasting blood glucose. Consistent findings were reported in previous studies from different settings.28,60 However, we did not find that high-level PA reduces the risk of elevated blood pressure and abdominal obesity, which were against previous reports.61 In the face of the global pandemic of obesity,62 which was regarded as a driver of the MetS,10 promoting PA that would combine individual behavioral and lifestyle interventions62 could have a positive impact on reducing the development of the MetS.60
The strength of this study was that we provided estimates of the cardiometabolic risk factors, both for the individual and the 3-factor MetS components, adjusting for important confounders including demographic variables, behavioral factors, and anthropometric measurements in a large community-based sample. We also reported a prevalence ratio using robust variance Poisson regression instead of the odds ratio which overestimates an effect size when the event is not a rare one.35 However, we did not include information on family history of hypertension and diabetes mellitus and also existing chronic conditions which may have affected our estimates. Furthermore, due to a cross-sectional nature of the study, we cannot establish a causal association.
Conclusion
The prevalence of the individual MetS components abdominal obesity, elevated blood pressure, and elevated fasting blood glucose was high in the study setting and the same was for the 3-factor MetS components. Men had an increased prevalence of elevated blood pressure and women had a higher burden of the 3-factor MetS components and also of abdominal obesity. An increased level of physical inactivity and lower consumption of fruit and vegetables may contribute to the upsurging burden of cardiometabolic risk factors and also clustering of these factors. As we found, with the presence of a single MetS component, there is a higher possibility that an individual has additional components clustered calling for screening at the community level.
Data Sharing Statement
All data pertaining to the findings are presented in this paper. However, the data can be obtained from the corresponding author at any time on reasonable request.
Acknowledgments
The authors thank the study subjects involved in this study and the data collectors. We are pleased with the support of Haramaya University by funding this study.
Author Contributions
All authors contributed to data management; MM drafted the manuscript and conducted data analysis; all authors critically reviewed the draft and revised the article, gave final approval of the version to be published, and agree to be accountable for all aspects of the work.
Disclosure
The authors declare that they have no competing interests.
References
1. WHO. Noncommunicable diseases; 2018 [
2. Stanaway JD, Afshin A, Gakidou E, et al. Global, regional, and national comparative risk assessment of 84 behavioural, environmental and occupational, and metabolic risks or clusters of risks for 195 countries and territories, 1990–2017: a systematic analysis for the global burden of disease study 2017. Lancet. 2018;392(10159):1923–1994.
3. Gouda HN, Charlson F, Sorsdahl K, et al. Burden of non-communicable diseases in sub-Saharan Africa, 1990–2017: results from the global burden of disease study 2017. Lancet Glob Health. 2019;7(10):e1375–e87. doi:10.1016/S2214-109X(19)30374-2
4. Alsheikh-Ali AA, Omar MI, Raal FJ, et al. Cardiovascular risk factor burden in Africa and the Middle East: the Africa Middle East cardiovascular epidemiological (ACE) study. PLoS One. 2014;9(8):e102830. doi:10.1371/journal.pone.0102830
5. Krzesiński P, Stańczyk A, Piotrowicz K, Gielerak G, Uziębło-Zyczkowska B, Skrobowski A. Abdominal obesity and hypertension: a double burden to the heart. Hypertens Res. 2016;39(5):349–355. doi:10.1038/hr.2015.145
6. Patel SA, Ali MK, Alam D, et al. Obesity and its relation with diabetes and hypertension: a cross-sectional study across 4 geographical regions. Glob Heart. 2016;11(1):71–9.e4. doi:10.1016/j.gheart.2016.01.003
7. Niu J, Seo D-C. Central obesity and hypertension in Chinese adults: a 12-year longitudinal examination. Prev Med. 2014;62:113–118. doi:10.1016/j.ypmed.2014.02.012
8. Alberti K, Eckel Robert H, Grundy Scott M, et al. Harmonizing the metabolic syndrome. Circulation. 2009;120(16):1640–1645. doi:10.1161/CIRCULATIONAHA.109.192644
9. Ezenwaka CE, Okoye O, Esonwune C, et al. High prevalence of abdominal obesity increases the risk of the metabolic syndrome in Nigerian type 2 diabetes patients: using the international diabetes federation worldwide definition. Metab Syndr Relat Disord. 2014;12(5):277–282. doi:10.1089/met.2013.0139
10. Prakaschandra R, Naidoo DP. Increased waist circumference is the main driver for the development of the metabolic syndrome in South African Asian Indians. Diabetes Metab Syndr. 2017;11:S81–S5. doi:10.1016/j.dsx.2016.12.011
11. Jaspers Faijer-Westerink H, Kengne AP, Meeks KAC, Agyemang C. Prevalence of metabolic syndrome in sub-Saharan Africa: a systematic review and meta-analysis. Nutr Metab Cardiovasc Dis. 2020;30(4):547–565. doi:10.1016/j.numecd.2019.12.012
12. Li X, Li X, Fang F, Fu X, Lin H, Gao Q. Is metabolic syndrome associated with the risk of recurrent stroke: a meta-analysis of cohort studies. J Stroke Cerebrovasc Dis. 2017;26(12):2700–2705. doi:10.1016/j.jstrokecerebrovasdis.2017.03.014
13. Rashidbeygi E, Safabakhsh M, Delshad Aghdam S, Mohammed SH, Alizadeh S. Metabolic syndrome and its components are related to a higher risk for albuminuria and proteinuria: evidence from a meta-analysis on 10,603,067 subjects from 57 studies. Diabetes Metab Syndr. 2019;13(1):830–843. doi:10.1016/j.dsx.2018.12.006
14. Gobal F, Deshmukh A, Shah S, Mehta JL. Triad of metabolic syndrome, chronic kidney disease, and coronary heart disease with a focus on microalbuminuria: death by overeating. J Am Coll Cardiol. 2011;57(23):2303–2308. doi:10.1016/j.jacc.2011.02.027
15. Bigna JJ, Noubiap JJ. The rising burden of non-communicable diseases in sub-Saharan Africa. Lancet Glob Health. 2019;7(10):e1295–e6. doi:10.1016/S2214-109X(19)30370-5
16. Hossain P, Kawar B, El Nahas M. Obesity and diabetes in the developing world — a growing challenge. N Engl J Med. 2007;356(3):213–215. doi:10.1056/NEJMp068177
17. WHO. Geneva, Switzerland: Global action plan for the prevention and control of noncommunicable diseases 2013–2020; 2013 [
18. Nyaaba GN, Stronks K, De-graft Aikins A, Kengne AP, Agyemang C. Tracing Africa’s progress towards implementing the non-communicable diseases global action plan 2013–2020: a synthesis of WHO country profile reports. BMC Public Health. 2017;17(1):297. doi:10.1186/s12889-017-4199-6
19. WHO Regional Office for Africa. Noncommunicable diseases country profiles; 2014. Available from: https://www.afro.who.int/health-topics/noncommunicable-diseases.
20. Girum T, Mesfin D, Bedewi J, Shewangizaw M. The burden of noncommunicable diseases in Ethiopia, 2000–2016: analysis of evidence from global burden of disease study 2016 and global health estimates 2016. Int J Chronic Dis. 2020;2020:3679528. doi:10.1155/2020/3679528
21. Kibret KT, Mesfin YM. Prevalence of hypertension in Ethiopia: a systematic meta-analysis. Public Health Rev. 2015;36(1):14. doi:10.1186/s40985-015-0014-z
22. Tesfaye B, Alebel A, Gebrie A, et al. Diabetes mellitus and its association with hypertension in ethiopia: a systematic review and meta-analysis. Diabetes Res Clin Pract. 2019:156.
23. Gebreyes YF, Goshu DY, Geletew TK, et al. Prevalence of high bloodpressure, hyperglycemia, dyslipidemia, metabolic syndrome and their determinants in Ethiopia: evidences from the national NCDs STEPS survey, 2015. PLoS One. 2018;13(5):e0194819. doi:10.1371/journal.pone.0194819
24. Birarra MK, Gelayee DA. Metabolic syndrome among type 2 diabetic patients in Ethiopia: a cross-sectional study. BMC Cardiovasc Disord. 2018;18(1):149. doi:10.1186/s12872-018-0880-7
25. Kassa A, Woldesemayat EM. Hypertension and diabetes mellitus among patients at hawassa university comprehensive specialized hospital, Hawassa, Southern Ethiopia. Int J Chronic Dis. 2019;2019:8. doi:10.1155/2019/2509242
26. World, population review. Population of cities in Ethiopia; 2018. Available from: http://worldpopulationreview.com/countries/ethiopia-population/cities/.
27. Dean AG, Sullivan KM, MM S. OpenEpi: Open Source Epidemiologic Statistics for Public Health. Atlanta, USA: Emory University; 2009.
28. Workalemahu T, Gelaye B, Berhane Y, Williams MA. Physical activity and metabolic syndrome among Ethiopian adults. Am J Hypertens. 2013;26(4):535–540. doi:10.1093/ajh/hps079
29. WHO. WHO STEPwise approach to chronic disease risk factor surveillance- instrument v2.1. Available from: www.who.int/ncds/surveillance/steps/STEPS_Instrument_v2.1.pdf.
30. WHO. Body mass index-BMI: World Health Organization, regional office for Europe. Available from: http://www.euro.who.int/en/health-topics/disease-prevention/nutrition/a-healthy-lifestyle/body-mass-index-bmi.
31. Mengesha MM, Roba HS, Ayele BH, Beyene AS. Level of physical activity among urban adults and the socio-demographic correlates: a population-based cross-sectional study using the global physical activity questionnaire. BMC Public Health. 2019;19(1):1160. doi:10.1186/s12889-019-7465-y
32. WHO. The WHO STEPwise approach to noncommunicable disease risk factor surveillance: WHO STEPS surveillance manual. Phys Act. 2017.
33. Azur MJ, Stuart EA, Frangakis C, Leaf PJ. Multiple imputation by chained equations: what is it and how does it work? Int J Methods Psychiatr Res. 2011;20(1):10. doi:10.1002/mpr.329
34. Sankoh O, Sharrow D, Herbst K, et al. The INDEPTH standard population for low- and middle-income countries, 2013. Glob Health Action. 2014;7(1):6. doi:10.3402/gha.v7.23286
35. Coutinho LMS, Scazufca M. Menezes PR methods for estimating prevalence ratios in cross-sectional studies. Rev Saúde Pública. 2008;42(6):992–8.
36. Cheung BMY, Wat NMS, Tam S, et al. Components of the metabolic syndrome predictive of its development: a 6-year longitudinal study in Hong Kong Chinese. Clin Endocrinol (Oxf). 2008;68(5):730–737. doi:10.1111/j.1365-2265.2007.03110.x
37. Lee SE, Han K, Kang YM, et al. Trends in the prevalence of metabolic syndrome and its components in South Korea: findings from the Korean national health insurance service database (2009–2013). PLoS One. 2018;13(3):e0194490. doi:10.1371/journal.pone.0194490
38. Munyogwa MJ, Mtumwa AH. The prevalence of abdominal obesity and its correlates among the adults in Dodoma Region, Tanzania: a community-based cross-sectional study. Adv Med. 2018;2018:6123156. doi:10.1155/2018/6123156
39. Buendia JR, Bradlee ML, Singer MR, Moore LL. Diets higher in protein predict lower high blood pressure risk in framingham offspring study adults. Am J Hypertens. 2014;28(3):372–379. doi:10.1093/ajh/hpu157
40. Steffen LM, Kroenke CH, Yu X, et al. Associations of plant food, dairy product, and meat intakes with 15-y incidence of elevated blood pressure in young black and white adults: the coronary artery risk development in young adults (CARDIA) study. Am J Clin Nutr. 2005;82(6):1169–1177. doi:10.1093/ajcn/82.6.1169
41. Guo H, Gao X, Ma R, et al. Prevalence of metabolic syndrome and its associated factors among multi-ethnic adults in rural areas in Xinjiang, China. Sci Rep. 2017;7(1):17643. doi:10.1038/s41598-017-17870-5
42. Herningtyas EH, Ng TS. Prevalence and distribution of metabolic syndrome and its components among provinces and ethnic groups in Indonesia. BMC Public Health. 2019;19(1):377. doi:10.1186/s12889-019-6711-7
43. Scuteri A, Laurent S, Cucca F, et al. Metabolic syndrome across Europe: different clusters of risk factors. Eur J Prev Cardiol. 2014;22(4):486–491. doi:10.1177/2047487314525529
44. Jiang B, Zheng Y, Chen Y, et al. Age and gender-specific distribution of metabolic syndrome components in East China: role of hypertriglyceridemia in the SPECT-China study. Lipids Health Dis. 2018;17(1):92. doi:10.1186/s12944-018-0747-z
45. Cabré -J-J, Martín F, Costa B, et al. Metabolic syndrome as a cardiovascular disease risk factor: patients evaluated in primary care. BMC Public Health. 2008;8(1):251. doi:10.1186/1471-2458-8-251
46. Wilson PWF, D’Agostino RB, Parise H, Sullivan L, Meigs JB. Metabolic syndrome as a precursor of cardiovascular disease and type 2 diabetes mellitus. Circulation. 2005;112(20):3066–3072.
47. Yang G-R, Dye TD, Li D. Association between diabetes, metabolic syndrome and heart attack in US adults: a cross-sectional analysis using the behavioral risk factor surveillance system 2015. BMJ Open. 2019;9(9):e022990. doi:10.1136/bmjopen-2018-022990
48. Baldo MP, Zaniqueli DA, Magalhães P, Capingana DP, Silva AB, Mill JG. Gender-specific determinants of blood pressure elevation in Angolan adults. Blood Press. 2017;26(1):9–17. doi:10.1080/08037051.2016.1179500
49. Choi JY, Yun EK, Yeun EJ, Jeong ES. Factors influencing blood pressure classification for adults: gender differences. Int J Nurs Pract. 2019;25(3):e12706. doi:10.1111/ijn.12706
50. Chia Chee W, Egan Josephine M, Ferrucci L. Age-related changes in glucose metabolism, hyperglycemia, and cardiovascular risk. Circ Res. 2018;123(7):886–904. doi:10.1161/CIRCRESAHA.118.312806
51. Noordam R, Gunn DA, Tomlin CC, et al. High serum glucose levels are associated with a higher perceived age. Age (Dordr). 2013;35(1):189–195. doi:10.1007/s11357-011-9339-9
52. Li W, Song F, Wang X, et al. Prevalence of metabolic syndrome among middle-aged and elderly adults in China: current status and temporal trends. Ann Med. 2018;50(4):345–353. doi:10.1080/07853890.2018.1464202
53. Rhee E-J, Cho J-H, Kwon H, et al. Association between abdominal obesity and increased risk for the development of hypertension regardless of physical activity: a nationwide population-based study. J Clin Hypertens. 2018;20(10):1417–1426. doi:10.1111/jch.13389
54. Lukács A, Horváth E, Máté Z, et al. Abdominal obesity increases metabolic risk factors in non-obese adults: a Hungarian cross-sectional study. BMC Public Health. 2019;19(1):1533. doi:10.1186/s12889-019-7839-1
55. Macia E, Gueye L, Duboz P, Oni T. Hypertension and obesity in Dakar, Senegal. PLoS One. 2016;11(9):e0161544. doi:10.1371/journal.pone.0161544
56. Tesfaye F, Byass P, Wall S, Berhane Y, Bonita R. Association of smoking and khat (Catha edulis Forsk) use with high blood pressure among adults in Addis Ababa, Ethiopia, 2006. Prev Chronic Dis. 2008;5(3):A89.
57. Getahun W, Gedif T, Tesfaye F. Regular Khat (Catha edulis) chewing is associated with elevated diastolic blood pressure among adults in Butajira, Ethiopia: a comparative study. BMC Public Health. 2010;10(1):390. doi:10.1186/1471-2458-10-390
58. Hu L, Huang X, You C, et al. Prevalence of overweight, obesity, abdominal obesity and obesity-related risk factors in southern China. PLoS One. 2017;12(9):e0183934. doi:10.1371/journal.pone.0183934
59. Shen C, Zhou Z, Lai S, et al. Urban-rural-specific trend in prevalence of general and central obesity, and association with hypertension in Chinese adults, aged 18–65 years. BMC Public Health. 2019;19(1):661. doi:10.1186/s12889-019-7018-4
60. Myers J, Kokkinos P, Nyelin E. Physical activity, cardiorespiratory fitness, and the metabolic syndrome. Nutrients. 2019;11(7):1652. doi:10.3390/nu11071652
61. Chu AH, Moy FM. Association between physical activity and metabolic syndrome among Malay adults in a developing country, Malaysia. J Sci Med Sport. 2014;17(2):195–200. doi:10.1016/j.jsams.2013.04.003
62. Blüher M. Obesity: global epidemiology and pathogenesis. Nat Rev Endocrinol. 2019;15(5):288–298. doi:10.1038/s41574-019-0176-8
 © 2020 The Author(s). This work is published and licensed by Dove Medical Press Limited. The
full terms of this license are available at https://www.dovepress.com/terms
and incorporate the Creative Commons Attribution
- Non Commercial (unported, 3.0) License.
By accessing the work you hereby accept the Terms. Non-commercial uses of the work are permitted
without any further permission from Dove Medical Press Limited, provided the work is properly
attributed. For permission for commercial use of this work, please see paragraphs 4.2 and 5 of our Terms.
© 2020 The Author(s). This work is published and licensed by Dove Medical Press Limited. The
full terms of this license are available at https://www.dovepress.com/terms
and incorporate the Creative Commons Attribution
- Non Commercial (unported, 3.0) License.
By accessing the work you hereby accept the Terms. Non-commercial uses of the work are permitted
without any further permission from Dove Medical Press Limited, provided the work is properly
attributed. For permission for commercial use of this work, please see paragraphs 4.2 and 5 of our Terms.