Back to Journals » Clinical Ophthalmology » Volume 16
Cluster Formation for Analyses of Glaucomatous Visual Field Defects in Central 10-2 Visual Field in Normal Tension Glaucoma Eyes
Authors Suzumura H ![]() , Yoshikawa K
, Yoshikawa K ![]() , Kimura T, Nanno M, Tsumura T
, Kimura T, Nanno M, Tsumura T
Received 17 December 2021
Accepted for publication 18 February 2022
Published 3 March 2022 Volume 2022:16 Pages 611—618
DOI https://doi.org/10.2147/OPTH.S354381
Checked for plagiarism Yes
Review by Single anonymous peer review
Peer reviewer comments 2
Editor who approved publication: Dr Scott Fraser
Hirotaka Suzumura,1 Keiji Yoshikawa,2 Tairo Kimura,3 Mami Nanno,4 Toyoaki Tsumura5
1Suzumura Eye Clinic, Tokyo, Japan; 2Yoshikawa Eye Clinic, Tokyo, Japan; 3Ueno Eye Clinic, Tokyo, Japan; 4Minamino Eye Clinic, Tokyo, Japan; 5Department of Ophthalmology, Fussa Municipal Hospital, Tokyo, Japan
Correspondence: Hirotaka Suzumura, Tel +81 3 3382 1109, Fax +81 3 3384 7090, Email [email protected]
Purpose: To develop a cluster system to analyze the retinal sensitivity loss of 68 test points in the central 10 degrees of standard automated perimetry (SAP) in eyes with normal tension glaucoma (NTG).
Patients and Methods: Patients with NTG who met the following criteria were included: visual acuity ≥ 0.7, SAP-derived mean deviation ≥− 15 dB, and pattern deviation probability plots with at least one point with a probability of < 0.5% and/or two or more contiguous points with a probability of < 1% that did not cross the horizontal meridian in the central 12 points of the 24-2 test points. SAP with the Swedish Interactive Threshold Algorithm Standard (SITA-S) 10-2 program (10-2) was performed within 6 months of the SITA-S 24-2. The averaged total deviation (TD) for each of the 68 test points in the 10-2 was calculated. Hierarchical cluster analyses were performed based on the deviation of the TDs of the test points, and a dendrogram was created. The number of clusters was determined following the Sturges’ rule.
Results: One hundred and twenty-six eyes of 126 patients (61.9± 11.4 years) were studied. Hierarchical cluster analysis of the TD values statistically obtained a dendrogram that divided the 68 test points into 7 clusters. Of these 7 clusters, 21 points belonging to the clusters in the papillomacular region included cluster 5. Cluster 5 was distributed above and below the horizontal meridian, which does not agree with the course of the retinal nerve fiber layer (RNFL).
Conclusion: The hierarchical cluster analysis of the TD values stratified the 68 test points of the 10-2 into seven clusters. Considering the course of the RNFL, cluster 5 was divided into clusters of 5a and 5b, and consequently eight clusters were considered to be appropriate for detecting glaucomatous visual field defects in the central 10 degrees in NTG eyes.
Keywords: normal tension glaucoma, 10-2 visual field, retinal sensitivity, retinal nerve fiber layer flow, cluster formation
Introduction
Evaluations of the quality of vision (QOV) have been used to determine the quality of life (QOL) in glaucoma patients. Although there are various factors related to the QOV in glaucoma patients,1 it has been shown that there was a high correlation between the retinal sensitivity and the QOV at the fixation point and the inferior region of the visual field.2–4
Standard automated perimetry (SAP) can be used to determine the retinal sensitivities in the central 24 or 30 degrees, and it is used to detect the existence of glaucomatous visual field defects (GVFDs). The retinal sensitivity loss in the early stage of GVFDs is generally observed in the Bjerrum or nasal area but occasionally around the fixation point.5 This is especially true in highly myopic eyes.6–8 In the SAP 30-2 and 24-2 programs, the test points are set in a six degree grid, but the 10-2 program has been advocated because the test points are spaced in a two degree grid making it easier to detect retinal sensitivity loss occurring adjacent to the fixation point or fovea.9–11 The 24-2 and 30-2 test patterns only test 12 locations compared to the 68 locations that the 10-2 tests within that same central area.
Local contiguous retinal sensitivity losses along the course of the retinal nerve fiber layer (RNFL) are characteristic of early GVFDs. Global indices such as the mean deviations (MD) are usually used to designate the severity of the GVFDs, but they cannot evaluate mild reductions of retinal sensitivity. To determine the degree and progress of local changes in retinal sensitivity, the clustering of a number of test points, and the analysis of the clustered points was reported for the 30-2 or 24-2 tests.12
Cluster formation analyses for the central 10 degree of visual field for primary open-angle glaucoma (POAG) and pseudoexfoliation glaucoma (PEG) eyes have been reported,22–24 but it has not been fully investigated in the eyes with NTG.
Thus, the purpose of this study was to develop a cluster system to analyze the retinal sensitivity reductions of the 68 test points within the 10-2 field in the eyes with normal tension glaucoma (NTG).
Materials and Methods
Patients
Patients with NTG who visited the Ueno Eye Clinic, or the Kagurazaka-Minamino Eye Clinic, or the Department of Ophthalmology of Fussa Municipal Hospital, or the Yoshikawa Eye Clinic, or the Suzumura Eye Clinic between January 2015 and December 2017 were studied. All had been examined by SAP more than three times with the Humphrey Field Analyzer (HFA, Carl Zeiss Ophthalmic Systems Inc., Dublin, CA) with the 24-2 program.
A diagnosis of NTG was made in eyes with an open angle by gonioscopy, an intraocular pressure <21 mmHg without treatment with the Goldmann applanation tonometer for at least three visits and glaucomatous optic neuropathy with corresponding VFDs. No underlying cause for the optic disc damage was detected in any of the patients.
Patients meeting the following criteria were included: age between 20 and 80 years, decimal best-corrected visual acuity (BCVA) ≥0.7, and refractive error (spherical equivalent) between +2.00 and −10.00 diopters.
Methods
SAP was performed on all of the patients with the Swedish Interactive Threshold Algorithm standard (SITA-S) with the 24-2 program. All patients met the Anderson criteria for glaucoma; an MD of ≥ −15 dB with fewer than 33% fixation losses, false-positive errors, and false-negative errors. We performed the 10-2 program with SITA-S for those 24-2 fields with the center 12 points in which at least one point with a probability of <0.5% on the pattern deviation probability plots (PD plots), and/or at least two contiguous points with a probability of <1% with the horizontal meridian as boundary on the PD plots. The data obtained from the 24-2 and 10-2 programs recorded within 6 months of the other were used for the analyses. When both eyes met the inclusion criteria, the eye with the better MD was selected.
Statistical Analyses
The values of the TD and their deviation at each of the 68 test points of the 10-2 program were calculated. For all eyes, the data of the left eye were converted to those from the right eye for analyses.
Hierarchical cluster analysis employing Ward’s method that minimized the ANOVA sum of squares of the TD value’s present for all test point combinations was used to create the clusters. Based on a combination of these clusters, a dendrogram was created (JMP 9.0.3). The number of statistically appropriate clusters in the hierarchical cluster analysis was applied with the Sturges’ rule.25
Informed Consent
The procedures used in this study were approved by the Research Ethics Committee of the Fussa Municipal Hospital in 2016. A signed informed consent was obtained from the patients for the acquisition and use of their information for research. The procedures conformed to the tenets of the Declaration of Helsinki.
Results
We studied 126 eyes of 126 patients whose average age was 61.9 ± 11.4 years with a range from 24 to 80 years. The demographics of the patients are summarized in Table 1. The average TD value for the 126 cases was calculated for 68 numbered points of the 10-2 program (Figure 1). The dendrogram that portrayed the results of the hierarchical cluster analysis between the individual test locations is shown in Figure 2. The number of statistically appropriate clusters was 7.2, and the test points of 10-2 were placed into the seven clusters by the dendrogram (Figure 3). Of these seven clusters, cluster 5 was divided into 5a and 5b along the course of the RNFL (Figure 4).
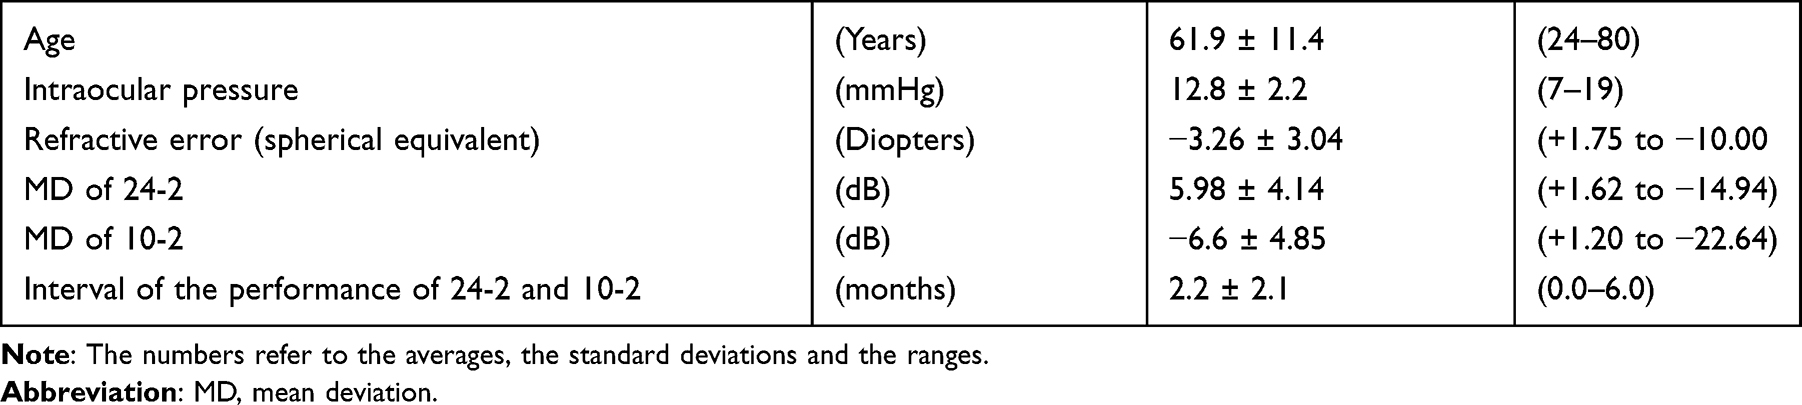 |
Table 1 Demographic Characteristics for the Glaucoma Patients |
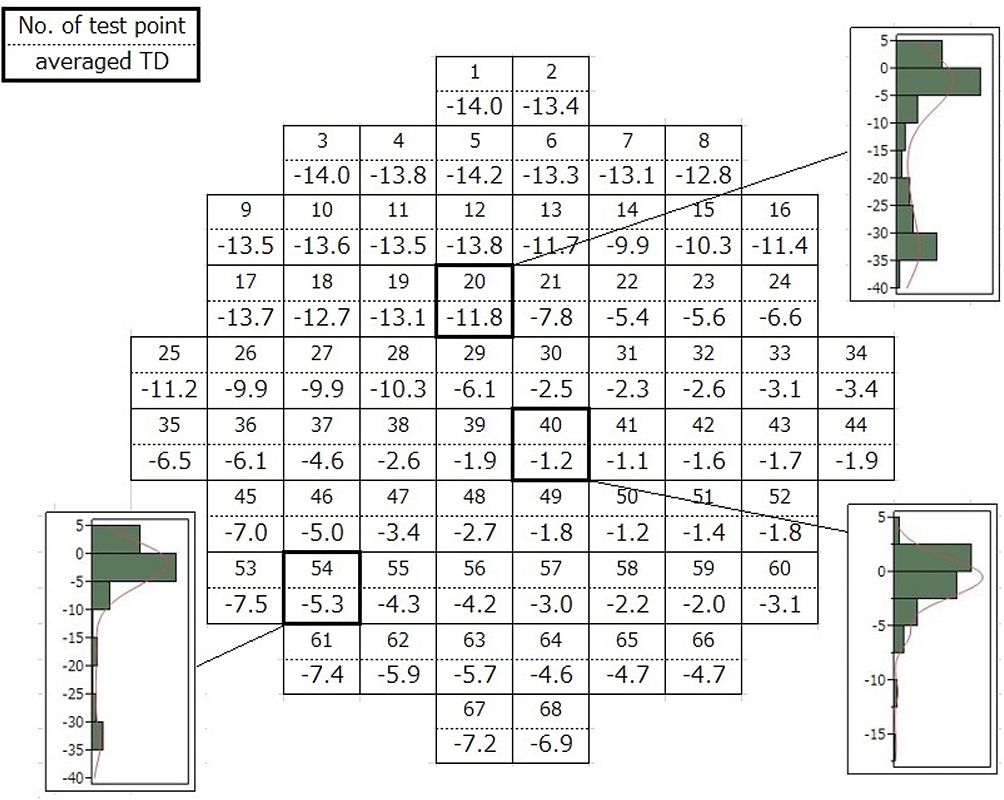 |
Figure 1 Averaged total deviation (TD) value is shown in the order of each test point in 10–2 SITA-S. Examples of actual deviations of the TD values at some test points are also shown. |
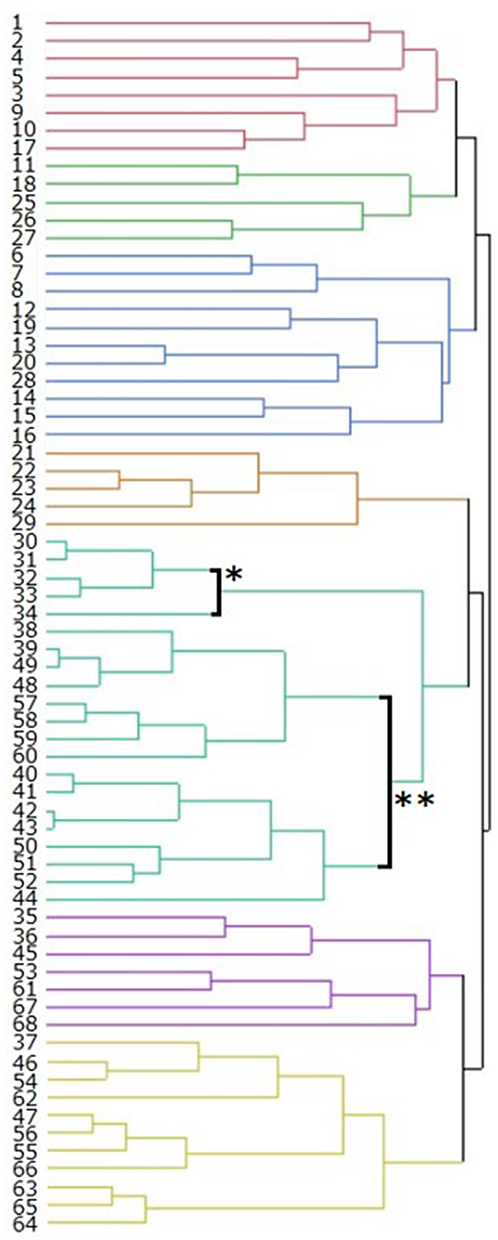 |
Figure 2 Results of hierarchical cluster analysis based on the Ward’s method of the TD values at individual test locations is shown as a dendrogram. The number at the left of the dendrogram indicates the order of test points of 10-2 test. Hierarchical cluster analysis is a “bottom-up” approach of cluster analysis in which each test point starts in its own cluster.19 For example, No. 30–34 test points formed a larger one cluster (bold line *) and No. 38–44, 48–52, and 57–60 test points formed another cluster (bold line **). These two clusters which were closest together were combined as a new cluster. |
 |
Figure 3 Of these seven clusters, clusters 2, 3, 4, 6, and 7 correspond to the arcuate fibers, which arch around the papillomacular bundle from the horizontal raphe to the optic disc. Cluster 1 corresponds to a radiating fiber bundle which passes through the inferior portion of the retina. Clusters of 1, 2, 3, 4, 6, and 7 involve 5–11 test points and are arranged along the RNFL flow distribution from the papilla to the horizontal raphe. Cluster 5 straddled the upper and lower half of visual field that was considered not to agree to the RNFL flow. The Arabic numerals in the figure shows the number of the clusters. |
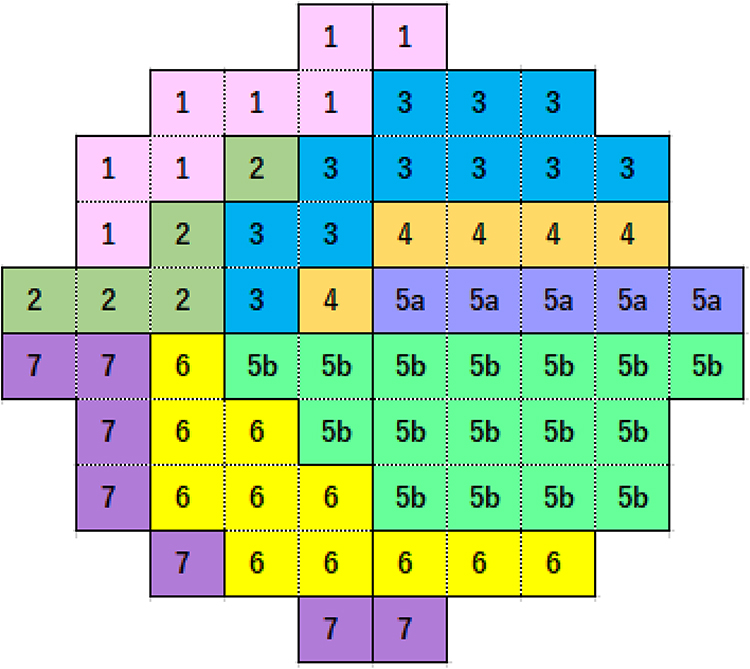 |
Figure 4 Cluster 5 in Figure 3 included 21 test points and was subdivided into the upper and the lower clusters with horizontal meridian as a boundary. It was divided into cluster 5a and cluster 5b. An arrangement of test points in each cluster agreed with the course of the RNFs. The test points of 10-2 was finally divided into 8 clusters. The Arabic numerals in the figure shows the number of the cluster. |
Discussion
Our cluster system divided the 68 test points in the central 10 degrees of SAP into eight clusters based on the TD values, their deviations, and the course of the RNFL in eyes with NTG.
It has been reported that the GVFDs determined by the SAP-derived central 10-2, which represents the retinal sensitivity near the fixation point, were associated with the QOV of glaucoma patients.2–4 This is because even mild sensitivity reductions at the foveal and the parafoveal region tend to depress the QOV.26
SAP was used to determine the sensitivity of pre-defined test points. The SAP findings represent the severity of the GVFD using global indices and pointwise evaluations such as the TD value. In the early stage of glaucoma; however, contiguous retinal sensitivity reductions observed in the Bjerrum and the nasal region represent significant localized defects along the RNFL flow.27 These findings were adopted as the criteria for diagnosing the earliest stages of the GVFD.28 The grouping of a number of test points arranged along the course of the RNFL, ie, the visual field clusters were expected to be another option for evaluating the GVFDs. Several different cluster formations have been reported for the 24-2 and 30-2 tests.12–21
A cluster analysis of the central 10 degrees is believed to be valuable for evaluating the degree and site of the sensitivity reduction because the test points are more closely spaced than in the 24-2 field.29 Studies focused on cluster formation for the 10-2 area, however, have not been fully determined.22,24 We, therefore, recruited NTG patients who had more than three 24-2 tests and examined their 10-2 test results to try to distribute its 68 test points into a certain number of clusters for evaluating the QOV in these eyes with NTG.
We studied NTG patients whose MDs were better than −15 dB and had significant sensitivity reductions in the PD plots within 10 degrees of the 24-2 test. Cases with no significant abnormalities in the retinal sensitivity in the 12 points within the center 10 degrees of the 24-2 program were excluded because we intended to create the clusters to be within the central 10 degrees of the fixation point. We included eyes with a decimal BCVA of ≥0.7 because the light scattering effects of a cataract is reported to possibly depress the threshold sensitivity.30,31 The eyes without apparent organic changes such as myopic maculopathy were also included even with a refractive error of ≤−6.0 diopter.32
Several methods have been proposed for cluster formation analyses such as the k-means and normal mixtures clustering for large data groups with thousands or more data point. However, for the analysis of smaller data groups, hierarchical cluster analysis has been recommended. For the hierarchical cluster analysis, we adopted the Ward’s method because the test points in the 10-2 region were limited to 68, in addition, it could join clusters with a small number of test points and produce novel clusters with roughly the same number of test points. The Ward’s method, however, does not determine the number of clusters, so we used the Sturges’ rule to determine the number of clusters.
In advance of applying the Ward’s method, we calculated the average and the distribution of the 126 TD values in each of the 68 test points. The TD or PD were used for evaluating the changes in the retinal sensitivity, and we applied the TD values because TD eliminated the effect of aging on the retinal sensitivities. We did not use the PD values because adjustments of threshold values according to the general height of the visual field may influence the cluster creation in which test points with similar level of retinal sensitivity have to be involved.
The clusters were formed from dendrograms, but the number of classifications were not indicated by the Ward’s method. When the number of groupings of 68 test points of the 10-2 was examined by Sturges’ rule, 7.2 was statistically recommended as the number of clusters. Therefore, we concluded that the appropriate number of dendrogram division, which corresponded to cluster formation number was 7. Following this classification system, cluster 5 included a relatively greater number of test points of 21 points than in the other clusters. In addition, some of the clusters straddled the upper and lower half of visual field that does not agree to the course of the RNFL. Therefore, cluster 5 was subdivided into the upper and the lower cluster with the horizontal meridian as the boundary. The test points of 10-2 was finally divided into eight clusters. An arrangement of the test points in each cluster was considered to agree with the course of the RNFL.
Limitations
There are several limitations in this study. Because we excluded cases without apparent sensitivity loss in the central 12 points of the 24-2 map, the cases with mild sensitivity loss would be outliers for creating clusters. In addition, as the final step of the Ward’s method, we adopted the number for clusters in accordance with the Sturge’s rule. This resulted in each cluster being arranged along the course of the RNFL. However, determining the appropriate number of clusters was not been established from a statistical point of view.
Another limitation was that the present cluster formation was not verified in a clinical practice with the NTG subjects. In the eyes with NTG, the visual sensitivity loss around the fixation point was frequently detected in its early stage. In our analysis, the 10-2 area was classified into eight clusters, which coincided with the course of the RNFL flow. We are preparing a clinical study to evaluate the usefulness of our present cluster system in NTG eyes.
Conclusions
We have developed a cluster system to analyze the reduction of retinal sensitivity in eyes with NTG and considered that an eight-cluster system may be useful for dividing the 68 test points within the 10-2 area.
Disclosure
Dr Hirotaka Suzumura reports personal fees from Kowa and Carl Zeiss Meditec, outside the submitted work. Dr Keiji Yoshikawa reports personal fees from Santen Phram., Kowa, Novartis Pharm., RE Medical, Senju Pharm., and Ellex Inc., outside the submitted work. The authors report no other conflicts of interest in this work.
References
1. Kim EK, Park HL, Hong KE, et al. Investigation of progression pattern and associated risk factors in glaucoma patients with initial paracentral scotomas using Humphrey 10-2. Sci Rep. 2021;11:18609. doi:10.1038/s41598-021-97446-6
2. Sawada H, Fukuchi T, Abe H. Evaluation of the relationship between quality of vision and visual function in Japanese glaucoma patients. Clin Ophthalmol. 2011;5:259–267. doi:10.2147/OPTH.S16989
3. Gall C, Wagenbreth C, Sgorzaly S, et al. Parafoveal vision impairments and their influence on reading performance and self-evaluated reading abilities. Graefes Arch Clin Exp Ophthalmol. 2010;248:863–875. doi:10.1007/s00417-009-1296-y
4. Sun Y, Lin C, Waisbourd M, et al. The Impact of visual field clusters on performance-based measures and vision-related quality of life in patients with glaucoma. Am J Ophthalmol. 2016;163:45–52. doi:10.1016/j.ajo.2015.12.006
5. Sung KR, Cho JW, Lee S, et al. Characteristics of visual field progression in medically treated normal-tension glaucoma patients with unstable ocular perfusion pressure. Invest Ophthalmol Vis Sci. 2011;52:737–743. doi:10.1167/iovs.10-5351
6. Nishimura M, Tanabe T, Morishita S, et al. Clinical characteristics in myopic glaucomatous eyes with scotoma threatening fixation. Atarashii Gnaka (J Eye). 2007;24:345–348.
7. Yamazaki S, Kozaki A, Yagi T, et al. Pattern of visual field defect in glaucomatous eyes with myopic discs. Atarashii Ganka (J Eye). 2003;20:705–708.
8. Nakase Y. Primary open angle glaucoma in high myopia. Report 1 Effect of high myopia on visual field defects. Acta Soc Ophthalmol Jpn. 1987;91:376–382.
9. De Moraes CG, Hood DC, Thenappen A, et al. The 24-2 visual fields miss central defects shown on 10-2 tests in glaucoma suspects, ocular hypertensives, and early glaucoma. Ophthalmology. 2017;124:1449–1456. doi:10.1016/j.ophtha.2017.04.021
10. Grillo LM, Wang DL, Ramanchandran R, et al. The 24-2 visual field misses central macular damage confirmed by the 10-2 visual field test and optical coherence tomography. Trans Vis Sci Technol. 2016;5:1–7. doi:10.1167/tvst.5.2.15
11. Traynis I, De Moraes CG, Raza AS, et al. Prevalence and nature of early glaucomatous defects in the central 10° of the visual field. JAMA Ophthalmol. 2014;132:291–297. doi:10.1001/jamaophthalmol.2013.7656
12. Chauhan BC, Drance SM, Lai C. A cluster analysis for threshold perimetry. Graefes Arch Clin Exp Ophthalmol. 1989;227:216–220. doi:10.1007/BF02172752
13. Weber J, Ulrich H. A perimetric nerve fiber bundle map. Int Ophthalmol. 1991;15:193–200. doi:10.1007/BF00153928
14. Suzuki Y, Araie M, Ohashi Y. Sectorization of the central 30 degrees visual field in glaucoma. Ophthalmology. 1993;100:69–75. doi:10.1016/S0161-6420(93)31691-X
15. Advanced Glaucoma Intervention Study Investigators. The Advanced Glaucoma Intervention Study: 2. Visual field test scoring and reliability. Ophthalmology. 1994;101:1445–1455.
16. Werner ED, Perrig B, Krupin T, et al. Variability of automated visual fields in clinically stable glaucoma patients. Invest Ophthalmol Vis Sci. 1989;30:1083–1089.
17. Wirtschafter JD, Becker WL, Howe JB, et al. Glaucoma visual field analysis by computed profile of nerve fiber function in optic disc sectors. Ophthalmology. 1982;89:255–267. doi:10.1016/S0161-6420(82)34799-5
18. Garway-Heath DF, Poinoosawmy D, Fitzke FW, et al. Mapping the visual field to the optic disc in normal tension glaucoma eyes. Ophthalmology. 2000;107:1809–1815. doi:10.1016/S0161-6420(00)00284-0
19. Nouri-Mabdavi K, Mock D, Hosseini H, et al. Pointwise rates of visual field progression cluster according to retinal nerve fiber layer bundles. Invest Ophthalmol Vis Sci. 2012;53:2390–2394. doi:10.1167/iovs.11-9021
20. Garway-Heath DF, Holder GE, Fitzke FW, et al. Relationship between electrophysiological, psychophysical, and anatomical measurements in glaucoma. Invest Ophthalmol Vis Sci. 2002;43:2213–2220.
21. Asman P, Heijl A. Glaucoma hemifield test. Automated visual field evaluation. Arch Ophthalmol. 1992;110:812–819. doi:10.1001/archopht.1992.01080180084033
22. Koseki N, Araie M, Yamagami J, et al. Sectorization of the central 10 degrees visual field in open-angle glaucoma. An approach for its brief evaluation. Graefe’s Arch Clin Exp Ophthalmol. 1995;233:621–626. doi:10.1007/BF00185282
23. Jung KI, Kim EK, Park CK. Usefulness of frequency doubling technology perimetry 24-2 in glaucoma with parafoveal scotoma. Medicine. 2017;96(24):e6855. doi:10.1097/MD.0000000000006855
24. Asaoka R. Mapping glaucoma patients’ 30-2 and 10-2 visual fields reveals clusters of test points damaged in the 10-2 grid that are not sampled in the sparse 30-2 grid. PLoS One. 2014;9:e98525. doi:10.1371/journal.pone.0098525
25. Sturge’s Rule. A method for selecting the number of bins in a histogram. Available from: https://accendoreliability.com/sturges-rule-method-selecting-number-bins-histogram/.
26. Jung Y, Park HYL, Jeong HJ, et al. The ability of 10-2 short-wavelength perimetry in detecting functional loss of the macular area in preperimetric glaucoma patients. Invest Ophthalmol Vis Sci. 2015;56:7708–7714. doi:10.1167/iovs.15-17819
27. Jansonius NM. A mathematical model for describing the retinal nerve fiber bundle trajectories in the human eye. Exp Eye Res. 2012;105:70–78. doi:10.1016/j.exer.2012.10.008
28. Anderson DR, Patella VM. Interpretation of Visual Field, Automated Static Perimetry.
29. Ehrlich AC, Raza AS, Ritch R, et al. Modifying the conventional visual field test pattern to improve the detection of early glaucomatous defects in the central 10°. Trans Vis Sci Tech. 2014;3(6):6. doi:10.1167/tvst.3.6.6
30. Budenz DL, Feuer WJ, Anderson DR. The effect of simulated cataract on the glaucomatous visual field. Ophthalmology. 1993;100:511–517. doi:10.1016/S0161-6420(93)31613-1
31. Grødum K, Heijl A, Bengtsson B. Refractive error and glaucoma. Acta Ophthalmol Scand. 2001;79:560–566. doi:10.1034/j.1600-0420.2001.790603.x
32. Kim JM, Park KH, Kim SJ, et al. Comparison of localized retinal nerve fiber layer defects in highly myopic, myopic, and non-myopic patients with normal-tension glaucoma: a retrospective cross-sectional study. BMC Ophthalmol. 2013;13:67–73. doi:10.1186/1471-2415-13-67
 © 2022 The Author(s). This work is published and licensed by Dove Medical Press Limited. The
full terms of this license are available at https://www.dovepress.com/terms
and incorporate the Creative Commons Attribution
- Non Commercial (unported, 3.0) License.
By accessing the work you hereby accept the Terms. Non-commercial uses of the work are permitted
without any further permission from Dove Medical Press Limited, provided the work is properly
attributed. For permission for commercial use of this work, please see paragraphs 4.2 and 5 of our Terms.
© 2022 The Author(s). This work is published and licensed by Dove Medical Press Limited. The
full terms of this license are available at https://www.dovepress.com/terms
and incorporate the Creative Commons Attribution
- Non Commercial (unported, 3.0) License.
By accessing the work you hereby accept the Terms. Non-commercial uses of the work are permitted
without any further permission from Dove Medical Press Limited, provided the work is properly
attributed. For permission for commercial use of this work, please see paragraphs 4.2 and 5 of our Terms.