Back to Archived Journals » Advanced Health Care Technologies » Volume 2
Clinical utility of Raman spectroscopy: current applications and ongoing developments
Authors McGregor H, Wang W, Short M, Zeng H
Received 16 September 2015
Accepted for publication 22 January 2016
Published 22 June 2016 Volume 2016:2 Pages 13—29
DOI https://doi.org/10.2147/AHCT.S96486
Checked for plagiarism Yes
Review by Single anonymous peer review
Peer reviewer comments 3
Editor who approved publication: Dr Utkan Demirci
Video abstract presented by McGregor and Wang.
Views: 1396
Hanna C McGregor,1 Wenbo Wang,1,2 Michael A Short,1 Haishan Zeng,1,3
1Integrative Oncology Department, BC Cancer Agency Research Centre, 2Department of Biomedical Engineering, 3Department of Dermatology, The University of British Columbia, Vancouver, BC, Canada
Abstract: Availability of fast, noninvasive/minimally invasive, and accurate diagnostic tests can maximize the benefit of patient care. The application of Raman spectroscopy (RS) in biological and biomedical applications has surged recently as a result of technological advancements in instrumentation and spectral data handling techniques. With maturation, the potential of RS in clinical diagnosis of various diseases, in particular, early cancer, has been widely explored and reported. This paper provides an introduction to the Raman theory and technology behind RS for nonspecialists interested in its clinical uses. Latest achievements in oncological, cardiovascular, and neurological applications of RS along with its clinical implementations are discussed.
Keywords: Biomedical optics, clinical diagnosis, early detection, cancer, cardiology, neurology
Introduction
Advancement in optics and photonics technologies enables us to manipulate light to obtain clinically relevant information in a rapid and minimally invasive way. The availability of optical components such as fiber optics, sensitive cameras, and diode lasers has allowed researchers to bridge the gap between experimental setup and clinical implementation. The clinical applications of optics, techniques based on fluorescence and absorption in particular, have continuously claimed new frontiers in the last 2 decades.1–4 Researchers are now able to elucidate different disease states, make diagnoses, and optimize treatment for a patient based on understanding the fundamental interactions between photons and tissue. At the same time, maturation in technologies such as lasers have largely overcome the limitations of conventional Raman spectroscopy (RS) and made its biomedical utility a possibility. RS’s capability to work with fiber optics, and with samples abundant in water, to provide information at the molecular level makes it stand out as a highly desirable tool for tissue interrogation. This review focuses on the fundamental principles of RS and its clinical utility.
Figure 1 shows the possible interactions between photons and tissue, specular or diffuse reflection, absorption, elastic scattering, inelastic (Raman) scattering, and fluorescence.5 When the incident light reaches the tissue surface, some of it will be directly reflected at the mirror direction, known as specular reflectance. The remaining light that is not directly reflected will be transmitted into the tissue. If this light goes through multiple scattering events and emerges back through the tissue surface, it is known as diffuse reflectance. If these scattering events do not change the frequency and energy (wavelength) of the photon, it is known as elastic scattering, where scattering events that do alter the frequency and energy of the photon are known as inelastic scattering (Raman scattering). Absorption of a photon occurs when the energy of the photon is transferred to a molecule, putting the molecule in an excited state. The release of this energy causing the molecule to return to a ground state is known as fluorescence.5 Each modality carries morphological or chemical characteristics of the tissue which are either unique or complementary to others. For example, spectral information obtained with Raman scattering and IR absorption are complementary due to different chemical bond selection rules.6–8 Raman scattering, one of the forms of inelastic scattering, occurs when an incident photon is scattered by a molecule and emerges at a wavelength different from that of the incident photon. This wavelength difference is related to the energy required to excite a corresponding molecular bond into a different vibrational energy state, as shown in Figure 2. When the photon transfers energy to the chemical bond in Raman scattering, a Stokes shift in wavelength occurs, whereas when the photon gains energy from the bond, an anti-Stokes shift in wavelength occurs.9–13 Stokes scattering is a more likely occurrence because the vast majority of molecules are in the ground vibrational state as described by the Boltzmann distribution.6
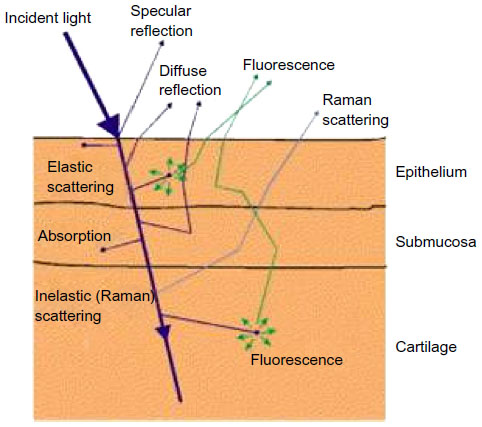 | Figure 1 Schematic diagram of the potential light–tissue interactions, as shown specifically in lung tissue. |
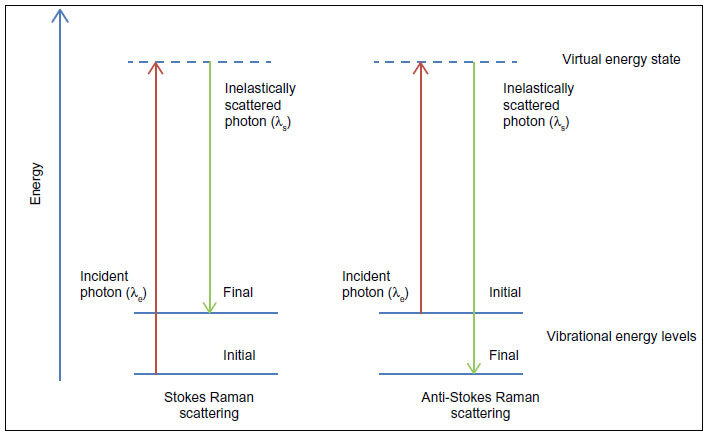 | Figure 2 Schematic showing the difference between Stokes and anti-Stokes Raman scattering. |
Raman scattering can occur for all photon wavelengths that make up the incident light, provided there is a vibrational mode in the sample with a transition energy less than the energy of the incident photons with the longest wavelengths. In practice, most of the information about the sample can be obtained from Raman scattering when using incident photons with a very narrow, peak-shaped band of wavelengths. In this case, the Raman-scattered light from one vibrational mode is also emitted in the shape of a peak, called a Raman peak. Thus knowing the center wavelength of the incident light and measuring the center wavelength of the Raman peak, the vibrational energy of a molecular bond can be determined. The narrower the band of incident wavelengths, the better it is for separating Raman peaks caused by different vibrational modes that are separated by a small energy difference. RS utilizes Raman scattering by probing a wide range of molecular vibrational energy modes of a sample either sequentially or simultaneously which is more typical of modern systems. The output of this probing is a characteristic series of Raman peaks called a spectral fingerprint (FP), containing information about the chemical structures and quantities of specific molecules in the sample.
When light is scattered by a molecule, most photons are elastically scattered (Rayleigh scattering), and only approximately one in a million photons is inelastically scattered and emerges with a change in energy.14 Although relatively small in numbers, these Raman-scattered photons can be quantified with reasonable statistical accuracy, at incident light intensities that do not damage even the most delicate of samples, and with relatively short exposure times. In simple monomolecular samples, the measured intensity of the Raman-scattered photons from one molecular vibrational mode is proportional to the abundance of those molecules in the sample.14 For biological samples, where many different types of molecules can contribute to the measured Raman signal, the relationship between the intensity of a Raman peak and molecular abundance is complex since many types of molecules can share the same chemical bonds, and different chemical bonds can share the same energy. Nevertheless, the variation in the wavelength position and intensity of all the Raman peaks in a Raman spectrum is highly specific to a unique set of chemical bonds, which enables the use of RS for the clinical utility of multiple maladies in vivo and ex vivo.
Clinical RS measurements can be accomplished through macrosamplings (greater than or equal to a square millimeter) of tissue or bodily fluids where the signal mainly comes from proteins, lipids, and nucleic acids, within the excited tissue volume. Changes in tissue pathological states, which are usually preceded by and correlated with biochemical changes, can be inferred through spectral analysis, demonstrating RS to be a valuable clinical tool.15–17 On the other hand, if initial neoplastic growth begins within epithelial layers of the tissue, macrosampling may introduce unwanted Raman and endogenous auto-fluorescence (AF) signals generated from deeper tissue layers that can overwhelm the clinically relevant Raman signal. To overcome this problem, various optical designs can be used to obtain Raman spectra predominantly from a thin tissue layer at a particular depth below the surface. Both these sampling techniques are amenable to in vivo measurement and ex vivo sample analysis.18 Other techniques for reducing the inherent AF of the tissue are by using a different excitation wavelength or by detecting the Raman in the high-frequency region (1,800–3,200 cm−1) since AF is usually most severe with shorter excitation wavelengths and for Raman peaks in the FP spectral region (≈500–1,800 cm−1). These two wavenumber regions can be simultaneously measured with the same equipment or probed separately at a higher spectral resolution through hardware modifications such as a change of excitation wavelengths or the spectrometer configuration.
Extracting a pure Raman signal from in vivo or ex vivo tissue is challenging but can be effectively managed with data processing techniques. Spectral contributions from other light tissue interactions can greatly complicate the situation, making it hard to separate the Raman signal from the AF background. Many effective strategies have been employed to separate Raman peaks from the AF. For example, the Vancouver Algorithm19 is an iterative polynomial that fits the fluorescence background signal and is subsequently subtracted, leaving the Raman signal. Although the polynomial fit may not remove the fluorescence entirely or cause some signal loss in the Raman peaks, it has been successfully used to separate the Raman signal.20 The use of second-order derivatives has also shown to minimize the AF background.21 Once the background signal is removed, one can analyze the Raman signal using a variety of methods in order to determine how the signal relates to a pathological state. Large amounts of data come from each Raman spectrum, often at >1,000 discrete wavenumbers, which need to be reduced in a way that preserves the spectral variations that hold relevant information useful for classification. Many methods of data reduction are currently in use including principal component analysis (PCA), partial least squares (PLS), independent component analysis (ICA), etc. PCA, for example, aims to summarize the large amounts of data without losing too much important information. The PCA accomplishes this through the use of an orthogonal transform, causing the highest variance to be captured in the early components. Multivariate statistical analysis is often used to determine the important differences in disease states because valuable spectral information may come from more than one Raman peak. Alternatively, regions of the spectra may not hold any relevant spectral information at all, or are highly correlated to other peaks in the spectra creating a colinearity problem. However, this problem can be solved using some of the same techniques as used in data reduction, including PCA and PLS.
Ongoing preclinical developments
Detecting the Raman peaks outside of the FP region and mathematical processing, however, are not the only ways to improve the Raman signal strength. Methods such as surface-enhanced Raman spectroscopy (SERS), coherent anti-Stokes Raman spectroscopy (CARS), and stimulated Raman spectroscopy (SRS) have been used in lieu of the classic RS. SERS is a method in which the sample molecules are in proximity to a metallic surface, which causes the Raman signal to be enhanced by up to eleven orders in magnitude.22 The majority of SERS work has been done using roughened gold and silver as substrates, but the use of metallic nanoparticles has shown promising utility. Specifically, there are two uses of the nanoparticles: enhancing the Raman signal from a biological material, the nanoparticle comes into contact with, or enhancing a Raman signal from a coating applied to the nanoparticle itself. Both have shown to be of use when tracking biological or metabolic processes since antibodies are able to be tagged to the nanoparticles.23–25 Yet, in all SERS cases, the increase in Raman signal comes from enhancement through either electromagnetic or chemical interactions.26 The theory that describes enhancement through electromagnetic interactions proposes that the excitation of surface plasmons on the metallic structure causes an increase in the local electric field, resulting in an increased Raman signal from the material in the vicinity of this electric field.27,28 In contrast, the theory that supports chemical interactions describes the increase in signal as a result of the formation of temporary charge-transfer complexes,29 causing increased electron and photon coupling. SERS is effective in a laboratory setting, and in animal models, but has not been adapted to any great extent to clinical settings because of problems such as nanoparticle delivery at target tissues and possible toxicity effects.30
CARS, a method of nonlinear Raman scattering, involves two laser beams, known as the pump beam and the Stokes beam (or probe beam), that interact together with the sample to produce a coherent signal that can produce an anti-Stokes shift.31 The frequency of the pump beam is constant where the frequency of the probe beam is tuned in such a way that the frequency difference between the two beams corresponds to the frequency of a Raman mode of interest, causing a large increase in intensity of a specific Raman peak. One drawback of CARS is that Raman peaks outside of this stimulated signal are detected as well as emission from water vibrations which contribute to the background signal. Although some in vivo, real-time CARS imaging systems have been developed,32,33 they are still in the laboratory preclinical phase due to the size and cost restraint of current systems.
SRS, a method similar to CARS, also involves two laser beams (pump and probe beam) whose energy difference matches a molecular vibration; however, SRS does not suffer from the same background signal drawbacks because only the stimulated signal is detected. Water is abundant in most biological tissues; but SRS has the ability to remove the endogenous water contribution to a Raman signal, showing a highly specific application in the biomedical field. It gives 4–5 orders of magnitude enhancement when compared to classic Raman scattering. Currently, thick tissues cannot yield enough light for a good signal-to-noise ratio (SNR).34 SRS has yet to be used in a clinical trial setting for much of the same reason as CARS. Despite the many challenges in using SERS, CARS, and SRS, they remain important in the medical field for ex vivo diagnoses and testing, and we believe they will eventually make their way into the clinical setting. Currently, the most abundant use of RS in a clinical setting is classic Raman scattering, and, as such, this review will focus on the clinical developments utilizing this modality.
Oncology applications and developments
The earlier a cancer is detected, the better the prognosis and a more favorable the outcome for the patient.35–37 Typically, a cancerous lesion will not suddenly appear; there is a progression of precancerous states in which the lesion will go through first. For example, although some moderate dysplastic lesions spontaneously regress, most have an increased probability of progressing through a series of higher grade dysplasias before becoming invasive cancer.38,39 This progression is common in most cancer subtypes that arise at epithelial surfaces. Therefore, catching the lesion in a dysplastic or noninvasive state will yield the best outcome for the patient. The high chemical specificity of RS makes it an ideal tool to detect biochemical changes in tissue before the macroscopic changes become evident. Here, we review the use of RS for early detection of different types of cancer. Many types of cancers at different body sites including skin, lung, breast, gastrointestinal tract, cervix, oral cavity, brain, and bladder have been studied with several types of Raman measurement systems. Differentiation between different histopathologic classes such as malignant versus benign, dysplasia, and normal has been attempted using a wide selection of data-analysis techniques such as PCA and linear discriminant analysis (LDA). The overall diagnostic sensitivities and specificities were somewhere between 73% and 100% and 66% and 100%, respectively. A detailed review of RS on different cancer types is given in the following sections.
Skin cancer
Skin cancer has multiple forms, each with a varying malignant probability. Although squamous cell carcinoma (SCC) and basal cell carcinoma (BCC) are generally believed to be slow-growing and less aggressive cancers, malignant melanoma (MM) is not. Similar to other cancers, when diagnosed at the early localized stage, MM has a higher 5-year survival of ~90%.36 However, this number drastically decreases if the disease is diagnosed at a metastatic stage, resulting in a 5-year survival of ~20%.34 Currently, the gold standard for detecting MM is a biopsy followed by histopathology. Consequently, when a patient is undergoing a clinical examination, often multiple biopsies are taken, resulting in scarring and discomfort for the patient. As well, histopathology most often requires time to interpret the tissue, resulting in a diagnosis that may take days. There is a great need for rapid, real-time, and bedside classification of skin cancers.
Research into utilizing RS to determine problematic moles began in the early portion of the decade. A clinical skin system has been successfully developed,40–42 trialed clinically,20 and is currently being produced commercially by Verisante Technology Inc. (Vancouver, Canada). The first-generation system in 2008 consisted of a 785 nm excitation laser (controlled by in-house software), a custom-made Raman probe, and a spectrograph coupled to a charge-coupled device (CCD),40,41 as shown in Figure 3. The probe, as shown in Figure 4, consisted of a single 200-μm-diameter excitation fiber and 58 μm and 100 μm diameter collection fibers. The in-house software enabled real-time dark noise removal, calibration (intensity, wavelength, and spectral response), signal saturation detection, cosmic ray detection, and iterative fluorescence background removal.19 The 2008 study used a volunteer to demonstrate that the system was able to show Raman peaks in vivo on human tissue.40
 | Figure 3 Schematic of a real-time in vivo skin Raman system. |
 | Figure 4 Schematic of the probe design for an in vivo skin Raman system. |
A single-center clinical trial was conducted to test the utility of an RS system to detect skin cancers in vivo.20 After measuring 1,022 skin lesions, it was shown that an algorithm based on the spectra was able to successfully classify three separate criteria from benign skin lesions. Using multivariate analysis (PCA-general discriminant analysis [GDA] or PLS), malignant and premalignant conditions were separated from benign lesions with 90% sensitivity and 66% specificity. Melanomas were separated from benign pigmented lesions with 90% sensitivity and 68% specificity. Melanomas could also be separated from seborrheic keratosis with 90% sensitivity and 68% specificity. A Raman system based on the technology and the results of the research system used in that clinical trial is now commercially available through Verisante Technology, Inc.20 The mean Raman spectra, shown in two different wavenumber ranges, can be seen in Figure 5. The prominent peaks for the corresponding biochemical components are found in Zhao et al.43
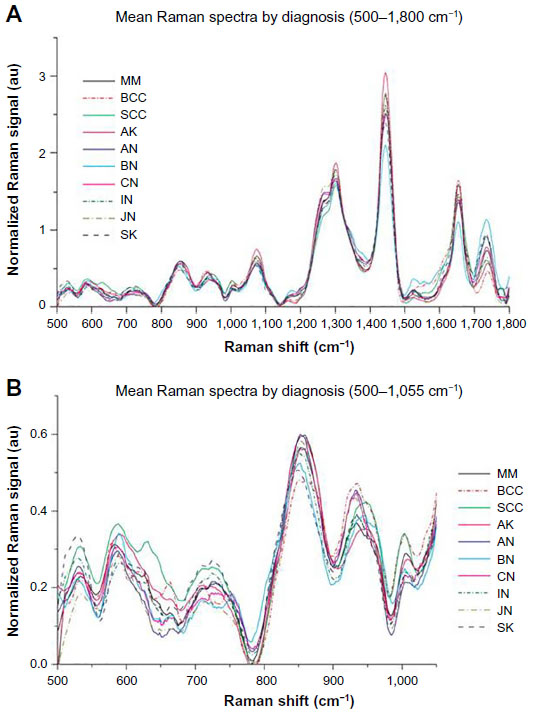 | Figure 5 Mean Raman spectra by diagnosis in the (A) spectral range of 500−1 to 1,800 cm−1, or (B) the spectral range of 500−1 to 1055 cm−1. |
In 2008, Lieber et al developed a portable Raman system for the detection of skin cancers.44 They focused on nonmelanoma cancers and developed a system based on micro-RS. Their system consisted of a handheld probe coupled to a 825 nm laser and spectrometer. Twenty-one spectra were collected, each with matched normal spectra. Preprocessing included the extraction of diagnostically relevant spectral information through maximum representation and discrimination feature, followed by probabilistic classification analysis via sparse multinomial logistic regression. The group was able to classify the spectra with 100% sensitivity and 91% specificity.44
Lung cancer
Lung cancer is one of the leading causes of cancer-related deaths in North America with a dismal 5-year survival rate of ~15%.36 Current detection strategies for lung cancer include the use of computed tomography (CT) scans, which suffer from a high false-positive rate and the need to use other discriminatory factors to make an informed predictive decision.45 Similarly, white-light bronchoscopy (WLB) and autofluorescent bronchoscopy (AFB) are also used, but once again they suffer from either low sensitivity or specificity.1,2,46 There is little visual contrast in WLB, making lesion detection difficult; in AFB, most abnormal areas, including infection and inflammation, appear visually similar to those of progressive cancer. There are almost no visual changes in preinvasive lesions under WLB, but AFB provides higher contrast, allowing the area to be visualized more easily, as shown in Figure 6. However, due to the lack of specificity in AFB, physicians have considerable discretion when choosing which sites to biopsy, leading to variability based on operator experience. RS has been proposed as an adjunct method to classic WLB+AFB in order to combat this.
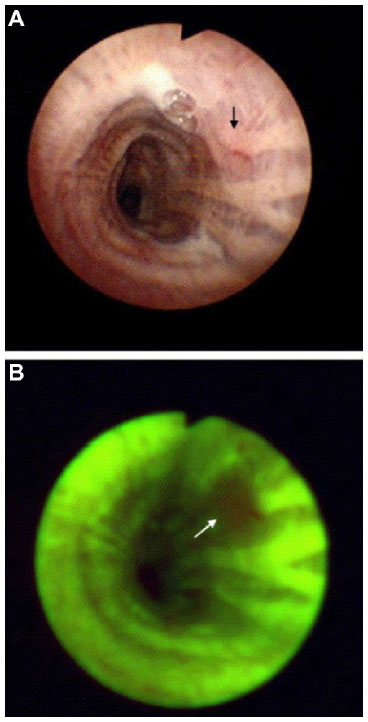 | Figure 6 White light (A) and fluorescence (B) images of the same location in a bronchial tree during a bronchoscopy procedure, in which the arrow shows the location of a carcinoma in situ lesion. |
A study conducted in 2008 by Short et al had demonstrated the technical feasibility of measuring in vivo lung lesions using RS.47 Building from the success of the technology development, a pilot study was then conducted by Short et al in 201121 testing the utility of using RS in vivo for clinical lung lesion classification in the central bronchial tree. The authors suggested that with objective Raman measurements, a physician would be able to conclude whether to biopsy a site without bias or with little clinical experience. The pilot clinical study had a total of 26 patients (129 sites) and used a real-time homemade RS system. The system consisted of a liquid-nitrogen-cooled CCD camera coupled to a spectrometer, a diode laser for excitation at 785 nm, and a custom-made Raman probe – manufactured using one excitation fiber and 27 collection fibers. Figure 7 shows the detailed configuration of the system. The Raman signals are collected by the Raman probe, which is coupled to a special round-to-parabolic fiber bundle after a second-stage filtering by the filter module. The curved arrangement of the fibers at the spectrograph entrance serves to correct the spectral image aberrations and facilitate CCD full-column vertical binning. These innovative designs resulted in improved spectral resolution and improved SNR.47 The system spectral resolution was 10 cm−1 and spectral acquisition was completed within 1 second. Three methods of preprocessing were used by the authors, namely a three-point average smoothing, a polynomial fitting routine to remove the endogenous fluorescence of lung tissue, and the use of second-order derivatives. The second-order derivatives followed by PCA and LDA gave the best classification of lung lesions. The authors were able to elucidate changes in the spectra based on different disease states, and were able to conclude the study with a sensitivity and specificity of over 90%.21
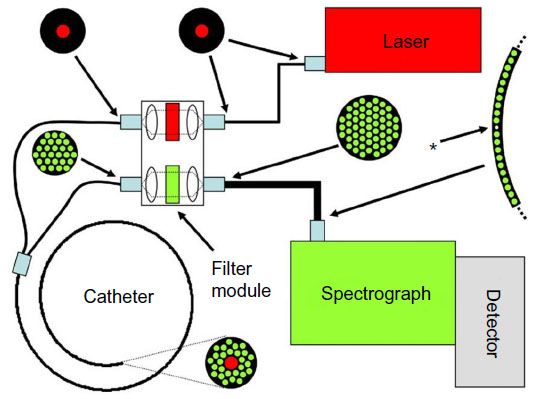 | Figure 7 Schematic of a lung endoscopy Raman system. |
Breast cancer
Breast cancer is the second leading cause of cancer-related deaths in women worldwide, exceeded only by lung cancer.36 In 2014, over 230,000 new cases of breast cancer were diagnosed in the USA,36 with similar statistics throughout the developed world. Although in the past 2 decades there have been some great successes made in breast cancer detection, including finding high-risk patients who carry the BRCA mutated genes, there will still be ~40,000 deaths annually in the USA.36 Currently, low-dose screening mammography has been shown to identify problematic nodules in the breast. However, similar to CT used in other organs, there is a high false-positive rate.
In 1998, Manoharan et al showed that the ex vivo classification of normal, benign, and malignant breast tissues was possible using RS,48 work that was important to the development of other breast Raman systems. In 2006, Haka et al investigated on the utility of taking RS measurements during a mastectomy in order to elucidate tumor tissue margins.49 Twenty-nine normal tissue spectra were collected, along with one malignant tissue spectrum. Even with a small dataset, the group was able to achieve 100% sensitivity and 100% specificity using a developed algorithm that compared the tested spectra to spectra of fat and collagen, which in turn determined how normal or abnormal the spectra were.
A group led by Fitzmaurice has worked extensively with ex vivo breast tissue.50–53 The most recent 2013 study from the group looked at the utility of using RS at the bedside of an operation in real time on freshly extracted samples. An algorithm based on support vector machines was able to yield a sensitivity of 62.5% and specificity of 100% when classifying breast cancer and an overall accuracy of 82.2% when the group classified lesions into normal, fibrocystic change, fibroadenoma, or breast cancer.53
Colorectal cancer
Colorectal cancer annually contributes to >50,000 deaths in the USA alone.36 Although colorectal cancer has a higher 5-year survival rate than most cancers (>60%), it remains among the top three causes of cancer-related deaths due to such a high incidence rate.36 It also suffers from the same detection problem as lung cancer, where current methods of detection have a low specificity. Colorectal cancer is thought to develop from andenomatous polyps, which are abnormal growths of tissue projecting out from the surface of the intestinal lining. In many patients, these growths that project out from the tissue surface will often be biopsied, as they are all risk factors. However, diminutive polyps are not visualized as easily, because they can look similar to normal folds in the tissue. These diminutive polyps also do not pose a large threat to the patient, as they are rarely malignant or even high-grade dysplasia. Approximately half of these polyps have been shown to be adenomas, and it has been questioned how much the removal of these actually helps the patient.54 It has been suggested that sending biopsies of each of these diminutive polyps is too costly and unnecessary, so a resect-and-discard strategy has been proposed.54 However, if physicians had biochemical information at the bedside using RS in real time, there would be minimal added cost to the procedure, and an objective, reliable decision about the risk of a polyp could be reached without sending biopsies for histological assessment.
A system was developed as early as 200355 by Molckovsky et al. Uniquely, the study collected both ex vivo and in vivo clinical data, using a system that was custom-built with a fiber-optic probe and near-infrared laser excitation. The group collected 54 ex vivo samples (20 hyperplastic, 34 adenomatous) and was able to successfully classify – using PCA and LDA – samples into their appropriate groups with 91% sensitivity and 95% specificity. The in vivo collected data (ten adenomas and nine polyps) were able to be successfully classified with 100% sensitivity and 89% specificity. The algorithm developed from the ex vivo data yielded poor classification results when tested on the in vivo data. The authors concluded that in vivo data must be treated separately from ex vivo data.
More recently, a study was conducted testing the novelty of using low-frequency (LF) and high-frequency (HF) RS56 on ex vivo colon tissue. A system was developed similar to other previously described Raman-based devices,21,57 where a 785 nm diode laser was attached to a fiber-optic probe, which in turn was connected to a spectrograph coupled with a CCD. The authors found that in the LF region the spectra were similar to those of the Molckovsky et al study,55 where the malignant tissue showed a general increase in lipids and a general decrease in proteins and amino acids. The spectra were successfully classified into malignant versus nonmalignant groups – using a PCA-LDA model – with a specificity of 88% for excised tissue. The parallel study done on the same samples using HF measurements were also positive. Although it was difficult to see large spectral changes between pathology groups in the HF spectra, the study was able to conclude a classification into appropriate groups with a specificity of 89% for excised tissue.56 The authors concluded that HF measurements would be appropriate for the colon and have some advantages over the traditional LF measurements. A large-scale trial should be the appropriate next step.
In 2015, a study conducted by Huang et al tested the feasibility of using combined FP and HF readings with the same spectrometer on adenomatous polyps.58 The group developed a system consisting of a diode laser with an excitation wavelength of 785 nm, a high-throughput spectrograph with a gold-coated grating, a near-infrared optimized CCD, and a fiber-optic probe – a system that was capable of light collection in both frequency regions simultaneously. The group measured 50 patients with the system and obtained 118 spectra from hyperplastic lesions and 184 spectra from adenomatous lesions. Through PLS-DA, the group was able to successfully separate adenomatous polyps from hyperplastic polyps with 90.9% sensitivity and 83.3% specificity.58 The authors suggest that the combined FP and HF region provides superior results when compared to either region alone.58
Cervical cancer
This is the third most common cancer of women worldwide and the leading cause of cancer-related death among women.36,59 Currently, the method of detection for cervical cancer is exfoliative cervicovaginal cytology, which is also known as a Papanicolaou (Pap) smear.60 Although this method has good specificity (>86%), the sensitivity is in the range of 30%–87%.61 Subsequently, the traditional follow-up to an abnormal Pap smear is known as white-light colposcopy.62 Similar to other mucosal surfaces, there is a great need to be able to diagnose precancerous lesions at the bedside in real time.
To date, five in vivo studies have been done using RS for the differentiation of cervical abnormal tissue compared to normal tissue. The first, which aimed at differentiating squamous dysplasia compared to normal epithelium, was conducted in 200163 and had 24 spectra measured from 13 patients. Using an algorithm based on the intensity ratios, the group yielded a single misclassified spectrum. In 2007,64 a study was conducted with spectra taken from 79 patients. Using logistic regression discrimination, the group achieved a sensitivity of 89% and specificity of 81% for differentiating normal ectocervix, squamous metaplasia, and high-grade dysplasia.64
In 2009,65 2011,66 and 2012,67 the same group reported three different in vivo studies. In the 2009 study, a system consisting of a 785 nm excitation laser coupled to a fiber-optic probe that terminated in a ball lens measured 92 in vivo spectra from 46 patients. Measurements were taken in the HF region. The group was able to classify cervical dysplasia from normal tissue with a sensitivity and specificity of 94% and 98%, respectively, using PCA followed by LDA.65 However, as Wang et al suggests, this high performance may be due to over-training of the classification algorithm.17 In the 2011 study, a total of 105 spectra were measured from 29 patients, using the same system as previously described.65 Once again, the group aimed to distinguish precancerous dysplasias from surrounding normal tissue, but included genetic algorithm (GA) as part of the feature selection prior to PLS-LDA. With GA included, the sensitivity and specificity calculated were 72.5% and 89.2%, respectively.66 In the latest study conducted, the group developed an integrated confocal system capable of both LF and HF readings.67 A total of 476 in vivo measurements were collected. Using the previous method of PLS-LDA, the group was able to achieve similar sensitivities and specificities to their previously reported work.
Upper gastrointestinal tract cancer
This includes both esophageal and stomach cancer. Esophageal cancer has a poor 5-year survival rate of <20% and was one of the top ten cancers deaths in men during 2014 in the USA.36 These statistics are typical across most developed nations.36 Stomach cancer has a miniscule improvement over esophageal cancer, with a 5-year survival rate of <30% and was responsible for over 10,000 deaths in the USA during 2014.36 There is a unique environment in the stomach, and (sometimes) in the esophagus, due to the presence of hydrochloric stomach acid. In a condition known as Barrett’s esophagus, the stomach acid continuously attacks the epithelial cells around the cardiac sphincter after escaping from the confines of the stomach. Barrett’s esophagus is a complication from gastric reflux, which causes dysplasic cells. These dysplasias may progress into invasive cancers, but, similar to the lung and colon, determining which ones will do so is currently impossible to predict.
Three studies conducted by Huang et al looked at stomach ulcers in 2009,68 2010,69 and 2012.70 Between 1% and 5% of gastric ulcers will progress into invasive cancer, and those ulcers that will progress appear the same as those that will not. In the 2009 study,68 a total of 65 gastric lesions (44 normal and 21 dysplasia) were measured using an in vivo Raman system. In order to determine a diagnostic decision, the intensities of two peaks were combined into ratios, 875 cm–1versus 1,450 cm–1 (I875/I1450) and 1,208 cm–1 versus 1,655 cm–1 (I1208/I1655), which gave a sensitivity of 90.5% and a specificity of 90.9%. The group then measured 924 Raman spectra from normal tissue, 111 Raman spectra from benign ulcers, and 67 Raman spectra from ulcerated adenocarcinoma in the 2010 study.69 Once again, the group used PLS-LDA and achieved good separation of the groups. They were able to determine normal gastric tissue with a sensitivity of 90.8% and a specificity of 93.8%.69 They were able to classify benign stomach ulcers with a sensitivity of 84.7% and a specificity of 94.5%.69 Finally, they were able to classify malignant ulcers with a sensitivity of 82.1% and a specificity of 95.3%.69 The work that this group has done shows the utility of using RS for cancer diagnosis in the upper gastrointestinal tract. Finally, in 2012,70 the group measured a total of 2,748 in vivo gastric tissue spectra (2,465 normal and 283 cancer) using a real-time platform. Previous work was subjected to postprocessing and offline algorithm development, which were overcome in their latest study. The algorithm was tested on acquired data (80% training with 20% testing), and they were able to successfully classify gastric lesions using PLS-DA with a sensitivity of 80.5% and a specificity of 86.2%. Interestingly, the algorithm was then applied to ten new gastric lesions during gastroscopy, to achieve a sensitivity of 90% with a specificity of 73.3%.70
The same group looked at esophageal cancer in 2013, and used in vivo RS to look at the biochemical signatures of benign Barrett’s lesions compared to those of invasive cancers.71 There were clear visual differences in the mean Raman spectra from those from a system that had been previously described (785 nm diode laser, fiber-optic probe, and a spectrograph coupled to a CCD). The group was able to successfully classify high-grade dysplasias from normal esophageal lesions using PLS-LDA, giving a sensitivity of 91% and a specificity of 83%.71
Oral cancer
Oral cancer has a 5-year survival rate of <60%.36 Although access to the oral mucosa is easy, there is no visible change in the mucosa until the tumor has reached a later stage, resulting in a poor prognosis, which is also due to the inherent heterogeneity of oral cancer, poorly defined tumor margins, and the large error associated with oral biopsies. These compounding factors also result in a high reoccurrence of oral cancer because complete lesions are often not removed the first time.
A group lead by Krishna et al created a system for in vivo oral Raman classification that attempted to combat the increasing numbers of oral cancer cases found in South and Southeast Asia.72 The study had a total of 171 patients with oral lesions and 28 healthy volunteers.72 The Raman spectra of the diseased tissue were of the following diagnoses (either determined by histopathology or by clinical assessment): oral squamous cell carcinoma (OSCC), oral submucosa fibrosis (OSMF), or oral leukoplakia (OLK). Preprocessing included the extraction of diagnostically relevant spectral information through maximum representation and discrimination feature, followed by analysis using probabilistic classification via sparse multinomial logistic regression. The study achieved good diagnostic accuracy for the three diseased groups and the normal group, which were 89%, 85%, 82%, and 85%, respectively.72 The system was constructed from a 785 nm excitation laser, an electrically cooled back-illuminated CCD coupled to a spectrograph, and a fiber-optic probe. The probe consisted of a central 400 μm diameter excitation fiber surrounded by seven 300 μm diameter collection fibers. The spectral resolution was 20 cm−1, and the data acquisition time was <5 seconds.
A better in vivo Raman system has been designed for diagnostic use in the mouth and oral cavity73,74 in North America. The pilot study conducted by Guze et al in 2014 succeeded in excellent group separation of oral diseases from 18 patients. Spectra were classified into a benign or malignant category, and analysis using PCA-LDA, which provided 100% specificity with 77% sensitivity.73 The authors concluded that, although a larger study group was needed, there was promise for the use of RS as an effective diagnostic tool. The system design was published in 2009,57 and consisted of an excitation laser (785 nm), spectrograph coupled to a detector, optical filtering in two stages, and specially designed fiber bundles, similar to what is shown in Figure 5. The detachable Raman probe was also specially designed for use in the oral cavity, which was constructed of one excitation fiber surrounded by 31 collection fibers.73 The spectral resolution was 10 cm−1, and the data acquisition time was <1 second.
Although the aforementioned studies have shown the utility of RS for in vivo oral cancer classification, there have also been multiple studies carried out on the use of RS as an ex vivo diagnostic tool. These studies have shown that RS is able to successfully show the presence of proteins, hydroxyapetite, lipids, and nucleic acids. One study used Fourier transform Raman Spectroscopy (FTRS), which was able to successfully suppress the endogenous fluorescence signal while providing a good separation of malignant versus normal groups with 100% sensitivity and 69% specificity.75 Another study has shown that micro-RS is able to classify ex vivo oral tissue sections into the correct cell layers.76 The overall conclusion from ex vivo research has been that RS has great clinical potential and utility for oral mucosa.
Brain cancer
Brain cancer has a dismal 5-year survival rate of ~35%, and over 23,000 new cases will be diagnosed each year in the USA alone.36 Often, the intervention includes the removal of cancerous brain tissue through surgical procedures. Yet, there are forms of brain tumors (grade 2/3 astrocytomas, grade 2/3 ogliodendrogliomas, and grade 4 glioblastomas) that are locally invasive,77 and so removal of sections often means that cancerous tissue is only partially excised. Currently, there is no way to clinically determine which tissue is normal and which is invasive cancer.77 The inability to determine tumor tissue margins in the brain negatively affects the patient as a relapse is common.
Although the majority of brain cancer research has been done on mouse models, or ex vivo tissue, a group in Montreal, Canada, has developed a Raman system for in vivo use on human brain tissue.77 The system consists of a 785 nm diode laser, a handheld custom-built probe, and a spectrograph coupled to a CCD. The handheld probe was designed to touch the surface of the brain intraoperatively and contained fiber-optic cables connected directly to the diode laser. The group measured 161 (66 normal spectra and 92 cancer spectra) spectra from a total of 17 patients. Spectral analysis was done through the use of boosted trees, and the group achieved a sensitivity of 93% and a specificity of 91%.77 Although the study comprised a small number of patients, and the spectra were significantly different from those of ex vivo brain tissue, it was shown that they could be used to successfully classify brain lesions.
Bladder cancer
Bladder cancer was one of the top ten diagnosed cancer subtypes in the USA in 2014, with incident rates in men over double that in women.36 Currently, nonmuscle-invasive bladder cancer is diagnosed through the use of transurethral resection of bladder tumor (TURBT) to obtain biopsies for histopathology to stage the tumor. Following diagnosis, treatment of the tumor using TURBT is often carried out as an intervention method; however, as many as 50%–70% of patients suffer from a recurrence.78
In 2004, Crow et al developed an ex vivo system to test the differences between normal and cancerous bladder (and prostate) lesions.79 The system consisted of a 785 nm excitation laser, a high-throughput spectrograph, and a liquid-nitrogen-cooled CCD. Samples of bladder were collected through TURBT and snap-frozen prior to RS analysis. Using a fifth-order polynomial fitting for background removal and an algorithm developed with PCA-LDA, the group was able to achieve an overall diagnostic accuracy of 84%.79 The authors concluded that the results were promising and would pave the way for in vivo studies.
In 2010, Draga et al tested a high-volume RS system in vivo with the intent of determining how invasive a bladder tumor was.80 They used a system that consisted of an excitation source of 785 nm, a fiber-optic probe, a CCD camera, and a custom-made imaging spectrograph. In vivo measurements were taken during TURBT procedures on suspicious and nonsuspicious lesions, which were then biopsied to determine the true pathology. The group was able to develop an algorithm through PCA-LDA multivariate techniques, which gave a sensitivity of 85% and a specificity of 79% when distinguishing normal from malignant lesions.80
Table 1 summarizes the most recent use of RS for in vivo cancer detection among multiple cancer subtypes. Although several studies have included a high number of spectra and patient samples20,21,64,66,67,72,77 the majority of studies have small sample sizes44,49,55,63,65,68–71,73,80 which is an indication of the lack of statistical power. As well, some studies focus on differentiating between normal sites and cancerous sites44,49,72,77,80 excluding the preneoplastic changes in a lesion, which is more important for patient survival. As a result, clinically relevant claims are unsubstantiated, although the data may show a proof of principle. Data analysis and classification techniques commonly rely on linear classifiers, avoiding the need for transforms. Good separation can be achieved without resorting to complicated mathematical techniques. Furthermore, linear techniques and models are quickly computed and are able to be extrapolated for predictions. Clinical Raman work should be performed with a large sample size (n>1,000), as was done by by Lui et al in 2012.20 This would provide the statistical power needed to make clinical conclusions.
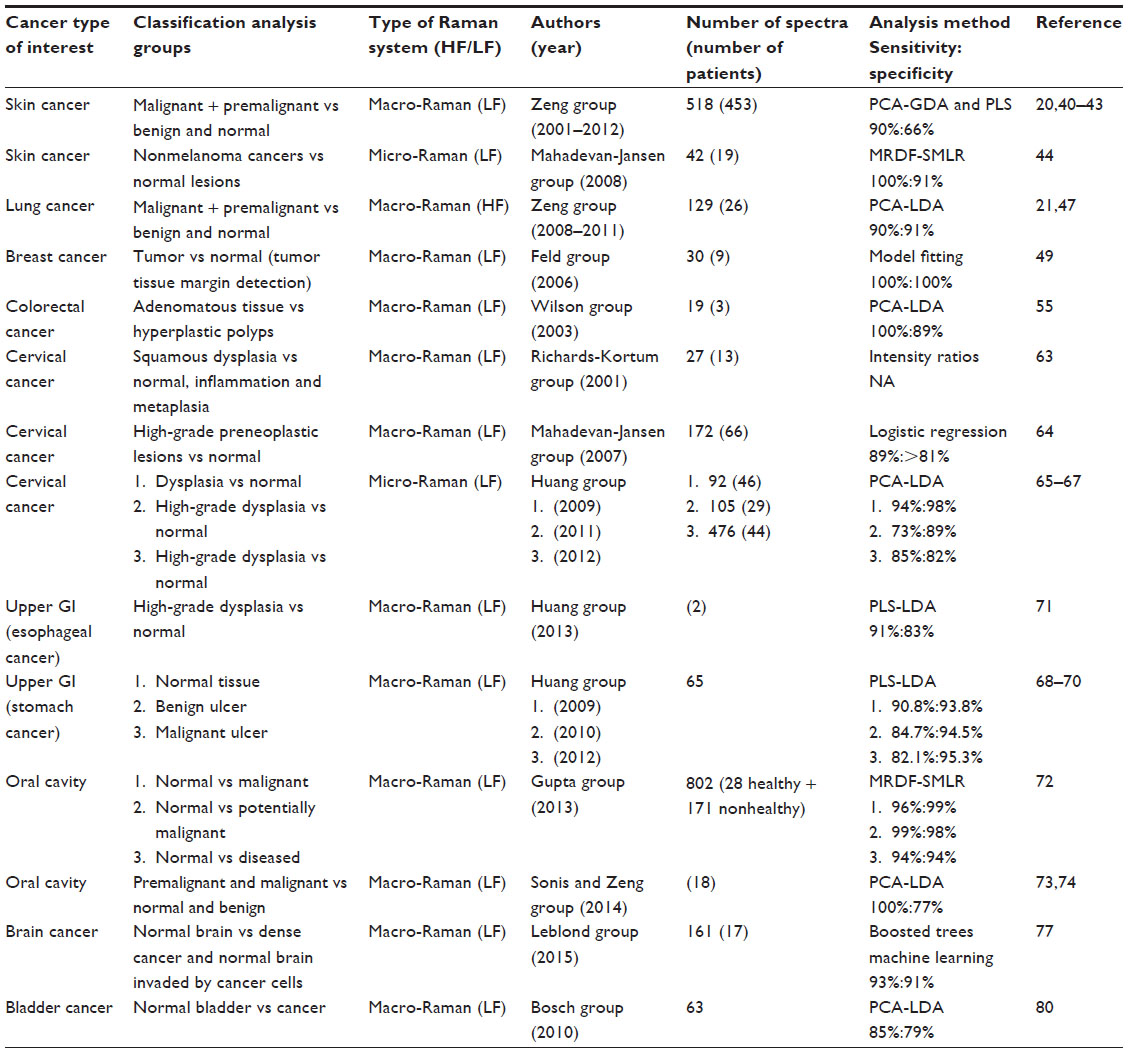 | Table 1 Summary of in vivo Raman spectroscopy for oncology applications |
Current challenges
Current Raman systems designed for oncology applications face the challenge of the heterogeneous nature of most tumors. Often, a tumor will not be a uniform lesion; there will be portions of that lesion with normal cells, some with cancerous cells, and some within the gradient of the two extremes. This poses a problem for probe-based Raman research, as only a finite area of tissue is excited at one time. If the excitation area does not capture the worse diagnosis of the lesion, there could be a misclassification. However, it should be noted that endoscopic biopsies (often using an end-grabbing tool) could suffer from the same problem. To combat this, physicians often take more than one biopsy of the lesion, and then determine the appropriate treatment based on the worst diagnosis found. In vivo Raman researchers have adopted this method as well, taking multiple readings of a single lesion and then averaging the readings.21,73 However, this averaging may cause a classification score that does not reflect the worst diagnosis of the lesion. Similarly, there is a challenge of matching the endoscopic biopsy site to the Raman reading site, potentially causing a mismatch in spectra and pathology that will affect the training set of a classification algorithm.
Future prospects
In future, Raman technology could expand in multiple directions; however, in the immediate future, building on the successes of the aforementioned researches is a likely option. Tumor classification and tumor margin detection will be a large area of future oncology applications, as cancerous lesions form in almost every organ of the body, showing the need and use of in vivo Raman systems trained on particular cancers. Furthermore, the ability to determine the differences between lesions that will progress, lesions that will become malignant, lesions that will become metastatic, and lesions that will spontaneously regress will have great clinical value. A Raman system able to detect the biochemical characteristic changes associated with progression risk is a much needed tool. Similarly, a system that is capable of providing accurate and reliable staging information in real time would reduce the need for countless biopsies, multiple surgeries, and appointments per patient.
Cardiovascular applications and developments
Cardiovascular disease (CD) is responsible for the highest number of deaths in the Western world.81 It has been found that risk factors such as smoking, high rates of obesity, and physical inactivity have lead to a high percentage of the population who will contract the disease in their lifetime.81 Of those who acquire a form of CD, well over 5% will eventually have either a stroke or a heart attack.81 If cardiovascular conditions, especially those that lead to heart attack and stroke, are able to be caught in early stages, there is a better chance of clinical intervention and, thus, patient survival.
Atherosclerosis
Atherosclerosis is a disease by which plaque deposits are found along the interior artery wall.15 These plaque deposits cause a narrowing of the artery, preventing oxygen-rich blood getting to certain parts of the body, which is especially important if that oxygen needs to get to the heart or the brain. However, there is a structural and chemical difference between the plaques that will break off and cause cardiovascular events and the ones that remain stable and will not break off.82–85 The gold standard of determining where plaque deposits are, which is known as X-ray angiography,15,86 does not have the capability of determining the difference between stable and unstable plaques, spurring new technologies in the last decade. These technologies, such as intravascular magnetic resonance imaging (MRI), intravascular ultrasound, and tomography, are now commonly used, yet have not been able to address the initial issue, since they too are unable to determine the differences between stable and unstable plaque deposits. Spectroscopic information would be able to provide distinct chemical signatures needed to determine this difference.
A study was conducted in 2006 by Motz et al in which 74 spectra were acquired throughout the cardiovascular system from locations, where biopsies or excised tissue were the standard procedure at the time.86 They employed a Raman system that consisted of an 830 nm diode laser, which was coupled to a fiber-optic probe for both excitation and collection.86 At the end of the probe, there was a ball lens that collimated the excitation light while also effectively gathering the Raman-scattered light. This provided a spatial resolution of 1 mm in both axial and lateral directions. Through the use of non-negativity-constrained least-squares minimization, modeled from in situ biological data, as well as additions to the model from probe components (to accurately show in vivo data), the group was able to find a separation between stable versus unstable plaques. They achieved a sensitivity of 79% and a specificity of 85%.86 The authors suggest that technology optimizations are needed before the system can become clinically viable.86
In 2008, a study conducted by Chau et al tested the utility of a side-firing custom Raman probe and system capable of measurements in both the fingerprint (FP) and high wavenumber (HW) region for the purpose of determining the chemical composition of atherosclerotic lesions.87 A unique system design, which used shutters to rapidly switch between the FP and HW regions, allowed Raman measurements to be captured at the same spot for both regions, although each region had a different excitation wavelength (830 nm for FP and 740 nm for HW). The system was tested in vivo on a living swine heart that had diseased human coronary tissue xenografted onto it for the purpose of replicating the disease. Although statistical analysis was not carried out due to the small number of samples, the authors conclude that the spectra can show differences among arterial sites but further work is necessary.87
A current challenge
A challenge of Raman-based instrumentation designed for use in the cardiovascular system is creating a Raman probe that can be efficiently used to obtain the spectrum of an arterial plaque. As Motz et al describes, an end-facing probe requires the surgical area to have the lights turned off, a condition that is not ideal because it requires limited visibility during a medical procedure.86 A side-firing probe would eliminate this need, as physicians could access the plaque through a small puncture instead of an incision, thereby eliminating the need of exposing the vessel being measured.86 Yet, creating a side-firing probe has challenges of its own, as noted by Chau et al in 2008, mainly how to optimize the optics for use, especially if the probe will be in a tubelike structure (vessel).87 Finding a way to either rotate the probe without super coiling, taking a 360° spectrum, or finding a way to align the probe with the plaque is particularly difficult in vivo if the plaque is only on one side of the vessel. Finally, maintaining a diameter size capable of entering blood vessels while having sufficient light collection efficiency remains a challenge.87
Future prospects
Future prospects of using Raman-based technology in vivo for CDs include an extensive variety of applications. As Motz et al notes, intervention, guidance, and follow-up are all medically necessary, and are all areas that could benefit with the knowledge of biochemical information about a plaque.86 Other cardiovascular and blood diseases, such as sickle cell anemia,88 are currently being studied using ex vivo Raman systems. A real-time or shorter excitation period allows for a number of spectra to be taken in a relatively small amount of time, indicating that there is potential to create a system capable of detecting multiple different blood malignancies, reducing the number of tests and the time needed to analyze patient samples.
Neurological developments
Alzheimer’s disease
Alzheimer’s disease (AD) is a common form of dementia, the chronic disorder of mental processes, that usually impairs memory and reasoning resulting in personality changes.89–91 AD itself is characterized by both plaques and tangles of abnormally folded proteins causing impairments with the normally functioning neuron cells.15,92 The plaques are formed from β-amyloid proteins where the tangles are formed from τ-proteins. Although there are methods available for detecting an assumed diagnosis of AD, including cognitive assessments, MR imaging, positron emission tomography (PET) imaging, and cerebral spinal fluid analysis,91 there is no definitive method and a confirmed diagnosis is determined at the time of autopsy.92 It is a disease that is found mainly in the elderly population – although cases of early onset have been described in detail – meaning that a larger percentage of the population will be afflicted with AD due to the global increase in life expectancy.93 The major restriction in diagnosing the presence of AD is the lack of noninvasive imaging methods in the brain, a hurdle that may be overcome by RS.
Although research on the use of RS remains in a laboratory setting, due to the difficulty in obtaining fully consenting patients and facilities, it has been shown to have great potential in differentiating AD tissue from normal tissue. The next logical step is to see the use of RS in vivo. Sudworth et al have shown on several occasions94–98 the ability of a laboratory system to differentiate between AD and Huntingdon’s disease and normal brain tissue. In 2005,95,96 the group obtained 18 samples from various stages of AD along with matched normal donors. The system used an 830 nm diode laser for excitation, and the spectral acquisition time was 10 seconds. Through the use of PCA, it was shown that they were able to effectively group AD away from the Huntingdon’s tissue or the matched normal tissue. The authors concluded that there remained many possibilities to use RS as an in vivo diagnostic method.
Current challenge
A current challenge in the use of a Raman-based system on the brain is the significance of the procedure involved. Such a system has been used to detect tumor margins, and the authors have outlined that the measurements were performed during a brain surgery, which carries a high risk of complications for the patient. The vast majority of patients diagnosed with AD are elderly, further increasing the risk of an open surgery. As well, AD is usually determined postmortem, so there are little chances (without great risk) of correlating Raman spectra with a positive pathology to create a training set for an algorithm. One solution proposed by Hanlon et al is a method of inserting the Raman probe through the olfactory tract, thus avoiding the need for open surgery. The group also states that AD can also be present in the membrane of this tract, providing a location for a biopsy.15 This proposed method has not yet been attempted in vivo to our knowledge.
Future prospects
Future prospects of utilizing Raman-based technology for the detection of AD include the progression of ex vivo systems adapting to become in vivo diagnostic tools. Once the challenges of patient safety and biopsy correlation are overcome, there is a significant need for a reliable diagnosis of AD by RS. Although currently there is no cure for AD, a definite diagnosis could provide physicians with a treatment path. As well, RS-based systems would allow for the opportunity of earlier detection and the determination of the extent of the disease. Other brain maladies, such as Parkinson’s disease (PD) could benefit from the same technology since Lewy bodies (inclusions made of insoluble proteins) are a hallmark of the disease.
Conclusion
Owing to rapid technological advancement in lasers and detectors, clinical RS has come of age. For biomedical applications, RS has unique strengths in providing highly specific molecular information, the flexibility to work with existing diagnostic devices, and real-time diagnosis with accuracy that supersedes current technology. Most recent scientific publications have demonstrated the great potential of RS in numerous fields of medical research. Although there are a number of systems that are being used for the detection of preneoplastic lesions, or to elucidate tumor tissue margins, there remain diagnosis and detection areas where RS would be of great value. Both cardiovascular and neurological areas of medicine require real-time decisions for diagnoses, which is possible with the current optical and photonic technological developments.
Acknowledgments
The authors gratefully acknowledge financial support from the Canadian Cancer Society, the Canadian Institutes of Health Research (CIHR), and the Canadian Dermatology Foundation (CDF).
Disclosure
HCM was supported by a Mitacs Accelerate fellowship, and WW was supported by an Engineer-in-Scrubs postdoctoral fellowship at the Department of Biomedical Engineering, University of British Columbia. MAS, HZ, and the BC Cancer Agency hold patents for Raman spectroscopy that are licensed to Verisante Technology, Inc. The other authors report no conflicts of interest in this work.
References
Lam S, MacAulay C, leRiche JC, Palcic B. Detection and localization of early lung cancer by fluorescence bronchoscopy. Cancer. 2000;89(S11):2468–2473. | |
Lam S, Kennedy T, Unger M, et al. Localization of bronchial intraepithelial neoplastic lesions by fluorescence bronchoscopy. Chest. 1998;113:696–702. | |
Henderson BW, Dougherty TJ. How does photodynamic therapy work? Photochem Photobiol. 1992;55(1):145–157. | |
Severinghaus JW, Honda Y. History of blood gas analysis. VII. Pulse oximetry. J Clin Monit. 1987;3(2):135–138. | |
Zeng H, McWilliams A, Lam S. Optical spectroscopy and imaging for early lung cancer detection:a review. Photodiagnosis Photodyn Ther. 2004;1(2):111–122. | |
Colthup N. Introduction to Infrared and Raman Spectroscopy. Elsevier; 2012. | |
Socrates G. Infrared and Raman Characteristic Group Frequencies:Tables and Charts. John Wiley & Sons; 2004. | |
Nafie LA. Infrared and Raman vibrational optical activity:theoretical and experimental aspects. Annu Rev Phys Chem. 1997;48(1):357–386. | |
El-Diasty F. Coherent anti-stokes Raman scattering:spectroscopy and microscopy. Vib Spectrosc. 2011;55(1):1–37. | |
Begley R, Harvey A, Byer RL. Coherent anti-stokes Raman spectroscopy. Appl Phys Lett. 1974;25(7):387–390. | |
Cheng JX, Xie XS. Coherent anti-stokes Raman scattering microscopy:instrumentation, theory, and applications. J Phys Chem B. 2004;108(3):827–840. | |
Rodriguez LG, Lockett SJ, Holtom GR. Coherent anti-stokes Raman scattering microscopy:a biological review. Cytometry A. 2006;69(8):779–791. | |
Tolles WM, Nibler J, McDonald J, Harvey A. A review of the theory and application of coherent anti-stokes Raman spectroscopy (CARS). Appl Spectrosc. 1977;31(4):253–271. | |
Nafie LA. Theory of Raman scattering. In:Lewis IR, Edwards HGM, eds. Handbook of Raman Spectroscopy:From the Research Laboratory to the Process Line. New York, NY:CRC Press; 2001:1–10. | |
Hanlon EB, Manoharan R, Koo TW, et al. Prospects for in vivo Raman spectroscopy. Phys Med Biol. 2000;45(2):R1. | |
Almond LM, Old O, Stone N, et al. Real-time disease detection using spectroscopic diagnosis. Biomed Spectrosc Imag. 2014; 3(3):197–202. | |
Wang W, Zhao J, Short M, Zeng H. Real-time in vivo cancer diagnosis using spectroscopy. J Biophotonics. 2015;8(7):527–545. | |
Baena JR, Lendl B. Raman spectroscopy in chemical bioanalysis. Curr Opin Chem Biol. 2004;8(5):534–539. | |
Zhao J, Lui H, McLean DI, Zeng H. Automated autofluorescence background subtraction algorithm for biomedical Raman spectroscopy. Appl Spectrosc. 2007;61(11):1225–1232. | |
Lui H, Zhao J, McLean D, Zeng H. Real-time Raman spectroscopy for in vivo skin cancer diagnosis. Cancer Res. 2012;72:2491–2500. | |
Short MA, Lam S, McWilliams AM, Ionescu DN, Zeng H. Using laser Raman spectroscopy to reduce false positives of autofluorescence bronchoscopies:a pilot study. J Thorac Oncol. 2011;6(7):1206–1214. | |
Schlucker S. Surface-enhanced Raman spectroscopy:concepts and chemical applications. Angew Chem Int Ed. 2014;53(19):4756–4795. | |
Schütz M, Steinigeweg D, Salehi M, Kömpe K, Schlücker S. Hydrophilically stabilized gold nanostars as SERS labels for tissue imaging of the tumor suppressor p63 by immuno-SERS microscopy. Chem Commun. 2011;47(14):4216–4218. | |
Schlücker S. SERS microscopy:nanoparticle probes and biomedical applications. Chemphyschem. 2009;10(9–10):1344–1354. | |
Qian XM, Nie S. Single-molecule and single-nanoparticle SERS:from fundamental mechanisms to biomedical applications. Chem Soc Rev. 2008;37(5):912–920. | |
Kneipp K, Wang Y, Kneipp H, et al. Single molecule detection using surface-enhanced Raman scattering (SERS). Phys Rev Lett. 1997;78(9):1667–1670. | |
Fleischmann M, Hendra PJ, McQuillan A. Raman spectra of pyridine adsorbed at a silver electrode. Chem Phys Lett. 1974;26(2):163–166. | |
Jeanmaire DL, Van Duyne RP. Surface Raman spectroelectrochemistry:part I. Heterocyclic, aromatic, and aliphatic amines adsorbed on the anodized silver electrode. J Electroanal Chem Interfacial Electrochem. 1977;84(1):1–20. | |
Otto A, Mrozek I, Grabhorn H, Akemann W. Surface-enhanced Raman scattering. J Phys Condens Matter. 1992;4(5):1143. | |
Samanta A, Maiti KK, Soh KS, et al. Ultrasensitive near-infrared Raman reporters for SERS-based in vivo cancer detection. Angew Chem Int Ed. 2011;50(27):6089–6092. | |
Zumbusch A, Holtom GR, Xie XS. Three-dimensional vibrational imaging by coherent anti-stokes Raman scattering. Phys Rev Lett. 1999;82(20):4142. | |
Evans CL, Potma EO, Puoris’haag M, Côté D, Lin CP, Xie XS. Chemical imaging of tissue in vivo with video-rate coherent anti-stokes Raman scattering microscopy. Proc Natl Acad Sci U S A. 2005;102(46):16807–16812. | |
Evans CL, Xie XS. Coherent anti-stokes Raman scattering microscopy:chemical imaging for biology and medicine. Annu Rev Anal Chem. 2008;1:883–909. | |
Saar BG, Freudiger CW, Reichman J, Stanley CM, Holtom GR, Xie XS. Video-rate molecular imaging in vivo with stimulated Raman scattering. Science. 2010;330(6009):1368–1370. | |
Parkin DM, Bray F, Ferlay J, Pisani P. Global cancer statistics, 2002. CA Cancer J Clin. 2005;55:74–108. | |
Siegel R, Ma J, Zou Z, Jemal A. Cancer statistics, 2014. CA Cancer J Clin. 2014;64(1):9–29. | |
Greene FL. AJCC Cancer Staging Manual. Vol 1. New York, NY:Springer-Verlag; 2002. | |
Auerbach O, Stout AP, Hammond EC, Garfinkel L. Changes in bronchial epithelium in relation to cigarette smoking and in relation to lung cancer. N Engl J Med. 1961;265(6):253–267. | |
Hirsch FR, Franklin WA, Gazdar AF, Bunn PA. Early detection of lung cancer:clinical perspectives of recent advances in biology and radiology. Clin Cancer Res. 2001;7(1):5–22. | |
Zhao J, Lui H, McLean DI, Zeng H. Integrated real-time Raman system for clinical in vivo skin analysis. Skin Res Technol. 2008;14(4):484–492. | |
Zhao J, Lui H, McLean DI, Zeng H. Real-time Raman spectroscopy for non-invasive skin cancer detection-preliminary results. Paper Presented at:Engineering in Medicine and Biology Society, 2008. EMBS 2008. 30th Annual International Conference of the IEEE2008. Vancouver, BC:IEEE; 2008:3107–3109. | |
Huang Z, Zeng H, Hamzavi I, McLean DI, Lui H. Rapid near-infrared Raman spectroscopy system for real-time in vivo skin measurements. Opt Lett. 2001;26:1782–1784. | |
Zhao J, McLean DI, Zeng H, Lui H. Real-Time Raman Spectroscopy for Noninvasive In Vivo Skin Analysis and Diagnosis. Rijeka, Croatia:INTECH Open Access Publisher; 2010. | |
Lieber CA, Majumder SK, Ellis DL, Billheimer DD, Mahadevan-Jansen A. In-vivo nonmelanoma skin cancer diagnosis using Raman microspectroscopy. Lasers Surg Med. 2008;40(7):461–467. | |
McWilliams A, Tammemagi MC, Mayo JR, et al. Probability of cancer in pulmonary nodules detected on first screening CT. N Engl J Med. 2013;369(10):910–919. | |
Palcic B, Lam S, Hung J, MacAulay C. Detection and localization of early lung cancer by imaging techniques. Chest. 1991;99(3):742–743. | |
Short MA, Lam S, McWilliams A, Zhao J, Lui H, Zeng H. Development and preliminary results of an endoscopic Raman probe for potential in vivo diagnosis of lung cancers. Opt Lett. 2008;33:711–713. | |
Manoharan R, Shafer K, Perelman L, et al. Raman spectroscopy and fluorescence photon migration for breast cancer diagnosis and imaging. Photochem Photobiol. 1998;67(1):15–22. | |
Haka AS, Volynskaya Z, Gardecki JA, et al. In vivo margin assessment during partial mastectomy breast surgery using spectroscopy. Cancer Res. 2006;66(6):3317–3322. | |
Saha A, Barman I, Dingari NC, et al. Raman spectroscopy:a real-time tool for identifying microcalcifications during stereotactic breast core needle biopsies. Biomed Opt Express. 2011;2(10):2792–2803. | |
Saha A, Barman I, Dingari NC, et al. Precision of Raman spectroscopy measurements in detection of microcalcifications in breast needle biopsies. Anal Chem. 2012;84(15):6715–6722. | |
Dingari NC, Barman I, Saha A, et al. Development and comparative assessment of Raman spectroscopic classification algorithms for lesion discrimination in stereotactic breast biopsies with microcalcifications. J Biophotonics. 2013;6(4):371–381. | |
Barman I, Dingari NC, Saha A, et al. Application of Raman spectroscopy to identify microcalcifications and underlying breast lesions at stereotactic core needle biopsy. Cancer Res. 2013;73(11):3206–3215. | |
Kessler W, Imperiale T, Klein R, Wielage R, Rex D. A quantitative assessment of the risks and cost savings of forgoing histologic examination of diminutive polyps. Endoscopy. 2011;43(8):683–691. | |
Molckovsky A, Song LM, Shim MG, Marcon NE, Wilson BC. Diagnostic potential of near-infrared Raman spectroscopy in the colon:differentiating adenomatous from hyperplastic polyps. Gastrointest Endosc. 2003;57(3):396–402. | |
Short MA, Tai IT, Owen D, Zeng H. Using high frequency Raman spectra for colonic neoplasia detection. Opt Express. 2013;21(4):5025–5034. | |
Pawluk HC, Short MA, Lam S, McWilliams AM, Ionescue DN, Zeng H. Improvements to a laser Raman spectroscopy system for reducing the false positives of autofluorescence bronchoscopies. Paper Presented at:Photonics West. San Francisco, CA; 2012. | |
Bergholt MS, Lin K, Wang J, et al. Simultaneous fingerprint and high-wavenumber fiber-optic Raman spectroscopy enhances real-time in vivo diagnosis of adenomatous polyps during colonoscopy. J Biophotonics. 2015;9999(9999):1–10. | |
Jemal A, Bray F, Center MM, Ferlay J, Ward E, Forman D. Global cancer statistics. CA Cancer J Clin. 2011;61(2):69–90. | |
Moyer VA. Screening for cervical cancer:US preventive services task force recommendation statement. Ann Intern Med. 2012;156(12):880–891. | |
Nanda K, McCrory DC, Myers ER, et al. Accuracy of the Papanicolaou test in screening for and follow-up of cervical cytologic abnormalities:a systematic review. Ann Intern Med. 2000;132(10):810–819. | |
Arbyn M, Sankaranarayanan R, Muwonge R, et al. Pooled analysis of the accuracy of five cervical cancer screening tests assessed in eleven studies in Africa and India. Int J Cancer. 2008;123(1):153–160. | |
Utzinger U, Heintzelman DL, Mahadevan-Jansen A, Malpica A, Follen M, Richards-Kortum R. Near-infrared Raman spectroscopy for in vivo detection of cervical precancers. Appl Spectrosc. 2001; 55(8):955–959. | |
Robichaux-Viehoever A, Kanter E, Shappell H, Billheimer D, Jones H, 3rd, Mahadevan-Jansen A. Characterization of Raman spectra measured in vivo for the detection of cervical dysplasia. Appl Spectrosc. 2007;61(9):986–993. | |
Mo J, Zheng W, Low JJ, Ng J, Ilancheran A, Huang Z. High wavenumber Raman spectroscopy for in vivo detection of cervical dysplasia. Anal Chem. 2009;81(21):8908–8915. | |
Duraipandian S, Zheng W, Ng J, Low JJ, Ilancheran A, Huang Z. In vivo diagnosis of cervical precancer using Raman spectroscopy and genetic algorithm techniques. Analyst. 2011;136(20):4328–4336. | |
Duraipandian S, Zheng W, Ng J, Low JJ, Ilancheran A, Huang Z. Simultaneous fingerprint and high-wavenumber confocal Raman spectroscopy enhances early detection of cervical precancer in vivo. Anal Chem. 2012;84(14):5913–5919. | |
Teh SK, Zheng W, Ho KY, Teh M, Yeoh KG, Huang Z. Near-infrared Raman spectroscopy for gastric precancer diagnosis. J Raman Spectrosc. 2009;40(8):908–914. | |
Bergholt MS, Zheng W, Lin K, et al. Raman endoscopy for in vivo differentiation between benign and malignant ulcers in the stomach. Analyst. 2010;135(12):3162–3168. | |
Duraipandian S, Sylvest Bergholt M, Zheng W, et al. Real-time Raman spectroscopy for in vivo, online gastric cancer diagnosis during clinical endoscopic examination. J Biomed Opt. 2012;17(8):081418–081418. | |
Bergholt MS, Zheng W, Ho KY, et al. Real-time depth-resolved Raman endoscopy for in vivo diagnosis of dysplasia in Barrett’s esophagus. Paper Presented at:SPIE BiOS2013. San Francisco, CA; 2013. | |
Krishna H, Majumder SK, Chaturvedi P, Sidramesh M, Gupta PK. In vivo Raman spectroscopy for detection of oral neoplasia:a pilot clinical study. J Biophotonics. 2014;7(9):690–702. | |
Guze K, Pawluk HC, Short M, et al. Pilot study:Raman spectroscopy in differentiating premalignant and malignant oral lesions from normal mucosa and benign lesions in humans. Head Neck. 2015;37(4):511–517. | |
Guze K, Short M, Sonis S, Karimbux N, Chan J, Zeng H. Parameters defining the potential applicability of Raman spectroscopy as a diagnostic tool for oral disease. J Biomed Opt. 2009;14(1):014016–014016. | |
Oliveira AP, Bitar RA, Silveira L Jr, Zângaro RA, Martin AA. Near-infrared Raman spectroscopy for oral carcinoma diagnosis. Photomed Laser Surg. 2006;24(3):348–353. | |
De Veld D, Schut TB, Skurichina M, et al. Autofluorescence and Raman microspectroscopy of tissue sections of oral lesions. Lasers Med Sci. 2005;19(4):203–209. | |
Jermyn M, Mok K, Mercier J, et al. Intraoperative brain cancer detection with Raman spectroscopy in humans. Sci Transl Med. 2015;7(274):274ra219. | |
Clark PE, Agarwal N, Biagioli MC, et al. Bladder cancer. J Natl Compr Canc Netw. 2013;11(4):446–475. | |
Crow P, Molckovsky A, Stone N, Uff J, Wilson B, WongKeeSong LM. Assessment of fiberoptic near-infrared spectroscopy for diagnosis of bladder and prostate cancer. Urology. 2005;65(6):1126–1130. | |
Draga ROP, Grimbergen MCM, Vijverberg PLM, et al. In vivo bladder cancer diagnosis by high-volume Raman spectroscopy. Anal Chem. 2010;82(14):5993–5999. | |
Go AS, Mozaffarian D, Roger VL, et al. Heart disease and stroke statistics – 2014 update:a report from the American heart association. Circulation. 2014;129(3):e28–e292. | |
Wexler L, Brundage B, Crouse J, et al. Coronary artery calcification:pathophysiology, epidemiology, imaging methods, and clinical implications. A statement for health professionals from the American Heart Association. Writing Group. Circulation. 1996;94(5):1175–1192. | |
Mach F, Schonbeck U, Bonnefoy JY, Pober JS, Libby P. Activation of monocyte/macrophage functions related to acute atheroma complication by ligation of CD40:induction of collagenase, stromelysin, and tissue factor. Circulation. 1997;96(2):396–399. | |
Demer LL. Lipid hypothesis of cardiovascular calcification. Circulation. 1997;95(2):297–298. | |
Mitchinson MJ. Insoluble lipids in human atherosclerotic plaques. Atherosclerosis. 1982;45(1):11–15. | |
Motz JT, Fitzmaurice M, Miller A, et al. In vivo Raman spectral pathology of human atherosclerosis and vulnerable plaque. J Biomed Opt. 2006;11(2):021003–021009. | |
Chau AH, Motz JT, Gardecki JA, Waxman S, Bouma BE, Tearney GJ. Fingerprint and high-wavenumber Raman spectroscopy in a human-swine coronary xenograft in vivo. J Biomed Opt. 2008;13(4):040501–040501. | |
Filho A, Silveira L Jr, Yanai AA, Fernandes A. Raman spectroscopy for a rapid diagnosis of sickle cell disease in human blood samples:a preliminary study. Lasers Med Sci. 2015;30(1):247–253. | |
Dinsmore S. Alzheimer’s disease diagnosis. J Am Osteopath Assoc. 1999;99(9 Suppl):S1–S6. | |
Finch CE, Cohen DM. Aging, metabolism, and Alzheimer disease:review and hypotheses. Exp Neurol. 1997;143(1):82–102. | |
Dubois B, Feldman HH, Jacova C, et al. Research criteria for the diagnosis of Alzheimer’s disease:revising the NINCDS–ADRDA criteria. Lancet Neurol. 2007;6(8):734–746. | |
McKhann G, Drachman D, Folstein M, Katzman R, Price D, Stadlan EM. Clinical diagnosis of Alzheimer’s disease:report of the NINCDS-ADRDA Work Group under the auspices of department of health and human services task force on Alzheimer’s disease. Neurology. 1984;34(7):939–939. | |
Wimo A, Winblad B, Aguero-Torres H, von Strauss E. The magnitude of dementia occurrence in the world. Alzheimer Dis Assoc Disord. 2003;17(2):63–67. | |
Sudworth CD, Krasner N. Raman spectroscopy of Alzheimer’s diseased tissue. Paper Presented at:Biomedical Vibrational Spectroscopy and Biohazard Detection Technologies 2004. San Jose, CA; 2004. | |
Sudworth CD, Archer JK, Mann D. Near infrared Raman spectroscopy for Alzheimer’s disease detection. Paper Presented at:European Conference on Biomedical Optics. Munich; 2005. | |
Sudworth CD, Archer JK, Mann D. The potential use of Raman spectroscopy for the diagnosis of Alzheimer’s disease. Paper Presented at:Photonics North. Toronto, Ontario; 2005. | |
Sudworth CD, Archer JK, Black RA, Mann D. Advances in Raman spectroscopy for the diagnosis of Alzheimer’s disease. Paper Presented at:Biomedical Vibrational Spectroscopy III:Advances in Research and Industry. San Jose, CA; 2006. | |
Archer JK, Sudworth CD, Williams R, et al. Improvements in Alzheimer’s disease diagnosis using principal component analysis (PCA) in combination with Raman spectroscopy. Paper Presented at:European Conference on Biomedical Optics. Munich; 2007. |
 © 2016 The Author(s). This work is published and licensed by Dove Medical Press Limited. The
full terms of this license are available at https://www.dovepress.com/terms
and incorporate the Creative Commons Attribution
- Non Commercial (unported, 3.0) License.
By accessing the work you hereby accept the Terms. Non-commercial uses of the work are permitted
without any further permission from Dove Medical Press Limited, provided the work is properly
attributed. For permission for commercial use of this work, please see paragraphs 4.2 and 5 of our Terms.
© 2016 The Author(s). This work is published and licensed by Dove Medical Press Limited. The
full terms of this license are available at https://www.dovepress.com/terms
and incorporate the Creative Commons Attribution
- Non Commercial (unported, 3.0) License.
By accessing the work you hereby accept the Terms. Non-commercial uses of the work are permitted
without any further permission from Dove Medical Press Limited, provided the work is properly
attributed. For permission for commercial use of this work, please see paragraphs 4.2 and 5 of our Terms.