Back to Journals » Neuropsychiatric Disease and Treatment » Volume 22
Clinical Utility of Peripheral Non-Enzymatic Antioxidants in Differentiating Major Depressive Disorder from Bipolar Disorder: Associations with Antioxidant Levels, Hospitalization Outcomes, and Antidepressant Efficacy
Received 4 December 2025
Accepted for publication 18 February 2026
Published 4 March 2026 Volume 2026:22 585769
DOI https://doi.org/10.2147/NDT.S585769
Checked for plagiarism Yes
Review by Single anonymous peer review
Peer reviewer comments 4
Editor who approved publication: Professor Taro Kishi
Jiangjing Dai,1– 3 Qingling Li,1 Biqiong Ren1,2
1College of Integrated Traditional Chinese and Western Medicine, Hunan University of Traditional Chinese Medicine, Changsha, Hunan Province, People’s Republic of China; 2Department of Science and Education, The Second People’s Hospital of Hunan Province (Hunan Provincial Brain Hospital), Changsha, Hunan Province, People’s Republic of China; 3Department of Clinical Laboratory, Shaoyang Central Hospital, Shaoyang, Hunan Province, People’s Republic of China
Correspondence: Biqiong Ren, Department of Science and Education of The Second People’s Hospital of Hunan Province (Hunan Provincial Brain Hospital), Changsha, Hunan Province, 410007, People’s Republic of China, Tel +86 13808481211, Email [email protected]
Objective: To investigate changes in peripheral blood non-enzymatic antioxidant levels in patients with major depressive disorder (MDD) and bipolar disorder (BD) across different disease stages from a laboratory perspective, and to explore their potential clinical applications.
Methods: This single-center retrospective case-control study was conducted at Hunan Provincial Brain Hospital between January and December 2023. A total of 290 participants aged ≥ 16 years were enrolled, including 140 BD patients, 72 MDD patients, and 78 healthy controls (HC). Between-group comparisons for two groups were performed using independent samples t-tests, and one-way analysis of variance (ANOVA) was employed for multi-group comparisons of continuous variables. Analysis of covariance (ANCOVA) was further used to compare serum levels of uric acid (UA), albumin (Alb), and total bilirubin (TBIL) among the MDD, BD, and HC groups, with age and sex as covariates. Multivariable logistic regression analyses were conducted to identify independent predictors of MDD and BD. Receiver operating characteristic (ROC) curves were generated based on predicted probabilities from the regression models. Statistical significance was set at a two-tailed P < 0.05.
Results: Compared with HC, MDD patients exhibited significantly lower serum UA levels (P = 0.022), whereas BD patients demonstrated significantly higher UA levels (P = 0.006); both patient groups showed markedly reduced TBIL and Alb levels (all P < 0.0001). BD patients presented elevated UA, Alb, and TBIL levels during manic episodes and decreased levels during depressive episodes. The combined detection of these indices yielded an area under the curve (AUC) of 0.919 for MDD (sensitivity: 75.6%; specificity: 90.0%) and 0.842 for BD (sensitivity: 67.9%; specificity: 89.7%). MDD patients with hospitalization duration ≤ 15 days had higher serum UA levels, which were negatively correlated with hospitalization duration (r = − 0.28). In contrast, BD patients with hospitalization duration ≤ 15 days exhibited lower UA, Alb, and TBIL levels, with UA positively correlated with hospitalization duration (r = 0.19). BD patients in depressive episodes who received antidepressants had significantly prolonged hospitalization (P < 0.0001).
Conclusion: Serum UA level could serve as a potential biomarker for distinguishing MDD from BD, with lower UA levels observed in MDD patients and relatively higher levels in BD patients. The combined detection of UA, Alb, and TBIL demonstrated favorable diagnostic performance for both disorders, and was associated with the length of hospital stay. Furthermore, antidepressant use during the depressive episode of BD may be associated with prolonged hospital stay. These findings may help improve the early differential diagnosis and clinical management of MDD and BD, and provide a reference for individualized treatment and hospitalization strategies in clinical practice.
Keywords: depression, bipolar disorder, antioxidant, differential diagnosis
Introduction
Major depressive disorder (MDD) and bipolar disorder (BD) are severe mental health conditions, collectively accounting for the second-largest global disease burden.1 These conditions cause substantial distress to individuals, families, and society alike. Due to the unclear etiology, effective treatment options remain limited. Additionally, there is a lack of objective and quantitative criteria for diagnosis and differential diagnosis, which presents a significant medical challenge. Identifying clinical research insights to guide mechanistic studies is urgently needed, as they could ultimately inform clinical diagnosis and treatment.
Currently, MDD is considered a mood disorder caused by congenital genetic abnormalities or acquired environmental factors. BD is characterized by recurrent episodes of both depression and mania. BD with major depressive episodes (hereinafter referred to as BD depressive episodes) shares significant clinical similarities with MDD. As a result, BD depressive episodes is often misdiagnosed as MDD and treated with antidepressants, which may trigger severe mania, hypomania, or rapid cycling of manic episodes.2 Most clinical guidelines recommend mood stabilizers and second-generation antipsychotics as first-line treatments for BD depressive episodes.3 They also explicitly state that antidepressants should not be used as monotherapy for bipolar depression. However, significant controversy persists regarding the clinical value of combining antidepressants with mood stabilizers, as reflected in numerous guidelines and existing research evidence.4,5 Therefore, the differential diagnosis of BD from MDD is crucial. Research has explored serum biomarkers, brain imaging, and genetic variant information for BD diagnosis. However, these approaches have not yet demonstrated significant clinical value.6
Oxidative stress (OS) is a condition marked by an imbalance between oxidative and antioxidant forces in the body, which leads to a predisposition toward oxidation and potential oxidative damage. The mechanisms driving OS and its associated damage are complex, and they can serve as both causes and consequences of disease.7,8 The brain is a lipid-rich organ that consumes large amounts of oxygen yet lacks sufficient antioxidant defenses. This makes it highly susceptible to OS, which is a potential contributing factor to psychiatric and psychological disorders, including MDD and BD.9 The rapid generation of large amounts of free radicals is a key contributor to the development of various diseases.10 When an organism utilizes oxygen, it inevitably produces oxygen free radicals, which contribute to the development of OS. While cellular mitochondria contribute to OS mitigation through their antioxidant defense systems, their protective capacity is often insufficient to counteract severe or chronically imbalanced OS (Figure 1).11 Therefore, both intracellular and extracellular antioxidants are essential for maintaining redox balance and preventing excessive oxidative damage.12
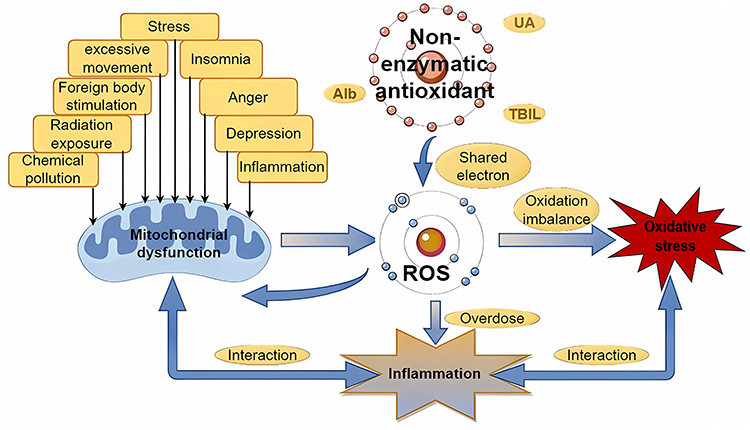 |
Figure 1 Electron transfer between antioxidants and free radicals: mechanisms of antioxidant action. Abbreviations: ROS, reactive oxygen species; UA, uric acid; TBIL, total bilirubin; Alb, albumin. |
Biological antioxidant systems include both endogenous and exogenous antioxidants, with this study primarily focusing on the endogenous systems. The endogenous antioxidant system consists of three key components: antioxidant enzymes, nonenzymatic antioxidants, and metal ion chelators. These components exert their effects extracellularly by disrupting free radical chain reactions, interacting with Reactive Oxygen Species (ROS), and chelating metal ions.13 Endogenous nonenzymatic antioxidants, including uric acid (UA), total bilirubin (TBIL), and albumin (Alb), collectively contribute significantly to the antioxidant capacity of plasma.14 UA is a potent free radical scavenger. It can cross the blood-brain barrier or enter through the choroid plexus via active transport, directly neutralizing ROS in neural tissues and reducing oxidative damage.15,16 Alb not only binds to and inactivates free radicals but also inhibits the Fenton reaction by chelating transition metal ions (eg, copper, iron). In this way, it indirectly reduces the generation of lipid peroxidation products (eg, malondialdehyde, MDA) in cerebrospinal fluid.17,18 Notably, bilirubin plays a dual role in the central nervous system (CNS): at low concentrations, it enhances cellular antioxidant defenses by activating the nuclear factor erythroid 2-related factor 2 (Nrf2)/antioxidant response element (ARE) pathway. Due to its lipid-soluble nature, however, excessive accumulation in cerebrospinal fluid can induce neurotoxicity—given that the blood-brain barrier normally restricts bilirubin to trace levels.19,20 It also plays a significant role in the pathophysiological mechanisms underlying both MDD and BD.9
In recent years, the role of non-enzymatic antioxidants in psychiatric disorders has attracted considerable research attention, particularly in mood disorders such as MDD and BD.21 Evidence has shown that UA functions as an effective biomarker for the diagnosis of MDD,22 while TBIL exhibits auxiliary value in risk stratification and disease monitoring for schizophrenia and depression, with decreased serum levels indicating more severe symptoms and higher relapse risk.23 Alb has also been identified as a potential biomarker for severe neuropsychiatric conditions, including acute-phase schizophrenia and BD.24 Furthermore, the imbalance between OS and antioxidant systems plays a pivotal role in the pathophysiology of MDD and BD, a finding validated not only in adult patients25 but also supported by research in pediatric and adolescent depression populations.26 Although these studies have independently clarified the roles of UA, Alb, and TBIL in psychiatric disorders, existing evidence has not yet integrated these three routinely measurable antioxidant indicators from the perspective of the central pathological mechanism of OS. As a result, their synergistic patterns of alteration and clinical utility in MDD and BD remain to be further explored.
Currently, the clinical diagnosis of MDD and BD is based on the diagnostic criteria of the Diagnostic and Statistical Manual of Mental Disorders, 5th Edition (DSM-5) and the International Classification of Diseases, 10th Revision (ICD-10). The Structured Clinical Interview for DSM (SCID) is regarded as the gold standard, supplemented by scale assessments such as the Hamilton Depression Rating Scale-17 (HAMD-17), the Montgomery-Åsberg Depression Rating Scale (MADRS), and the Young Mania Rating Scale (YMRS).27 However, these tools rely on the clinician’s experience and have subjective biases. In addition, their early symptoms overlap, resulting in a lack of objective and quantitative differential methods. In terms of biomarkers, there are no approved specific indicators. Existing studies mainly focus on inflammatory factors (such as interleukin-6 (IL-6), interleukin-12 (IL-12), and tumor necrosis factor-α (TNF-α)), neurotransmitter metabolites, and OS indicators (such as MDA and superoxide dismutase (SOD)).28–32 All these indicators have problems including insufficient specificity, limited efficacy, or being only for auxiliary reference. They cannot meet the needs of accurate differentiation. Given that OS-antioxidant imbalance is abnormal in both diseases, serum non-enzymatic antioxidants (UA, Alb, TBIL) are convenient and quantifiable peripheral indicators. Their diagnostic value and mechanism of action have not yet been systematically explored.
The primary aim of this study was to characterize peripheral blood antioxidant profiles and assess OS levels in these patients. Specific objectives included identifying quantitative biomarkers for psychiatric disorders, providing evidence-based references for clinical therapeutic strategies, and laying a foundation for investigating the pathophysiological mechanisms underlying MDD and BD. Furthermore, differences in hospitalization duration among BD patients depressive episodes were analyzed according to their receipt of antidepressant combination therapy. Collectively, these findings yield valuable insights to guide clinical treatment decisions for the disorders.
Materials and Methods
Subjects
This study enrolled inpatients with a diagnosis of MDD or BD from the database of Hunan Provincial Brain Hospital, who were admitted between January and December 2023. Diagnoses of MDD and BD were strictly made in accordance with the ICD-10. For MDD patients, an additional requirement was a score of ≥24 on the HAMD-17 to confirm severe depressive episodes. Two senior psychiatrists (deputy chief physician or higher) from Hunan Provincial Brain Hospital conducted independent SCID to confirm diagnoses, thus ensuring the consistency and reliability of diagnostic assessments. For BD patients, episodes were further categorized into three subtypes: BD with major depressive episodes, BD with manic episodes (hereinafter referred to as BD manic episodes), and BD with mixed episodes (hereinafter referred to as BD mixed episodes). Notably, all BD patients included in this study were diagnosed with bipolar disorder type I (BD-I), as the majority of hospitalized BD patients in our clinical cohort were BD-I cases. The healthy controls (HC) consisted of employees from a state-owned public institution who underwent physical examinations at the hospital’s physical examination center. Exclusion criteria were as follows: ①Age < 16 years; ②Incomplete data; ③Presence of renal diseases (eg, chronic renal failure, nephritis, nephrotic syndrome), hepatic diseases, metabolic syndrome, cancers, allergic diseases, or autoimmune diseases; ④Use of medications that may affect immunity or the three non-enzymatic antioxidants of interest; ⑤Pregnancy or lactation; ⑥Patients with comorbid mental illnesses (eg, schizophrenia, autism spectrum disorder, etc).; ⑦ neurological diseases (eg, stroke, Alzheimer’s disease, Parkinson’s disease, etc).
Following rigorous screening, a total of 290 participants were enrolled. This cohort included 212 patients identified from an initial sample of 2376 hospitalized individuals: 72 with MDD, 140 with BD (54 in BD depressive episodes, 54 in BD manic episodes, and 33 in BD mixed episodes), as well as 78 HC separately recruited from the hospital’s physical examination records. In accordance with the STROBE Statement (Strengthening the Reporting of Observational Studies in Epidemiology), the sample size of retrospective studies is generally determined by the availability of data.33 To verify the statistical validity of the current sample size, we conducted a post-hoc power analysis. For comparative analyses among the three groups (MDD, BD, and HC), the post-hoc power analysis yielded statistical power values of >99.9%, 98.5%, and 78.2%, respectively. The current sample size generally meets the research requirements. Only the statistical power for TBIL was close to the critical threshold, but remained within an acceptable range. A modest expansion of the sample size may help to achieve more robust results in future studies. The patient screening process is summarized in Figure 2.
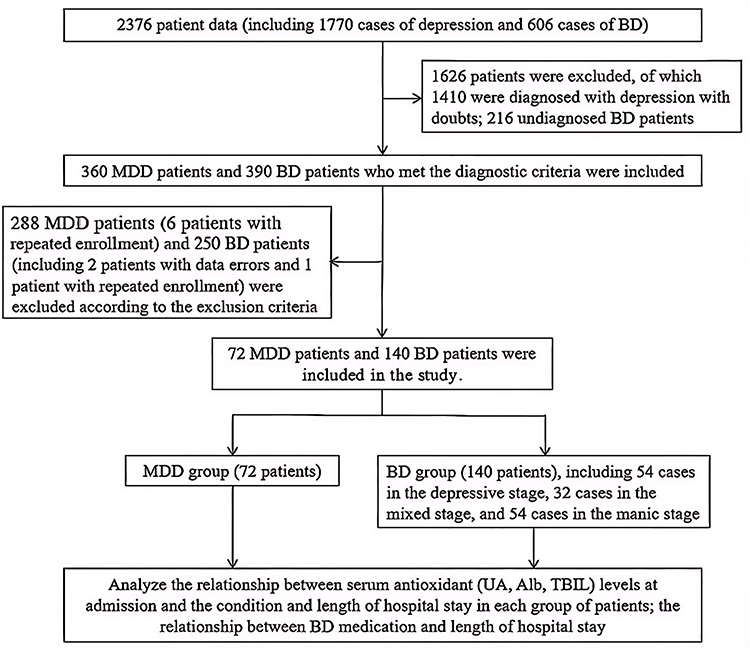 |
Figure 2 Flow diagram of the screening process. Notes: Undiagnosed BD refers to patients with symptoms of bipolar disorder and severe depression who have not been formally diagnosed, often due to atypical symptoms or incomplete evaluation. Doubtful MDD refers to patients diagnosed with major depressive disorder, but with comorbid conditions that make the diagnosis uncertain. |
Data Collection
Data collected included patients’ gender, age, body mass index (BMI), admission date, hospitalization duration, diagnosis, comorbidities, marital status, UA, Alb, TBIL, lipid profiles, glucose levels, and routine blood test results from their first admission. For patients with multiple admissions, data from the most recent admission were used.
All test data were derived from fasting blood samples collected from patients on the day of admission. UA, Alb, and TBIL were measured via standardized methods using the Siemens Advia 2400 fully automated biochemical analyzer (Siemens Healthineers, Erlangen, Germany) with original manufacturer-matched reagents. Specifically, UA was assayed by the uricase colorimetric method (Fossati method), Alb by the bromocresol green (BCG) dye-binding method, and TBIL by the vanadate oxidation method. Strict internal quality control (IQC) was implemented throughout the experiment with original quality control reagents from Bio-Rad (Hercules, CA, USA). Quality control tests were performed once before and after daily experimental runs. The analytical precision of all instruments and reagents was verified by the manufacturers, with an intra-assay coefficient of variation (CV) ≤ 2% and inter-assay CV ≤ 3.0%. All procedures complied with the Clinical Laboratory Improvement Amendments (CLIA’88) and the manufacturer’s operational specifications.
All procedures in this study were reviewed and approved to ensure compliance with relevant ethical requirements (Medical Ethics Committee of Hunan Provincial Brain Hospital, 2023K013). Additionally, the authors had no access to any identifying information of individual participants during or after data collection, thus ensuring participant privacy.
Variable Definitions
To ensure the clarity and reproducibility of the study results, the definitions of core variables used and the basis for grouping were standardized as follows:
Hospitalization duration: Defined as the time interval from admission for the current acute episode to discharge with improved clinical symptoms in study participants. This assessment was jointly completed by a three-level physician team consisting of chief physicians, attending physicians, and treating physicians. Participants were divided into two groups based on hospitalization duration: the ≤15 days group and the >15 days group. Rationale for the grouping cut-off value: The 15-day cut-off for distinguishing short-term and long-term hospitalization duration was determined by integrating the actual clinical hospitalization data of MDD and BD patients in Hunan Provincial Brain Hospital, referencing the conventional time course for the onset of efficacy in acute-phase treatment of psychiatric disorders (approximately 2 weeks), and drawing on previous research reports on the hospitalization duration in severe mental disorders.34
Diagnostic grouping (independent variable): Participants were categorized into the MDD group, the BD group, and the HC group. The BD group was further subdivided into BD depressive episodes, BD manic episodes, and BD mixed episodes.
Serum levels of non-enzymatic antioxidants (dependent variable): Defined as the measured levels of serum UA, Alb, and TBIL. Covariates: Age and gender.
Statistical Analysis
All statistical analyses were performed using SPSS 25.0 (SPSS Inc., Chicago, IL, USA) and GraphPad Prism 9.5 software (GraphPad Software, San Diego, CA, USA). A two-tailed P < 0.05 was considered statistically significant. Continuous variables were tested for normality and homogeneity of variance; normally distributed data were presented as mean ± standard deviation (SD) or standard error of the mean (SEM), and non-normally distributed data were analyzed using nonparametric tests including the Mann–Whitney U-test and Kruskal–Wallis H-test. Categorical variables were compared using the χ2-test.
Comparisons among MDD, BD, and HC groups were performed using analysis of covariance (ANCOVA) adjusted for age and sex, followed by least significant difference (LSD) post-hoc tests with Benjamini–Hochberg false discovery rate (FDR) correction. One-way analysis of variance (ANOVA) was used for comparisons among BD episode subgroups. Independent samples t-tests were used for two-group comparisons of normally distributed data. Correlations between antioxidant levels and hospitalization duration were analyzed using Spearman’s rank correlation coefficient.
Binary logistic regression analysis was used to identify independent risk factors for MDD and BD. Receiver operating characteristic (ROC) curves were generated to evaluate the diagnostic value of UA, Alb, TBIL, and their combined model. All graphs were visualized using GraphPad Prism 9.5.
Results
Comparison of Information on Demographic and Clinical Characteristics of the Study Population
This study enrolled 290 participants, including 212 patients meeting the diagnostic criteria (72 with MDD, 140 with BD) and 78 HC. All demographic and clinical characteristics associated with study outcomes are summarized in Table 1. Data showed that female patients outnumbered male patients in both the MDD and BD groups, with a significantly higher proportion of females in the MDD group (P = 0.021). Patients in the BD group were younger (more than 60% were aged < 30 years), and the disease course of BD patients was numerically longer than that of MDD patients, though the difference was not statistically significant (P = 0.960). Married patients were more common in the MDD group, whereas unmarried patients were more prevalent in the BD group. Patients in the MDD group exhibited a higher tendency toward suicidal ideation compared with those in the BD group (P = 0.007). The hospitalization duration was significantly longer in the BD group than in the MDD group (P = 0.039). No significant intergroup differences were observed in BMI, lipid profiles, or blood glucose levels among the MDD, BD, and HC groups.
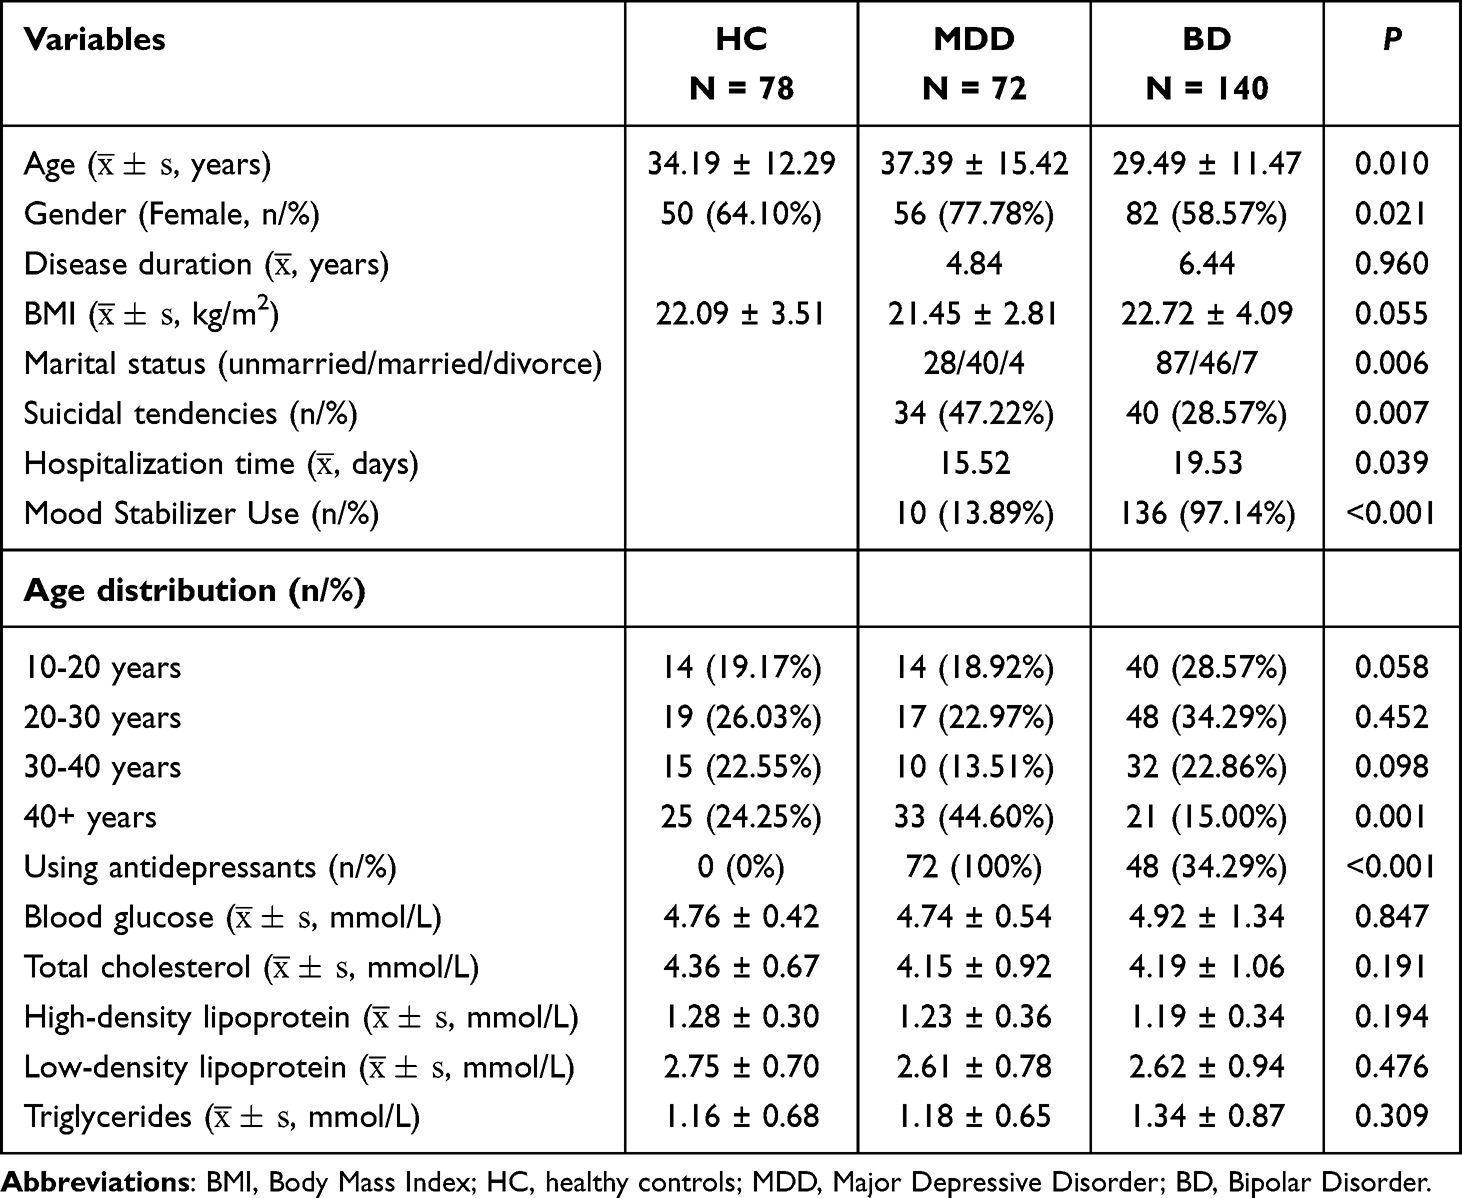 |
Table 1 Demographic and Clinical Characteristics of Study Population |
MDD, BD, and HC Serum UA, Alb, and TBIL Levels
Since there were significant differences in age and sex distribution among the MDD, BD, and HC groups, ANCOVA was used to adjust for the confounding effects of age and sex on serum UA, Alb, and TBIL levels, with pairwise comparisons between groups performed using the LSD method and FDR correction via the Benjamini–Hochberg method. The results showed that: UA, TBIL, and Alb levels were significantly lower in the MDD group than in the HC group (P = 0.022, P < 0.0001, P < 0.0001), and UA and Alb levels were also significantly lower in the MDD group than in the BD group (P < 0.0001, P < 0.001), whereas the difference in TBIL levels between the two groups was not significant; Alb and TBIL levels were significantly lower in the BD group than in the HC group (P < 0.0001, P = 0.004), but UA levels were significantly higher (P = 0.006). These results are presented in Table 2 and Figure 3A–C. Additionally, the UA/Alb ratio and UA/TBIL ratio were significantly higher in the BD group than in the HC group (both P < 0.0001), and the UA/Alb ratio was also significantly higher in the BD group than in the MDD group (P = 0.0004), with relevant data shown in Figure 3D–F.
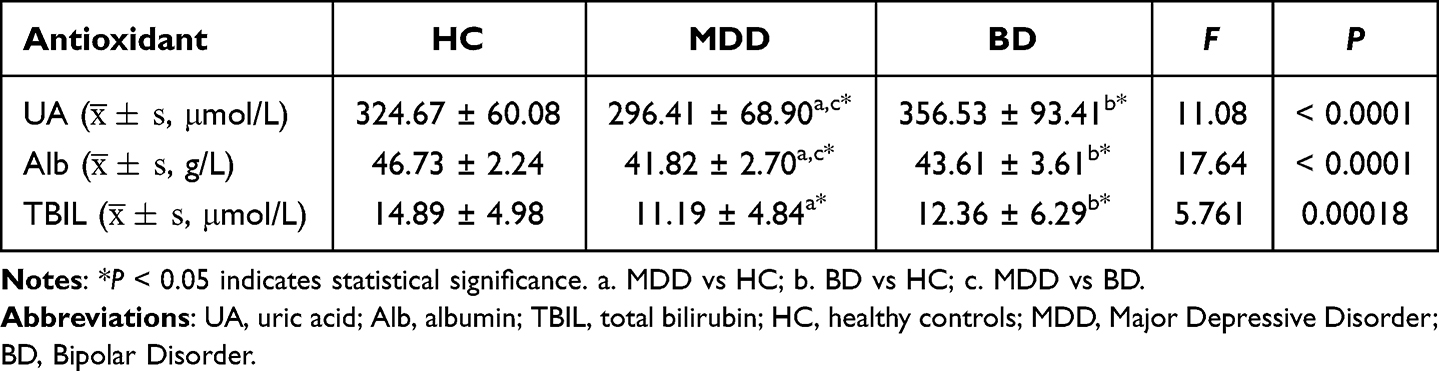 |
Table 2 SUA, TBIL, and Alb Levels in MDD, BD, and HC (ANCOVA Adjusted for Age and Sex) |
 |
Figure 3 Serum Antioxidant Levels in BD, MDD and HC: (A) UA levels; (B) Alb levels; (C) TBIL levels; (D) TBIL/Alb ratio; (E) UA/Alb ratio; (F) UA/TBIL ratio. Abbreviations: UA, uric acid; Alb, albumin; TBIL, total bilirubin; HC, healthy controls; MDD, major depressive disorder; BD, bipolar disorder. Notes: Error bars represent the standard error of the mean (SEM). Group differences were analyzed using ANCOVA (adjusted for age and sex) followed by LSD post-hoc tests with Benjamini–Hochberg false discovery rate (FDR) correction (*P<0.05; ****P<0.0001). |
UA, Alb, and TBIL Levels Across Different Episodes of BD
One-way ANOVA was used to compare the three serum antioxidant levels among different BD episode subtypes, with LSD pairwise comparisons and FDR correction by the Benjamini–Hochberg method. The results showed no significant differences in the three antioxidant levels between BD depressive episodes and BD mixed episodes, whereas levels in the BD depressive episodes were significantly lower than those in BD manic episode (all adjusted P < 0.05), as detailed in Table 3 and Figure 4.
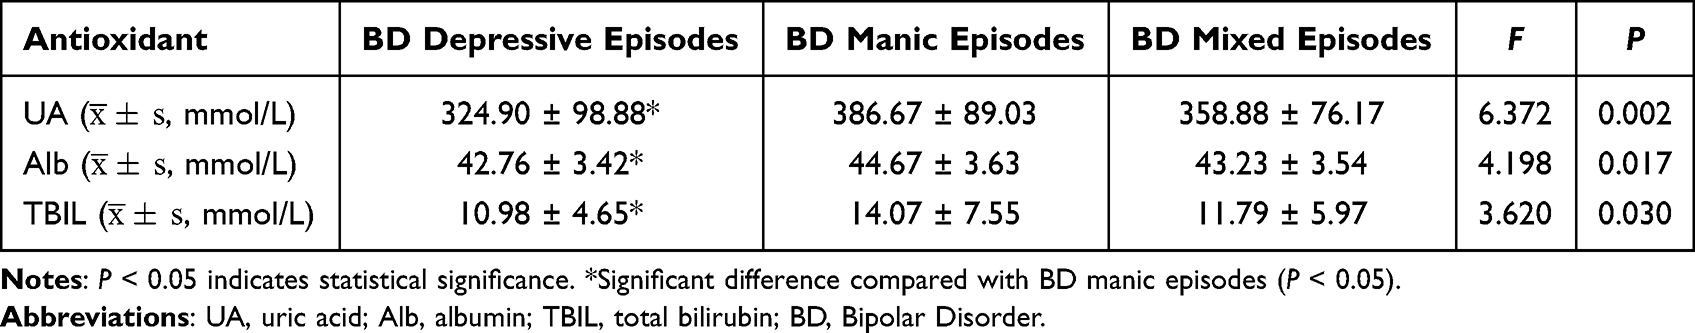 |
Table 3 Serum UA, TBIL, and Alb Levels Across Different Episodes of BD |
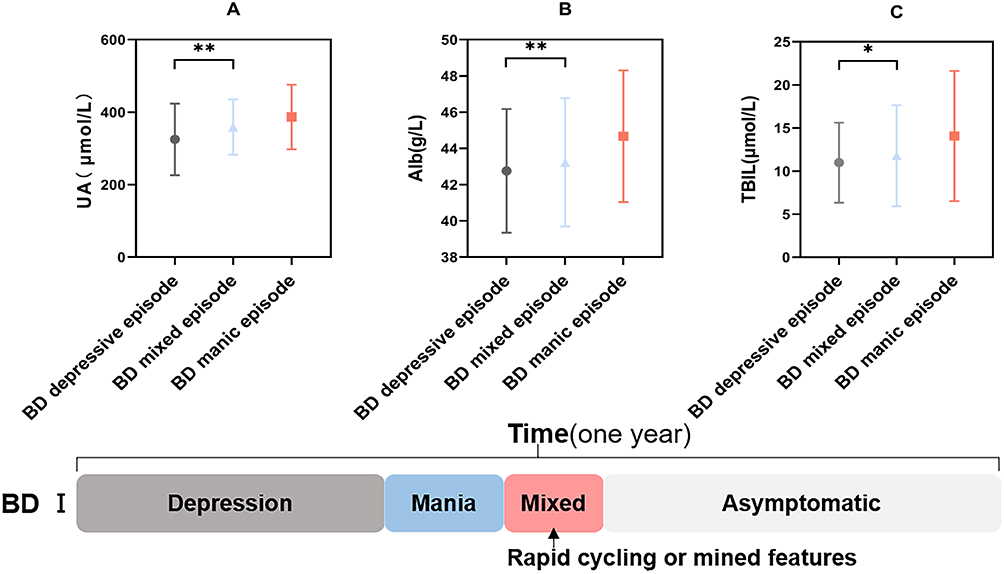 |
Figure 4 Three antioxidant levels in BD patients at different episodes: (A) UA levels. (B) Alb levels. (C) TBIL levels. Abbreviations: UA, uric acid; Alb, albumin; TBIL, total bilirubin; BD, Bipolar Disorder. Notes: Error bars represent the standard error of the mean (SEM). Group differences were analyzed using One-way ANOVA followed by LSD post-hoc tests with Benjamini–Hochberg false discovery rate (FDR) correction (*P<0.05; **P<0.01). |
UA, Alb, and TBIL Levels in MDD and BD Patients with Different Hospitalization Duration
An independent t-test revealed significantly higher UA levels in MDD patients with hospitalization duration ≤15 days than those with >15 days (P = 0.039) (see Table 4 and Figure 5A). No significant differences in TBIL and Alb levels were observed between the two groups (see Table 4 and Figure 5B–C).
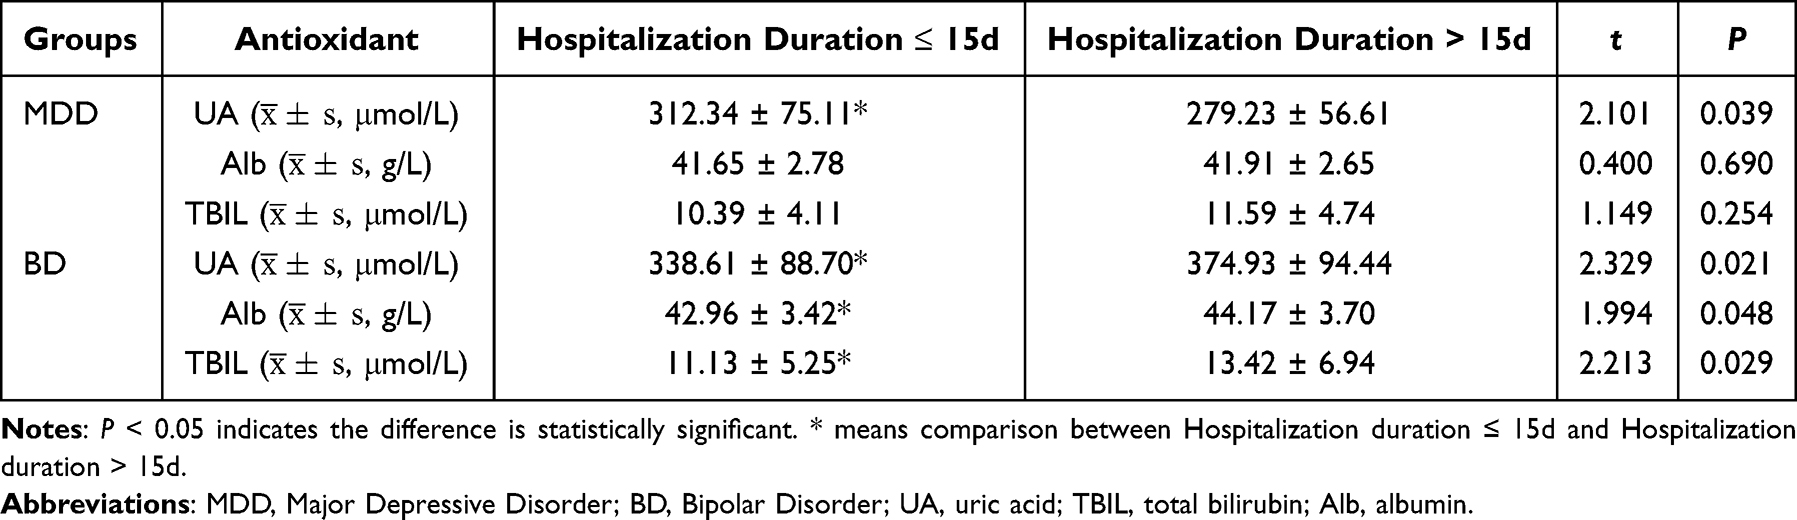 |
Table 4 Serum Antioxidant Levels in MDD and BD Patients Stratified by Hospitalization Duration |
 |
Figure 5 Non-enzymatic antioxidant levels in MDD and BD patients stratified by hospitalization duration: (A) UA levels in MDD patients; (B) Alb levels in MDD patients; (C) TBIL levels in MDD patients; (D) UA levels in BD patients; (E) Alb levels in BD patients; (F) TBIL levels in BD patients; (G) Correlation between UA levels and hospitalization duration in MDD patients; (H) Correlation between UA levels and hospitalization duration in BD patients. Abbreviations: UA, uric acid; Alb, albumin; TBIL, total bilirubin; MDD, Major Depressive Disorder; BD, Bipolar Disorder. Notes: Blue indicates hospitalization duration≤15 days; red indicates hospitalization duration>15 days. Violin plots illustrate the mean and data distribution. Group comparisons (A–F) t-test. Correlation analyses (G and H) Spearman’s rank correlation coefficient (*P < 0.05). |
UA, Alb, and TBIL levels were significantly lower in BD patients with hospitalization duration ≤15 days than those with >15 days (P < 0.05) (see Table 4 and Figure 5D–F). A negative correlation was observed between UA levels and hospitalization duration in MDD patients (r = −0.28) (see Figure 5G), whereas a positive correlation was found in BD patients (r = 0.189) (see Figure 5H).
Relationship Between Use/Non-Use of Antidepressants and Hospitalization Duration in BD Depressive Episodes
One-way ANOVA with LSD post-hoc testing was used to compare serum UA, Alb, and TBIL levels among HC and BD depressive episode patients stratified by antidepressant use (Figure 6A–C). Independent samples t-tests were applied to assess differences in these antioxidant levels between the two BD subgroups, as well as differences in hospitalization duration between antidepressant users and non-users (Table 5 and Figure 6D). At admission, UA, Alb, and TBIL levels did not differ significantly between antidepressant users and non-users. Both BD subgroups exhibited significantly lower Alb and TBIL levels compared with HC (P < 0.0001 for both), while UA levels were comparable between BD subgroups and HC. Antidepressant users had a significantly longer hospitalization duration than non-users (P < 0.0001).
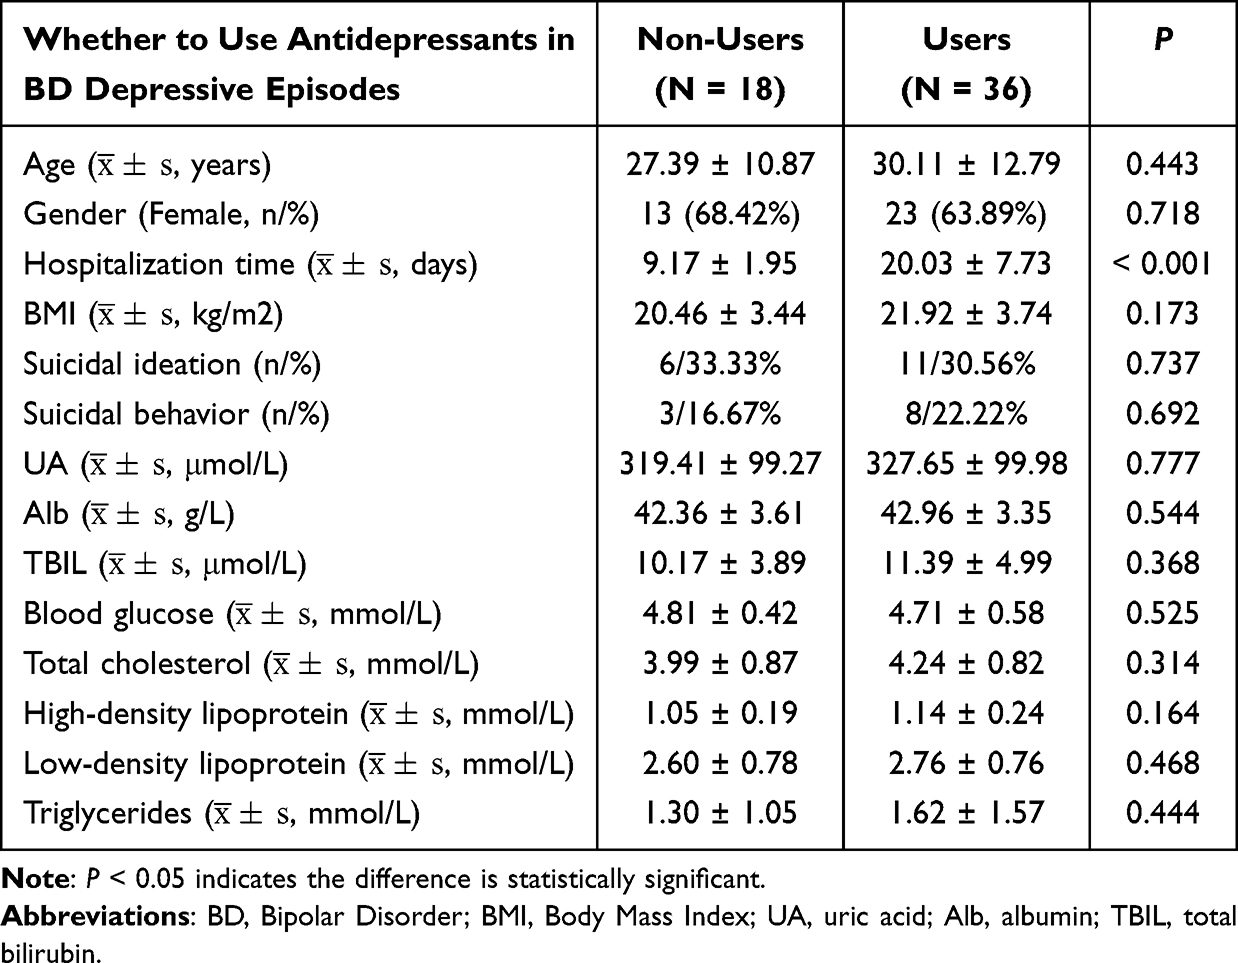 |
Table 5 Baseline Clinical Characteristics of BD Depressive Episodes Patients: Antidepressant Users vs Non-Users |
 |
Figure 6 Serum UA, Alb, TBIL, and Hospitalization duration in BD depressive episodes (antidepressant Use/Not Using) vs HC: (A) UA levels; (B) Alb levels; (C) TBIL levels; (D) Hospitalization duration. Abbreviations: UA, uric acid; Alb, albumin; TBIL, total bilirubin; HC, healthy controls; BD, Bipolar Disorder. Notes: Error bars represent the standard error of the mean (SEM). Group differences (A–C): One-way ANOVA + LSD post-hoc test (Benjamini–Hochberg FDR correction); Group differences (D): independent samples t-test. ****P < 0.0001; ***P < 0.001; **P < 0.01; ns: not significant. |
Diagnostic Efficacy of Alb, TBIL and UA Levels in MDD and BD
The Area Under Curve (AUC) of ROC for diagnosing MDD using Alb, TBIL, and UA levels was 0.900, 0.732, and 0.621, respectively. The AUC for the combined diagnosis using all three biomarkers was 0.919, with cutoff values of 327.85 μmol/L for UA, 17.285 μmol/L for TBIL, and 44.7 g/L for Alb. These cutoff values corresponded to a sensitivity of 75.6% and a specificity of 90.0% for diagnosing MDD, as presented in Figure 7A.
 |
Figure 7 ROC curves of antioxidant markers for the diagnosis of MDD and BD: (A) ROC curves for MDD diagnosis; (B) ROC curves for BD diagnosis. Abbreviations: UA, uric acid; Alb, albumin; TBIL, total bilirubin; MDD, major depressive disorder; BD, bipolar disorder. Notes: Combined diagnosis refers to the integrated model of UA, Alb, and TBIL. The yellow line represents the reference line (AUC=0.5). |
The AUC of Alb, TBIL, and UA levels for diagnosing BD was 0.769, 0.677, and 0.610, respectively. The AUC for the combined diagnosis using all three biomarkers was 0.842, with cutoff values of 302 μmol/L for UA, 7.9 μmol/L for TBIL, and 43.6 g/L for Alb. These cutoff values corresponded to a sensitivity of 67.9% and a specificity of 89.7% for diagnosing BD, as presented in Figure 7B.
Logistic Regression Analysis of Factors Influencing the Development of MDD and BD
Binary logistic regression analysis was performed with MDD as the dependent variable and age, gender, UA, Alb, and TBIL as independent variables; Alb was identified as an independent risk factor for MDD (see Table 6). For BD, the same regression model was used with age, gender, UA, Alb, and TBIL as independent variables, revealing UA and Alb as significant influencing factors, with TBIL potentially also exerting an effect (see Table 6).
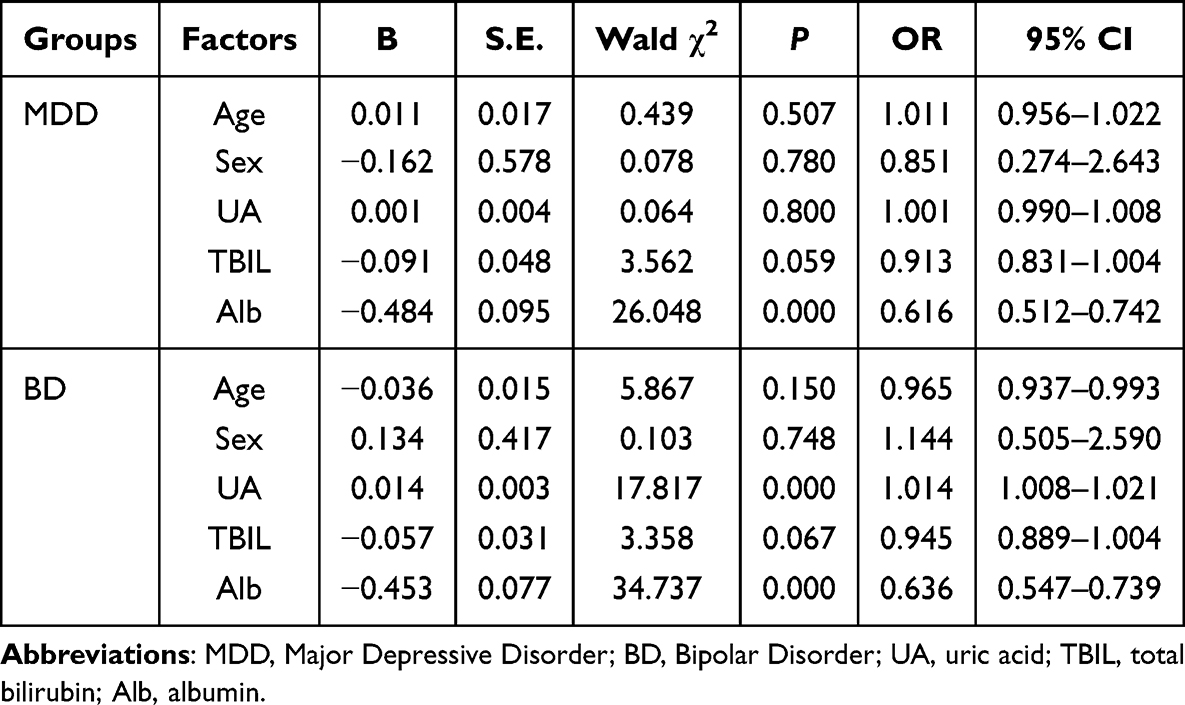 |
Table 6 Logistic Regression Analysis of Factors Associated with MDD and BD Development |
Discussion
Results demonstrated that although significant differences in age and gender existed among the MDD, BD, and HC groups, the potential confounding effects were effectively controlled by ANCOVA. Serum levels of UA, TBIL, and Alb were significantly abnormal in both BD and MDD patients. Compared with HC, MDD patients presented significantly decreased UA, TBIL, and Alb levels, and BD patients also differed significantly in these parameters. As key endogenous non-enzymatic antioxidants contributing to plasma antioxidant capacity, UA, TBIL, and Alb are closely implicated in the regulation of OS. These findings indicate that OS is a common and important pathological feature in MDD and BD.
As the end product of the purinergic system, UA scavenges ROS and reactive nitrogen species (RNS), and inhibits lipid peroxidation of erythrocyte membranes through its reaction with superoxide anions.35 Studies have reported that the purinergic system is involved in the pathophysiology of mental disorders, with roles in regulating cell proliferation, neuronal differentiation, and glial cell-mediated inflammation.36,37 Alb reduces ROS production by chelating transition metals.38 Oxidized Alb can be cleared from the circulation and degraded, and its levels serve as a biomarker of oxidative damage.39 Alb plays a critical role in inflammation and immune regulation, and has been implicated in the pathogenesis of mental disorders.40 The redox activity of bilirubin is particularly critical in the brain, where it acts to prevent excitotoxicity and neuronal death through the scavenging of superoxide anions (O2−) during N-methyl-D-aspartate receptor (NMDA) neurotransmission.41 Abnormalities in TBIL levels have also been observed in mental disorders.42,43 The depletion of these three antioxidants in the present study indirectly underscores the critical role of OS imbalance in both MDD and BD. Additionally, existing evidence has demonstrated that lower UA levels are associated with an increased likelihood of MDD.44 The present findings are consistent with those of several previous investigations.22,45 In the BD group, TBIL and Alb levels were decreased, though the reduction was less pronounced than in MDD patients. By contrast, UA levels were increased in the BD group, which was completely opposite to the pattern in MDD patients. As noted in the preceding analysis, decreases in TBIL and Alb are associated with potential antioxidant depletion. However, the elevation in UA observed in BD patients requires further scrutiny. Some studies have shown that allopurinol reduces UA levels in BD patients and alleviates BD patients’ symptoms to some extent, with elevated UA levels appearing to be linked to the pathogenesis of BD.46
In the present study, logistic regression and ROC curve analyses were conducted in MDD and BD patients using UA, Alb, and TBIL, yielding notable findings. In the MDD group, Alb was identified as an independent risk factor, with greater diagnostic efficacy than UA and TBIL. These results indicate that Alb has a significant role in the diagnosis of MDD, with potential as a more effective biomarker. However, considering the differing performance of UA in the MDD and BD groups, it remains a clinically relevant marker. Recent studies have also indicated that both Alb and UA could act as potential biomarkers for MDD.47 In the BD group, UA and Alb have emerged as key influencing factors, while the role of TBIL requires further validation. Notably, hemolysis in blood samples triggers the release of hemoglobin and its metabolites, potentially inducing spurious elevation of TBIL values and confounding assay outcomes. Consequently, stringent monitoring of specimen quality is imperative, as it may constitute a critical factor underlying the variability in TBIL results. Moreover, ROC curve analysis indicated that UA, Alb, and TBIL exerted a certain degree of diagnostic efficacy for MDD and BD. The cutoff values of these three biomarkers overlap to some extent with the normal reference range, which places certain restrictions on their clinical use. However, clinical applicability can be greatly enhanced through the establishment of unique reference intervals for MDD and BD patients, or through the combination of these three indicators with other clinical parameters to construct a diagnostic model. Future multi-center, large-sample studies focusing on the specific reference ranges of UA, Alb, and TBIL in MDD and BD patients can deepen the understanding of the disease’s pathophysiology. Such studies may also lay a foundation for developing more effective diagnostic tools, optimizing clinical treatment pathways, and ultimately supporting more accurate diagnosis and management of MDD and BD.
When comparing UA, TBIL, and Alb levels across different BD episodes, these biomarkers were found to be lowest during BD depressive episodes. However, even in this episode, UA and Alb levels remained higher than those observed in MDD patients, with UA showing a particularly significant difference. These findings align with prior studies,48–51 with UA showing potential as a clinical biomarker for BD. Furthermore, these findings point to UA levels having potential to distinguish between BD depressive episodes and BD manic episodes. Similarly, literature notes that elevated UA levels during BD depressive episodes may signal an impending transition to BD manic episodes.22,52 In light of this, abnormal purine metabolism and OS are hypothesized to be key in the pathogenesis of BD. The purine signaling system represents a vital biological axis in mood disorders, influencing the pathophysiology of mental disorders by regulating processes such as cell proliferation, neuronal differentiation, and neuroglial inflammation.53 UA, the end product of purine metabolism, acts as an indirect marker of purine metabolic activity. An elevated UA level, with dietary factors excluded, is associated with accelerated purine catabolism. Elevated UA in BD is hypothesized to be linked to enhanced purine metabolism associated with the condition, with potential to distinguish it from MDD.54 Studies have shown that elevated UA levels are associated with increased mitochondrial ROS production, which is linked to the activation of NOD-like receptor family pyrin domain-containing 3 (NLRP3) inflammasomes. This is accompanied by immune response initiation, cytokine release,55 and activation of immune and neuroglial cells, with subsequent neurological and systemic inflammatory responses.56 In addition to OS, BD patients may exhibit a more severe inflammatory response than MDD patients. Could this inflammation be linked to purine metabolism? This question warrants further investigation in subsequent research.
In this study, we found that UA levels in MDD patients were negatively correlated with hospitalization duration. Patients hospitalization duration of > 15 days had significantly lower UA levels than those hospitalization duration of ≤ 15 days. Lower UA levels are linked to prolonged hospitalization, with this association potentially reflecting more severe OS and an impaired ability to counteract it. Previous studies have demonstrated that UA levels correlate with the severity of MDD,22 with lower levels observed in patients who are more depressed or suicidal.57 Although hospitalization duration is influenced by multiple factors, all patients in this study were discharged from tertiary hospitals in China only after being evaluated as stable by three levels of physicians (chief physician, attending physician, and bedside doctor). This multi-level assessment minimized subjective biases in determining hospitalization duration. Thus, low UA levels are associated with MDD severity, holding potential for providing valuable clinical insights. Specifically, low UA in MDD patients could indicate greater severity, with such levels potentially indicating a tendency toward longer hospitalization. This raises a critical question regarding whether increasing UA levels could shorten hospitalization and improve treatment efficacy. This hypothesis merits further investigation. In BD, by contrast, patients with a hospitalization duration exceeding 15 days exhibited higher levels of all three antioxidants (UA, Alb, TBIL) than those with a duration of ≤15 days. This pattern is potentially linked to the impact of persistent stress or other key pathogenic factors beyond OS in BD patients. Additionally, UA levels are higher in BD patients compared to both HC and MDD. This pattern points to the possibility that,58 beyond OS imbalance, other factors are involved in the pathogenesis of BD, a topic that warrants further investigation.
Additionally, 48 out of 140 BD patients (34.29%) used antidepressants. Among them, 36 were in BD depressive episodes receiving antidepressant treatment, and the remaining 12 were in BD mixed episodes. Unexpectedly, the analysis identified a significant difference in hospitalization duration between BD patients who used antidepressants and those who did not: antidepressant use correlated with poorer treatment efficacy and longer hospitalization duration. This finding holds importance for BD treatment, underscoring the need for accurate differential diagnosis between MDD and BD, along with the urgent need to identify quantitative diagnostic biomarkers.
This study has several limitations owing to its retrospective design. First, although all enrolled patients had normal BMI, the influence of dietary factors on UA levels could not be strictly controlled, and a prospective study with controlled dietary factors would be beneficial. Second, due to the objective limitations of clinical medical records in the retrospective analysis, complete data on the number of episodes could not be obtained for all patients; thus, no stratified analysis between first-episode and recurrent patients was performed, and disease course may represent a potential confounding factor. Furthermore, the sample size was restricted by the availability of original data owing to the retrospective design, but post-hoc power analysis confirmed that the sample size was generally sufficient for the main statistical analyses. Multicenter prospective studies with larger sample sizes will be conducted in the future to further improve the statistical power of subgroup analyses.
Furthermore, the retrospective design precluded analysis of the relationships between study indicators and dynamic changes in patients’ clinical status, and follow-up data on disease progression were unavailable. Some patients initially diagnosed with MDD may later develop manic symptoms, leading to a revised diagnosis of BD; such diagnostic delays are common until hypomanic or manic episodes manifest. A post-discharge follow-up study is therefore warranted. Moreover, most hospitalized BD patients in this study were BD-I, whereas the sample size of bipolar disorder type II (BD-II) patients was insufficient for further analysis. This limits the generalizability of the findings across BD subtypes.
Finally, no significant differences were observed among patient groups according to medication use. Given the lack of detailed drug stratification, further research is required to determine whether different medications influence various antioxidant parameters.
Conclusion
In summary, this study compared similarities and differences between MDD and BD patients by analyzing serum levels of antioxidant indicators including UA, TBIL, and Alb from the perspective of OS. The results suggested that BD may present independent pathogenesis distinct from MDD, beyond OS-related pathways. By examining laboratory biomarkers and clinical characteristics, potential quantitative indicators for clinical diagnosis, differential diagnosis, and prognostic evaluation of MDD and BD were identified. Notably, appropriate use of antidepressants during BD depressive episode contributed to better disease control and clinical outcomes. These findings provide a reference for precise clinical therapeutic strategies for BD and important clues for subsequent mechanistic research. This study proposes a key hypothesis requiring further validation: decreased levels of antioxidant indicators in MDD may be associated with the degree of OS. In addition, OS levels are correlated with disease severity, suggesting that targeted regulation of antioxidant status may represent a potential therapeutic strategy for alleviating depressive symptoms (Figure 8).
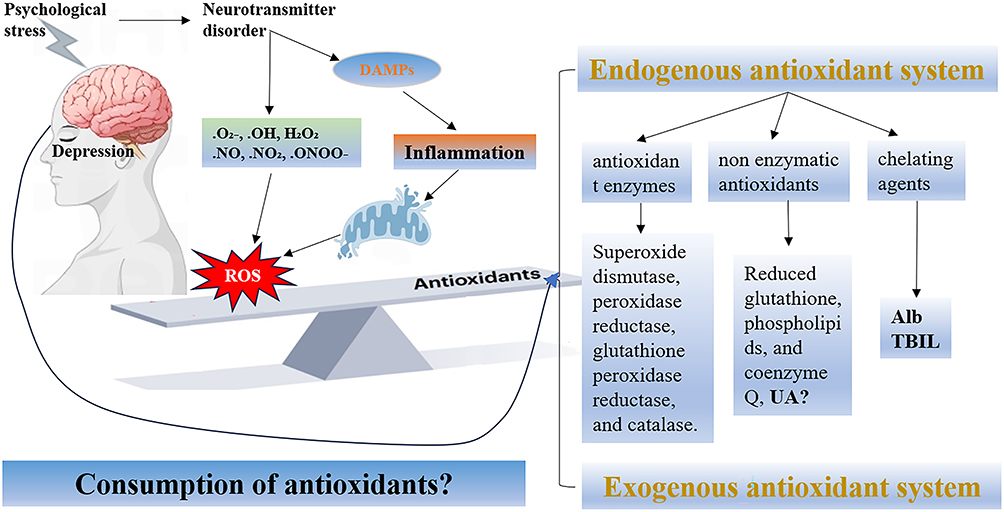 |
Figure 8 Oxidative stress and antioxidant system in depression. Abbreviations: UA: uric acid; Alb: albumin; TBIL: total bilirubin; DAMPs: Damage-Associated Molecular Patterns; ROS: Reactive Oxygen Species. |
Data Sharing Statement
Data are available with the primary author (J.J.). Interested scholars may request data for scholarly purposes. Genuine requests will be accepted favorably. However, the primary author (J.J.) reserves the right to deny the request.
Ethics Approval and Informed Consent
The study was conducted in accordance with the Declaration of Helsinki, and approved and approved by the Medical Ethics Committee of The Second People’s Hospital of Hunan Province (2023K013). Patient consent was waived due to REASON (the authors lacked access to participants’ identifying information (before/after data collection), which protected privacy and rendered consent unnecessary).
Consent for Publication
All authors have read and approved the final version of the Article, including text, data, figures, tables.
Acknowledgments
We would like to express our sincere gratitude to [2023 National Clinical Key Specialized Major Scientific Research Project] for their financial support of this research under Grant number[Z2023101]. Meanwhile, I would like to thank all the teachers of the Second People’s Hospital of Hunan Province for their help and support. In addition, Figure 1 was created using the website www.figdraw.com for drawing.
Author Contributions
All authors have made significant contributions to this study; participated in drafting, revising or critically reviewing the article; agreed on the journal to which the article has been submitted; reviewed and approved all versions of the article; gave final approval of the version to be published; and are accountable for all aspects of the work. The specific contributions are as follows:
Biqiong Ren (Corresponding Author): Led the study design, coordinated experimental implementation, was responsible for data analysis and interpretation, and took the lead in manuscript review and revision.
Jiangjing Dai (First Author): Independently completed data collection, systematically conducted data analysis and collation, and was responsible for drafting the original manuscript.
Qingling Li: Participated in and completed part of the data collation work.
Funding
This research was funded by 2023 National Clinical Key Specialized Major Scientific Research Project, grant number Z2023101.
Disclosure
The authors report no conflicts of interest in this work.
References
1. GBD 2017 Disease and Injury Incidence and Prevalence Collaborators. Global, regional, and national incidence, prevalence, and years lived with disability for 354 diseases and injuries for 195 countries and territories, 1990-2017: a systematic analysis for the Global Burden of Disease Study 2017. Lancet. 2018;392(10159):1789–17. doi:10.1016/S0140-6736(18)32279-7
2. Geddes JR, Miklowitz DJ. Treatment of bipolar disorder. Lancet. 2013;381(9878):1672–1682. doi:10.1016/S0140-6736(13)60857-0
3. Yatham LN, Kennedy SH, Parikh SV, et al. Canadian network for mood and anxiety treatments (CANMAT) and international society for bipolar disorders (ISBD) 2018 guidelines for the management of patients with bipolar disorder. Bipolar Disord. 2018;20(2):97–170. doi:10.1111/bdi.12609
4. Baldessarini RJ, Vázquez GH, Tondo L. Bipolar depression: a major unsolved challenge. Int J Bipolar Disord. 2020;8(1):1. doi:10.1186/s40345-019-0160-1
5. Gitlin MJ. Antidepressants in bipolar depression: an enduring controversy. Focus. 2019;17(3):278–283. doi:10.1176/appi.focus.17306
6. Hiller JK, Jangmo A, Tesli MS, et al. Lipid biomarker research in bipolar disorder: a scoping review of trends, challenges, and future directions. Biol Psychiatry Glob Open Sci. 2023;3(4):594–604. doi:10.1016/j.bpsgos.2023.07.004
7. Irshad M, Chaudhuri PS. Oxidant-antioxidant system: role and significance in human body. Indian J Exp Biol. 2002;40(11):1233–1239.
8. Feng S, Gong Y, Xia L, et al. Calcium hexacyanoferrate (III) nanocatalyst enables redox homeostasis for autism spectrum disorder treatment. Adv Mater. 2024;36(39):e2405655. doi:10.1002/adma.202405655
9. Lu Z, Pu C, Zhang Y, et al. Oxidative stress and psychiatric disorders: evidence from the bidirectional mendelian randomization study. Antioxidants. 2022;11(7):1386. doi:10.3390/antiox11071386
10. Halliwell B. Understanding mechanisms of antioxidant action in health and disease. Nat Rev Mol Cell Biol. 2024;25(1):13–33. doi:10.1038/s41580-023-00645-4
11. Schieber M, Chandel NS. ROS function in redox signaling and oxidative stress. Curr Biol. 2014;24(10):R453–462. doi:10.1016/j.cub.2014.03.034
12. Ottaviano FG, Handy DE, Loscalzo J. Redox regulation in the extracellular environment. Circ J. 2008;72(1):1–16. doi:10.1253/circj.72.1
13. Salim S. Oxidative Stress and the Central Nervous System. J Pharmacol Exp Ther. 2017;360(1):201–205. doi:10.1124/jpet.116.237503
14. Maxwell SR, Dietrich T, Chapple ILC. Prediction of serum total antioxidant activity from the concentration of individual serum antioxidants. Clin Chim Acta. 2006;372(1–2):188–194. doi:10.1016/j.cca.2006.04.015
15. Bowman GL, Shannon J, Frei B, Kaye JA, Quinn JF. Uric acid as a CNS antioxidant. J Alzheimers Dis. 2010;19(4):1331–1336. doi:10.3233/JAD-2010-1330
16. Xu L, Li C, Wan T, et al. Targeting uric acid: a promising intervention against oxidative stress and neuroinflammation in neurodegenerative diseases. Cell Commun Signal. 2025;23(1):4. doi:10.1186/s12964-024-01965-4
17. Deng S, Liu S, Jin P, et al. Albumin reduces oxidative stress and neuronal apoptosis via the ERK/Nrf2/HO-1 pathway after intracerebral hemorrhage in rats. Oxid Med Cell Longev. 2021;2021:8891373. doi:10.1155/2021/8891373
18. Kamalinia G, Khodagholi F, Shaerzadeh F, et al. Cationic albumin-conjugated chelating agent as a novel brain drug delivery system in neurodegeneration. Chem Biol Drug Des. 2015;86(5):1203–1214. doi:10.1111/cbdd.12586
19. Qaisiya M, Coda Zabetta CD, Bellarosa C, Tiribelli C. Bilirubin mediated oxidative stress involves antioxidant response activation via Nrf2 pathway. Cell Signal. 2014;26(3):512–520. doi:10.1016/j.cellsig.2013.11.029
20. Ficiarà E, Rabbito R, Roveta F, et al. Iron overload, microbleeding and the role of bilirubin in alzheimer’s disease brain: revisiting the vascular hypothesis. Int J Mol Sci. 2025;26(7):3060. doi:10.3390/ijms26073060
21. Gong Y, Lu Z, Kang Z, et al. Peripheral non-enzymatic antioxidants as biomarkers for mood disorders: evidence from a machine learning prediction model. Front Psychiatry. 2022;13:1019618. doi:10.3389/fpsyt.2022.1019618
22. Meng X, Huang X, Deng W, et al. Serum uric acid a depression biomarker. PLoS One. 2020;15(3):e0229626. doi:10.1371/journal.pone.0229626
23. Yin X, Jia Q, Zhang G, et al. Association between decreased serum TBIL concentration and immediate memory impairment in schizophrenia patients. Sci Rep. 2019;9(1):1622. doi:10.1038/s41598-018-38227-6
24. Xu H, Zheng L, Wang L, Gao H, Wei Y, Chen J. Albumin and associated biomarkers in severe neuropsychiatric disorders: acute-phase schizophrenia and bipolar disorder. Neuropsychiatr Dis Treat. 2023;19:2027–2037. doi:10.2147/NDT.S423399
25. Jiménez-Fernández S, Gurpegui M, Garrote-Rojas D, et al. Oxidative stress parameters and antioxidants in adults with unipolar or bipolar depression versus healthy controls: systematic review and meta-analysis. J Affect Disord. 2022;314:211–221. doi:10.1016/j.jad.2022.07.015
26. Munkholm K, Mäkinen IJO, Maigaard K, et al. Inflammatory and oxidative stress biomarkers in children and adolescents with bipolar disorder-A systematic review and meta-analysis. Neurosci Biobehav Rev. 2024;163:105766. doi:10.1016/j.neubiorev.2024.105766
27. Xiao N, Yin L, Lee S, et al. The efficacy of pharmacological interventions in the treatment of major depressive disorder and bipolar depression with mixed features: a systematic review. Int J Neuropsychopharmacol. 2023;26(3):189–203. doi:10.1093/ijnp/pyac079
28. Osimo EF, Pillinger T, Rodriguez IM, Khandaker GM, Pariante CM, Howes OD. Inflammatory markers in depression: a meta-analysis of mean differences and variability in 5166 patients and 5083 controls. Brain Behav Immun. 2020;87:901–909. doi:10.1016/j.bbi.2020.02.010
29. Sarmin N, Roknuzzaman ASM, Mouree TZ, Islam MR, Al Mahmud Z. Evaluation of serum interleukin-12 and interleukin-4 as potential biomarkers for the diagnosis of major depressive disorder. Sci Rep. 2024;14(1):1652. doi:10.1038/s41598-024-51932-9
30. Lopresti AL, Maker GL, Hood SD, Drummond PD. A review of peripheral biomarkers in major depression: the potential of inflammatory and oxidative stress biomarkers. Prog Neuropsychopharmacol Biol Psychiatry. 2014;48:102–111. doi:10.1016/j.pnpbp.2013.09.017
31. Alvarez-Mon MA, Ortega MA, García-Montero C, et al. Differential malondialdehyde (MDA) detection in plasma samples of patients with major depressive disorder (MDD): a potential biomarker. J Int Med Res. 2022;50(5):3000605221094995. doi:10.1177/03000605221094995
32. Pan J, Xia J, Deng F, et al. Diagnosis of major depressive disorder based on changes in multiple plasma neurotransmitters: a targeted metabolomics study. Transl Psychiatry. 2018;8(1):130. doi:10.1038/s41398-018-0183-x
33. von Elm E, Altman DG, Egger M, Pocock SJ, Gøtzsche PC, Vandenbroucke JP. STROBE Initiative. The strengthening the reporting of observational studies in epidemiology (STROBE) statement: guidelines for reporting observational studies. Lancet. 2007;370(9596):1453–1457. doi:10.1016/S0140-6736(07)61602-X
34. Lee S, Rothbard AB, Noll EL. Length of inpatient stay of persons with serious mental illness: effects of hospital and regional characteristics. Psychiatr Serv. 2012;63(9):889–895. doi:10.1176/appi.ps.201100412
35. Sautin YY, Johnson RJ. Uric acid: the oxidant-antioxidant paradox. Nucleosides Nucleotides Nucleic Acids. 2008;27(6–7):608–619. doi:10.1080/15257770802138558
36. dos Santos Oliveira PM, Santos V, Coroa M, et al. Serum uric acid as a predictor of bipolarity in individuals with a major depressive episode. Bipolar Disord. 2019;21(3):235–243. doi:10.1111/bdi.12708
37. Burnstock G, Krügel U, Abbracchio MP, et al. Purinergic signalling: from normal behaviour to pathological brain function. Prog Neurobiol. 2011;95(2):229–274. doi:10.1016/j.pneurobio.2011.08.006
38. Rabbani G, Ahn SN. Structure, enzymatic activities, glycation and therapeutic potential of human serum albumin: a natural cargo. Int J Biol Macromol. 2019;123:979–990. doi:10.1016/j.ijbiomac.2018.11.053
39. Tabata F, Wada Y, Kawakami S, et al. Serum albumin redox states: more than oxidative stress biomarker. Antioxidants. 2021;10(4):503. doi:10.3390/antiox10040503
40. Al-Marwani S, Batieha A, Khader Y, et al. Association between albumin and depression: a population-based study. BMC Psychiatry. 2023;23(1):780. doi:10.1186/s12888-023-05174-0
41. Vasavda C, Kothari R, Malla AP, et al. Bilirubin links heme metabolism to neuroprotection by scavenging superoxide. Cell Chem Biol. 2019;26(10):1450–1460.e7. doi:10.1016/j.chembiol.2019.07.006
42. Huang F, Pariante CM, Borsini A. From dried bear bile to molecular investigation: a systematic review of the effect of bile acids on cell apoptosis, oxidative stress and inflammation in the brain, across pre-clinical models of neurological, neurodegenerative and neuropsychiatric disorders. Brain Behav Immun. 2022;99:132–146. doi:10.1016/j.bbi.2021.09.021
43. Coradduzza D, Di Lorenzo B, Sedda S, et al. Investigating bilirubin concentrations in schizophrenia: a systematic review and meta-analysis. Schizophr Res. 2024;271:228–236. doi:10.1016/j.schres.2024.07.041
44. Bartoli F, Crocamo C, Carrà G. Differences in serum uric acid between “unipolar” and “bipolar” depression: preliminary data. Bipolar Disord. 2019;21(3):280–281. doi:10.1111/bdi.12749
45. Black CN, Bot M, Scheffer PG, et al. Uric acid in major depressive and anxiety disorders. J Affect Disord. 2018;225:684–690. doi:10.1016/j.jad.2017.09.003
46. Bartoli F, Crocamo C, Clerici M, et al. Allopurinol as add-on treatment for mania symptoms in bipolar disorder: systematic review and meta-analysis of randomised controlled trials. Br J Psychiatry. 2017;210(1):10–15. doi:10.1192/bjp.bp.115.180281
47. Zhang Z, Huang Y, Zhou S, et al. Effect of serum antioxidants on cognitive dysfunction in first-episode and drug-naïve patients with major depressive disorder. J Affect Disord. 2025;372:533–539. doi:10.1016/j.jad.2024.12.062
48. Wan J, Ma Y, Amina R. Study on non-enzymatic antioxidant levels and its influencing factors in patients with bipolar disorder. Chin J Conval Med. 2022;31(7):766–769.
49. Lin X, Huang B, Xu H, et al. Changes of serum and lipid levels in patients with bipolar disorder. Chin J Urban Rural Enterp Hyg. 2022;37(5):151–153.
50. Shaker NM, Serafi EI, Riham HEM, Mohamed HEM, et al. Exploring the role of serum uric acid as a biomarker in patients with schizophrenia, bipolar affective disorder, and major depressive disorder. Middle East Curr Psychiatry. 2023;30(1):31. doi:10.1186/s43045-023-00307-3
51. Chen H, Sun F, Jin W. Study on association of serum uric acid levels with bipolar disorder: systematic review and meta-analysis in Chinese patients. Ann Gen Psychiatry. 2023;22(1):20. doi:10.1186/s12991-023-00450-5
52. Kesebir S, Tatlıdil Yaylacı E, Süner O, et al. Uric acid levels may be a biological marker for the differentiation of unipolar and bipolar disorder: the role of affective temperament. J Affect Disord. 2014;165:131–134. doi:10.1016/j.jad.2014.04.053
53. Burnstock G. Introductory overview of purinergic signalling. Front Biosci. 2011;3(3):896–900. doi:10.2741/e298
54. Gao H, Zhang C, Feng J, et al. A large-scale study on uric acid-related biomarkers in patients with bipolar disorder. Psychiatry Res. 2024;339:116089. doi:10.1016/j.psychres.2024.116089
55. Braga TT, Forni MF, Correa-Costa M, et al. Soluble uric acid activates the NLRP3 inflammasome. Sci Rep. 2017;7:39884. doi:10.1038/srep39884
56. Franklin TC, Xu C, Duman RS. Depression and sterile inflammation: essential role of danger associated molecular patterns. Brain Behav Immun. 2018;72:2–13. doi:10.1016/j.bbi.2017.10.025
57. Chen J, Feng J, Zhang L, et al. Association of serum uric acid levels with suicide risk in female patients with major depressive disorder: a comparative cross-sectional study. BMC Psychiatry. 2020;20(1):477. doi:10.1186/s12888-020-02891-8
58. Kim S, Rhee S, Song Y, et al. Comparison of serum uric acid in major depressive disorder and bipolar disorder: a retrospective chart review study. J Korean Med Sci. 2020;35(28):e222. doi:10.3346/jkms.2020.35.e222
 © 2026 The Author(s). This work is published and licensed by Dove Medical Press Limited. The
full terms of this license are available at https://www.dovepress.com/terms
and incorporate the Creative Commons Attribution
- Non Commercial (unported, 4.0) License.
By accessing the work you hereby accept the Terms. Non-commercial uses of the work are permitted
without any further permission from Dove Medical Press Limited, provided the work is properly
attributed. For permission for commercial use of this work, please see paragraphs 4.2 and 5 of our Terms.
© 2026 The Author(s). This work is published and licensed by Dove Medical Press Limited. The
full terms of this license are available at https://www.dovepress.com/terms
and incorporate the Creative Commons Attribution
- Non Commercial (unported, 4.0) License.
By accessing the work you hereby accept the Terms. Non-commercial uses of the work are permitted
without any further permission from Dove Medical Press Limited, provided the work is properly
attributed. For permission for commercial use of this work, please see paragraphs 4.2 and 5 of our Terms.