")
Back to Journals » Pharmacogenomics and Personalized Medicine » Volume 16
Clinical Significance of NAT2 Genetic Variations in Type II Diabetes Mellitus and Lipid Regulation
Authors Jarrar Y , Abudahab S, Abdul-Wahab G , Zaiter D, Madani A, Abaalkhail SJ, Abulebdah D, Alhawari H, Musleh R , Lee SJ
Received 10 June 2023
Accepted for publication 6 September 2023
Published 13 September 2023 Volume 2023:16 Pages 847—857
DOI https://doi.org/10.2147/PGPM.S422495
Checked for plagiarism Yes
Review by Single anonymous peer review
Peer reviewer comments 3
Editor who approved publication: Dr Martin H Bluth
Yazun Jarrar,1 Sara Abudahab,2 Ghasaq Abdul-Wahab,3 Dana Zaiter,4 Abdalla Madani,4 Sara J Abaalkhail,4 Dina Abulebdah,4 Hussam Alhawari,5 Rami Musleh,6 Su-Jun Lee7
1Department of Basic Medical Sciences, Faculty of Medicine, Al-Balqa Applied University, Al-Salt, Jordan; 2Department of Pharmacotherapy and Outcomes Science, School of Pharmacy, Virginia Commonwealth University, Richmond, VA, USA; 3Department of Oral Surgery and Periodontology, College of Dentistry, Al-Mustansiriya University, Baghdad, Iraq; 4Department of Pharmacy, Faculty of Pharmacy, Al-Zaytoonah University of Jordan, Amman, Jordan; 5Department of Internal Medicine, School of Medicine, The University of Jordan, Amman, Jordan; 6Department of Pharmacy, Faculty of Medicine and Health Sciences, An-Najah National University, Nablus, Palestine; 7Department of Pharmacology, Pharmacogenomics Research Center, College of Medicine, Inje University, Busan, Korea
Correspondence: Yazun Jarrar, Department of Basic Medical Sciences, Faculty of Medicine, Al-Balqa Applied University, Al-Salt, 19117, Jordan, Email [email protected]
Background: N-acetyltransferase 2 (NAT2) enzyme is a Phase II drug-metabolizing enzyme that metabolizes different compounds. Genetic variations in NAT2 can influence the enzyme’s activity and potentially lead to the development of certain diseases.
Aim: This study aimed to investigate the association of NAT2 variants with the risk of Type II diabetes mellitus (T2DM) and the lipid profile among Jordanian patients.
Methods: We sequenced the whole protein-coding region in NAT2 using Sanger’s method among a sample of 45 Jordanian T2DM patients and 50 control subjects. Moreover, we analyzed the lipid profiles of the patients and examined any potential associations with NAT2 variants.
Results: This study revealed that the heterozygous NAT2*13 C/T genotype is significantly (P = 0.03) more common among T2DM (44%) than non-T2DM subjects (23.5%). Furthermore, the frequency of homozygous NAT2*13 T/T genotype was found to be significantly higher (P = 0.03) among T2DM patients (26.7%) compared to that of non-T2DM subjects (11%). The heterozygous NAT2*7 G/A genotype was exclusively observed in T2DM patients (11.1%) and absent in the control non-T2DM group. Moreover, among T2DM patients, those with a homozygous NAT2*11 T/T genotype exhibited significantly higher levels of triglycerides (381.50 ± 9.19 ng/dL) with a P value of 0.01 compared to those with heterozygous NAT2*11 C/T (136.23 ± 51.12 ng/dL) or wild-type NAT2*11 C/C (193.65 ± 109.89 ng/dL) genotypes. T2DM patients with homozygous NAT2*12 G/G genotype had a significantly (P = 0.04) higher triglyceride levels (275.67 ± 183.42 ng/dL) than the heterozygous NAT2*12 A/G (140.02 ± 49.53 ng/dL) and the wild NAT2*12 A/A (193.65 ± 109.89 ng/dL).
Conclusion: The finding in this study suggests that the NAT2 gene is a potential biomarker for the development of T2DM and changes in triglyceride levels among Jordanians. However, it is important to note that our sample size was limited; therefore, further clinical studies with a larger cohort are necessary to validate these findings.
Keywords: type II diabetes mellitus, N-acetyltransferase 2, NAT2, triglyceride, genetic variants, Jordanian population
Introduction
Type II diabetes mellitus (T2DM) is a metabolic disease that is characterized by a high blood glucose level due to the decrease in insulin release from the pancreas and/or an increase in peripheral cellular resistance to insulin effects. Uncontrolled T2DM can cause harmful complications in the human body.1 Jordanians, like many other Middle Eastern populations are known to have a high prevalence of T2DM.2
T2DM has several risk factors, among which genetics plays a significant role. It was found that specific genes including peroxisome proliferator activator receptor and interleukin-10 genes, increase the risk of T2DM.3 Recently, it has been reported, in a genome-wide association study, that N-acetyltransferase 2 (NAT2) is a candidate gene for the development of T2DM. The same study reported that knocking down the NAT2 gene increased insulin resistance, and hence caused a disruption in lipid metabolism.4
NAT2 is a phase II drug metabolizing enzyme that is expressed in several organs of the human body, including the liver. It acetylates certain endogenous and xenobiotic compounds, including drugs and carcinogenic compounds.5 Moreover, it was found that metabolites of the enzyme can also be toxic to the human body and may induce cancer and immune diseases, such as rheumatoid arthritis.6–8
The acetylation capacity of the NAT2 enzyme is influenced by both the health-status and ethnicity of the patient. As previously documented in the literature,9 individuals with type 2 diabetes exhibit a lower acetylation capacity than those without the condition. Moreover, it has been observed that Caucasians possess a greater proportion of slow-acetylators than Asians.10 Such variation in acetylation capacity can be attributed predominantly to genetic variants in the NAT2 gene.10
Slow-encoding NAT2 genotypes are associated with isoniazid-induced hepatotoxicity,11 rheumatoid arthritis, and other oral diseases.12 On the other hand, fast-encoding NAT2 genotypes are at higher risk of developing cancer.13,14 As for T2DM, the literature has conflicting results for its association with the NAT2 gene. For example, Irshaid et al did not find a significant association between major NAT2 genotypes and T2DM among Jordanian patients.15 Previous studies conducted among Middle Eastern populations, such as those in Saudi Arabia16 and Turkey,17 have shown a significant correlation between the NAT2 genotype and T2DM. However, it is important to note that both of these studies only examined a limited number of NAT2 genetic variants.
To expand on this knowledge gap, we sequenced the protein-encoding region of the NAT2 gene among a sample of unrelated healthy Jordanians, and discovered a novel genetic variant in linkage disequilibrium (LD). We also observed that the NAT2 haplotypes in this population differed slightly from those reported in other ethnic groups.18
Given the limited information about the structure of the NAT2 gene among Jordanian T2DM patients, our study aimed to address this issue by sequencing the protein-coding region of the NAT2 gene among a sample of T2DM Jordanian patients and comparing the sequence of the NAT2 gene with that of control non-T2DM subjects.
Materials and Methods
Participants and Ethics of the Study
A total of 45 T2DM patients and 50 non-T2DM subjects of both genders participated in this study. The non-T2DM control subjects were unrelated Jordanians with a glycosylated hemoglobin (HbA1C) value of less than 5.719 and without any chronic diseases, such as autoimmunity, liver, kidney, cardiovascular, neurological, or cancer diseases. T2DM patients were diagnosed by endocrinologists at the University of Jordan Hospital between October 2020 and March 2021. The diagnosis of T2DM was in accordance with the guidelines of the American Association of Diabetes.20 The patients were also unrelated Jordanians.
The protocol for this study was approved by the ethical committee at Al-Zaytoonah University of Jordan and the institutional review board at the University of the Jordan Hospital (Reference number 2022-2021/13-5). Additionally, written informed consent was obtained from each subject before participating in this study. The protocol of this study was done according to the Declaration of Helsinki.
Data Collection
Demographic data, blood lipid and glucose profiles, and total cholesterol, LDL, HDL, TG, and glycated hemoglobin (HbA1c%) data were obtained from records of the University of Jordan Hospital.
DNA Isolation and Genotyping
The genomic DNA was isolated from the whole blood of each subject participating in this study using the Wizard Genomic DNA Purification Kit (Promega, USA). The DNA concentration was measured using a Nanodrop instrument (Quawell DNA/Protein Analyzer, USA). The ratio of 280/260 of DNA samples was 1.8 ± 0.1, which indicates that the DNA samples are free from protein contamination and DNA degradation.21
The protein-coding region of the NAT2 gene was amplified for each participant using two PCR reactions carried out in a Bio-Rad thermal cycler (T100TM, UK) as previously described.18 For each PCR reaction, 200 ng of genomic DNA was added to a 20 μL reaction mixture containing 2X PCR master mix and 10 pmol of each forward and reverse oligonucleotide (Table 1). The PCR conditions were as follows: initial denaturation at 94°C for 5 minutes, followed by 35 cycles of denaturation at 94°C for 45 seconds, annealing at 55°C for 50 seconds, and elongation at 72°C for 45 seconds. The final stage of elongation at 72°C for 7 minutes completed the PCR reaction.
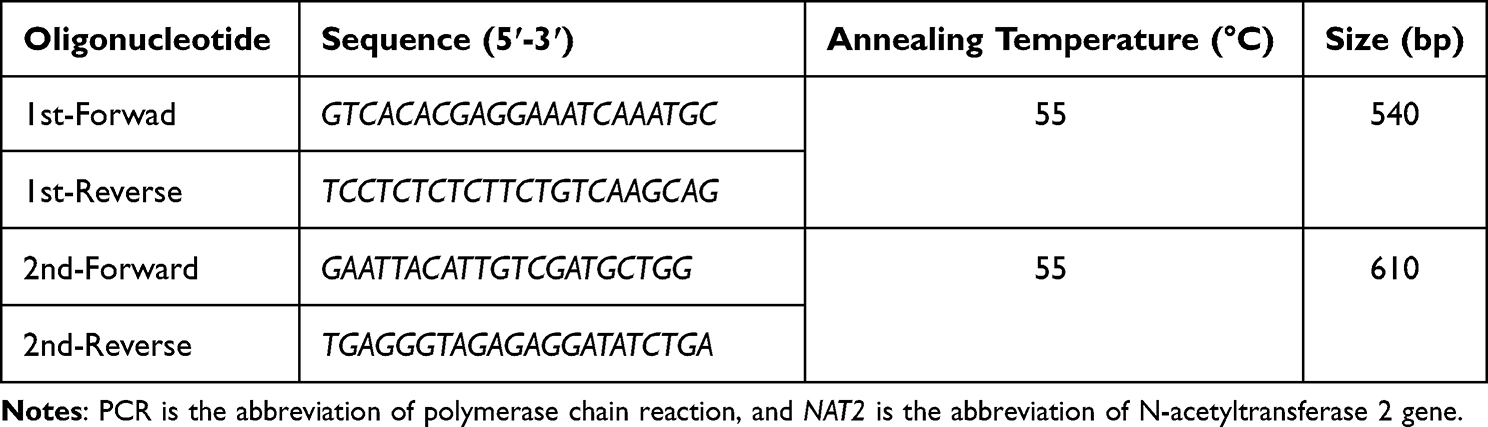 |
Table 1 Oligonucleotides Used for the PCRs Targeting the NAT2 Gene |
Following the PCR reaction, the products were electrophoresed on a 2% agarose gel using a 125 AMP electrical current. The agarose gel was stained with Redsafe dye (Intron, South Korea), which enables the visualization of PCR products at a wavelength of 540 nm, according to the company’s instructions. The size of the PCR products was compared with a 100 base pair (bp) DNA loading ladder (New England, USA). Figure 1 shows the gel electrophoresis of PCR products after amplification of the protein coding region of the NAT2 gene. Lastly, PCR was sequenced by Macrogen company (Seoul, South Korea).22 The chromatogram of DNA sequences was visualized using DNA-Based v3.5.4 software.23
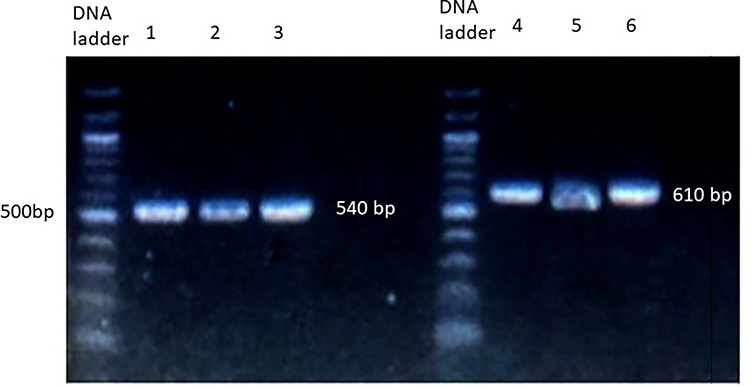 |
Figure 1 Gel electrophoresis of PCR amplification of the NAT2 gene. PCR products were run on 2% agarose gel stained with Redsafe stain. Lane 1–3 represents the amplification of the first, while lane 4–6 represents the amplification of the second part of the protein-coding region in NAT2 gene. |
Linkage Disequilibrium and Haplotype Analysis
The analysis of LD, haplotype, and deviation from Hardy–Weinberg equilibrium was done using Haploview 4.2 population genetic analysis software.24 The LD for each pair of NAT2 genetic variants was measured using |Dʹ|.25
Statistical Analysis
The comparison of NAT2 allele, genotype, and haplotype frequencies between T2DM and non-T2DM subjects was conducted using the chi-square (χ2) test. The lipid profile continuous data of T2DM patients were compared according to NAT2 genotype using the analysis of variance (ANOVA) test followed by Tukey post-hoc test. All statistical analyses performed in this study were carried out using the Statistical Package for the Social Sciences (SPSS) software (IBM Analytics, USA). A P value below 0.05 was considered significant.
Results
Demographic Data of Participants
The average age of control subjects was 45 ± 17 years and of the T2DM was 53 ± 11 years. Thirty participants of the controls were males while 20 were females. In addition, 25 T2DM patients were males while 20 patients were females. The body mass index of the control group was 24 ± 4.3 kg/m2 and of the diabetic group was 29 ± 2.8 kg/m2.
Analysis of NAT2 Genotype, Allele, and Haplotype
Table 2 shows the frequency of NAT2 genotypes among T2DM and non-T2DM subjects. This study shows that the frequencies of NAT2*13 and NAT2*7 differ significantly (P value = 0.0002–0.03) between T2DM and control subjects. The heterozygous NAT2*13 C/T genotype is more significantly (P value = 0.03) frequent among T2DM (44%) than that of non-T2DM subjects (23.5%). In addition, the frequency of homozygous NAT2*13 T/T genotype is significantly higher (P value = 0.03) among T2DM (26.7%) compared to that of non-T2DM subjects (11%).
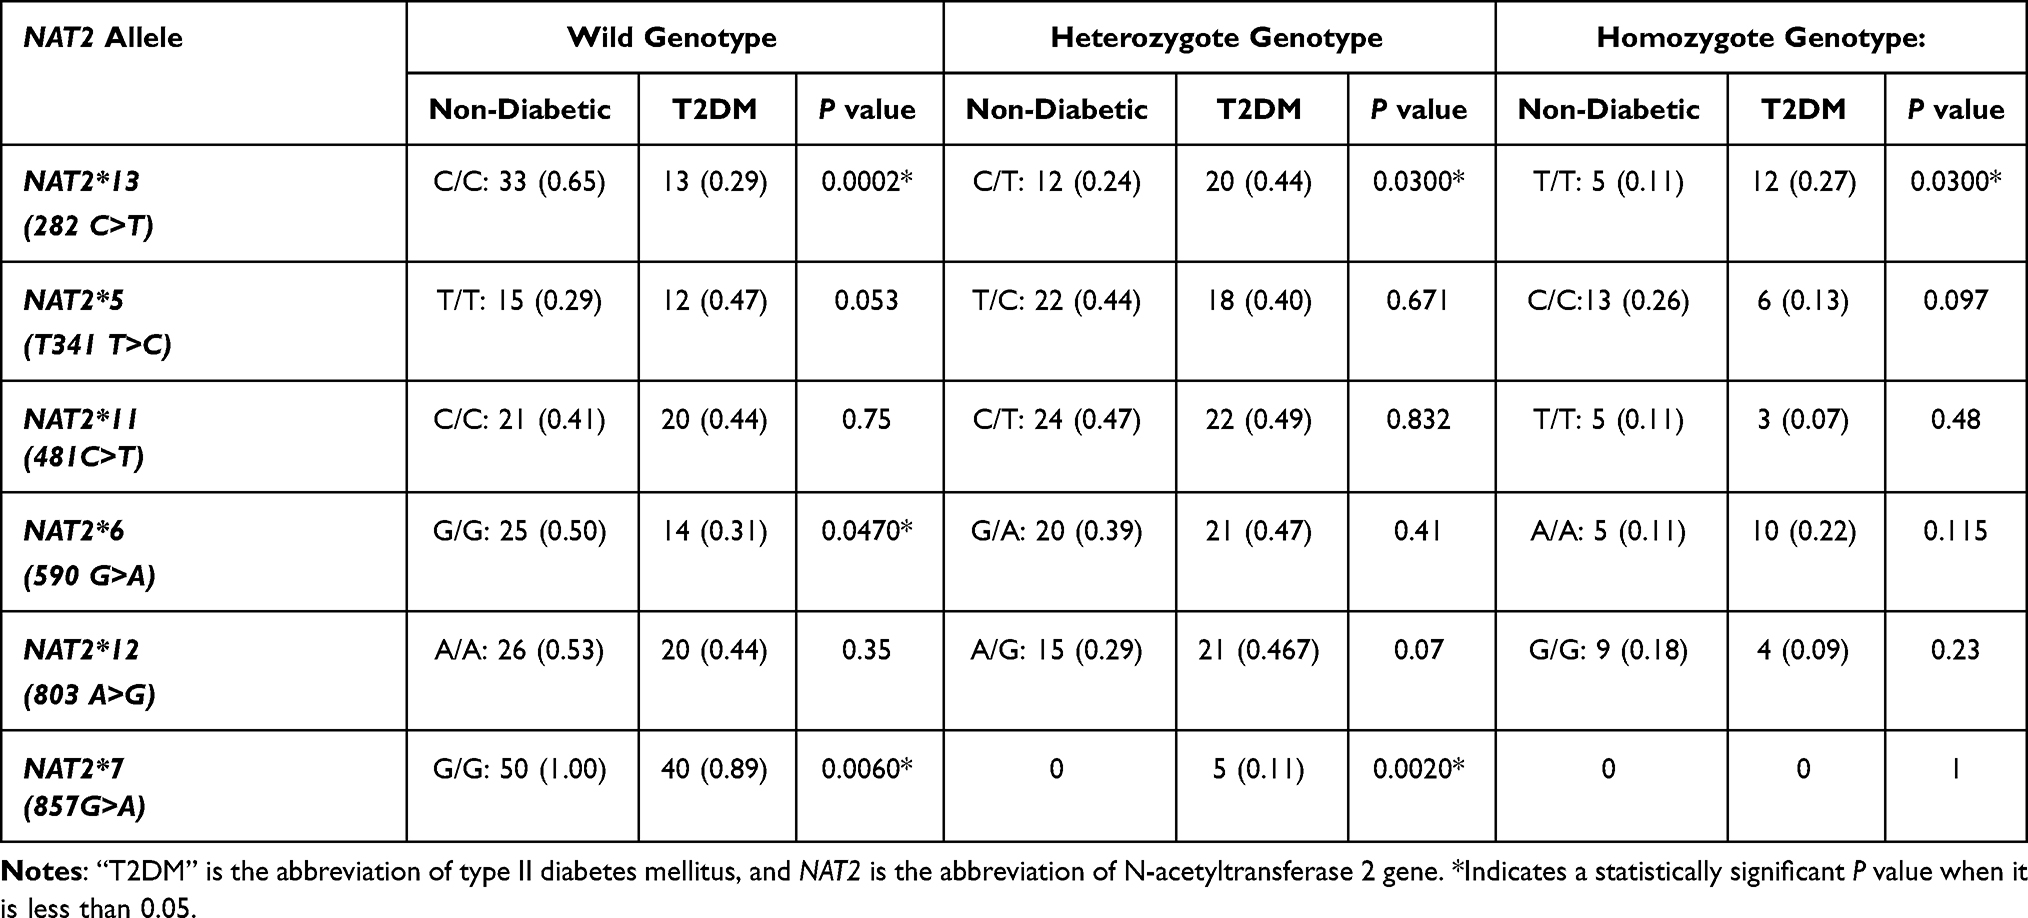 |
Table 2 The Frequency (Proportion, 95% CI) of NAT2 Genotype Among a Sample of Jordanian T2DM and Non-T2DM Subjects |
Regarding the NAT2*7 (857G>A) genotype, the homozygous NAT2*7 A/A was not found among this sample of T2DM and non-T2DM subjects. The heterozygous NAT2*7 G/A genotype was found only in T2DM patients (11.1%), while it was absent in the control non-T2DM group. This difference in the frequency of the NAT2*7 G/A genotype between both studied groups is statistically significant (P value = 0.002).
In addition, it is found in this study that the allele frequency of NAT2*13282 C>T and NAT2*7 857A>G variants is significantly different (P value = 0.018–0.043) between T2DM and non-T2DM groups (Table 3). The percentage frequency of NAT2*13 was 48.8% among T2DM while it was 26.5% among non-T2DM subjects. The NAT2*7 allele was absent among the healthy non-T2DM group, while it was found at a significant (P value = 0.043) percentage frequency (5.6%) among the T2DM group.
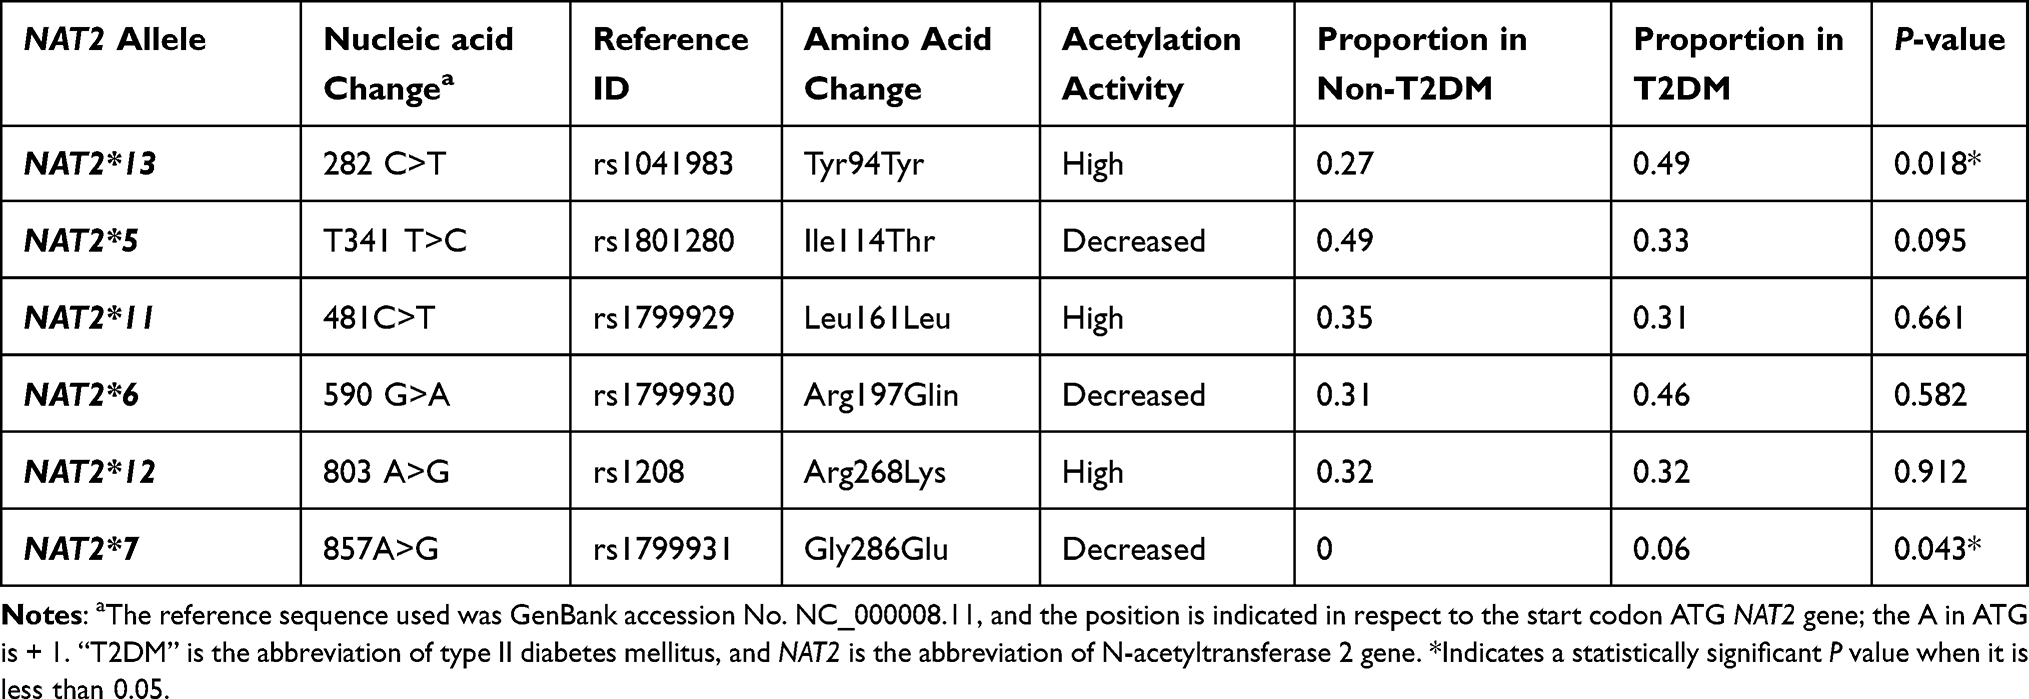 |
Table 3 The Frequency of NAT2 Genetic Alleles Among a Sample of Jordanian T2DM and Non-T2DM Subjects |
Regarding NAT2 haplotypes, there are some minor NAT2 haplotypes found only among T2DM patients, including NAT2*7B, NAT2*12M, NAT2*6B, and NAT2*5J (Table 4). However, the frequency of these NAT2 haplotypes was not significantly different (P value > 0.05) in comparison with the control non-T2DM group. The only significant (P value = 0.04) NAT2 haplotype among T2DM subjects is the slow-encoding NAT2*7B haplotype, which was not found among non-T2DM subjects. The most frequent NAT2 haplotype found among T2DM, in this study, was NAT2*6A with a percentage frequency of 38.8%, while the most frequent NAT2 haplotype among non-T2DM subjects was NAT2*5B with a percentage frequency of 29.3% (Table 4).
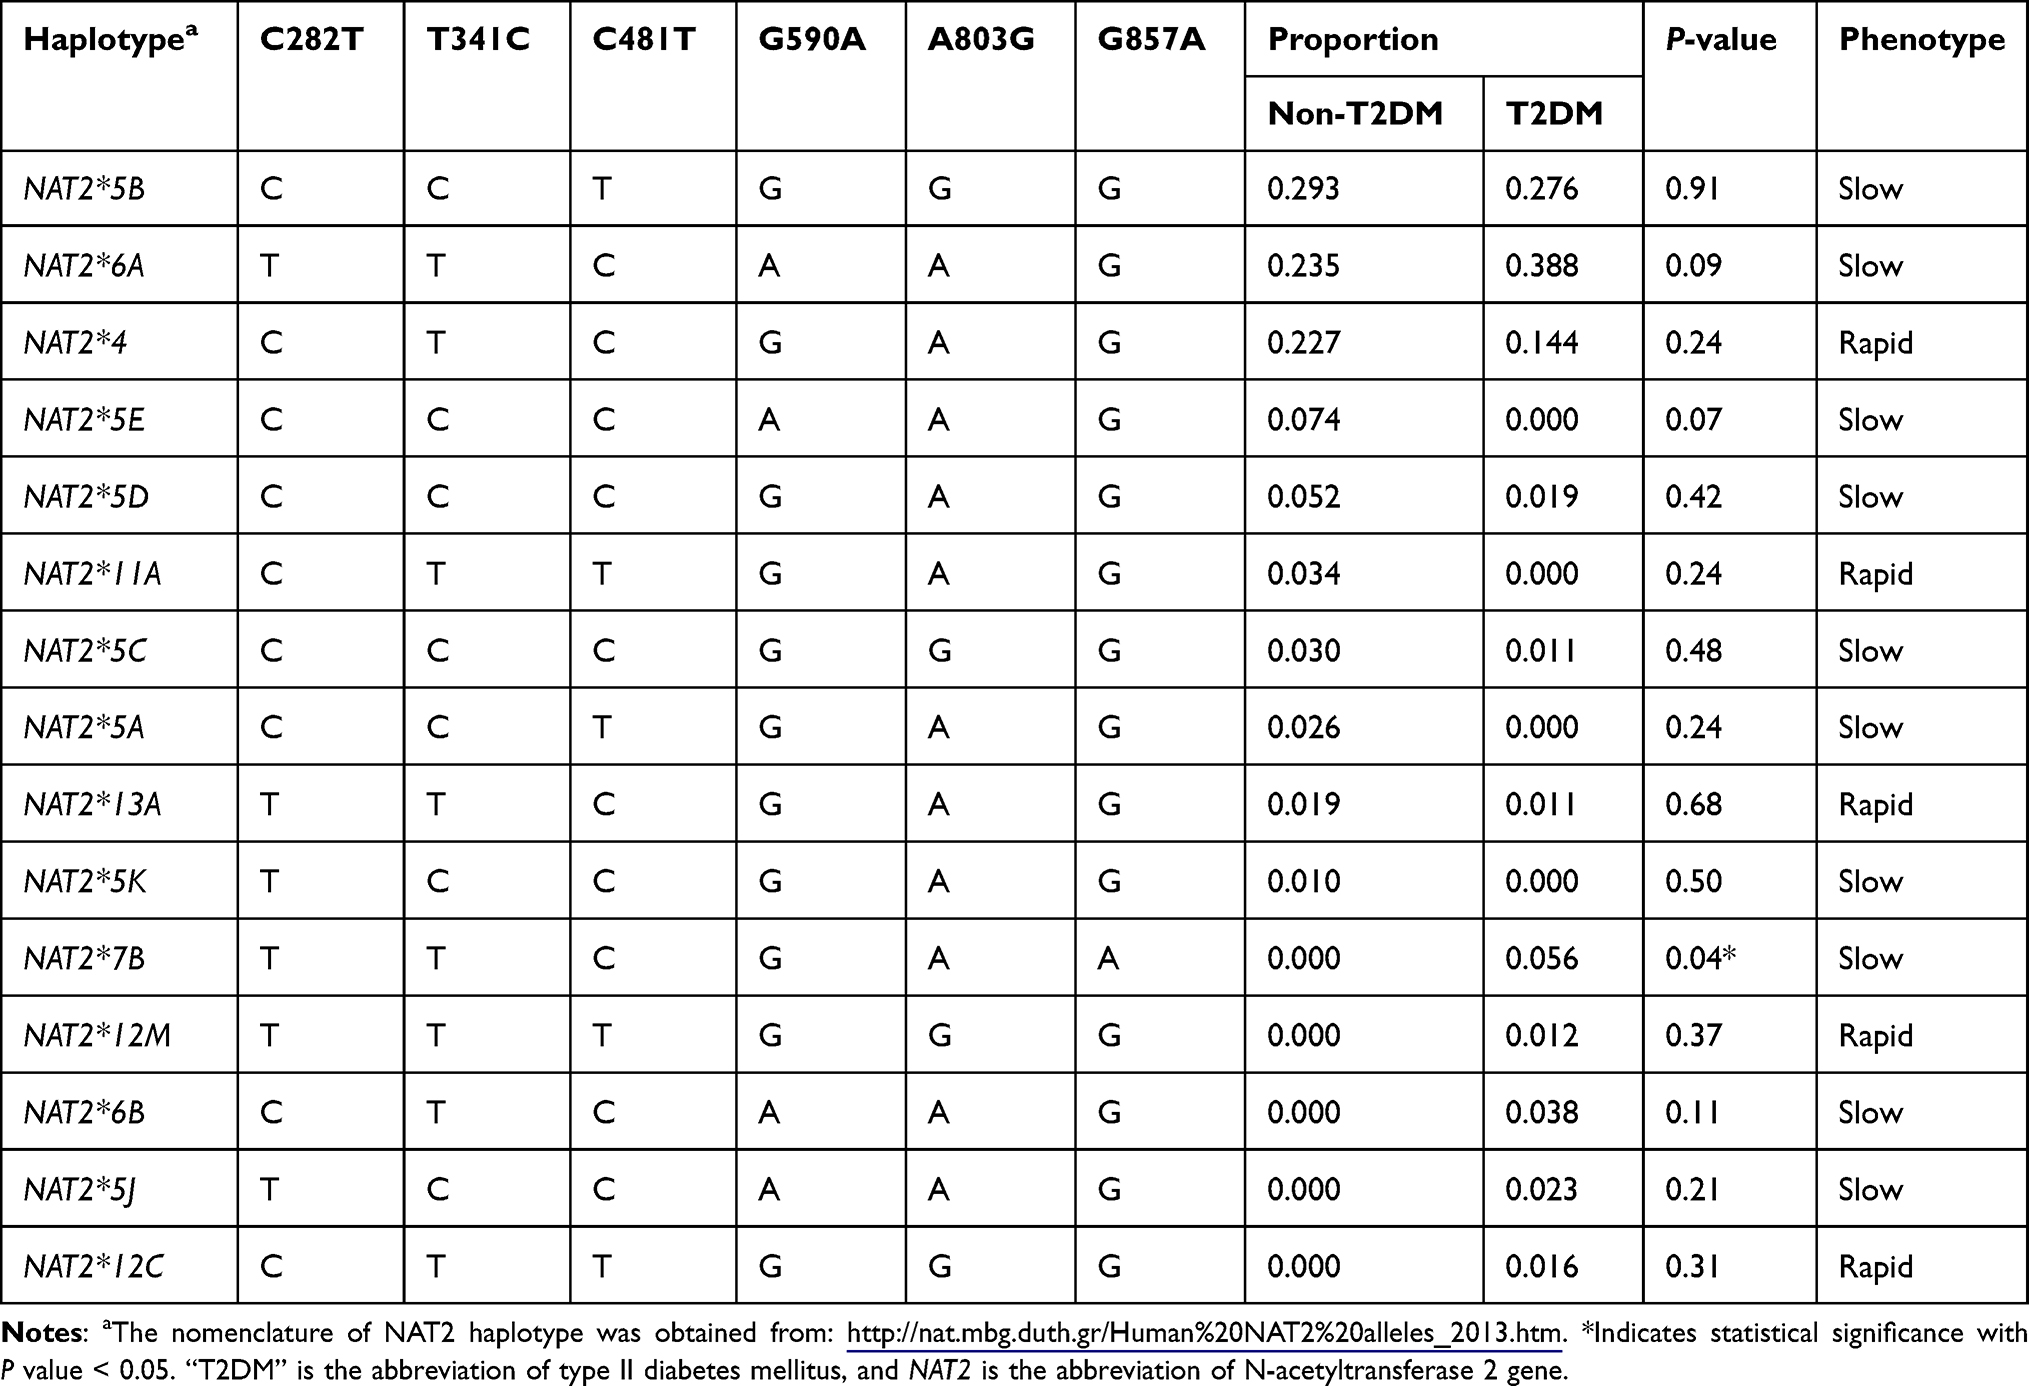 |
Table 4 The Proportion of NAT2 Haplotype Among a Sample of Jordanians T2DM and Non-T2DM Subjects |
Furthermore, some NAT2 haplotypes, including NAT2*5A, *5E, *5K, and *11A, were found in this study among the non-T2DM subjects, whereas these NAT2 haplotypes were not detected among T2DM patients (Table 4). Although, the frequencies of these NAT2 haplotypes did not reach statistical significance (P values > 0.05) when compared between both groups.
Table 5 shows the predicted acetylation phenotype among T2DM and non-T2DM sample groups depending on the analysis of the NAT2 haplotype. It can be noticed from the represented results that most T2DM and non-T2DM subjects are predicted to be slow acetylators. Although the percentage frequency of the slow-encoding acetylators among T2DM (82%) is slightly higher than in the non-T2DM group (71%), this difference failed to reach statistical significance (P value = 0.23).
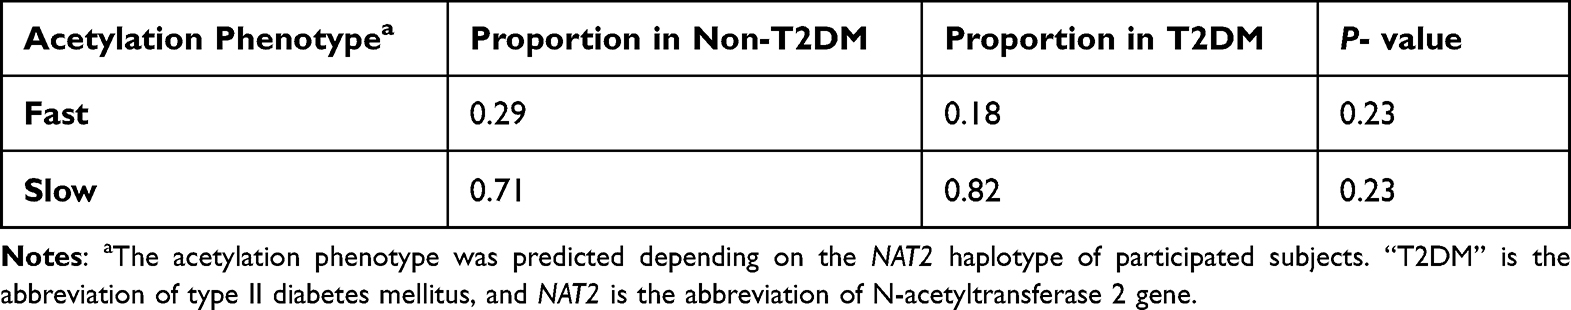 |
Table 5 The Predicted Acetylation Phenotype Among a Sample of Jordanians T2DM and Non-T2DM Subjects |
LD Analysis
Figure 2 shows the LD of NAT2 variants among the studied T2DM and non-T2DM groups. It is noticed that NAT2*7 is not in LD with other NAT2 variants among T2DM. Additionally, there are some differences in the value of D’, which represent the association between NAT2 variants, between T2DM and non-T2DM groups: NAT2*13 is in a complete LD (D’=1) with NAT2*5 and NAT2*11 among non-T2DM subjects, while the values of D’ between NAT2*13 and NAT2*5, and NAT2*11 are 0.82 and 0.90, respectively. Furthermore, NAT2*11 and NAT2*12 are in complete LD (D’=1) among T2DM patients, while the D’ value is 0.85 between NAT2*11 and NAT2*12 among the control non-T2DM group.
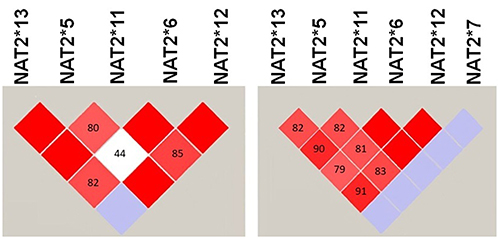 |
Figure 2 The LD between NAT2 variants among samples of Jordanians T2DM and non-T2DM. The LD was generated using Haploview software. The red square indicates a strong while the white square indicates a weak LD between NAT2 variants. The blue square indicates that there is no LD between NAT2 variants. |
The Association of NAT2 Genotype with the Lipid Profile of T2DM Patients
The results of this study showed only NAT2*5 genotype affected significantly (P value = 0.03) on the plasma levels of HbAC1 among T2DM patients, where carriers of NAT2*5 C/C genotype had less significant HbAC1 levels (6.20 ± 0.57 ng/dL) than carriers of the NAT2*5 T/C (8.27 ± 1.29 ng/dL) and NAT2*5 T/T (7.71 ± 1.66 ng/dL) genotypes. In addition, it is found that NAT2*11 and *12 genotypes affected significantly (P value = 0.01–0.04) on levels of triglyceride in the blood of T2DM patients. T2DM patients with homozygous NAT2*11 T/T genotype had significantly (P value = 0.01) higher levels of triglycerides (381.50±9.19 ng/dL) than heterozygous NAT2*11 C/T (136.23 ± 51.12 ng/dL) and wild NAT2*11 C/C (193.65 ± 109.89 ng/dL) genotypes. Furthermore, T2DM patients with homozygous NAT2*12 G/G genotype had a significantly (P value = 0.04) higher triglyceride levels (275.67 ± 183.42 ng/dL) than the heterozygous NAT2*12 A/G (140.02 ± 49.53 ng/dL) and wild NAT2*12 A/A (193.65 ± 109.89 ng/dL), as represented in Table 6.
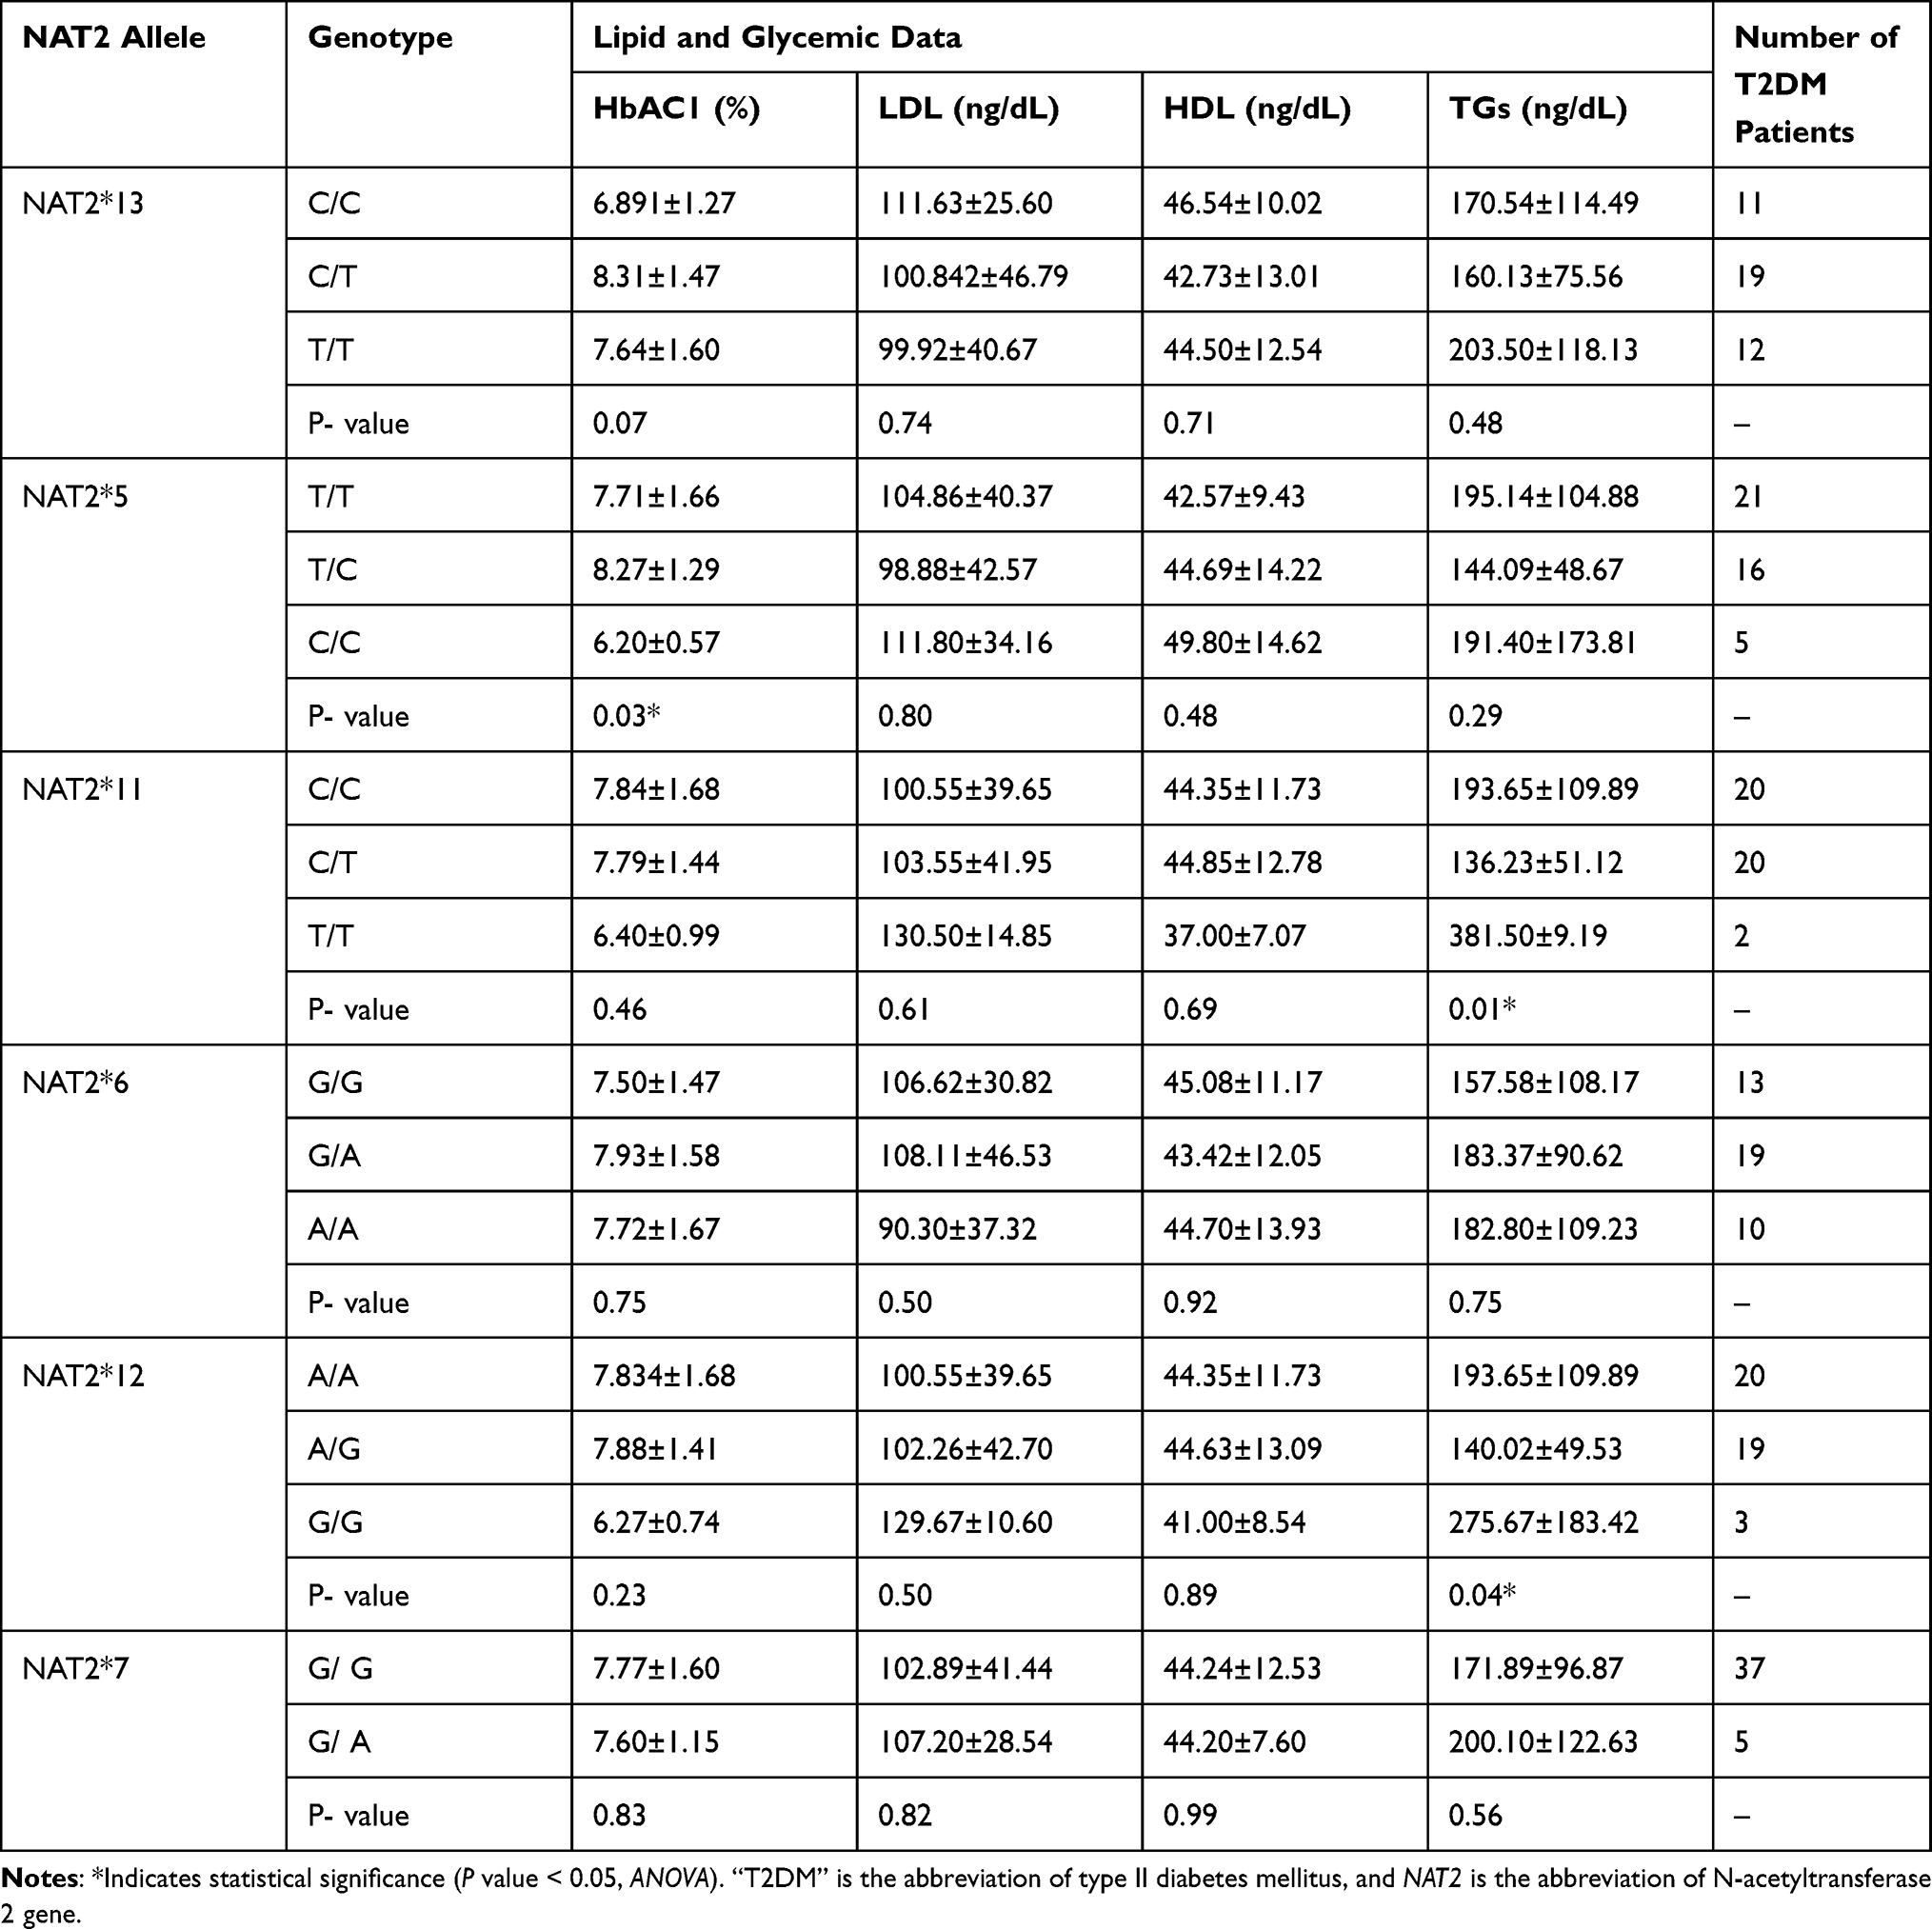 |
Table 6 Effects of NAT2 Genotype on the Lipid and Glycemic Profile of T2DM Patients |
Discussion
The NAT2 enzyme plays a significant role in metabolizing endogenous and exogenous compounds.5 Genetic variants in the NAT2 gene can alter the metabolism of chemical compounds and potentially lead to human diseases.26 The association between NAT2 genotype and T2DM varies among different ethnic populations.15,16,27
In this study, the entire protein-coding region of the NAT2 gene was sequenced using the Sanger sequencing method and the results were compared to those of non-T2DM control subjects of this study. As a result, we found that there is a significant difference in the frequency of NAT2*13 and *7 genotypes and alleles between T2DM and non-T2DM subjects. Furthermore, NAT2*11 and *12 genotypes affected the triglyceride levels among T2DM patients. Collectively, these findings indicate that the NAT2 gene is associated with the risk of T2DM and triglyceride levels among Jordanian patients. However, these findings are preliminary, and further clinical studies with larger sample sizes of T2DM patients are needed to confirm our results.
The frequency of NAT2 alleles, genotypes, and haplotypes among non-T2DM control subjects, found in this study, is similar to what was reported previously18 among healthy unrelated Jordanians, in which the NAT2*5 is the most frequent allele and the NAT2*5B haplotype is the most frequent NAT2 haplotype. In this study, it was found that NAT2*6 and NAT2*6 are the most frequent allele and haplotype, respectively, among this sample of T2DM patients. However, frequencies of the NAT2*6 allele, genotype, and haplotype were not statistically (P value > 0.05) higher among T2DM patients, in comparison with the non-T2DM subjects. These results are in line with that of reported results by Yalin et al, in which the NAT2*6 allele was found at relatively higher frequencies among Turkish T2DM patients.17 On the contrary, Semiz et al reported that NAT2*6 is significantly less frequent among T2DM patients from Bosnia and Herzegovina.28
The analysis of LD among T2DM patients showed that NAT2*7 is not in LD with any other NAT2 variants. However, other NAT2 variants are in strong LD as represented by the red color of the squares and the high D’ values (Figure 2). It can be explained by the low frequency of NAT2*7 (857 G>A) variant among the diabetic sample29 or it can be due to other reasons which needs further investigation.
Several studies have been conducted in Jordan to investigate the frequency of major NAT2 alleles and genotypes among the Jordanian population and their association with diseases using the PCR-restriction enzyme length polymorphism genotyping method.15,30,31 They examined NAT2*11 as a representative allele of the loss-of-function NAT25 allele based on previous findings that these two alleles are in complete LD in the Caucasian population. Although Jordanians are considered a Caucasian population, we found in this study that NAT2*11 and NAT2*5 alleles are not in complete LD among non-T2DM and T2DM subjects. This finding confirms what was previously reported by Jarrar et al that both NAT2*11 and NAT2*5 alleles are not in LD among Jordanian healthy volunteers.18 These findings suggest that carrying the NAT2*11 variant is not a marker for the presence of the NAT2*5 variant in Jordanians. Accordingly, analyzing only the synonymous NAT2*11 allele without the NAT2*5 allele could result in an inaccurate estimation of the functional loss of activity of the NAT2*5 allele and genotype in Jordanian patients.
We found that only two NAT2 genetic variants, *13 and *7, are associated with T2DM among this sample of patients. NAT2*13 T and NAT2*7 G alleles and their related genotypes were significantly more frequent (P value < 0.05) among T2DM than non-T2DM subjects. NAT2*13 is a synonymous variant that does not change the amino acid sequence and, hence, the protein structure and activity.32 However, the NAT2*13 variant is close to the promoter region of NAT2 gene and might be in LD with other functional NAT2 genetic variants that affect the regulation and expression of the NAT2 gene. Furthermore, several studies found that synonymous variants are associated with T2DM33 and drug response34 but the exact mechanisms of how these synonymous variants increase the risk of human diseases are still unclear.
The NAT2*7 is a non-synonymous variant that change the amino acid glycine to glutamate, which alters NAT2’s affinity to metabolize certain chemical compounds such as sulfamethazine.35 It was also previously reported that the NAT2*7 allele is more frequent among T2DM than non-T2DM in the Saudi population.16 However, more clinical studies are needed to confirm that NAT2*7 variant is more frequent among T2DM patients.36,37
We found in this study that some NAT2 haplotypes are detected only among T2DM patients, but not in non-T2DM subjects, such as NAT2*7B, NAT2*6B, NAT2*5J, and NAT2*12M. However, the only statistically significant NAT2 haplotype found among T2DM patients is the NAT2*7B haplotype, which is characterized by the presence of two NAT2 genetic variants: 282 C>T (NAT2*13) and 857 G>A (NAT2*7). This may indicate that the inheritance of these two NAT2 variants together increases the risk of developing T2DM in Jordanians.
Slow acetylators are more common in T2DM patients.38 In this study, the prediction of the acetylation phenotype depending on the NAT2 gene structure shows that most of the sample of T2DM patients were slow acetylators (82%). However, this excess of slow acetylators among T2DM patients was not statistically (P value > 0.05) different when we compared the frequency of individuals encoding the slow-acetylation gene between the control of non-T2DM group (72%). It can be concluded that not only the loss of function NAT2 variants explain the excess of slow-acetylation phenotype among T2DM patients. There are also another pathological factors could decrease the acetylation capacity in the liver. It was reported that the mRNA expression of mouse nat2 gene decreased significantly in the liver after induction of DM using streptozocin and was correlated with increased expression of the inflammatory enzyme cyclo-oxygenase 2 in the liver.39
We also found that the NAT2*5 genotype is associated with the glycemic level HbA1c; where carriers of homozygous NAT2*5/*5 had significant lower HbA1c values than patients carried heterozygous NAT2*4/*5 and wild genotypes. NAT2*5/*5 genotype encodes the slow acetylation phenotype.35 It was reported by Iskakova et al that the NAT2*13 variant determined the effectiveness of the hypoglycemic drugs dipeptidyl peptidase-4 inhibitors.40 Accordingly, it can be suggested that the NAT2*5 variant decreases the metabolism of certain hypoglycemic drugs which hence increases the plasma levels of these drugs and decreases HbA1c levels among T2DM patients. This finding needs further molecular and clinical investigations.
Several studies revealed that genetic variants influence the lipid profile of T2DM patients.41,42 We found that the NAT2 genotype is associated with only the level of triglycerides but not the level of cholesterol. The two NAT2 genotypes, NAT2*11 and *12, were associated with triglyceride levels, where T2DM patients with homozygous NAT2*11/*11 (T/T) and NAT2*12/*12 (G/G) had significantly higher levels of triglycerides than heterozygous and wild genotypes. The role of the NAT2 enzyme and NAT2 genetic variants in triglyceride metabolism is still unclear. However, it was shown previously that knocking-down the mouse NAT2 gene increases lipolysis and hence increases the amount of free fatty acids used in the synthesis of triglycerides.43
Although the aims of this study were achieved, there are some limitations that should be addressed. First, the sample size of T2DM patients is small. Therefore, this study can be considered a pilot study, and further studies with a larger sample size are needed to confirm the findings of this study. Second, the T2DM patients were on the antihyperlipidemic drug atorvastatin, which influenced the cholesterol levels, and hence the association between the NAT2 genotype and the lipid profile. Lastly, some lipid parameters including total cholesterol, free fatty acids were not studied in association with NAT2 variants.
Conclusion
In conclusion, this study found a significant association between the NAT2 genotype and the risk of T2DM and triglyceride levels among Jordanian patients. However, further clinical studies with larger sample sizes of T2DM patients are needed to confirm these findings.
Acknowledgment
The authors would like to thank Al-Zaytoonah University of Jordan for supporting this research.
Disclosure
The authors declare that there is no conflict of interest in this work.
References
1. Galicia-Garcia U, Benito-Vicente A, Jebari S, et al. Pathophysiology of type 2 diabetes mellitus. Int J Mol Sci. 2020;22(1):21. doi:10.3390/ijms22010021
2. Ajlouni K, Khader Y, Alyousfi M, Al Nsour M, Batieha A, Jaddou H. Metabolic syndrome amongst adults in Jordan: prevalence, trend, and its association with socio-demographic characteristics. Diabetol Metab Syndr. 2020;12(1):100. doi:10.1186/s13098-020-00610-7
3. Scarpelli D, Cardellini M, Andreozzi F, et al. Variants of the interleukin-10 promoter gene are associated with obesity and insulin resistance but not type 2 diabetes in caucasian Italian subjects. Diabetes. 2006;55(5):1529–1533. doi:10.2337/db06-0047
4. Knowles JW, Xie W, Zhang Z, et al. Identification and validation of N-acetyltransferase 2 as an insulin sensitivity gene. J Clin Invest. 2016;126(1):403. doi:10.1172/JCI85921
5. Sim E, Abuhammad A, Ryan A. Arylamine N-acetyltransferases: from drug metabolism and pharmacogenetics to drug discovery. Br J Pharmacol. 2014;171(11):2705–2725. doi:10.1111/bph.12598
6. Srivastava DSL, Aggarwal K, Singh G. Is NAT2 gene polymorphism associated with vitiligo? Indian J Dermatol. 2020;65(3):173–177. doi:10.4103/ijd.IJD_388_18
7. Zhu K, Xu A, Xia W, et al. Association between NAT2 polymorphism and lung cancer risk: a systematic review and meta-analysis. Front Oncol. 2021;11:567762. doi:10.3389/fonc.2021.567762
8. Cui D, Wang Z, Zhao E, Ma J, Lu W. NAT2 polymorphism and lung cancer risk: a meta-analysis. Lung Cancer. 2011;73(2):153–157. doi:10.1016/j.lungcan.2010.12.012
9. Irshaid Y, al-Hadidi H, Abuirjeie M, Latif A, Sartawi O, Rawashdeh N. Acetylator phenotypes of Jordanian diabetics. Eur J Clin Pharmacol. 1992;43(6):621–623. doi:10.1007/BF02284960
10. Hein DW, Doll MA, Fretland AJ, et al. Molecular genetics and epidemiology of the NAT1 and NAT2 acetylation polymorphisms. Cancer Epidemiol Biomarkers Prev. 2000;9(1):29–42.
11. Ohno M, Yamaguchi I, Yamamoto I, et al. Slow N-acetyltransferase 2 genotype affects the incidence of isoniazid and rifampicin-induced hepatotoxicity. Int J Tuberc Lung Dis. 2000;4(3):256–261.
12. Rego-Perez I, Fernandez-Moreno M, Blanco FJ. Gene polymorphisms and pharmacogenetics in rheumatoid arthritis. Curr Genomics. 2008;9(6):381–393. doi:10.2174/138920208785699553
13. da Silva TD, Felipe AV, De lima JM, Oshima CT, Forones NM. N-Acetyltransferase 2 genetic polymorphisms and risk of colorectal cancer. World J Gastroenterol. 2011;17(6):760–765. doi:10.3748/wjg.v17.i6.760
14. Liu C, Cui W, Cong L, et al. Association between NAT2 polymorphisms and lung cancer susceptibility. Medicine. 2015;94(49):e1947. doi:10.1097/MD.0000000000001947
15. Irshaid YM, Abujbara MA, Ajlouni KM, El-Khateeb M, Jarrar YB. N-acetyltransferase-2 genotypes among Jordanian patients with diabetes mellitus. Int J Clin Pharmacol Ther. 2013;51(07):593–599. doi:10.5414/CP201883
16. Al-Shaqha WM, Alkharfy KM, Al-Daghri NM, Mohammed AK. N-acetyltransferase 1 and 2 polymorphisms and risk of diabetes mellitus type 2 in a Saudi population. Ann Saudi Med. 2015;35(3):214–221. doi:10.5144/0256-4947.2015.214
17. Yalin S, Hatungil R, Tamer L, et al. N-acetyltransferase 2 polymorphism in patients with diabetes mellitus. Cell Biochem Funct. 2007;25(4):407–411. doi:10.1002/cbf.1314
18. Jarrar YB, Balasmeh AA, Jarrar W. Sequence analysis of the N-acetyltransferase 2 gene (NAT2) among Jordanian volunteers. Libyan J Med. 2018;13(1):1408381. doi:10.1080/19932820.2017.1408381
19. Sherwani SI, Khan HA, Ekhzaimy A, Masood A, Sakharkar MK. Significance of HbA1c test in diagnosis and prognosis of diabetic patients. Biomark Insights. 2016;11:95–104. doi:10.4137/BMI.S38440
20. American Diabetes A. Diagnosis and classification of diabetes mellitus. Diabetes Care. 2010;33(Suppl 1):S62–S69.
21. Lucena-Aguilar G, Sanchez-Lopez AM, Barberan-Aceituno C, Carrillo-Avila JA, Lopez-Guerrero JA, Aguilar-Quesada R. DNA source selection for downstream applications based on DNA quality indicators analysis. Biopreserv Biobank. 2016;14(4):264–270. doi:10.1089/bio.2015.0064
22. Crossley BM, Bai J, Glaser A, et al. Guidelines for Sanger sequencing and molecular assay monitoring. J Vet Diagn Invest. 2020;32(6):767–775. doi:10.1177/1040638720905833
23. Esteves ARF, Domingues AF, Ferreira IL, et al. Mitochondrial function in Parkinson’s disease cybrids containing an nt2 neuron-like nuclear background. Mitochondrion. 2008;8(3):219–228. doi:10.1016/j.mito.2008.03.004
24. Barrett JC, Fry B, Maller J, Daly MJ. Haploview: analysis and visualization of LD and haplotype maps. Bioinformatics. 2005;21(2):263–265. doi:10.1093/bioinformatics/bth457
25. Liu Z, Lin S. Multilocus LD measure and tagging SNP selection with generalized mutual information. Genet Epidemiol. 2005;29(4):353–364. doi:10.1002/gepi.20092
26. Luca F, Bubba G, Basile M, et al. Multiple advantageous amino acid variants in the NAT2 gene in human populations. PLoS One. 2008;3(9):e3136. doi:10.1371/journal.pone.0003136
27. Totomoch-Serra A, Marquez MF, Cervantes-Barragan DE. Sanger sequencing as a first-line approach for molecular diagnosis of Andersen-Tawil syndrome. F1000Res. 2017;6:1016. doi:10.12688/f1000research.11610.1
28. Semiz S, Dujic T, Ostanek B, et al. Association of NAT2 polymorphisms with type 2 diabetes in a population from Bosnia and Herzegovina. Arch Med Res. 2011;42(4):311–317. doi:10.1016/j.arcmed.2011.06.007
29. Slatkin M. Linkage disequilibrium--understanding the evolutionary past and mapping the medical future. Nat Rev Genet. 2008;9(6):477–485. doi:10.1038/nrg2361
30. Jarrar YB, Ismail S, Irshaid YM. N-Acetyltransferase-2 (NAT2) genotype frequency among Jordanian volunteers. Int J Clin Pharmacol Ther. 2010;48(10):688–694. doi:10.5414/CPP48688
31. Oqal MK, Mustafa KN, Irshaid YM. N-acetyltransferase-2 genotypes among patients with rheumatoid arthritis attending Jordan University Hospital. Genet Test Mol Biomarkers. 2012;16(9):1007–1010. doi:10.1089/gtmb.2012.0062
32. Zang Y, Doll MA, Zhao S, States JC, Hein DW. Functional characterization of single-nucleotide polymorphisms and haplotypes of human N-acetyltransferase 2. Carcinogenesis. 2007;28(8):1665–1671. doi:10.1093/carcin/bgm085
33. Khamees M, Jarrar Y, Al-Qirim T, et al. No impact of soluble epoxide hydrolase rs4149243, rs2234914 and rs751142 genetic variants on the development of type II diabetes and its hypertensive complication among Jordanian patients. Int J Clin Pract. 2021;75(5):e14036. doi:10.1111/ijcp.14036
34. Hakooz N, Jarrar YB, Zihlif M, Imraish A, Hamed S, Arafat T. Effects of the genetic variants of organic cation transporters 1 and 3 on the pharmacokinetics of metformin in Jordanians. Drug Metab Pers Ther. 2017;32(3):157–162. doi:10.1515/dmpt-2017-0019
35. McDonagh EM, Boukouvala S, Aklillu E, Hein DW, Altman RB, Klein TE. PharmGKB summary: very important pharmacogene information for N-acetyltransferase 2. Pharmacogenet Genomics. 2014;24(8):409–425. doi:10.1097/FPC.0000000000000062
36. Howard SG. Developmental exposure to endocrine disrupting chemicals and type 1 diabetes mellitus. Front Endocrinol. 2018;9:513. doi:10.3389/fendo.2018.00513
37. Yan D, Jiao Y, Yan H, Liu T, Yan H, Yuan J. Endocrine-disrupting chemicals and the risk of gestational diabetes mellitus: a systematic review and meta-analysis. Environ Health. 2022;21(1):53. doi:10.1186/s12940-022-00858-8
38. Irshaid YM, al-Hadidi HF, Abuirjeie MA, Rawashdeh NM. N-acetylation phenotyping using dapsone in a Jordanian population. Br J Clin Pharmacol. 1991;32(3):289–293. doi:10.1111/j.1365-2125.1991.tb03901.x
39. Jarrar YB, Al-Essa L, Kilani A, Hasan M, Al-Qerem W. Alterations in the gene expression of drug and arachidonic acid-metabolizing Cyp450 in the livers of controlled and uncontrolled insulin-dependent diabetic mice. Diabetes Metab Syndr Obes. 2018;11:483–492. doi:10.2147/DMSO.S172664
40. Iskakova A, Aitkulova A, Sikhayeva N, et al. Dipeptidyl peptidase-4 inhibitors: sensitivity markers. Eurasian J Appl Biotechnol. 2017;24(3):1–7.
41. Alhawari H, Jarrar Y, Abulebdah D, et al. Effects of vitamin D receptor genotype on lipid profiles and retinopathy risk in type 2 diabetes patients: a pilot study. J Pers Med. 2022;13(1):12. doi:10.3390/jpm13010012
42. Abdullah S, Jarrar Y, Alhawari H, Abed E, Zihlif M. The Influence of Endothelial Nitric Oxide Synthase (eNOS) genetic polymorphisms on cholesterol blood levels among type 2 diabetic patients on atorvastatin therapy. Endocr Metab Immune Disord Drug Targets. 2021;21(2):352–359. doi:10.2174/1871530320666200621174858
43. Knowles JW, Xie W, Zhang Z, et al. Identification and validation of N-acetyltransferase 2 as an insulin sensitivity gene. J Clin Invest. 2015;125(4):1739–1751. doi:10.1172/JCI74692
 © 2023 The Author(s). This work is published and licensed by Dove Medical Press Limited. The full terms of this license are available at https://www.dovepress.com/terms.php and incorporate the Creative Commons Attribution - Non Commercial (unported, v3.0) License.
By accessing the work you hereby accept the Terms. Non-commercial uses of the work are permitted without any further permission from Dove Medical Press Limited, provided the work is properly attributed. For permission for commercial use of this work, please see paragraphs 4.2 and 5 of our Terms.
© 2023 The Author(s). This work is published and licensed by Dove Medical Press Limited. The full terms of this license are available at https://www.dovepress.com/terms.php and incorporate the Creative Commons Attribution - Non Commercial (unported, v3.0) License.
By accessing the work you hereby accept the Terms. Non-commercial uses of the work are permitted without any further permission from Dove Medical Press Limited, provided the work is properly attributed. For permission for commercial use of this work, please see paragraphs 4.2 and 5 of our Terms.