")
Back to Journals » ClinicoEconomics and Outcomes Research » Volume 6
Clinical outcomes and health care costs combining metformin with sitagliptin or sulphonylureas or thiazolidinediones in uncontrolled type 2 diabetes patients
Authors Degli Esposti L , Saragoni S, Buda S , Degli Esposti E
Received 6 March 2014
Accepted for publication 8 July 2014
Published 21 October 2014 Volume 2014:6 Pages 463—472
DOI https://doi.org/10.2147/CEOR.S63666
Checked for plagiarism Yes
Review by Single anonymous peer review
Peer reviewer comments 2
Luca Degli Esposti, Stefania Saragoni, Stefano Buda, Ezio Degli Esposti
Health, Economics and Outcome Research, Clicon Srl, Ravenna, Italy
Objectives: To compare clinical outcomes and health care costs across three cohorts of uncontrolled diabetic patients who initiated treatment with one of the following: sulphonylureas (SU), thiazolidinediones (TZD) or sitagliptin (SITA).
Materials and methods: We performed a retrospective study based on a linkage between administrative and laboratory databases maintained by three Italian local health units. The index period ranged from July 2008–June 2010. Patients were treatment-naïve to either SU, TZD, or SITA, but they were already treated with other oral hypoglycemic agents. Demographics and clinical characteristics were assessed at baseline. Adherence was measured by the medication possession ratio and adherent was defined a patient with a medication possession ratio of 80% or greater. We used a Poisson regression model to estimate the risk ratios for disease-related hospitalizations that occurred during the 18-month follow-up period. The total annual costs included all the pharmacological treatments and the direct costs due to hospitalizations and outpatient services.
Results: We identified 928 patients treated with SU, 330 patients treated with TZD, and 83 patients treated with SITA. SITA patients were significantly younger and with fewer previous hospital discharges. The baseline mean glycated hemoglobin level was 8.1% for SU, 8.0% for TZD, and 8.3% for SITA patients. SITA-naïve patients resulted more adherent than the SU- and TZD-naïve patients (79.5% versus 53.2% and 62.8%, respectively; P<0.001). The SU and TZD group showed a significant increased risk of disease-related hospitalizations compared with the SITA group (the unadjusted rate was 10.42 and 7.16 per 100 person-years versus 1.64 per 100 person-years, P=0.003; compared with SU, the adjusted incidence rate ratio for SITA was 0.21, P=0.030). The total annual costs per patient were €972 for SITA, €706 for SU, and €908 for those treated with TZD.
Conclusion: Uncontrolled diabetic patients who initiated – as a second-line therapy in addition to metformin – treatment with SITA, compared to those who initiated treatment with SU or TZD, showed a reduced risk of disease-related hospitalizations. The total annual costs per patient were not significantly different among the three groups.
Keywords: diabetes, clinical practice, sitagliptin, adherence, health care costs
Introduction
Diabetes mellitus is one of the major challenges to the sustainability of health care systems in light of its high, and still increasing, prevalence.1 The condition commonly progresses to microvascular and macrovascular complications,2,3 causing a decrease in health and quality of life, as well as an increase in financial burden on the health care system.4 In Italy, direct costs for diabetic people amount to about €9 billion per year, representing nearly 9% of the national health expenditures.5 Type 2 diabetes mellitus (T2DM) is usually treated in a stepwise manner, starting with lifestyle modifications, followed by the addition of one or more oral hypoglycemic drugs (OHDs). Metformin monotherapy is generally recommended as first-line pharmacotherapy,6,7 while numerous second-line agents – including older drugs such as sulphonylureas (SU), and more recently introduced drugs such as thiazolidinediones (TZD) and sitagliptin (SITA), which is a dipeptidyl peptidase-4 inhibitor (DPP-4) – are now available for T2DM patients who have inadequate glycemic control. Guidelines have suggested that there is a choice among different second-line agents considering their respective advantages and disadvantages.6,7 Thus, a patient-centered therapeutic regimen for patients with T2DM should be determined by the patient’s characteristics and comorbidities, and they should be optimized for efficacy, safety, tolerability, and the costs of treatment and their related outcomes.8 As a consequence, estimates of the direct medical costs attributed to diabetes in a real-world setting are essential in order to determine the financial burden of the disease and manage the future health care needs. The objective of this study was to determine the clinical outcomes and costs of the pharmacological treatment, as well as the cost of related outcomes, when adding different second-line agents to metformin in patients with T2DM who are no longer adequately controlled by metformin alone.
Materials and methods
Data source
This retrospective study was based on administrative databases maintained by three local health units (LHU) in Italy. The databases considered were the Beneficiaries’ Database, the Territorial Pharmacy Database, the Hospital Direct Drugs Distribution Registry, the Hospital Discharge Database, the Outpatient Service Registry, and the Clinical Laboratory File. The data included in each database has been described in a previous paper.9 Universal health care coverage in Italy means that the information contained in these databases, which has been used previously,10 is complete and comprehensive. The Italian Ministry of Health reports that these archives are 100% complete and 95% accurate.11 No identifiers related to patients were provided to the researchers. The ethics committee of each LHU approved the study.
Cohort definition
This retrospective study investigated a cohort of adults defined as T2DM patients if, between July 1, 2007 and June 30, 2008, they had at least two prescriptions of OHDs (Anatomical Therapeutic Chemical [ATC] code A10B); and/or at least one fasting glucose determination over 126 mg/dL; and/or at least one hospitalization with a discharge diagnosis of diabetes (International Classification of Diseases, Ninth Revision, Clinical Modification [ICD9CM]12 code 250); and/or the presence of an exemption for diabetes in at least one outpatient service request. We identified eligible patients as subjects aged ≥18 years who received a first (index date) prescription of SITA (ATC code A10BH01), SU (ATC codes A10BB, A10BD02), or TZD (ATC codes A10BG, A10BD05, A10BD06) between July 1, 2008 and June 30, 2010, and who were taking different OHDs, but not insulin (ATC code A10A) in the 12 months preceding the index date. Enrolled patients were characterized, in the year before the index date, according to 1) the presence of the following drug treatments: at least two prescriptions of antihypertensive drugs (ATC code C02, C03, C07, C08, C09), and/or lipid-lowering drugs (ATC code C10), and/or nonsteroidal anti-inflammatory drugs (ATC code M01), and/or drugs for asthma/chronic obstructive pulmonary disease (ATC code R03); and 2) the presence of at least one hospital discharge with a primary or secondary diagnosis code of a cardiovascular disease (myocardial infarction or other ischemic heart disease [ICD9CM 410–414], stroke or other cerebrovascular disease [ICD9CM 430–438], heart arrhythmia [ICD9CM 427], heart failure [ICD9CM 428], atherosclerosis or aneurysms of large vessels [ICD9 440–442], other cardiovascular disease [ICD9CM 401–405], chronic kidney disease [ICD9CM 584–585]), diabetes mellitus and diabetes-related diseases [diabetes mellitus, ICD9CM 250], retinal disease [ICD9CM 362], osteoporosis [osteoarthrosis, ICD9CM 715], fracture of the femoral neck [ICD9CM 820], or fracture of the tibia and fibula [ICD9CM 823]. The Charlson comorbidity index was also calculated for each patient by summing the assigned weights for all comorbid conditions evaluated in the 1-year period before the index date.13 Because the Charlson index assigns a weight of 1 to individuals with diabetes, all individuals in this study had at least an index score of 1. Clinical measures at baseline included the most recent determination of serum glycated hemoglobin (HbA1c) and fasting glucose. HbA1c is a widely used marker of glycemic control that reflects the average glycemic level during the past 2–3 months.14
Adherence to hypoglycemic drugs
Adherence was determined using the medication possession ratio (MPR) calculated in the 1 year following the index date – a method used in prior studies15,16 to quantify medication adherence. The MPR reflects the proportion of days during which the enrollee possesses a supply of medication. The numerator for the MPR was calculated by summing the number of days’ supply from filled prescriptions of the OHD. This number was divided by 365 and expressed as a percentage. For enrollees on multiple diabetes medications, the average MPR for each class of drug was calculated. The days when patients were in an institutionalized care setting, such as in hospitals or nursing homes were excluded from the MPR calculation. Because the Territorial Pharmacy Database does not include data regarding drug dose, the mean daily dose of the prescribed drugs was defined according to the recommended dose reported in “L’Informatore farmaceutico”.17 We defined “nonadherence” as an MPR <80%, a cutoff score commonly used in the literature on chronic diseases, such as diabetes and schizophrenia, to define poor adherence.18,19
Outcomes
The primary study endpoint was a composite of all hospitalizations for cardiovascular disease, or diabetes and diabetes-related complications, or chronic kidney disease, or osteoporosis previously described, or hypoglycemia (ICD9CM 250.3, ICD9CM 250.8, ICD9CM 251.0, ICD9CM 251.1, or ICD9CM 251.2) that occurred in the 18 months following the index date (unless the individual died or left the province).
The secondary study endpoint was the analysis of all cardiovascular disease hospitalizations alone. In addition, we evaluated the variations in the level of HbA1c during the follow-up period comparing the last measurement of HbA1c before the index date and the last measurement of HbA1c available in the 1 year after the index date.
Cost of illness
Disease-related health care costs in the year following the index date included: costs of OHDs purchased by the Territorial and Hospital Pharmacy; costs due to all hospital admissions for cardiovascular disease, diabetes, and diabetes-related complications, chronic kidney disease, osteoporosis, and hypoglycemia; costs of laboratory tests for HbA1c, glycemia, lipid panel, microalbuminuria, and creatinine; and costs for specialist visits and eye examinations. Drugs were priced according to the National Health Service’s purchase price.9 Hospitalizations were priced according to the diagnosis-related group tariff. The cost of outpatient services has been defined according to the tariffs applied by the regions where the LHUs are located. The currency reference used was the Euro (€).
Baseline confounders
As possible confounders, we considered age; sex; the use of certain medications (yes/no) (such as antihypertensive drugs, lipid-lowering drugs, nonsteroidal anti-inflammatory drugs, drugs for asthma/chronic obstructive pulmonary disease); the presence of previous hospitalizations (yes/no); the Charlson index level grouped into one of two categories (index score =1 or index score >1); the HbA1c level, categorized as ≤7%, >7% and ≤8%, >8% and ≤9%, >9%, and a missing values category, since there were patients without HbA1c measurements; the number of previous OHD classes; and the OHD adherence level based on MPR level (<40%, ≥40% and <79%, ≥80%). We did not include glycemia for the elevated number of missing values.
Statistical analysis
Quantitative variables are presented as the mean ± standard deviation. One-way analysis of variance was used to compare the means of the quantitative variables. Associations between categorical variables were tested using the Pearson χ2 test. A multivariate logistic regression model was used to estimate the odds ratios and 95% confidence intervals (CIs), and to examine the predictors of adherence to OHD therapy in the year following the index date. The model was adjusted for the possible baseline confounders and the type of OHD treatment. A Poisson regression analysis, with person-years as the offset variable, was used to model counts of the number of hospitalizations that occurred during the follow-up period. Incidence rate ratios (IRRs) and 95% CIs were calculated for each of the possible baseline confounders. A further Poisson regression analysis was performed using the same method to investigate the relationship between adherence, type of the OHD treatment and the risk of cardiovascular hospitalization. As in the observational studies treatment selection is often influenced by subject characteristics, we used a propensity score-matching analysis to balance the different OHD treatment groups on the possible baseline confounders (1:1 match).
A generalized linear model with an identity link function and a gamma distribution was used to estimate the association between health care costs and the type of OHD treatment.20 Two-tailed P-values <0.05 were considered to be statistically significant, and all statistical analyses were conducted using Stata software version 12.1 (StataCorp LP, College Station, TX, USA).
Results
A total of 1,391 diabetic patients met the inclusion/exclusion criteria and were included in the present analysis: 83 patients (6.2% of the enrolled cohort) were new SITA-treated, 928 (69.2%) were new SU-treated, and 330 (24.6%) were new TZD-treated. The demographic and clinical characteristics of the three groups of patients are reported in Table 1. Patients treated with SITA were significantly younger, had a significantly lower Charlson index, had a significantly lower number of previous hospital admissions, and experienced significantly higher previous multidrug OHD therapy than patients treated with SU or TZD. No significant differences in the baseline mean values of serum glucose and HbA1c resulted among the three groups of patients. During the 1 year of follow-up, among the 83 patients treated with SITA, ten patients (12.0%) were given SITA as a monotherapy while the others received prescriptions for SITA combined with other OHDs; 165 SU patients (17.8%) were given SU as a monotherapy while the others received prescriptions for SU combined with other OHDs; and 66 TZD patients (20.0%) were given TZD as a monotherapy while the others combined TZD with other OHDs. After 6 months of therapy, three SITA-treated patients (3.6%) quit the hypoglycemic therapy and nine patients (10.8%) stopped taking SITA and went on other OHDs; in the SU group, 46 patients (5.3%) quit the hypoglycemic therapy and 222 patients (25.4%) stopped taking SU and went on other OHDs; and in the TZD group, 18 patients (5.6%) quit the hypoglycemic therapy and 62 patients (19.2%) stopped taking TZD and went on other OHDs.
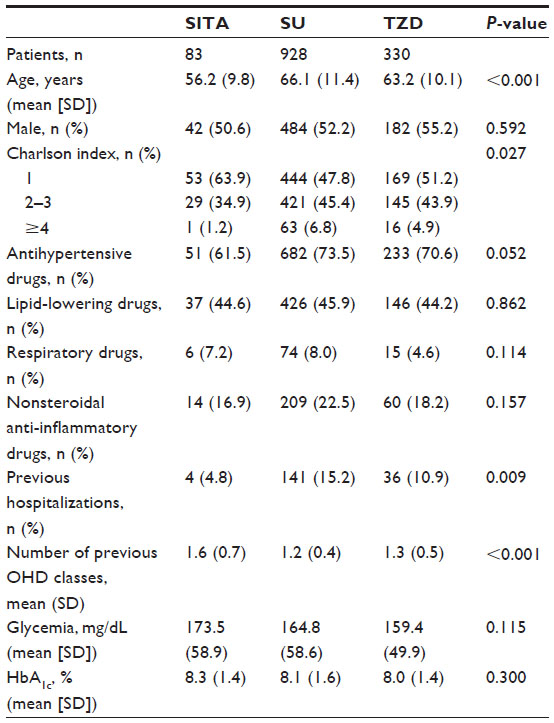 | Table 1 Baseline characteristics of enrolled patients |
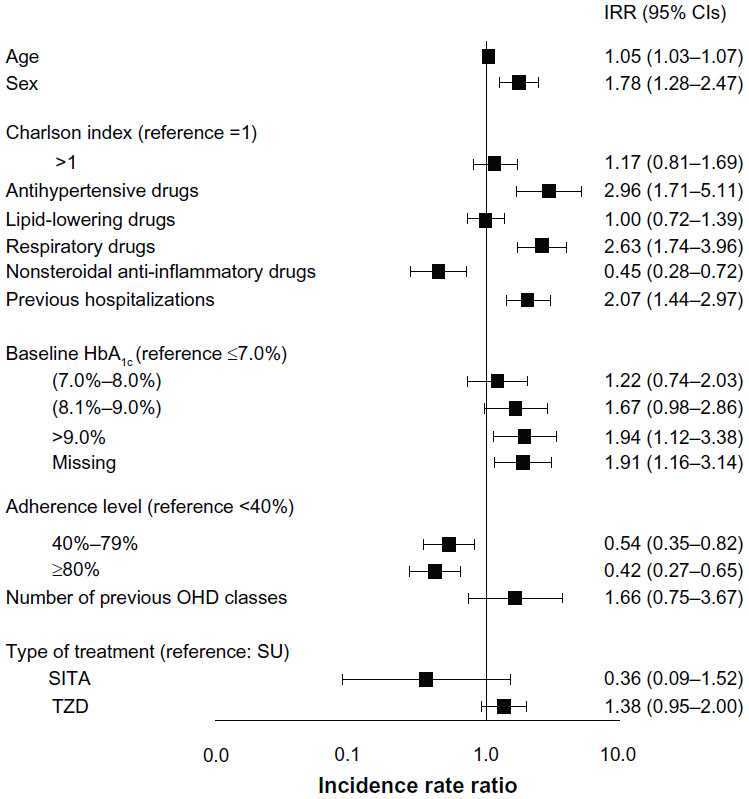
Patients treated with SITA resulted significantly more adherent, that is more likely to reach an MPR value greater than or equal to 80%, to hypoglycemic therapy than patients treated with SU or TZD (79.5% versus 53.9% and 62.8%, respectively; P<0.001). After adjusting for the possible confounders, SITA patients were more likely to be adherent compared with the other two groups (Figure 1; Table 2). After 1 year of treatment, the mean serum level of HbA1c was significantly reduced in the three groups of patients (from 8.2%±1.3% to 7.5%±0.9% in the SITA-treated patients; from 8.1%±1.6% to 7.5%±1.2% in the SU-treated patients; and from 8.0%±1.3% to 7.3%±1.0% in the TZD-treated patients). A total of 247 hospitalizations were observed during the 18-month follow-up period; the unadjusted rate of hospitalization was 1.64 per 100 person-years for SITA-treated patients, 10.42 per 100 person-years for SU-treated patients, and 7.16 per 100 person-years for TZD-treated patients. In the multivariable model, age, male sex, pharmacological treatment with antihypertensive and respiratory drugs, previous hospitalizations, and a baseline serum HbA1c >8% significantly contributed to an increased risk of hospitalization, while pharmacological treatment with nonsteroidal anti-inflammatory drugs, and an MPR between 40% and 79%, or >79% was associated with a reduced risk of hospitalization. Regarding the hypoglycemic therapy, compared with SU-treated patients (IRR =1.0), the risk of hospitalization was lower in patients treated with SITA (IRR =0.21; 95% CI: 0.05–0.86; P=0.030) and higher, but not significantly, in patients treated with TZD (IRR =1.03; 95% CI: 0.75–1.41; P=0.863) (Figure 2). We obtained the same result considering TZD treatment as reference.
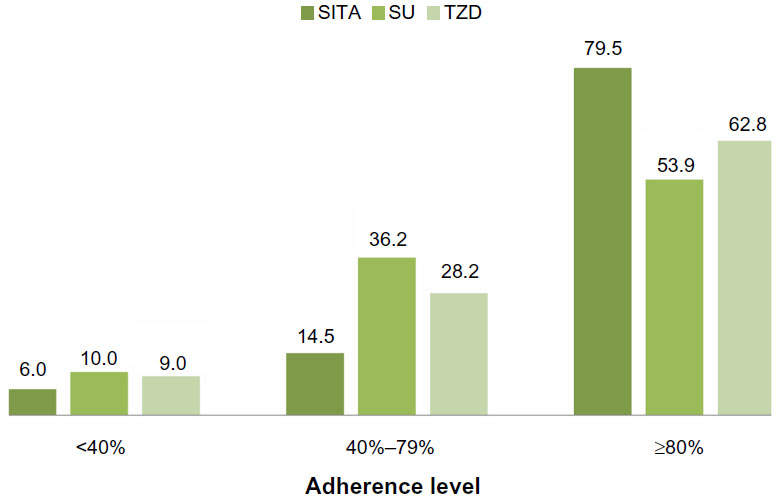 | Figure 1 Adherence level according to the type of drug. |
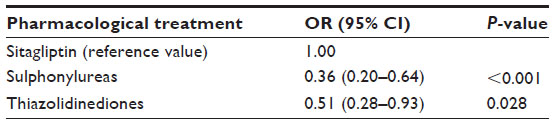 | Table 2 Logistic regression model of the predictors of adherence to treatment |
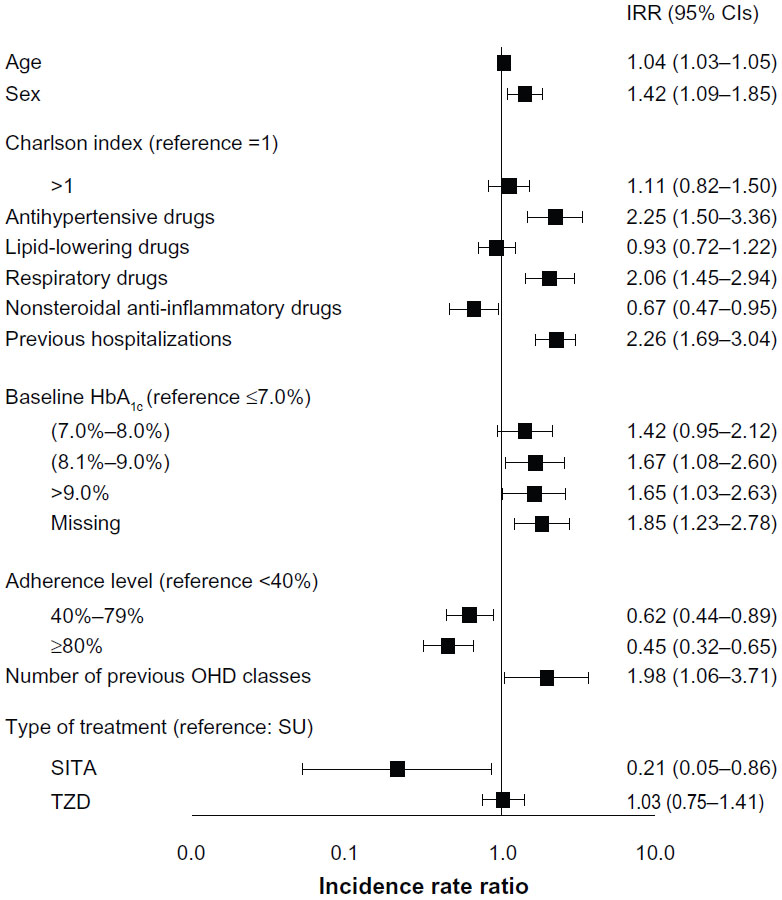 | Figure 2 Risk of hospitalization for any reason. |
A separate analysis was performed for the associations between the patients’ type of OHD treatment and the risk of hospital admissions for cardiovascular reasons. Although the trend was comparable with the previous analysis (ie, compared with the SU group, the risk of cardiovascular hospitalization decreased in the SITA group [IRR =0.36; 95% CI: 0.09–1.52; P=0.166] and increased in the TZD group [IRR =1.38; 95% CI: 0.95–2.00; P=0.094]), the results were not statistically significant and the different hypoglycemic treatments did not appear to have different effects (Figure 3).
 | Figure 3 Risk of hospitalization for cardiovascular reasons. |
After propensity score matching, no significant difference between the three groups for any covariate was observed. In these matched cohorts, the rate of hospitalization was 1.64 per 100 person-years for SITA-treated patients, 7.56 per 100 person-years for SU-treated patients, and 4.94 per 100 person-years for TZD-treated patients, confirming the previous results, even though these were not statistically significant differences.
The mean annual health care cost related to the three modalities of hypoglycemic therapy was higher in the SITA-treated patients when compared to the SU- and TZD-treated patients (€972 versus €706 and €908, respectively; Figure 4) because of the cost of the drug, while the cost due to hospitalization was lower in the SITA-treated patients than in SU- and TZD-treated patients (€68 versus €372 and €329, respectively). After adjusting for the baseline characteristics, the generalized linear model (Figure 5) did not provide evidence for a significant difference in health care costs among the three groups of patients.
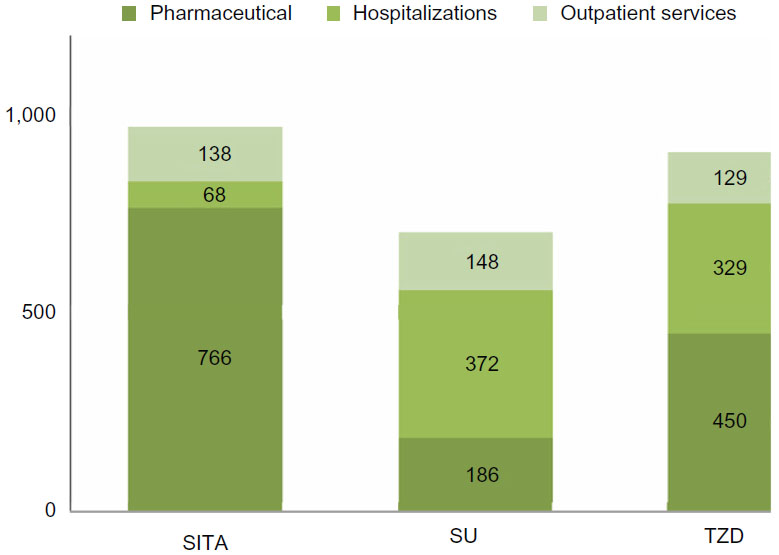 | Figure 4 Health care expenditures. |
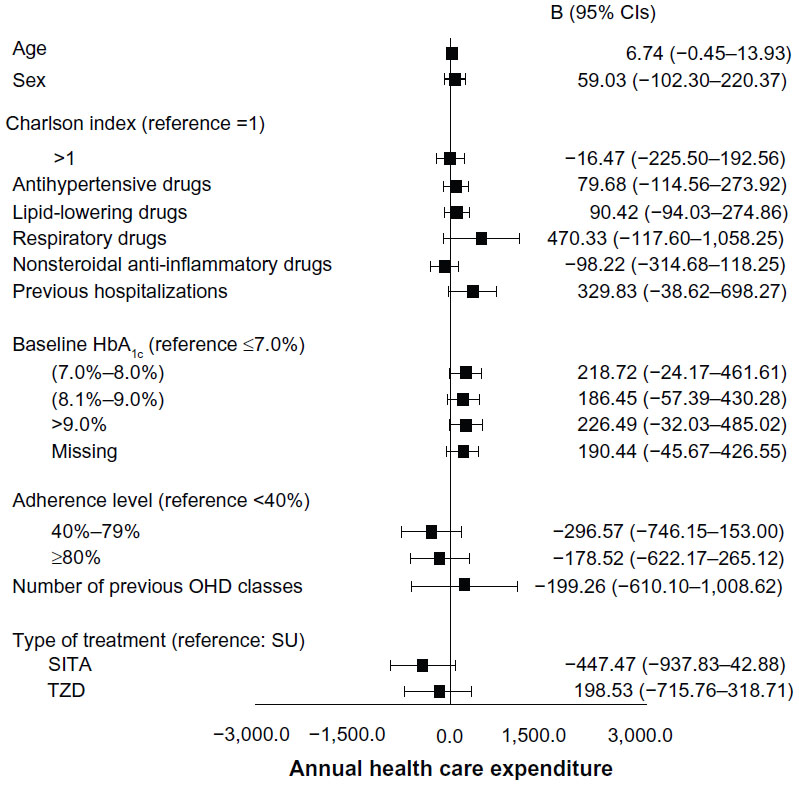 | Figure 5 Multivariate regression analysis. |
Discussion
The American Diabetes Association and the European Association for the Study of Diabetes stated that metformin, if not contraindicated and if tolerated, is the preferred and most cost-effective first-line agent for treating T2DM patients.21 If metformin monotherapy did not achieve the recommended HbA1c target, another OHD could be chosen as an add-on treatment.21 The number of available second-line pharmacotherapies has expanded in the last years, and new agents such as TZD and DPP-4 inhibitors, that are more expensive when compared to older drugs like SU, are now available.22 In light of the numerous available options for treatment, the question about what is the best agent to be added to metformin in clinical practice is particularly relevant since data from clinical trials comparing different agents head-to-head as a second-line treatment following metformin failure in maintaining glycemic control are lacking.23 Hence, there is the need in real-world practice to evaluate whether newer agents offer significant advantages over older therapies in terms of safety, efficacy, and resource allocation.
The information used in our study is based on a data linkage at individual level between different administrative data sources, such as those for hospital discharge diagnoses and pharmaceutical claims, that have been used successfully as sources of information for diabetes monitoring, since the information is usually not expensive and time-consuming to collect.24–26 Moreover, the availability of clinical data – ie, laboratory test results such as serum glucose and HbA1c levels – allowed us to define more precisely the characteristics of the T2DM patients enrolled. We found that in diabetic patients who did not achieve their HbA1c target with metformin therapy, the three modalities of add-on therapy had similar improvements in HbA1c levels. Recently, two meta-analyses27,28 that evaluated the efficacy and safety of adding to metformin a different second choice of OHDs, concluded that DPP-4 inhibitors may be considered a viable treatment to be associated with metformin because of their glycemic effect, which is comparable to the effect of SU or TZD. Our findings are aligned with this conclusion regarding a direct comparison of SITA against SU or TZD.
The discontinuation rate of 14.4% observed in our SITA-treated diabetic patients (combining 3.6% of those who suspended all OHDs and 10.8% of those who replaced SITA with another OHD) was significantly lower than the discontinuation rate of 30.7% (5.3% + 25.4%) and 24.8% (5.6% + 19.2%) recorded, respectively, in SU- and TZD-treated patients. Moreover, an adherence rate ≥80% was significantly more frequent in SITA- than in SU- or TZD-treated patients (79.5% versus 53.5% and 62.8%, respectively). Overall, when patients receiving SITA were compared with those receiving SU or TZD, the SITA-treated patients showed an improved persistence and adherence to treatment, as was also documented in another observational study performed in Spain.29 This is a relevant clinical point since patient compliance, adherence, and persistence in maintaining therapeutic treatment is a complex situation that includes patient and treatment regimen factors that may ultimately provide a barrier to medication adherence.30 An average estimate of patient nonadherence is 32.5% in patients with diabetes, in spite of data from clinical trials that showed that pharmacological treatment reduces long-term complications.31
We found that those metformin-treated patients who were prescribed SITA as an add-on treatment had better outcomes than those prescribed an SU or a TZD as an add-on treatment. In fact, we found that patients who were SITA-treated suffered a lower incidence of hospitalization for any reason than patients who were SU- or TZD-treated, and the multivariable logistic regression model had provided evidence for a significant contribution of SITA treatment.
In this observational study, the nonrandomized treatment allocation might have produced study groups that were not similar in terms of their baseline characteristics, and this may have altered the observed reduction of the number of events occurred during the observation period. However, the results obtained after the propensity score-matching analysis slightly reduced the rate of hospitalization for any reason, but they confirmed the robustness of our findings. Moreover, the role of SITA in reducing hospitalization for cardiovascular reasons was similar to the effect observed with the other drugs. It is likely that the number of patients evaluated and the length of follow-up were not enough to point out the possible differences in determining cardiovascular outcomes. Since metformin is recommended as a first-line treatment for most T2DM patients, our results may have important implications for the choice of the second-line agent in these patients.
At present, data regarding the cost effectiveness of DPP-4 inhibitors are still being debated.32 A systematic review of economic studies that compared the cost effectiveness of DPP-4 inhibitors and TZD did not reach a conclusive result.33 Moreover, data from two studies conducted in Europe showed the improved cost-effectiveness profile of the association of DPP-4 inhibitors/metformin when compared with the association of SU/metformin.34,35 On the contrary, economic evaluations performed in North America provided evidence for the improved cost-effectiveness profile of the association between SU/metformin when compared with the association between DPP-4 inhibitors/metformin,36,37 and these evaluations emphasized that the increasing use of DPP-4 at the expense of SU could cause a significant increase in the costs of health care systems. Our analysis of health care costs has shown a total annual cost that was higher in SITA-treated patients when compared with SU and TZD treatments (€972 versus €706 and €908, respectively). The difference was mainly due to the price of SITA, since costs for outpatient services were similar among the three groups of patients, while the costs for hospital admissions were lower in the SITA- than in SU- and TZD-treated patients. The generalized linear model that we used to estimate the association between health care costs and the type of OHD treatment, after adjusting for the baseline characteristics of the patients, did not yield a significant difference in health care costs among the three groups of patients.
Some limitations are present in our work. Firstly, this is an observational study and the results must be interpreted with caution. Our results may be influenced by a selection bias in that physicians may have prescribed or stopped SITA in patients according to patients’ clinical characteristics, which cannot be identified in the present analysis. Secondly, we were not able to fully adjust for unmeasured confounders, such as blood pressure or body weight. For example, SITA may have been prescribed for heavier patients because of its neutral effect on weight gain.38 Thirdly, the small number of deaths in any treatment group made meaningful statistical analysis difficult. For this health outcome, analyses should be conducted on a larger population and/or with longer follow-up times. Finally, we did not examine the site effect, which could have confounded the association between the type of treatment and health care costs.
Conclusion
In conclusion, the combination of SITA plus metformin for the treatment of uncontrolled T2DM offers an opportunity for pharmacological treatment that is successful and well tolerated. Our observational data provide evidence of the comparative effectiveness and safety of this agent, and support the recommendations of current clinical practice guidelines to use SITA as needed in people with diabetes. Regarding health care costs, a longer follow-up period could better clarify to what extent the higher cost of the drug could be counterbalanced by the reduction rate in hospitalizations.
Acknowledgments
The development of this study was neither funded nor supported. The writing of this manuscript was supported with an unrestricted grant by Merck Sharp and Dohme Corp, which played no role in the design of the study, the analysis, or the interpretation of the findings, nor in the preparation, review, and approval of the manuscript.
Disclosure
The authors report no conflicts of interest in this work.
References
International Diabetes Federation [webpage on the Internet]. Diabetes atlas, 6th edition. Brussels, Belgium: International Diabetes Federation; 2009. Available from: http://www.diabetesatlas.org/content/diabetes. Accessed March 29, 2013. | |
Grundy SM, Benjamin IJ, Burke GL, et al. Diabetes and cardiovascular disease: a statement for healthcare professionals from the American Heart Association. Circulation. 1999;100(10):1134–1146. | |
Sobel BE, Schneider DJ. Cardiovascular complications in diabetes mellitus. Curr Opin Pharmacol. 2005;5(2):143–148. | |
National Diabetes Information Clearinghouse [webpage on the Internet]. National diabetes statistics, 2011. Available from:http://diabetes.niddk.nih.gov/statistics/index.aspx. Accessed March 29, 2013. | |
Lauro R, Nicolucci A. Public Health and Health Policy: An Informed Health Policy on Chronic Diseases. Scientific Editor: Consorzio Mario Negri Sud; 2011. | |
Nathan DM, Buse JB, Davidson MB, et al; American Diabetes Association; European Association for the Study of Diabetes. Medical management of hyperglycaemia in type 2 diabetes mellitus: a consensus algorithm for the initiation and adjustment of therapy: a consensus statement from the American Diabetes Association and the European Association for the Study of Diabetes. Diabetologia. 2009;52(1):17–30. | |
American Diabetes Association. Standard of medical care in diabetes – 2012. Diabetes Care. 2012;35(Suppl 1):S11–S13. | |
Freeman JS. Managing hyperglycemia in patients with type 2 diabetes mellitus: rationale for the use of dipeptidyl peptidase-4 inhibitors in combination with other oral antidiabetic drugs. J Am Osteopath Assoc. 2010;110(9):528–537. | |
Degli Esposti L, Saragoni S, Buda S, Sturani A, Degli Esposti E. Glycemic control and diabetes-related health care costs in type 2 diabetes; retrospective analysis based on clinical and administrative databases. Clinicoecon Outcomes Res. 2013;5:193–201. | |
Di Bari M, Balzi D, Roberts AT, et al. Prognostic stratification of older persons based on simple administrative data: development and validation of the “Silver Code,” to be used in emergency department triage. J Gerontol A Biol Sci Med Sci. 2010;65(2):159–164. | |
Ministero del lavoro, della Salute e delle Politiche Sociali. Rapporto annuale sulle attività di ricovero ospedaliero [Annual report on the activities of hospitalization]. 2009. Available from: http://www.salute.gov.it/imgs/C_17_pubblicazioni_1491_allegato.pdf. Accessed December 22, 2013. Italian. | |
Centers for Disease Control and Prevention [homepage on the Internet] International Classification of Diseases, Ninth Revision, Clinical Modification (ICD-9-CM); [updated 2010 Sep 21; reviewed 2010 Sep 21; cited 2010 Nov 23]. Available from: http://www.cdc.gov/nchs/icd/icd9cm.htm. Accessed May, 13, 2013. | |
Charlson ME, Pompei P, Ales KL, MacKenzie CR. A new method of classifying prognostic comorbidity in longitudinal studies: development and validation. J Chronic Dis. 1987;40(5):373–383. | |
American Diabetes Association. Diagnosis and classification of diabetes mellitus. Diabetes Care. 2010;33(Suppl 1):S62–S69. | |
Farmer KC. Methods for measuring and monitoring medication regimen adherence in clinical trials and clinical practice. Clin Ther. 1999;21(6):1074–1090; discussion 1073. | |
Cohen HW, Shmukler C, Ullman R, Rivera CM, Walker EA. Measurements of medication adherence in diabetic patients with poorly controlled HbA(1c). Diabet Med. 2010;27(2):210–216. | |
L’Informatore farmaceutico italiano [The Italian pharmaceutical informer]. Italy: Elsevier; 2012. Available from: http://www.informatorefarmaceutico.it/. Accessed April 11, 2013. Italian. | |
Gary TL, Crum RM, Cooper-Patrick L, Ford D, Brancati FL. Depressive symptoms and metabolic control in African-Americans with type 2 diabetes. Diabetes Care. 2000;23(1):23–29. | |
Skaer TL, Sclar DA, Markowski DJ, Won JK. Effect of value-added utilities on prescription refill compliance and Medicaid health care expenditures – a study of patients with non-insulin-dependent diabetes mellitus. J Clin Pharm Ther. 1993;18(4):295–299. | |
Barber J, Thompson S. Multiple regression of cost data: use of generalised linear models. J Health Serv Res Policy. 2004;9(4):197–204. | |
Inzucchi SE, Bergenstal RM, Buse JB, et al; American Diabetes Association (ADA); European Association for the Study of Diabetes (EASD). Management of hyperglycemia in type 2 diabetes: a patient-centered approach: position statement of the American Diabetes Association (ADA) and the European Association for the Study of Diabetes (EASD). Diabetes Care. 2012;35(6):1364–1379. | |
McIntosh B, Cameron C, Singh SR, Yu C, Ahuja T, Welton NJ, Dahl M. Second-line therapy in patients with type 2 diabetes inadequately controlled with metformin monotherapy: a systematic review and mixed-treatment comparison meta-analysis. Open Med. 2011;5(1):e35–e48. | |
Esposito K, Ceriello A, Giugliano D. Does personalized diabetology overcome clinical uncertainty and therapeutic inertia in type 2 diabetes? Endocrine. 2013;44(2):343–345. | |
Hux JE, Ivis F, Flintoft V, Bica A. Diabetes in Ontario: determination of prevalence and incidence using a validated administrative data algorithm. Diabetes Care. 2002;25(3):512–516. | |
Solberg LI, Engebretson KI, Sperl-Hillen JM, Hroscikoski MC, O’Connor PJ. Are claims data accurate enough to identify patients for performance measures or quality improvement? The case of diabetes, heart disease, and depression. Am J Med Qual. 2006;21(4):238–245. | |
Brown JB, Nichols GA, Glauber HS. Case-control study of 10 years of comprehensive diabetes care. West J Med. 2000;172(2):85–90. | |
McIntosh B, Cameron C, Singh SR, et al. Second-line therapy in patients with type 2 diabetes inadequately controlled with metformin monotherapy: a systematic review and mixed-treatment comparison meta-analysis. Open Med. 2011;5(1):e35–e48. | |
Phung OJ, Scholle JM, Talwar M, Coleman CI. Effect of noninsulin antidiabetic drugs added to metformin therapy on glycemic control, weight gain, and hypoglycemia in type 2 diabetes. JAMA. 2010;303(14):1410–1418. | |
Sicras Mainar A, Roldán Suárez C, Font Ramos B, Navarro Artieda R, Ibáñez Nolla J. Clinical and economical consequences of the combination of metformin with dipeptidyl peptidase inhibitors in type 2 diabetes patients. Rev Clin Esp. 2013;213(8):377–384. | |
Jin J, Sklar GE, Min Sen Oh V, Chuen Li S. Factors affecting therapeutic compliance: A review from the patient’s perspective. Ther Clin Risk Manag. 2008;4(1):269–286. | |
Bailey CJ, Kodack M. Patient adherence to medication requirements for therapy of type 2 diabetes. Int J Clin Pract. 2011;65(3):314–322. | |
Zhang Y, McCoy RG, Mason JE, Smith SA, Shah ND, Denton BT. Second-line agents for glycemic control for type 2 diabetes: are newer agents better? Diabetes Care. 2014 May;37(5):1338–1345. | |
Waugh N, Cummins E, Royle P, et al. Newer agents for blood glucose control in type 2 diabetes: systematic review and economic evaluation. Health Technol Assess. 2010;14(36):1–248. | |
Schwarz B, Gouveia M, Chen J, et al. Cost-effectiveness of sitagliptin-based treatment regimens in European patients with type 2 diabetes and haemoglobin A1c above target on metformin monotherapy. Diabetes Obes Metab. 2008;10 Suppl 1:43–55. | |
Granström O, Bergenheim K, McEwan P, Sennfält K, Henriksson M. Cost-effectiveness of saxagliptin (Onglyza®) in type 2 diabetes in Sweden. Prim Care Diabetes. 2012;6(2):127–136. | |
Sinha A, Rajan M, Hoerger T, Pogach L. Costs and consequences associated with newer medications for glycemic control in type 2 diabetes. Diabetes Care. 2010;33(4):695–700. | |
Klarenbach S, Cameron C, Singh S, Ur E. Cost-effectiveness of second-line antihyperglycemic therapy in patients with type 2 diabetes mellitus inadequately controlled on metformin. CMAJ. 2011;183(16):E1213–E1220. | |
Reid T. Choosing GLP-1 receptor agonists or DPP-4 inhibitors: weighing the clinical trial evidence. Clinical Diabetes. 2012;30(1):3–12. |
 © 2014 The Author(s). This work is published and licensed by Dove Medical Press Limited. The
full terms of this license are available at https://www.dovepress.com/terms.php
and incorporate the Creative Commons Attribution
- Non Commercial (unported, v3.0) License.
By accessing the work you hereby accept the Terms. Non-commercial uses of the work are permitted
without any further permission from Dove Medical Press Limited, provided the work is properly
attributed. For permission for commercial use of this work, please see paragraphs 4.2 and 5 of our Terms.
© 2014 The Author(s). This work is published and licensed by Dove Medical Press Limited. The
full terms of this license are available at https://www.dovepress.com/terms.php
and incorporate the Creative Commons Attribution
- Non Commercial (unported, v3.0) License.
By accessing the work you hereby accept the Terms. Non-commercial uses of the work are permitted
without any further permission from Dove Medical Press Limited, provided the work is properly
attributed. For permission for commercial use of this work, please see paragraphs 4.2 and 5 of our Terms.