
Back to Journals » Neuropsychiatric Disease and Treatment » Volume 22
Clinical Application of Resting-State Functional MRI for Individualized Localization of Core Language Areas in Patients with Drug-Resistant Epilepsy: An Observational Study
Authors Wang M, Cui X, Zhang Y, Wang R, Yan Y, Zhou L, Fan Z, Li W
Received 2 December 2025
Accepted for publication 30 June 2026
Published 14 July 2026 Volume 2026:22 585990
DOI https://doi.org/10.2147/NDT.S585990
Checked for plagiarism Yes
Review by Single anonymous peer review
Peer reviewer comments 2
Editor who approved publication: Professor Taro Kishi
Meng Wang,1,2,* Xuehua Cui,1,2,* Ya Zhang,3 Ruxue Wang,4 Yuxiang Yan,4 Lixia Zhou,5 Zhenzeng Fan,1,2 Wenling Li1,2
1Department of Neurosurgery, The Second Hospital of Hebei Medical University, Shijiazhuang, 050000, People’s Republic of China; 2Key Laboratory of Clinical Neurology, Ministry of Education, Hebei Medical University, Shijiazhuang, Hebei, 050000, People’s Republic of China; 3Department of Medical Equipment, The Second Hospital of Hebei Medical University, Shijiazhuang, 050000, People’s Republic of China; 4School of Biomedical Engineering, Tsinghua University, Beijing, 100084, People’s Republic of China; 5Department of Medical Imaging, The Second Hospital of Hebei Medical University, Shijiazhuang, 050000, People’s Republic of China
*These authors contributed equally to this study
Correspondence: Wenling Li, Department of Neurosurgery, The Second Hospital of Hebei Medical University, No. 215 Heping Road, Shijiazhuang, Hebei, 050000, People’s Republic of China, Tel +86-311-66002943, Email [email protected]
Background: This preliminary study aimed to evaluate the clinical utility of resting-state functional magnetic resonance imaging (rs-fMRI) as an individualized tool for localizing core language areas in patients undergoing epilepsy surgery.
Methods: A retrospective analysis was conducted on 31 patients with drug-resistant epilepsy who underwent rs-fMRI–based language localization and stereo-electroencephalography (SEEG). The rs-fMRI data were processed using seed-based correlation analysis. Two neurosurgeons independently reviewed the data and reached a consensus on the rs-fMRI localization results. Language function outcomes derived from electrical stimulation of language-related electrodes during SEEG were independently analyzed and documented by two additional physicians. The consistency rate between rs-fMRI–identified language regions and the effects observed during electrical stimulation was subsequently calculated to compare the two techniques.
Results: In the Broca area, left- and right-hemisphere dominance occurred in equal proportions, with an asymmetric subregional distribution (predominantly pars triangularis on the left and pars opercularis on the right). Lateralization in the Wernicke area was less clear, with similar proportions of left, right, and bilateral representation. SEEG validation showed that when rs-fMRI indicated unilateral localization, it reliably identified SEEG stimulation-negative regions (specificity ≥ 94%), but its sensitivity was low (33%– 50%), meaning that it frequently missed SEEG stimulation-positive areas. When rs-fMRI showed bilateral Wernicke localization, its diagnostic performance was poor (specificity only 27.3%, with a negative AC1).
Conclusion: Resting-state fMRI identified language reorganization in 54.8% broca and 64.5% wernicke patients with drug-resistant epilepsy, suggesting atypical or non-left-dominant language lateralization. Before surgery involving critical language areas, rs-fMRI scanning can be considered as an auxiliary tool to localize core language regions. When rs-fMRI shows unilateral localization and the area is non-core, it might reduce the need for implanting SEEG electrodes for language mapping in that region. However, in cases of bilateral Wernicke core localization, additional language mapping methods should be combined. These preliminary findings require validation in larger prospective cohorts.
Keywords: core language areas, drug-resistant epilepsy, intracranial stereoelectroencephalography, localization, resting-state functional MRI
Introduction
Epilepsy accounts for approximately 0.75% of the global disease burden, affecting nearly 65 million individuals worldwide. In China, the lifetime prevalence has been reported to be 7.0 per 1,000 individuals, with an active prevalence of 4.6 per 1,000 individuals.1 Epilepsy is associated with increased morbidity and mortality and significantly affects patients’ quality of life. Evidence indicates that 60% to 70% of patients respond favorably to antiepileptic drugs, while 30% to 40% exhibit drug resistance.2 Drug-resistant epilepsy (also known as refractory epilepsy) is defined by the International League Against Epilepsy (ILAE) as the failure of adequate trials of two tolerated, appropriately chosen and used antiepileptic drug (AED) schedules (whether as monotherapies or in combination) to achieve sustained seizure freedom. For patients with drug-resistant epilepsy, surgical resection of the epileptogenic zone remains one of the most effective therapeutic options.3 However, preservation of language function during surgical intervention is essential, as resection involving core language areas can result in irreversible language deficits.4
The human language network is broadly divided into anterior and posterior components.5 In clinical neuroanatomy, the anterior language region corresponds primarily to Broca’s area, located in the left inferior frontal gyrus, whereas the posterior region corresponds to Wernicke’s area, which is situated in the posterior part of the left superior temporal gyrus.6 The precise extent and functional boundaries of these regions remain a subject of ongoing research.7
In neurotypical adults, language processing is predominantly supported by a left-lateralized frontotemporal functional network. Approximately 95% of right-handed adults demonstrate left-hemisphere language dominance.8 Among left-handed or ambidextrous individuals, approximately 80% retain this pattern.9 Left-hemisphere dominance represents typical language lateralization, while right-hemisphere or bilateral dominance is considered atypical. Increasing evidence indicates that individuals with epilepsy are more likely to exhibit right-hemisphere or symmetric language representation compared with the general population.9
The Wada test remains the traditional gold standard for determining hemispheric language dominance.10 Despite its historical significance, the Wada test is invasive, lacks standardization, offers limited spatial resolution, and presents interpretive challenges, thus restricting its clinical applicability. Reported complications from 74 Wada test cases included encephalopathy (7.2%), seizures (1.2%), stroke (0.6%), transient ischemic attack (0.6%), localized hemorrhage at the catheter insertion site (0.6%), carotid artery dissection (0.4%), contrast-induced allergic reaction (0.3%), bleeding at the catheter insertion site (0.1%), and infection (0.1%).11
At present, the clinical gold standard for localizing language areas involves cortical electrical stimulation, performed through subdural electrodes, intracranial stereo-electroencephalography (SEEG), or cortical surface electrode placement during awake craniotomy.12 However, these approaches are invasive, resource-intensive, and require strong patient cooperation, and may not be suitable for all clinical scenarios. Consequently, increasing attention has been directed toward functional magnetic resonance imaging (fMRI)–based methods for language lateralization and localization, including task-based and resting-state modalities.
Task-based fMRI requires active participation during language tasks, which may pose challenges for patients with cognitive dysfunction or language deficits. Pediatric patients, in particular, often cannot comply with task-based protocols. Cognitive impairment is commonly observed among patients with drug-resistant epilepsy, further limiting the applicability of task-based methods. In contrast, resting-state fMRI (rs-fMRI) offers a promising alternative for localizing and lateralizing language areas without requiring task performance.
Rs-fMRI, developed by Biswal et al in 1995,13 enables functional brain mapping without requiring patients to perform specific tasks—scans are conducted while subjects remain awake, relaxed, and free of targeted cognitive activity. Its core principle is analyzing correlations in spontaneous, low-frequency blood-oxygen-level-dependent (BOLD) signal fluctuations to map functional connectivity between brain regions and identify functional networks.14 The theoretical foundation lies in the brain’s intrinsic functional connectivity: though accounting for only 2% of body weight, the brain consumes 20% of total resting energy,15 with 80% dedicated to internal communication.16,17 The language system is an intrinsic, persistent network,18 and numerous studies confirm that spatially distributed, anatomically non-contiguous brain regions exhibit highly correlated spontaneous neural activity at rest, forming a language-related intrinsic network.19 This network is not fixed—it develops during childhood language acquisition and is shaped by linguistic experience,20,21 with connectivity differences observed between bilinguals and monolinguals, as well as literate and illiterate individuals.22,23
Primary rs-fMRI data analysis methods include seed-based correlation analysis (SCA), independent component analysis (ICA), graph theory analysis, regional homogeneity, and amplitude of low-frequency fluctuations. SCA, a classic hypothesis-driven method, calculates functional connectivity by correlating predefined seed voxel time series with all other voxels,24 but its results depend on seed selection and cannot distinguish direct/indirect connections. ICA, a data-driven approach, decomposes massive voxel time series into independent neurophysiological or noise signals,18 requiring no pre-specified seeds and effectively separating noise, though it demands pre-defining component numbers, involves heavy computation, and may yield subjective interpretations. Graph theory analysis, regional homogeneity, and amplitude of low-frequency fluctuations complementarily reveal the language network’s static organization and dynamic foundations from global topology, local synchronization, and local activity intensity.25–27 A key challenge in clinical application is applying group-level language network templates to individual patients28—using healthy population-derived “standard” maps as reference requires calibration with individualized data to detect “outlier” brain regions/connections as language core hubs.
The present study utilized rs-fMRI to identify individualized core language areas with seed-based correlation analysis and evaluated the consistency between rs-fMRI–derived results and cortical electrical stimulation mapping conducted via SEEG.29
Methods
Participants
Between November 2019 and May 2024, 34 patients with drug-resistant epilepsy underwent both rs-fMRI and SEEG at the Second Hospital of Hebei Medical University. Three patients were excluded due to unreliable resting-state data, resulting in a final cohort of 31 patients. The institutional review board of the hospital approved this retrospective study (Approval No. 2023-R643).
Imaging Techniques
Two MRI systems from Philips and GE were utilized for image acquisition. The Philips Achieva 3.0T MRI scanner equipped with a 16-channel coil was used to obtain T1-weighted high-resolution structural images and rs-fMRI sequences. T1-weighted sagittal scan parameters included repetition time (TR) = 7.6 ms, echo time (TE) = 3.7 ms, flip angle (FA) = 8°, number of slices = 180, slice thickness = 1.0 mm, field of view (FOV) = 230 mm × 180 mm, matrix size = 232 × 230, and voxel size = 1.0 mm × 1.0 mm × 2.0 mm. The rs-fMRI sequence employed a gradient echo–planar imaging (GRE-EPI) protocol with the following parameters: TR = 2000 ms, TE = 30 ms, FA = 90°, FOV = 220 mm × 220 mm, matrix size = 72 × 73, number of slices = 32, slice thickness = 4 mm, slice gap = 0 mm, and voxel size = 3.0 mm × 3.0 mm × 4.0 mm.
For the GE SIGNA Architect MRI scanner with a 48-channel coil, the T1-weighted sagittal scan parameters included TR = 6.8 ms, TE = 2.7 ms, inversion time (TI) = 600 ms, FA = 8°, slice thickness = 0.5 mm, FOV = 220 mm × 200 mm, matrix size = 200 × 200, and voxel size = 1.0 mm × 1.0 mm × 1.0 mm. The rs-fMRI sequence used the GRE-EPI technique, following a plane parallel to the gyrus rectus, with TR = 3000 ms, TE = 35 ms, FA = 90°, FOV = 220 mm × 220 mm, matrix size = 80 × 80, number of slices = 36, slice thickness = 4 mm, slice gap = 0 mm, and voxel size = 2.8 mm × 2.8 mm × 4.0 mm. Previous findings have demonstrated high inter-vendor and test–retest reliability for rs-fMRI performed across different 3T MRI systems.30
During scanning, patients were instructed to remain awake, keep their eyes closed, and minimize head motion.
Data Processing
The rs-fMRI data were processed using in-house MATLAB R2017a (Linux) scripts.31 Preprocessing followed established protocols and included:32–34 (1) discarding the initial four volumes of each run to allow for T1 equilibration; (2) slice-timing correction; (3) head-motion correction through rigid-body translation and rotation using the FSL software package (Jenkinson et al, 2002; Smith et al, 2004); (4) resampling the data to a 2-mm isotropic voxel resolution; (5) temporal filtering to remove constant offsets and linear trends while retaining frequencies below 0.08 Hz; (6) spatial smoothing using a 4-mm full-width at half-maximum Gaussian kernel; and (7) regression of nuisance signals, including six head-motion parameters, global mean signal, ventricular signal, and deep white matter signal.
After preprocessing, a seed-based functional connectivity analysis was conducted to delineate the individualized language network. The seed regions were positioned within Broca’s and Wernicke’s area–related areas (Figure 1). Thresholded maps (Lower limit 0.35–0.98, Upper limit 0.99) were generated to highlight high-probability language nodes, and the resulting images were exported in TIFF format for clinical review.
 |
Figure 1 Seed regions utilized for resting-state functional connectivity analysis. The seeds were positioned within Broca’s and Wernicke’s areas to delineate individualized language networks in patients with drug-resistant epilepsy. |
We assessed the reproducibility of the fMRI language localization results by running the same patient’s data twice, one week apart, with different operators, and obtained identical results. The overlap rate of the main activation regions was 100%, indicating that the analysis pipeline was stable.
Localization
Visualization results were displayed across a range of threshold values, with lower limits set at 0.35, 0.4, 0.45, 0.5, 0.55, 0.6, 0.65, 0.7, 0.75, 0.8, 0.85, 0.9, 0.95, and 0.98, and a uniform upper limit of 0.99. The size of the language area was inversely correlated with the threshold range; higher thresholds corresponded to smaller, more specific activation regions. The core language area was defined as a cluster of approximately 1 cm2 within the corresponding threshold range. If such an area was not detected, the region observed between thresholds of 0.98 and 0.99 was designated as the core language area. The absence of a core functional area was defined as the failure to identify Broca’s or Wernicke’s regions within the 0.35 to 0.99 threshold range.
Language Area Identification
The anterior language area was defined as the cortical region located above and anterior to the lateral fissure, encompassing Broca’s area and its contralateral homologues within the bilateral inferior frontal gyrus.35 Broca’s area was anatomically subdivided into the pars opercularis, pars triangularis, and pars orbitalis. The posterior language area was defined as the region located below and posterior to the lateral fissure, corresponding to Wernicke’s area and its right-hemisphere homologues within the bilateral posterior superior temporal gyrus (Figure 2).36
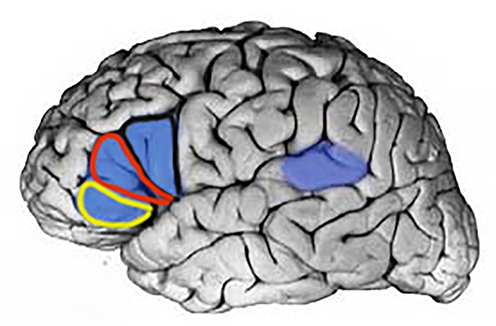 |
Figure 2 Anatomical localization of Broca’s and Wernicke’s areas. Broca’s area (blue) and Wernicke’s area (purple) are illustrated. Broca’s area is subdivided into the pars opercularis (outlined in black), pars triangularis (outlined in red), and pars orbitalis (outlined in yellow). |
Parameters for SEEG Electrical Cortical Stimulation
For SEEG-based cortical stimulation, the parameters were as follows: current = 1–5 mA, frequency = 50 Hz, stimulation duration = 5 s per site, and a minimum inter-stimulation interval of 10s.
SEEG Electrical Cortical Stimulation Results Identification
A positive SEEG response was defined as a non-volitional interruption of language tasks (listening, speaking, reading, or writing) during stimulation under the specified parameters while patients cyclically performed these tasks. Normal task performance during stimulation was classified as a negative response.
Statistical Analysis
SPSS 32.0 software (IBM Corp., Armonk, NY, USA) were used for statistical analysis. Continuous variables conforming to normal distribution were expressed as mean ± standard deviation (SD), skewed continuous variables as median (interquartile range), and categorical variables as counts and percentages. Fisher’s exact test or chi-square test was used to compare categorical variables between groups.
Results
A total of 31 patients were included, comprising 16 (51.6%) males and 15 (48.5%) females. Median age was 17 years, and median disease duration was 8 years. The lateralization and localization of epileptogenic zones were as follows: 23 (74.2%) patients exhibited epileptogenic foci in the left hemisphere, and 8 (25.8%) patients exhibited right-hemisphere foci. Of the total cohort, 30 (96.8%) patients underwent SEEG thermal coagulation ablation (excluding one case who did not receive thermal ablation), and 18 (58.1%) patients proceeded to surgical resection. Postoperative pathological diagnoses included focal cortical dysplasia (FCD) in 12 (38.7%) cases, microcortical dysplasia (mMCD) in 1 case, encephalomalacia in 4 cases, and tuberous sclerosis in 1 case. Postoperative outcomes indicated that 14 patients (77%) achieved International League Against Epilepsy (ILAE) grade 1, 2 patients (6%) achieved grade 3, 1 patient (3%) achieved grade 4, and 1 patient (3%) achieved grade 5 seizure control. No patient demonstrated postoperative language dysfunction. The demographic and clinical characteristics are presented in Table 1.
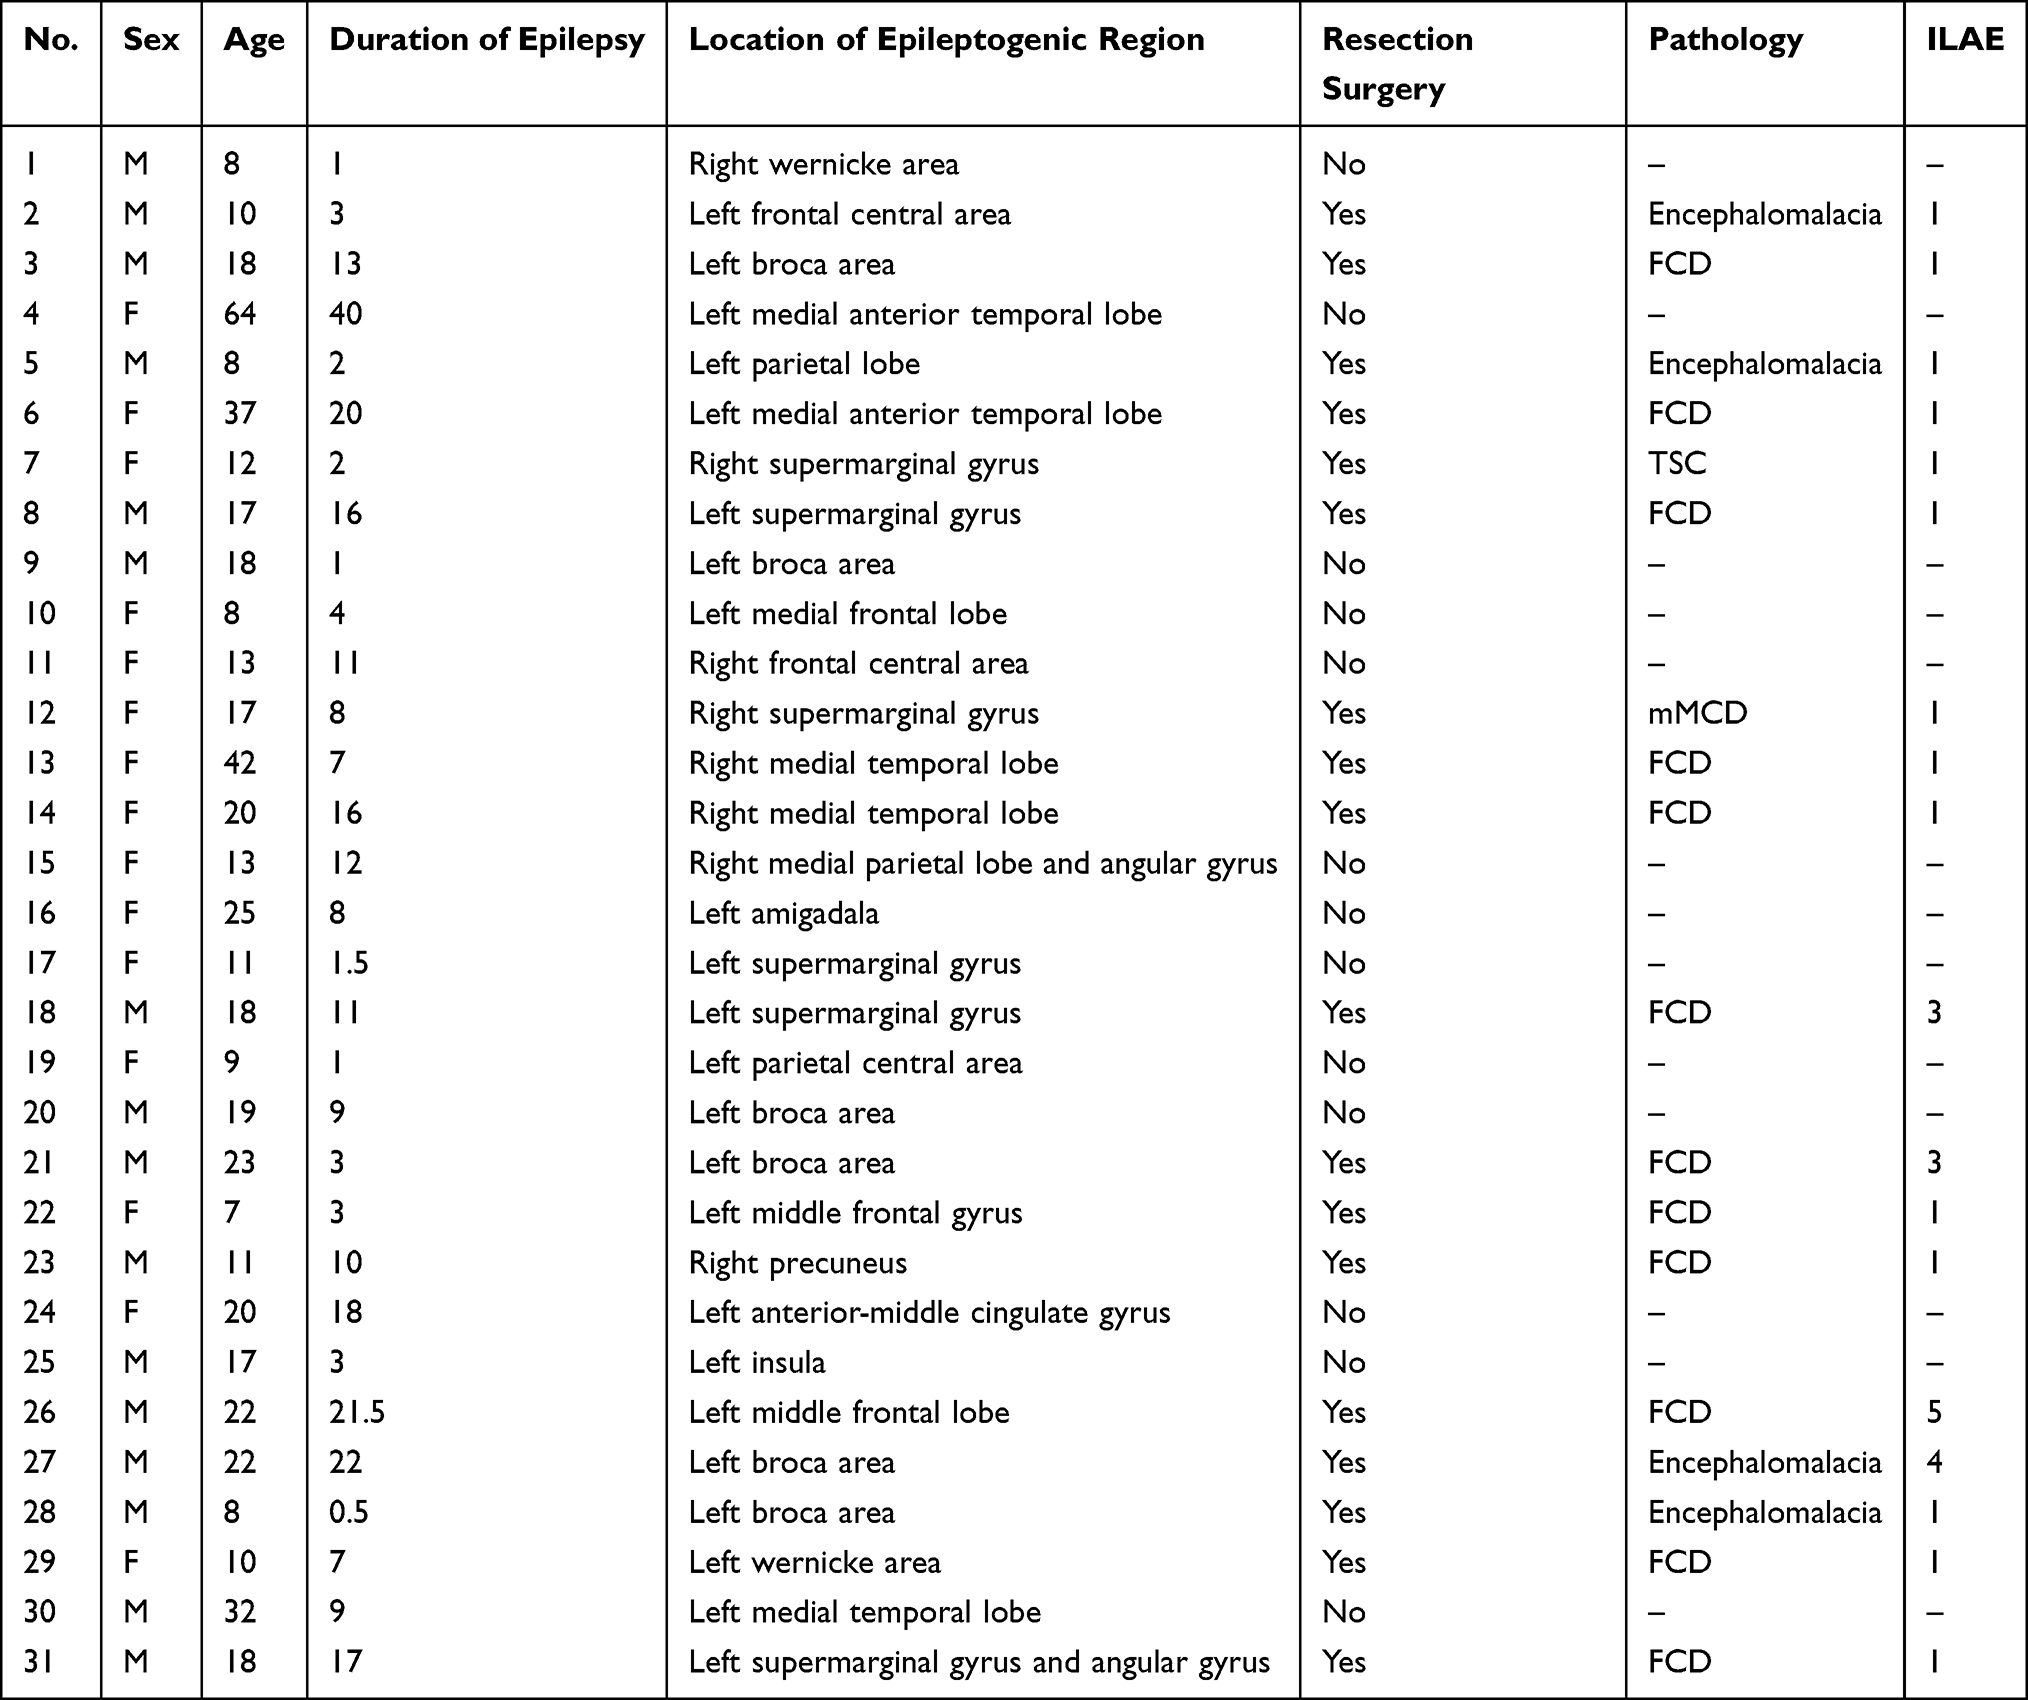 |
Table 1 Demographic and Clinical Characteristics of the 31 Patients with Drug-Resistant Epilepsy Who Underwent Rs-fMRI and SEEG |
Language Localization results
The results of the Broca’s and Wernicke’s core language areas for 31 patients are shown in the Figures. Place them in numerical order. For unilateral cores, show only one image; for bilateral cores, show two images (Figures 3, 4).
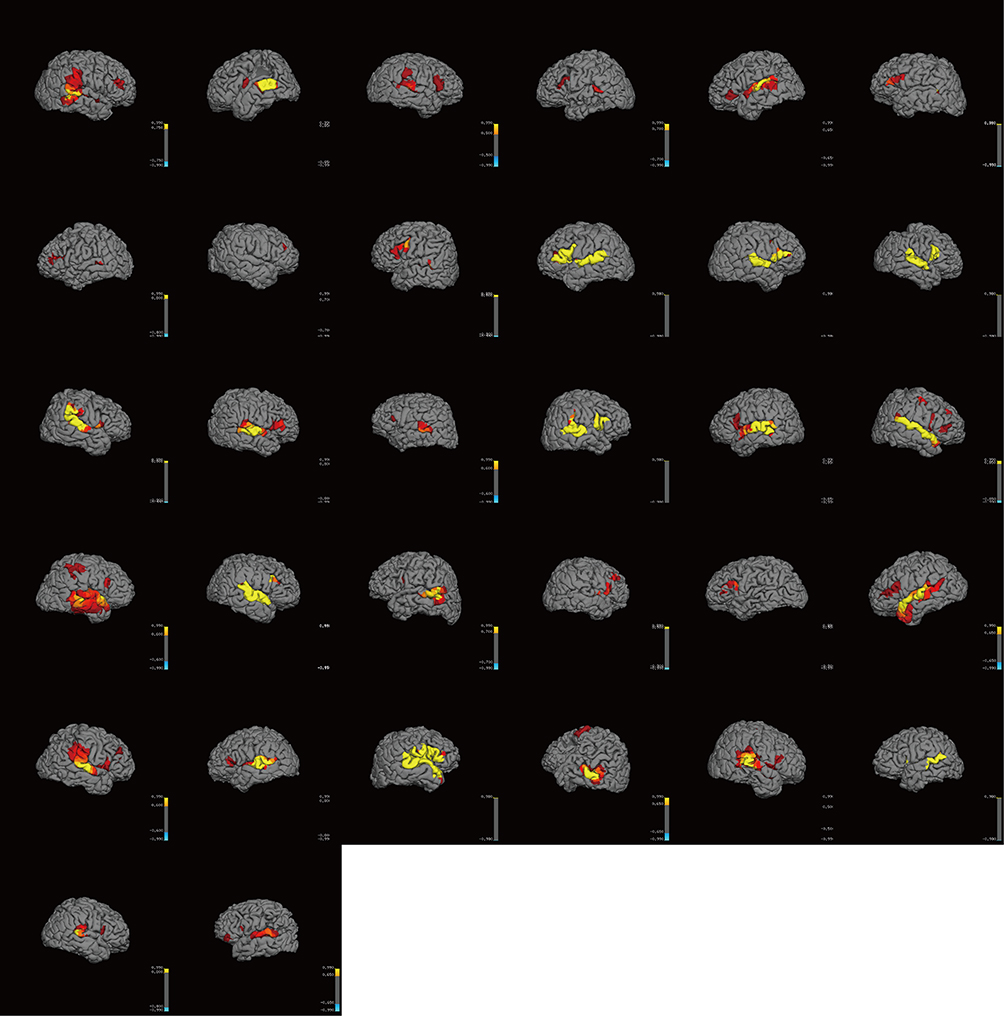 |
Figure 3 Broca core areas of 31 patients. One patient (No. 12) had no Broca’s core and was therefore not shown in the figure. Two patients had bilateral cores, each with two images. The remaining 28 patients each had one image. |
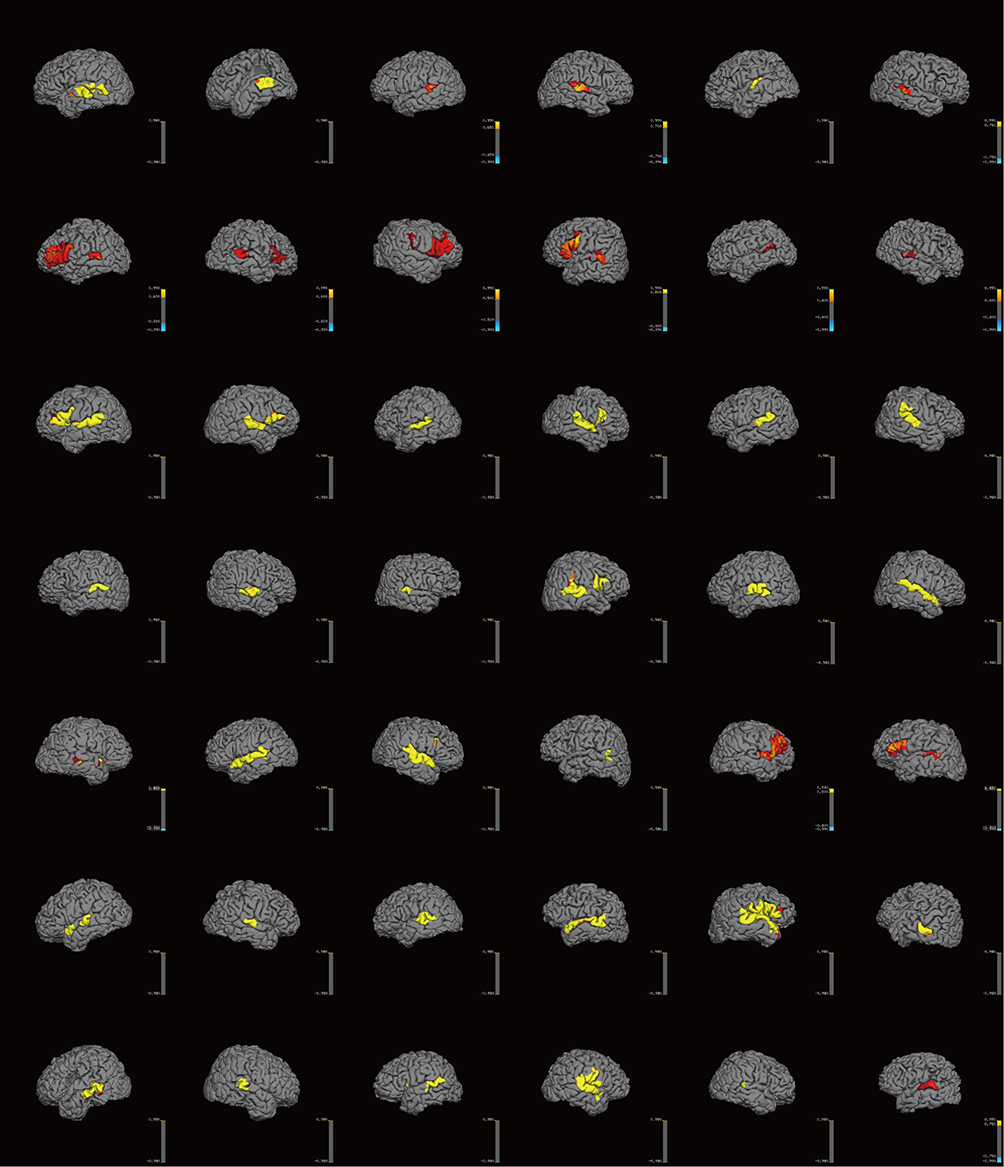 |
Figure 4 Wernicke core areas of 31 patients. For the 11 patients with bilateral Wernicke’s core areas, two images are shown per patient; for the others, one image each. Images are arranged in ascending order of patient code. |
Broca’s Core Area Localization
A total of 31 patients were included. Unilateral language core area localization was observed in 28 patients (90.3%), including 14 in the left hemisphere and 14 in the right hemisphere (each accounting for 45.2% of the total). Bilateral localization was found in 2 patients (6.5%), and no identifiable core area was observed in 1 patient (3.2%) (Figure 5). Fisher’s exact test for the four-category distribution (left, right, bilateral, no core area) showed a statistically significant difference (p < 0.001), indicating that language dominance was not uniformly distributed; the left and right hemispheres each dominated in equal proportions, while bilateral and no-core-area cases were less frequent. Among patients with left-hemisphere localization, the most common site was the pars triangularis (8/14, 57.1%), followed by the pars opercularis (3/14, 21.4%). Among patients with right-hemisphere localization, the most common site was the pars opercularis (8/14, 57.1%), followed by the pars triangularis (3/14, 21.4%). Fisher’s exact test was used to compare the distribution of language core subregions (pars triangularis, pars opercularis, others) between the left and right hemispheres. The results showed a statistically significant difference between the left and right hemispheres (p = 0.015, Fisher’s exact test) (Figure 6).
 |
Figure 5 Broca dominance distribution. |
 |
Figure 6 Broca subgroup dominance distribution. |
Wernicke’s Core Area Localization
Localization results indicated left-hemisphere dominance in 11 patients, right-hemisphere dominance in 9 patients, and bilateral representation in 11 patients (Figure 4). A chi-square goodness-of-fit test was used to analyze the frequency distribution of the Wernicke area subgroups (left, right, bilateral). The results showed that the difference in case numbers among the three subgroups did not reach statistical significance (χ2 = 0.323, df = 2, p = 0.851) (Figure 7).
 |
Figure 7 Wernicke dominance distribution. |
SEEG Validation
Broca’s Area Validation
The sensitivity of core area identification was 33.3% (95% CI: 1.8–90.1%), specificity was 96.0% (95% CI: 79.7–99.9%), positive predictive value was 50.0% (95% CI: 1.3–98.7%), negative predictive value was 92.3% (95% CI: 74.9–99.1%), and overall accuracy was 89.3% (95% CI: 71.8–97.7%). Gwet’s AC1 was 0.90, demonstrating a high level of agreement. In the right hemisphere, both electrodes located within the core area and eight located in non-core regions elicited negative responses, there were no positive electrical stimulation events; the specificity of core area identification was 80.0% (95% CI: 44.4–97.5%), while the positive predictive value could not be calculated. Patients without Broca’s core area localization or those classified as bilateral did not receive SEEG electrodes within the relevant language network regions. The specific electrode distribution is shown in the Table 2.
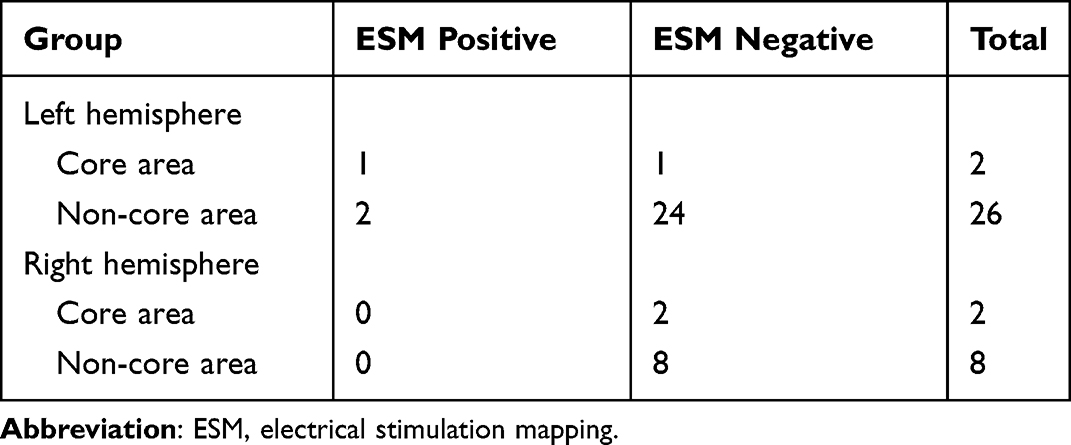 |
Table 2 Distribution of Electrodes in Broca’s Area |
Wernicke’s Area Validation
Unilateral left‑hemisphere localization (19 electrodes): Using the electrical stimulation result as the gold standard, the sensitivity of core area identification was 50.0% (95% CI: 1.3–98.7%), specificity was 94.1% (95% CI: 71.3–99.9%), positive predictive value was 50.0% (95% CI: 1.3–98.7%), negative predictive value was 94.1% (95% CI: 71.3–99.9%), and overall accuracy was 89.5% (95% CI: 66.9–98.7%). Gwet’s AC1 was 0.87 (95% bootstrap CI: 0.64–0.97), indicating very high agreement.
Unilateral right‑hemisphere localization (6 electrodes): All electrodes were located in non‑core areas and elicited negative responses, resulting in a specificity and negative predictive value of 100% each (95% CI: 54.1–100%). Due to the absence of positive events, sensitivity and agreement measures could not be calculated.
Bilateral localization (12 electrodes): The sensitivity of core area identification was 100% (95% CI: 2.5–100%) (only 1 electrode), specificity was only 27.3% (95% CI: 6.0–61.0%), and overall accuracy was 33.3% (95% CI: 9.9–65.1%). Gwet’s AC1 was –0.30, indicating extremely poor agreement. The specific electrode distribution is shown in the Table 3.
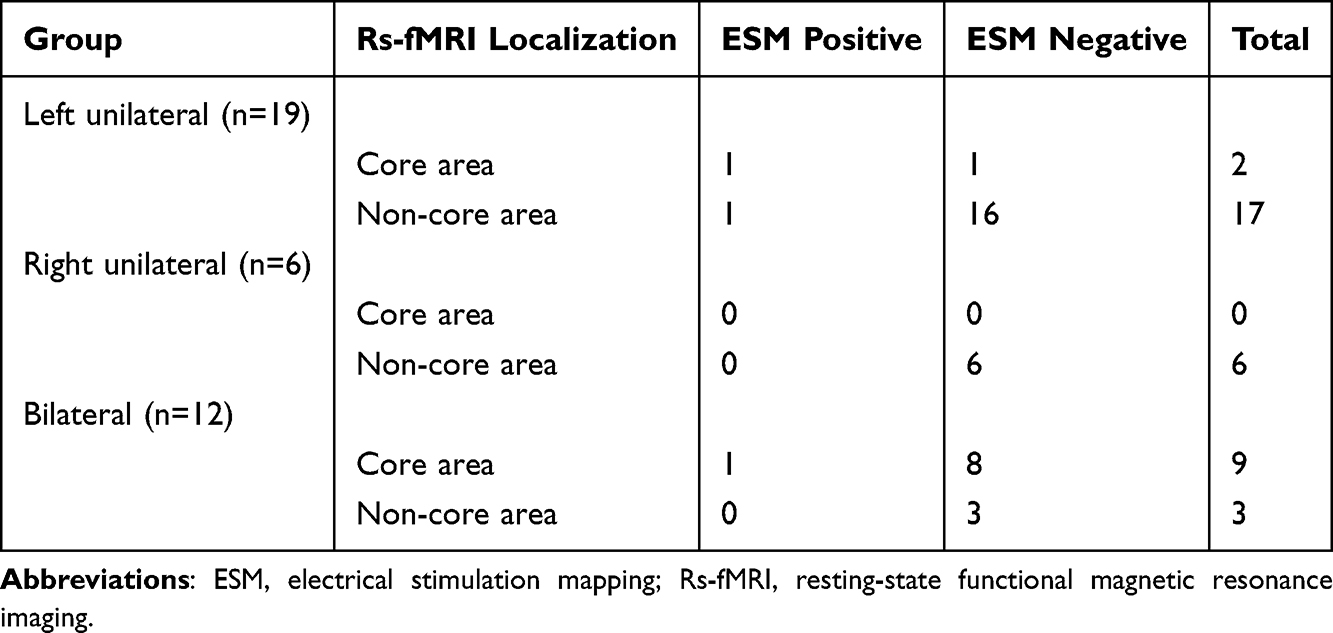 |
Table 3 Distribution of Electrodes in Wernicke’s Area |
Discussion
This study evaluated the clinical feasibility of rs-fMRI for preoperative localization of core language areas in patients with drug-resistant epilepsy. The primary methodological challenge lies in the intrinsic complexity of human language processing, characterized by substantial inter-individual variability in the spatial distribution of language-related functional regions, as previously documented.37–40 Moreover, epilepsy disrupts neural network organization and frequently induces intrahemispheric or interhemispheric language reorganization, rendering anatomical localization alone unreliable.41 The visualization of individualized core language areas using rs-fMRI provides patient-specific functional maps that enhance the precision of preoperative planning and support the preservation of the eloquent cortex during surgical intervention.42,43
In the present cohort of 31 patients, the demographic characteristics included a balanced sex distribution (16 males, 15 females), wide age variability (7–64 years), and heterogeneous epilepsy duration (0.5–40 years). The majority of epileptogenic zones were located in the left hemisphere (23 of 31 patients). Eight patients had lesions involving Broca’s or Wernicke’s areas, while 22 had perisylvian lesions (frontal, temporal, insular, or parietal), regions functionally associated with language processing. All participants underwent rs-fMRI for individualized language mapping, with 18 subsequently receiving surgical resection. Among these surgical cases, 14 achieved Engel Class I outcomes according to ILAE criteria. Notably, no patients developed postoperative language deficits, suggesting the clinical reliability of rs-fMRI–based language localization for surgical guidance.
The analysis of Broca’s core area localization indicated that 45% of patients exhibited left-hemispheric dominance, 45% right-hemispheric dominance, and only a minority demonstrated bilateral or absent cores. This proportion of right-hemisphere Broca’s reorganization (45%) in drug-resistant epilepsy patients markedly exceeded that in the general population (3–7.5%), consistent with prior evidence.9,44 Subregional analysis identified the pars triangularis as the predominant localization site within the left hemisphere, aligning with established findings that the pars triangularis exhibits greater leftward volumetric asymmetry on MRI and is typically associated with left-hemispheric language dominance.45 Conversely, right-hemisphere Broca’s areas were primarily localized to the pars opercularis, corroborating volumetric asymmetry studies that demonstrate rightward opercular dominance in left-handed individuals.46
In the analysis of Wernicke’s core area localization, no statistically significant differences were observed among the left-, right-, and bilateral-dominant groups. However, the proportion of left-sided dominance was lower than that reported in healthy populations (92.5–97%).44
SEEG electrode distribution revealed that both Broca’s and Wernicke’s mapping predominantly involved the left hemisphere (Broca: 28/38 electrodes; Wernicke: 26/37 electrodes), reflecting the predominance of left-sided epileptogenic foci in the cohort (23/31). This asymmetric implantation pattern underscores the clinical priority of preserving left-hemispheric language regions during resective surgery. Accurate delineation of core language regions is critical, as partial resection of epileptogenic cortex overlapping with functional language areas can compromise postoperative seizure control outcomes. Rs-fMRI’s high true negative rate (specificity) in unilateral predominance is key for surgical safety, as it reliably identifies areas that can be safely resected, maximizing seizure control.27
Regarding the low sensitivity of rs-fMRI, the following considerations are proposed: The definition of rs-fMRI core regions (based on probabilistic thresholds) is inherently a simplified binary classification that fails to capture the continuity and variability of functional boundaries.47,48 In clinical practice, when faced with the high specificity and low sensitivity of rs-fMRI, the core trade-off is whether we are willing to accept the risk of “resecting false-negative regions” in exchange for the benefit of “safely resecting large true-negative regions.” Given the extremely low false-negative rate (<6%) and the fact that true positive regions account for only a small proportion of the entire language cortex (less than 11% in this study), from a probabilistic perspective at the group level, the net benefit of using rs-fMRI core regions to guide surgery is positive. However, for an individual patient, once they fall into that 6% false-negative region, the consequences can be catastrophic. Therefore, clinical decision-making should follow the principles below: Low-risk preference situations (eg., low-grade gliomas, pediatric patients, lesions adjacent to essential language areas): Do not accept the risk of omission; direct electrical stimulation validation is mandatory. High-risk situations (eg., high-grade gliomas, status epilepticus, lesions that have already caused severe neurological dysfunction): Accept a certain risk of omission and prioritize maximally safe resection.
There are several limitations that should be acknowledged. First, the retrospective study design and relatively small sample size, with a predominance of left-sided lesions, may introduce selection bias and limit the generalizability of our findings. Second, SEEG-based electrical stimulation mapping (ESM) provides spatially restricted sampling that is constrained by individualized electrode placement strategies, limiting direct one-to-one comparison with whole-brain rs-fMRI maps. Third, the reproducibility of SEEG stimulation findings was not evaluated, which may affect the reliability of SEEG-derived localization as the reference standard.
Conclusion
Rs-fMRI identified language reorganization in 54.8% broca and 64.5% wernicke patients with drug-resistant epilepsy, reflecting atypical or non-left-dominant language lateralization and suggested high specificity in identifying core language areas, supporting the potential utility of this approach in delineation of non-resectable cortical regions and enhancing surgical safety during maximal resection of epileptogenic zones. This approach may contribute to preserving essential language function while optimizing seizure control outcomes. The absence of postoperative language deficits in all patients provides supportive empirical evidence for this clinical utility.
However, given the exploratory nature of this pilot study and the relatively small sample size, these findings should be interpreted with caution. Further validation in larger, prospective cohorts is necessary to comprehensively assess the sensitivity and clinical applicability of rs-fMRI for individualized language mapping in patients with drug-resistant epilepsy.
Abbreviations
rs-fMRI, resting state functional Magnetic Resonance Imaging; SEEG, stereo electroencephalography; AED, antiepileptic drugs; fMRI, functional Magnetic Resonance Imaging; FCD, focal cortical dysplasia; mMCD, microcortical dysplasia; ILAE, International League Against Epilepsy; ESM, electrical stimulation mapping.
Data Sharing Statement
All the data will be available upon motivated request to the corresponding author of the present paper.
Ethics Approval and Consent to Participate
The study protocol was in accordance with the Helsinki Declaration and was approved by the institutional review board of the Second Hospital of Hebei Medical University (No.2023-R643). Written informed consent was obtained from all participants. For participants under the age of 18, consent was obtained from their parents or legal guardians.
Consent for Publication
Written informed consent was obtained from each patient to authorize the publication of their data.
Acknowledgments
The authors extend their sincere gratitude to the following et al for their essential roles in this research:
Zihao Wang and Ying Li for their diligent efforts in data curation and analysis.
Xi Gao and Huiqi Li for their contributions to the SEEG electrical stimulation work.
Yaning Sun for her constructive suggestions and careful revision of the manuscript.
Funding
This study was supported bv the Kev Research andDevelopment Program of Hebei Province (Special Proiect forBiomedical Innovation. No. 23377709D) and the “14th Five-Year Plan” Clinical Medicine Innovation Research Team Project of theDepartment of Science and Technology of Hebei Province-Hebei Medical University (No. 2022LCTD-A6).
Disclosure
The authors declare that they have no competing interests.
References
1. Abramovici S, Bagić A. Chapter 10 - Epidemiology of epilepsy. Handbook Clin Neurol. 2016;138:159–14. doi:10.1016/B978-0-12-802973-2.00010-0
2. Kalilani L, Sun X, Pelgrims B, Noack-Rink M, Villanueva VJE. The epidemiology of drug-resistant epilepsy: a systematic review and meta-analysis. Epilepsia. 2018;59(12):2179–93.
3. Mehdizadeh A, Barzegar M, Negargar S, Yahyavi A, Raeisi S. The current and emerging therapeutic approaches in drug-resistant epilepsy management. Acta Neurol Belg. 2019;119:155–162. doi:10.1007/s13760-019-01120-8
4. Hendi K, Rahmani M, Larijani A, et al. Changes in cognitive functioning after surgical resection of language-related, core-area, high-grade gliomas under awake craniotomy. Cognitive Behav Neurol. 2022;35:130–139. doi:10.1097/WNN.0000000000000307
5. Wang J, Wu DY, Yuan Y, Yan YN, Yang YH. A comparison between the effects of transcranial direct current stimulation over anterior and posterior language regions on picture naming in aphasia. Chin J Rehabil Med. 2018;33:5.
6. Black DF, Delone DR, Kaufmann TJ, et al. Retrospective analysis of interobserver spatial variability in the localization of broca’s and wernicke’s areas using three different fMRI language paradigms. J Neuroimag. 2015;25:626–633. doi:10.1111/jon.12179
7. Tremblay P, Dick ASJB. Language. Broca and Wernicke are dead, or moving past the classic model of language neurobiology. BrainLanguage. 2016;162:60–71. doi:10.1016/j.bandl.2016.08.004
8. Berl MM, Mayo J, Parks EN, et al. Regional differences in the developmental trajectory of lateralization of the language network. Human Brain Mapping. 2014;35:270–284. doi:10.1002/hbm.22179
9. Stewart CC, Swanson SJ, Sabsevitz DS, Rozman ME, Janecek JK, Binder JR. Predictors of language lateralization in temporal lobe epilepsy. Neuropsychologia. 2014;60:93–102. doi:10.1016/j.neuropsychologia.2014.05.021
10. Oh YM, Koh EJ. Language Lateralization in patients with temporal lobe epilepsy: a comparison between volumetric analysis and the Wada Test. J Korean Neurosurg Soc. 2009;45:329–335. doi:10.3340/jkns.2009.45.6.329
11. Loddenkemper T, Morris HH, Möddel G. Complications during the Wada test. Epilepsy Behav. 2008;13(3):551–553. doi:10.1016/j.yebeh.2008.05.014
12. Arya R, Frink C, Kargol C, et al. Neuropsychological outcomes after epilepsy surgery: a comparison of stereo electroencephalography and subdural electrodes. Eur J Neurol. 2023;30:2986–2998. doi:10.1111/ene.15929
13. Biswal B, Yetkin FZ, Haughton VM, Hyde JS. Functional connectivity in the motor cortex of resting human brain using echo-planar MRI. Magn Reson Med. 1995;34(4):537–541. doi:10.1002/mrm.1910340409
14. De Luca M, Beckmann CF, De Stefano N, Matthews PM, Smith SM. fMRI resting state networks define distinct modes of long-distance interactions in the human brain. Neuroimage. 2006;29(4):1359–1367. doi:10.1016/j.neuroimage.2005.08.035
15. Sokoloff L. Metabolism of the central nervous system in vivo. Handbook Physiol Section I Neurophysiol} 1960;3:1843–64.
16. Jamadar SD, Behler A, Deery H, Breakspear M. The metabolic costs of cognition. Trends Cogn Sci. 2025;29(6):541–555. doi:10.1016/j.tics.2024.11.010
17. Raichle ME, Mintun MA. Brain work and brain imaging. Annu Rev Neurosci. 2006;29:449–476. doi:10.1146/annurev.neuro.29.051605.112819
18. Fedorenko E, Ivanova AA, Regev TI. The language network as a natural kind within the broader landscape of the human brain. Nat Rev Neurosci. 2024;25(5):289–312. doi:10.1038/s41583-024-00802-4
19. Zhang L, Pini L. A divergent pattern in functional connectivity: a transdiagnostic perspective. Neural Regen Res. 2024;19:1885–1886. doi:10.4103/1673-5374.390982
20. Klein CC, Berger P, Wiesmann CG, Friederici AD.Grammar acquisition in preschool children is related to white matter maturation of the dorsal language network. Develop Cognitive Neurosci.2026;79:101715. doi:10.1016/j.dcn.2026.101715
21. Barceló-Coblijn L, Eguíluz VM, Seoane LF. A syntax network morphospace reveals sudden transitions between discrete developmental stages during language acquisition. bioRxiv. 2025.
22. Li Z, Liu C, Pan X, Ding G, Wang R. The stability and instability of the language control network: a longitudinal resting-state functional magnetic resonance imaging study. Bilingualism. 2025;1–13. doi:10.1017/S136672892510076X
23. Zhang H, Li D, Lei VLC, et al. Multifaceted multilingual experiences modulate neurocognitive mechanisms of task switching. Bilingualism. 2025;28:1346–1362. doi:10.1017/S1366728925000094
24. Mohammadi-Nejad AR, Mahmoudzadeh M, Hassanpour MS, et al. Neonatal brain resting-state functional connectivity imaging modalities. Photoacoustics. 2018;10:1–19. doi:10.1016/j.pacs.2018.01.003
25. Khodaei M, McIntyre CC, Kirse HA, Laurienti P. Why graph theory deserves more focus. Comment on “Connectivity analyses for task-based fMRI” by Huang et al. Phys Life Rev. 2024;51:22–23. doi:10.1016/j.plrev.2024.09.003
26. Dong L, Luo C, Cao W, et al. Spatiotemporal consistency of local neural activities: a new imaging measure for functional MRI data. J Magn Reson Imaging. 2015;42:729–736. doi:10.1002/jmri.24831
27. Wang L, Song M, Jiang T, Zhang Y, Yu C. Regional homogeneity of the resting-state brain activity correlates with individual intelligence. Neurosci Letters. 2011;488:275–278. doi:10.1016/j.neulet.2010.11.046
28. Thomas G, McMahon KL, Finch E, Copland DA. Interindividual variability and consistency of language mapping paradigms for presurgical use. Brain Lang. 2023;243:105299. doi:10.1016/j.bandl.2023.105299
29. Bajracharya A, Peelle JE. A systematic review of neuroimaging approaches to mapping language in individuals. J Neurolinguistics. 2023;68.
30. An HS, Moon WJ, Ryu JK, et al. Inter-vender and test-retest reliabilities of resting-state functional magnetic resonance imaging: implications for multi-center imaging studies. Magnetic Resonance Imaging. 2017;44:125–130. doi:10.1016/j.mri.2017.09.001
31. Yan Y, Qian T, Xu X, et al. B.Human cortical networking by probabilistic and frequency-specific coupling. NeuroImage. 2019. doi:10.1016/j.neuroimage.2019.116363
32. Wang DH, Buckner RL, Fox MD, et al. Parcellating cortical functional networks in individuals. NatNeurosci. 2015;18(12):1853–1860.
33. Wang DH, Liu HS. Functional connectivity architecture of the human brain: not all the same. Neuroscientist. 2014;20(5):432–438. doi:10.1177/1073858414543290
34. Yeo BT, Krienen FM, Sepulcre J, et al. The organization of the human cerebral cortex estimated by intrinsic functional connectivity. J Neurophysiol. 2011;106:1125–1165. doi:10.1152/jn.00338.2011
35. Kulik V, Reyes LD, Sherwood CC. Coevolution of language and tools in the human brain: an ALE meta-analysis of neural activation during syntactic processing and tool use. Prog Brain Res. 2023;275:93–115.
36. Kośla K, Pfajfer L, Bryszewski B, Jaskólski D, Majos A. Functional rearrangement of language areas in patients with tumors of the central nervous system using functional magnetic resonance imaging. 2012;77:39–45. doi:10.12659/pjr.883373
37. Berl MM, Zimmaro LA, Khan OI, Dustin I, Ritzl E, Duke ES. Characterization of atypical language activation patterns in focal epilepsy. Ann Neurol. 2014;75(1):33–42.
38. Binder JR, Desai RH, Graves WW, Conant LL. Where is the semantic system? A critical review and meta-analysis of 120 functional neuroimaging studies. Cereb Cortex. 2009;19:2767–2796. doi:10.1093/cercor/bhp055
39. FitzGerald DB, Cosgrove GR, Ronner S, et al. Location of language in the cortex: a comparison between functional MR imaging and electrocortical stimulation. AJNR Am J Neuroradiol. 1997;18:1529–1539.
40. Ojemann GA. Functional mapping of cortical language areas in adults. Electrical Magnetic Stimulat Brain Spinal Cord. 1993;63:155–163.
41. Tie Y, Rigolo L, Norton IH, et al. Defining language networks from resting-state fMRI for surgical planning—a feasibility study. Human Brain Mapping. 2013;35(3):1018–1030. doi:10.1002/hbm.22231
42. Pur DR, Eagleson R, Lo M, et al. Presurgical brain mapping of the language network in pediatric patients with epilepsy using resting-state fMRI. J Neurosurg. 2021;27(3):259–268. doi:10.3171/2020.8.PEDS20517
43. Gębska-Kośla K, Bryszewski B, Jaskólski DJ, et al. Reorganization of language centers in patients with brain tumors located in core speech areas – a pre- and postoperative preliminary fMRI study. Neurol Neurochir Pol. 2017;51:403–410. doi:10.1016/j.pjnns.2017.07.010
44. Knecht S, Deppe M, Drager B, et al. Language lateralization in healthy right-handers. Brain. 2000;123(1):74–81. doi:10.1093/brain/123.1.74
45. Foundas AL, Leonard C, Gilmore R, Fennell E, Heilman K. 1996. Pars triangularis asymmetry and language dominance.
46. Foundas AL, Eure KF, Laura F. MRI asymmetries of Broca’s area: the pars triangularis and pars opercularis. Brain Language. 1998;64:282–296. doi:10.1006/brln.1998.1974
47. de Hollander G, Wagenmakers EJ, Waldorp L, Forstmann B. An antidote to the imager’s fallacy, or how to identify brain areas that are in limbo. PLoS One. 2014;9:e115700. doi:10.1371/journal.pone.0115700
48. Stevens MT, D’Arcy RC, Stroink G, et al. Thresholds in fMRI studies: reliable for single subjects? J Neurosci Meth. 2013;219:312–323. doi:10.1016/j.jneumeth.2013.08.005
 © 2026 The Author(s). This work is published and licensed by Dove Medical Press Limited. The
full terms of this license are available at https://www.dovepress.com/terms
and incorporate the Creative Commons Attribution
- Non Commercial (unported, 4.0) License.
By accessing the work you hereby accept the Terms. Non-commercial uses of the work are permitted
without any further permission from Dove Medical Press Limited, provided the work is properly
attributed. For permission for commercial use of this work, please see paragraphs 4.2 and 5 of our Terms.
© 2026 The Author(s). This work is published and licensed by Dove Medical Press Limited. The
full terms of this license are available at https://www.dovepress.com/terms
and incorporate the Creative Commons Attribution
- Non Commercial (unported, 4.0) License.
By accessing the work you hereby accept the Terms. Non-commercial uses of the work are permitted
without any further permission from Dove Medical Press Limited, provided the work is properly
attributed. For permission for commercial use of this work, please see paragraphs 4.2 and 5 of our Terms.