Back to Journals » Journal of Inflammation Research » Volume 18
CKS2 Mediates Hepatocellular Carcinoma Recurrence After Hepatic Ischemia-Reperfusion Injury Related to M2 Macrophages
Authors Xia S, Qin X, Pan C, Fan D, Yang D
Received 27 May 2025
Accepted for publication 18 August 2025
Published 27 August 2025 Volume 2025:18 Pages 11801—11819
DOI https://doi.org/10.2147/JIR.S543147
Checked for plagiarism Yes
Review by Single anonymous peer review
Peer reviewer comments 2
Editor who approved publication: Dr Fatih Türker
Senzhe Xia,1– 3,* Xueqian Qin,4,* Chenggeng Pan,1– 3 Dingwei Fan,1– 3 Daqing Yang1– 3
1Department of Comprehensive Surgery, Wenzhou Central Hospital, Wenzhou, People’s Republic of China; 2Department of Comprehensive Surgery, The Dingli Clinical College of Wenzhou Medical University, Wenzhou, People’s Republic of China; 3Department of Comprehensive Surgery, The Second Affiliated Hospital of Shanghai University, Wenzhou, People’s Republic of China; 4Department of Pharmacy, The Affiliated Xuzhou Municipal Hospital of Xuzhou Medical University, Xuzhou First People’s Hospital, Xuzhou, People’s Republic of China
*These authors contributed equally to this work
Correspondence: Senzhe Xia, Department of Comprehensive Surgery, Wenzhou Central Hospital, Wenzhou, Zhejiang, 325000, People’s Republic of China, Email [email protected] Daqing Yang, Department of Comprehensive Surgery, Wenzhou Central Hospital, Wenzhou, Zhejiang, 325000, People’s Republic of China, Email [email protected]
Purpose: Hepatocellular carcinoma (HCC) recurrence remains a significant burden on global healthcare. Hepatic ischemia-reperfusion injury (HIRI) is a common complication in liver surgery and may be a contributing factor to HCC recurrence. Nevertheless, the potential mechanism underlying HIRI-induced HCC recurrence has not been fully elucidated. Herein, by combining bioinformatics approaches and basic experimental research, CKS2 was preliminarily identified as a crucial factor involved in HIRI-induced HCC recurrence potentially by modulating M2 macrophages.
Methods: Through performing Weighted Gene Co-Expression Network Analysis (WGCNA), differential gene expression analysis, and screening for genes associated with disease-free survival (DFS) on large-scale genomics projects including The Cancer Genome Atlas (TCGA) and Gene Expression Omnibus (GEO), the pivotal role of CKS2 in HIRI-induced HCC recurrence was determined. The clinical significance, single-cell analysis, immune cell infiltration correlation, functional enrichment, mutation landscape, and drug sensitivity of CKS2 in HCC were further characterized. Finally, CKS2 expression and function were validated through experimental techniques such as flow cytometry, immunohistochemistry, Western blot assay and quantitative real-time PCR (qRT-PCR).
Results: The expression of CKS2 was significantly upregulated in HIRI and HCC tissues and was closely associated with adverse clinical outcomes in HCC patients. There was a positive correlation between CKS2 expression and tumor stemness characteristics. Additionally, high CKS2 expression was strongly linked to M2 macrophage infiltration in HCC tissues. And drug sensitivity analysis indicated that HCC patients with high CKS2 expression were prone to develop drug resistance, complicating clinical anti-tumor treatment. Ultimately, the expression pattern of CKS2 and its correlation with M2 macrophages in HCC were confirmed through experimental validation.
Conclusion: CKS2 was identified as a key factor in HIRI-induced HCC recurrence and was critically associated with M2 macrophage infiltration abundance, providing novel insights and a direction for future research.
Keywords: hepatic ischemia reperfusion injury, HCC recurrence, CKS2, M2 macrophage, tumor stemness
Graphical Abstract:

Introduction
Hepatocellular carcinoma (HCC) is a severe global health problem, imposing immense pressure on medical resources due to its high incidence and recurrence rate.1,2 For early-stage HCC, surgical resection is the primary treatment strategy,3,4 making hepatic ischemia-reperfusion injury (HIRI) a nonnegligible complication during liver surgery.5 The HIRI process involves complex cellular and molecular responses, including oxidative stress, inflammatory responses and immune responses, which could alter the microenvironment and impair postoperative liver function.6,7 However, the association between HIRI and HCC recurrence is intricate and subtle. Emerging evidences suggest that HIRI-induced alterations in the liver microenvironment may facilitate the intrahepatic colonization of circulating tumor cells and thereby contribute to HCC recurrence.8–10 Thus, elucidating the molecular and cellular mechanisms underlying HIRI-induced HCC recurrence is of significant clinical value.
Bioinformatics is an interdisciplinary field that encompasses knowledge and methods from biology, computer science, mathematics, and statistics to facilitate the acquisition, storage, management, analysis, interpretation, and application of biological data, providing effective tools for clinical disease research.11,12 CKS2, encoding the cyclin-dependent kinase regulatory subunit 2, plays a crucial role in multiple stages of the cell cycle. By binding with cyclin-dependent kinases, CKS2 regulates their activity to ensure the normal progression of the cell cycle and promote cell proliferation and division.13,14 In a variety of cancers, such as osteosarcoma, glioma and colon cancer, CKS2 expression is significantly upregulated, which is closely related to tumor cell proliferation, apoptosis inhibition and chemotherapy resistance.14–16 However, the function of CKS2 in HCC, especially in HCC recurrence, has not been fully clarified. Therefore, this study investigated the significance of CKS2 in the HIRI-induced HCC recurrence process by combining bioinformatics approaches and basic experimental methods, and conducted a preliminary exploration of its function.
Herein, Weighted Gene Co-Expression Network Analysis (WGCNA) was applied to the HIRI dataset to reveal relevant gene modules, and then genes associated with disease-free survival (DFS) were identified in the HCC cohort, CKS2 was ultimately determined to be a common factor linking the HIRI process and HCC recurrence. Furthermore, the expression profile of CKS2, its distribution in single-cell analyses, and its relevance to clinical information in the HCC cohort were gradually revealed. In addition, the function of CKS2 in HCC was elaborated by functional enrichment analysis and its association with tumor stemness was revealed. And we also investigated the relationship between CKS2 expression with the immune microenvironment, genomic mutation landscape, and drug sensitivity. Finally, through detecting clinical samples, the expression patterns of CKS2 in HCC were verified, and the association between CKS2 expression and M2 macrophages was demonstrated. These findings collectively indicated that CKS2 may be a critical factor in HIRI-induced HCC recurrence, and provided beneficial data support for subsequent clinical and basic research.
Materials and Methods
Download and Processing of Raw Data
Transcriptome data and clinical information of control samples and HIRI samples were extracted from GSE12720 and GSE14951 in Gene Expression Omnibus (GEO) database. WGCNA was performed using the transcriptome data to explore the associations between gene networks and phenotypes within the relevant modules. The transcriptome information and clinical data of the HCC cohort were downloaded from the The Cancer Genome Atlas (TCGA) database (TCGA-LIHC) and GSE14520. By combining whole transcriptome data with clinical prognostic outcomes, key genes related to HCC recurrence were screened.
Identification of Prognostic Gene
Gene Expression Profiling Interactive Analysis (GEPIA) database was applied to reveal the expression pattern of selected genes in HCC tissues and to identify differentially expressed genes (DEGs) between normal tissues and tumor tissues. Through applying Least Absolute Shrinkage and Selection Operator (LASSO) regression analysis, a series of candidate genes were subjected to dimensionality reduction and feature extraction to enhance the correlation between the screened genes and phenotypes. Concurrently, univariate Cox regression analysis and multivariate Cox regression analysis were performed on candidate genes to determine independent prognostic risk factors. Finally, the intersection of candidate genes selected by various analysis methods was determined using a Venn diagram.
Construction and Validation of a Prognostic Model
Based on the CKS2 expression level, quadruple maps were used to depict the distribution of risk scores, survival state, recurrence status and gene expression level in the TCGA database and GSE14520 dataset. A Nomogram based on the TCGA dataset was constructed, and the predictive accuracy of the Nomogram was validated using Receiver Operating Characteristic (ROC) curves in both the internal cohort TCGA-LIHC and external cohort GSE14520.
Survival Analysis
Combined with the CKS2 expression level and clinical outcome of the HCC cohort in the TCGA-LIHC project and GSE14520 dataset, Overall Survival (OS) and Disease free survival (DFS) were analyzed by Kaplan-Meier (K&M) survival analysis, and Log-rank P-values were calculated.
Expression Profile of CKS2 in HCC Cohort
The University of Alabama at Birmingham Cancer data analysis Portal (UALCAN) database contains mRNA and protein expression data of various tumor tissues, as well as diverse clinical information. By mining the UALCAN database, the mRNA and protein expression trends of CKS2 in HCC were revealed, and the correlations between CKS2 expression with T stage, N stage, clinical stage and pathological grade were explored. The Human Protein Atlas (HPA) database includes immunohistochemical images of proteins in various tissues under different diseases. Immunohistochemical images of CKS2 in HCC were downloaded to evaluate its expression trend.
Single Cell Analysis of CKS2
The Cell-omics Data Coordinate Platform (CDCP) database integrates a large number of single-cell datasets and provides single-cell analysis tools and visualization services. Dataset ID: SCDS0000020 was used to explore the single-cell transcriptional profiles in HCC and recurrent HCC.
Functional Enrichment Analysis of CKS2
In order to explore the function of CKS2 in HCC, the HCC cohort was divided into high and low expression groups based on CKS2 expression levels. Differential gene expression analysis was performed using the DESeq 2 software package, and DEGs were displayed through heatmaps and volcano plots with p-values<0.05 and |log2FoldChange|>1.5. The functions of DEGs were revealed through Kyoto Encyclopedia of Genes and Genomes (KEGG) and Gene Ontology (GO) enrichment analysis. Furthermore, The Gene Set Enrichment Analysis (GSEA) and Gene Set Variation Analysis (GSVA) were utilized to determine relevant pathways. In addition, the tumor stemness characteristics of HCC specimens were quantified using mRNAsi scores calculated by the OCLR algorithm, and the correlation between CKS2 expression and mRNAsi score was evaluated by a scatter plot.
Exploration of Immune Microenvironment
Through applying the quantification method QUANTISEQ, the immune infiltration abundance of the control group, HIRI group and HCC group from the GSE14951 and TCGA databases was measured, and the results were presented as proportion charts and bar charts. The correlation between CKS2 expression and the abundance of various immune cells in the HIRI process and in HCC was visualized by radar charts. And bar lollipop charts and heatmaps were presented to illustrate the correlation between various immune inflammatory pathways and immune checkpoints with CKS2 expression. The Cancer Immunome Atlas (TCIA) database was utilized to evaluate the Immune phenotype score (IPS) of HCC patients to predict the efficacy of immunotherapy. The T Cell State Identifier (TCellSI) database provides an algorithm for measuring T cell functional status scores in the immune microenvironment. By calculating IPS and T cell functional status scores at different CKS2 expression groups of HCC patients, the association between CKS2 expression with immunotherapy efficacy and immune microenvironment status was revealed.
Genomic Mutation Landscape
The STAR counts data, Mutation maf data, and corresponding clinical information of HCC patients were downloaded from the TCGA database. TPM-normalized data were extracted from the STAR counts data utilizing log2 (TPM+1). Using the maftools software package in R software, the somatic mutation data of HCC patients were visualized through Oncoplots and horizontal bar histograms. Moreover, the top 20 genes with the highest copy number variation (CNV) frequency were listed and the proportion of GAIN and LOSS events was described by a histogram based on the CKS2 expression level. The Mutant-Allele Tumor Heterogeneity (MATH) score is an algorithm that quantifies the genetic heterogeneity of tumor tissues based on the frequency of all allele mutations, and it could be applied to evaluate and predict treatment response. Microsatellite instability (MSI) is a phenomenon characterized by alterations in microsatellite sequence length in DNA caused by a functional defect in the DNA mismatch repair system, which exerts a significant role in the guidance of clinical tumor treatment. And the association between CKS2 expression level with MATH score and MSI score was elucidated.
Prediction of Drug Sensitivity
Based on the expression level of CKS2, the HCC patients in the TCGA database were divided into high and low expression groups. Drug sensitivity prediction was performed for each group using the pRRophetic package and oncoPredict algorithm, and the prediction results were displayed in violin plots.
Collection of Clinical Tissue Specimens
Normal liver samples and HIRI liver samples were acquired from patients with benign lesions undergoing hepatectomy in Wenzhou Central Hospital. The inclusion criteria for the HIRI group were that the cumulative occlusion time during the operation was ≥ 30 minutes. The principal diagnosis of these patients included focal nodular hyperplasia (FNH), hemangioma, hepatolithiasis, and angiomyolipoma, without a history of autoimmune disorders, hepatitis, malignancy, immune deficiencies, or HIV infection. Liver samples of HCC were obtained from patients with hepatocellular carcinoma. Each group comprised 10 liver specimens. All clinical specimens involved in this study were collected and obtained written informed consent from all subjects at Wenzhou Central Hospital.
Experimental Reagents
The primary antibodies against CKS2 (PA5-104525, Thermo Fisher Scientific) and β-actin (66009-1-Ig, Proteintech) were purchased for Western Blotting assay and immunohistochemical staining. Primers were designed for RT-qPCR to determine mRNA expression levels as: CKS2 Forward Primer: TTC GAC GAA CAC TAC GAG TAC C, Reverse Primer: GGA CAC CAA GTC TCC TCC AC; β-Actin Forward Primer: ATT GCC GAC AGG ATG CAG AA, Reverse Primer: GCT GAT CCA CAT CTG CTG GAA; CD206 Forward Primer: TCC GGG TGC TGT TCT CCT A, Reverse Primer: CCA GTC TGT TTT TGA TGG CAC T; CD163 Forward Primer: TTT GTC AAC TTG AGT CCC TTC AC, Reverse Primer: TCC CGC TAC ACT TGT TTT CAC; Arg-1 Forward Primer: GTG GAA ACT TGC ATG GAC AAC, Reverse Primer: AAT CCT GGC ACA TCG GGA ATC. The following flow cytometry antibodies were used to bind to monocyte surface markers: PE anti-human CD11b (clone ICRF44, Biolegend), APC anti-human CD163 (clone RM3/1, Biolegend).
Western Blotting Assay
The appropriate size of the tissue pieces was clipped, and the whole protein extracted from the tissue using RIPA Lysis Buffer, and quantified and standardized all protein concentrations using a BCA assay. Samples were incubated with the primary antibody mentioned above, then incubated with the secondary antibody. Used ECL chemiluminescence imaging system to capture corresponding images, and band intensity was quantified using ImageJ software.
Real-Time Quantitative Polymerase Chain Reaction (RT-qPCR)
Total RNA was extracted from tissue pieces using Trizol reagent, and the concentration and purity of RNA were detected by a spectrophotometer. Complementary DNA (cDNA) was synthesized from RNA using the Superscript II Reverse Transcriptase kit, and the targeted RNA concentration in the RNA was detected by SYBR Green PCR Master Mix using the primers mentioned above. β-actin was regarded as a housekeeping gene for normalization, and relative gene expression was calculated by 2−ΔΔCT method.
Tissue Hematoxylin-Eosin (H&E) Staining and Immunohistochemical (IHC) Staining Analysis
Clinical specimens were fixed in formalin, embedded in paraffin to form specimen wax blocks, H&E staining and immunohistochemical staining were used to reveal the tissue microstructure and specific protein expression level. The stained sections were photographed using Leica microscope, and protein expression levels were quantified using ImageJ software.
Flow Cytometry Analysis
Tissue pieces were clipped, digested and dissociated with collagenase IV, then filtered through 70µm cell strainer to obtain histiocytic suspension. Cell suspension was subjected to gradient centrifugation using Percoll to obtain monocytes. Cell surface markers were stained with flow cytometry antibodies against PE-CD11b and APC-CD163 to determine the proportion of M2 macrophage. Flowjo software was used to quantify the flow cytometry raw data.
Statistical Analysis
All experimental data were comprehensively analyzed and visualized by GraphPad Prism software, and statistical significance was assessed by Student’s test. P-value < 0.05 was considered statistically significant.
Results
Screening of HIRI Related Modules
In order to clarify the association between core genes and clinical phenotype in the process of HIRI, the WGCNA analysis was performed on the GSE12720 dataset. By calculating the correlation coefficients and average connectivity of the networks separately, 28 was ultimately determined as the optimal soft-thresholding power (Figure 1A). Based on the selected power value, a dissimilarity TOM-based (dissTOM) matrix gene clustering dendrogram and the distribution of genes were constructed, and ultimately dividing 5523 genes into 7 modules (Figure 1B). Subsequently, the Pearson correlation algorithm was used to calculate the correlation coefficient and its associated p-value between module eigengenes and clinical traits were assessed, revealing the green module as crucially related to the clinical phenotype (Figure 1C). Besides, based on the association between module gene expression levels with corresponding traits and module eigengenes, a scatter plot was presented in Figure 1D. According to the results of WGCNA module assignment, cluster maps of module eigengenes were performed to highlight the module gene expression patterns (Figure 1E). Furthermore, the genes in the most relevant modules were subjected to functional enrichment analysis. KEGG (Figure 1F) and GO (Figure 1G) analysis results demonstrated that these genes were highly enriched in inflammation related pathways, such as the TNF signaling pathway and IL-17 pathway, and were tightly related to the clinical process of HIRI.
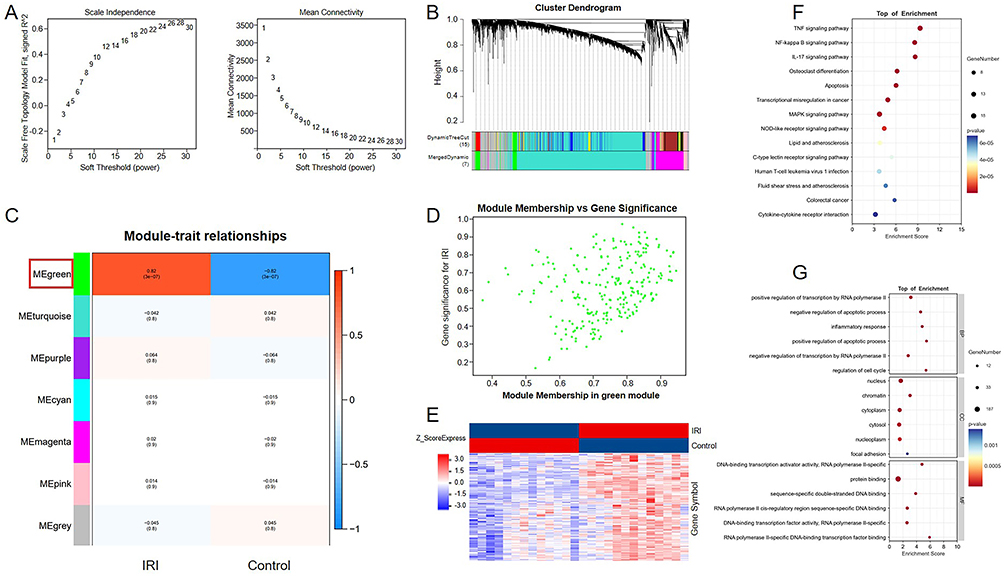 |
Figure 1 Screening of genome related modules in HIRI process. (A) WGCNA network construction parameters in GSE12720. (B) Gene clustering tree constructed from dissTOM matrix based on weighted correlation coefficients. The lower part of the figure is divided into the distribution of genes in each module, and the same color represents the same module. (C) Characteristic module correlation heatmap, and the green module was significantly associated with clinical trait and was highlighted with red colored squared box. (D) The association of specific trait and module gene showed a scatter plot. (E) Cluster diagram of module gene expression information. (F) KEGG functional enrichment analysis of genes in significantly correlated modules. (G) GO functional enrichment analysis of genes in significantly correlated modules. |
Identification of HIRI Associated Risk Gene for HCC Recurrence
To identify a risk gene that might affect the prognosis of HCC recurrence, the whole transcriptome data of HCC from the TCGA database was utilized for observation and calculation, and 1387 genes associated with DFS in HCC (HCC-DFS) related genes were screened (Figure 2A). Analysis revealed 9 common genes between genes in the HIRI process significantly associated module and the HCC-DFS related genes. And to refine prognostic gene identification, common genes were subjected to differential gene expression analysis. As shown in Figure 2B, there were significant differences in the mRNA expression levels of CKS2, CSNK1D, HSPA1A and HSPA1B between tumor and normal tissues. And these selected genes were further refined by LASSO regression (Figure 2C) and multivariate Cox regression (Figure 2D), and CKS2 was determined as the primary risk gene ultimately based on the intersection illuminated in the Venn diagram (Figure 2E). Moreover, the distribution of CKS2 expression, survival status, recurrence status and risk score of HCC patients in the TCGA-LIHC cohort and GSE14520 dataset were illuminated by quadruple maps (Figure 2F). Furthermore, based on the expression and clinical significance of CKS2 in the TCGA-LIHC cohort, a nomogram was established for predicting HCC patients’ outcomes (Figure 2G), and the AUC values was calculated in Figure 2H to test the predictive power of the nomogram in the internal cohort TCGA-LIHC and external cohort GSE14520. These results confirmed the significance of CKS2 in the HIRI and HCC recurrence process.
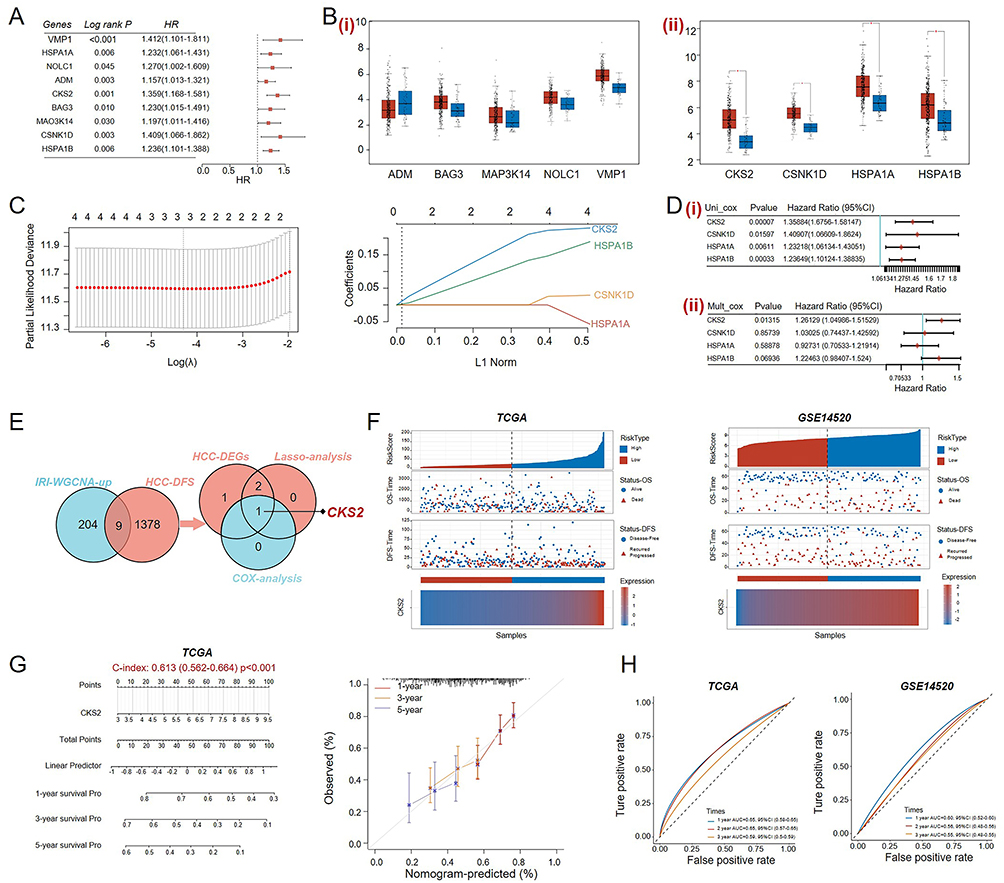 |
Figure 2 Identification of key factors between HIRI and HCC recurrence. (A) Screening for genes related to Disease free survival analysis of HCC (HCC-DFS). (B) Differential expression analysis of common genes between WGCNA analysis and HCC-DFS analysis. (i) No significant differential expression of genes. (ii) Significant differential expression of genes. (C) The key genes screened out by LASSO regression analysis were analyzed, and the relationship graph between partial likelihood bias and log(λ) was plotted using the LASSO Cox regression model. (D) The selected genes were subjected to dimensionality refine using univariate (i) and multivariate (ii) Cox regression. (E) Venn diagram was used to identify a common key gene. (F) The quadruple maps of risk scores, survival status, recurrence status and CKS2 expression levels of TCGA and GSE14520 were drawn. (G) A Nomogram was constructed in the TCGA database based on CKS2 expression and clinical prognostic status of HCC patients. (H) The ROC curve was applied to validate the performance of Nomogram in the TCGA database and GSE14520. mean ± SEM, *p<0.05, Student’s t-test. |
Clinical Significance of CKS2 in HCC
The prognostic risk role of CKS2 was revealed, and the next step was to explore the clinical significance of CKS2 in the HCC population. As presented in Figure 3A, among HCC patients in the TCGA database, those with high expression of CKS2 had worse OS and DFS. Similarly, the same conclusion was confirmed in the GSE14520 dataset that high CKS2 expression predicted poorer clinical outcomes (Figure 3B). As illustrated in Figure 3C, the mRNA and protein expression of CKS2 was significantly increased in HCC tissues compared with normal tissues. And this upregulation was validated in both the TCGA and GSE14520 datasets (Figure 3D). Furthermore, the relevance between CKS2 expression and clinical parameters in HCC patients was confirmed. As shown in Figure 3E, it was demonstrated that CKS2 expression increased progressively in HCC tissues with increasing T staging from T1 to T3, while there was no significant correlation between CKS2 expression and N stage (Figure 3F). And significant positive correlations were also observed between CKS2 expression and clinical stage (Rho=0.226, P=2.18e-05) (Figure 3G) and pathological grade (Rho=0.268, P=2.02e-07) (Figure 3H). Besides, the immunohistochemical images exhibited that the number and intensity of CKS2 positive cells in HCC tissue were higher than those in normal tissue (Figure 3I). These results demonstrated the expression pattern and prognostic value of CKS2 in HCC.
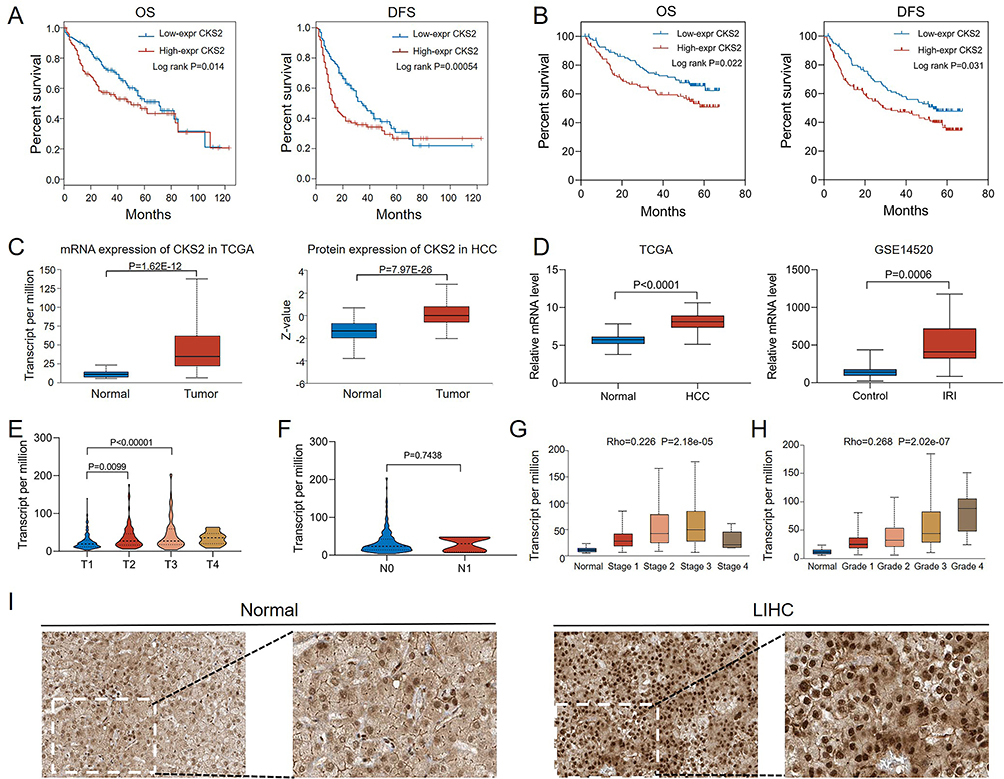 |
Figure 3 Clinical significance of CKS2 in HCC population. (A) The Overall Survival (OS) and disease free survival (DFS) of TCGA-LIHC cohort were described based on K&M survival analysis. (B) The OS and DFS of the GSE14520 cohort were described based on K&M survival analysis. (C) The mRNA and protein expression levels of CKS2 in UALCAN database. (D) The mRNA expression levels of CKS2 in TCGA-LIHC cohort and GSE14520 cohort. (E) CKS2 expression levels in different T stages of HCC. (F) CKS2 expression levels in different N stages of HCC. (G) CKS2 expression levels in different clinical stages of HCC. (H) CKS2 expression levels in different pathological grades of HCC. (I) Immunohistochemical images of CKS2 in normal and HCC tissues were downloaded from HPA database. |
Single-Cell Analysis of CKS2
The alteration of microenvironment is a crucial aspect of the process of HCC recurrence, so the single-cell full-length transcriptome profiles of the primary and recurrent HCC was compared. As shown in Figure 4A, all cells were divided into 27 clusters and annotated as 22 distinct cell clusters by different colors (Figure 4B). And cell distribution was classified and visualized based on HCC type and tissue types (Figure 4C), and the expression of CKS2 in various types of cells was presented in Figure 4D. The quantitative results of expression intensity was revealed by portraying dot plots, suggesting that CKS2 was highly expressed in T cells and HCC tissues (Figure 4E). Moreover, the relative expression levels of CKS2 in all types of cells were illuminated in Figure 4F, and the violin plots were utilized to confirm the high expression of CKS2 in HCC tissue and recurrent HCC (Figure 4G). These results shown high expression of CKS2 in immune cells and recurrent HCC, indicating that CKS2 may be involved in the regulation of the liver immune microenvironment during HCC recurrence.
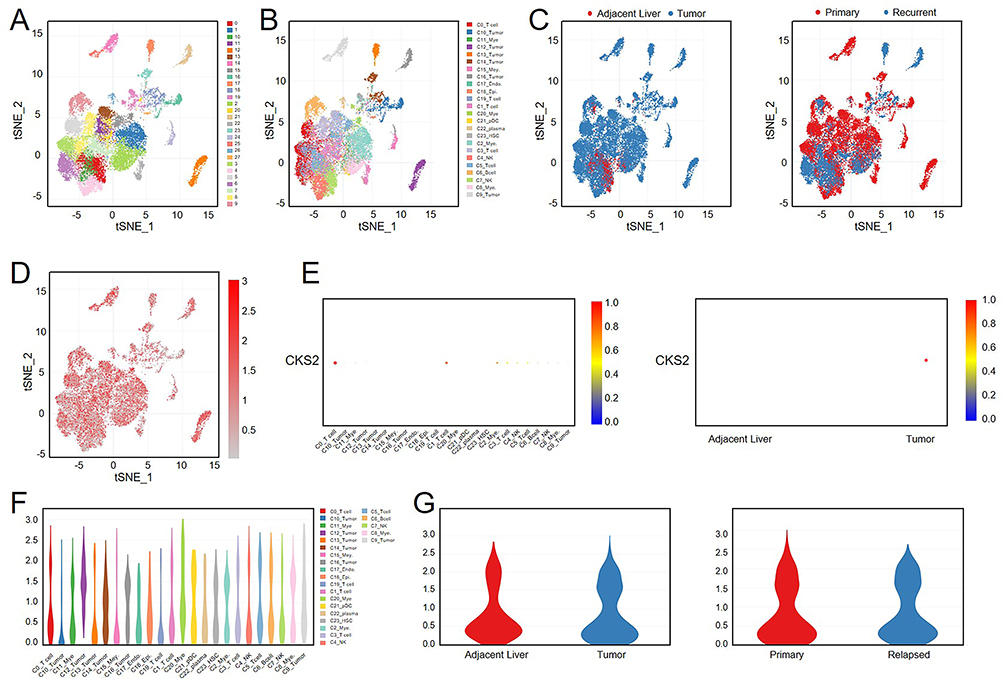 |
Figure 4 Single cell analysis of CKS2. (A) Single-cell clustering t-SNE diagram from SCDS0000020, and different colors represented different cell clusters in CDCP database. (B) Different colors represented different types of cells in single-cell clustering t-SNE diagram from CDCP database. (C) Different colors represented different cellular tissue source in single-cell clustering t-SNE diagram from CDCP database. (D) The t-SNE diagram illustrated the expression distribution of CKS2 in different cells. (E) The dot plot presented the expression intensity of CKS2 in different cells and tissues. (F) The violin plot presented the expression intensity of CKS2 in different cells. (G) The violin diagram shown the expression intensity of CKS2 in different tissue source. |
Functional Enrichment Analysis of CKS2
The above research has confirmed the expression trend and clinical characteristics of CKS2 in the HCC cohort, but the potential mechanism of CKS2 in HCC required further investigation. Based on CKS2 expression, differentially expressed genes (DEGs) between the CKS2 high expression group and the CKS2 low expression group were screened by the DESeq 2 software package, and illustrated through a volcano (Figure 5A) and heatmap (Figure 5B). As shown in Figure 5C and D, KEGG analysis results indicated that DEGs were majorly enriched in pro-tumorigenic pathways such as the cell cycle. Similarly, GO analysis results suggested that the DEGs were enriched in biological processes such as cell cycle and DNA replication (Figure 5E and F). In addition, the results of GSEA analysis demonstrated that pro-tumorigenic related pathways, tumor stemness related pathways, various T cell differentiation pathways and immune related pathways, including Hepatocellular carcinoma, Hippo signaling pathway, mTOR signaling pathway, VEGF signaling pathway, Notch signaling pathway, Wnt signaling pathway, PI3K-Akt signaling pathway, Th1 and Th2 cell differentiation, had high enrichment scores in the high CKS2 expression group (Figure 5G). Meanwhile, the results of GSVA analysis indicated that DNA replication and cell cycle pathways were significantly enriched (Figure 5H). In addition, the correlation between tumor stemness index and CKS2 expression was evaluated by calculating the mRNAsi scores. As presented in Figure 5I, HCC patients with high mRNAsi scores had worse clinical outcomes, and patients with high CKS2 expression had higher mRNAsi scores (Figure 5J), and there was a positive correlation between CKS2 expression and mRNAsi scores (Figure 5K). These results confirmed that CKS2 expression was tightly related to pro-tumorigenic pathways, especially those involving tumor stemness and immune regulation.
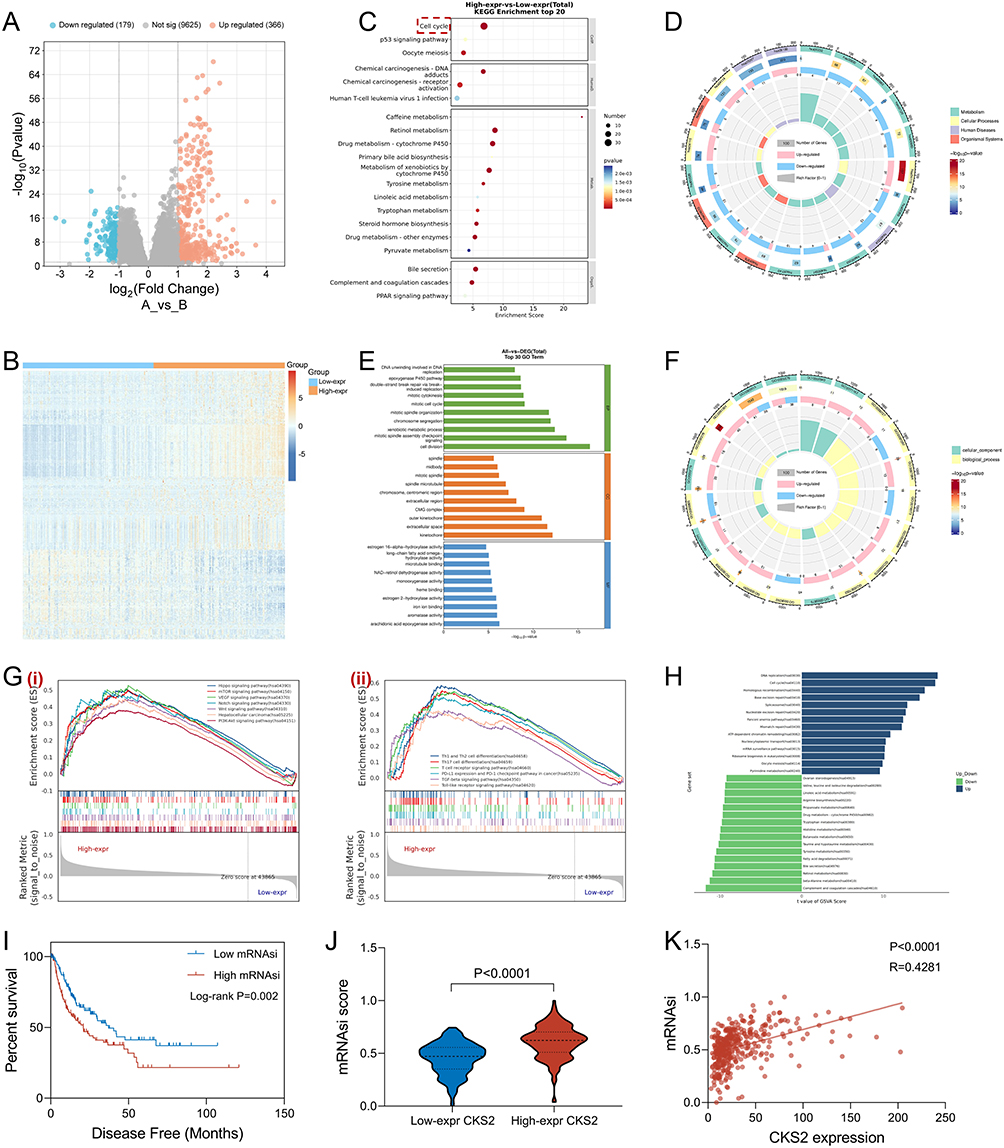 |
Figure 5 Functional analysis of CKS2 in HCC. (A) Volcanic map indicated differential expressed genes (DEGs) based on CKS2 expression. (B) Heat map indicated DEGs. (C) DEGs were subjected to KEGG enrichment analysis and presented through bubble chart, and Cell Cycle, as the most significantly related pathway, was emphasized by the red colored dotted box. (D) DEGs were subjected to KEGG enrichment analysis and presented through circle graph. (E) DEGs were subjected to GO enrichment analysis and presented through bar chart. (F) DEGs were subjected to GO enrichment analysis and presented through circle graph. (G) HCC transcriptome data was subjected to GSEA analysis to determine pathways enrichment, including tumor-promoting pathways (i) and immune-related pathways (ii). (H) HCC transcriptome data was subjected to GSVA analysis to determine pathways enrichment. (I) The correlation between the mRNAsi score and the prognosis of HCC patients was plotted on the K&M survival curve. (J) The mRNAsi scores in different CKS2 expression groups were presented through a violin plot. (K) The correlation between mRNAsi scores and CKS2 expression level in HCC were presented through a scatter plot. |
The Role of CKS2 in Immune Microenvironment
The functional enrichment analysis indicated that CKS2 played a nonnegligible role in regulating immune response and immune cell polarization. Thus, the effect of CKS2 in the immune microenvironment of HCC was investigated. In order to identify common features of the immune microenvironment between the HIRI process and HCC, the proportion of various immune cells was determined. As presented in Figure 6A, compared with normal liver tissues, inflammation related immune cells including neutrophils and M1 macrophages significantly increased after HIRI stress in the GSE14951 cohort. Similarly, within the HCC immune microenvironment, the HCC patients with high CKS2 expression had a higher infiltration abundance of immune suppressive cells, including M2 macrophages and Tregs (Figure 6B). The correlation between CKS2 expression level and the abundance of immune cell infiltration was extensively analyzed. These results demonstrated that in the HIRI process, CKS2 expression was significantly positively correlated with the abundance of M2 macrophages infiltration, while in the HCC immune microenvironment, there were positive correlations between CKS2 expression and the abundance of M1 macrophages, M2 macrophages, Monocytes, CD8+ T cells, Tregs and Dendritic cells, and a negative correlation with NK cells (Figure 6C). And the correlation between CKS2 expression and immunosuppressive cells including M2 macrophages and Tregs were revalidated by scatter plots in Figure 6D. Besides, in order to further investigate the relationship between immune cell infiltration and clinical outcomes, prognostic analysis was conducted, and the results indicated that HCC patients with high M2 macrophages infiltration abundance or high Treg cells infiltration abundance had poorer overall survival (Figure 6E). The association between CKS2 expression and immune inflammation related pathways in HCC was further demonstrated in Figure 6F. And the correlation between the expression level of CKS2 and the immune activation and regulation process was also revealed by scatter plots, especially Co-inhibition and IF_I (Figure 6G). Immunotherapy is an indispensable strategy in clinical anti-tumor therapy, and the expression levels of immune checkpoint genes are a useful indicator for evaluating the efficacy of immunotherapy. As presented in Figure 6H, the lollipop plot shown the correlation between CKS2 expression level and various immune checkpoint genes expression, and the expression level of immune checkpoint genes across different CKS2 expression groups was illustrated by a clustering heatmap (Figure 6I). Moreover, immunophenotyping scores (IPS) were also frequently applied to estimate the efficacy of immunotherapy. As illuminated in Figure 6J, in the CTLA-4 negative PD-1 negative subgroup and CTLA-4 positive PD-1 negative subgroup, the IPS scores of the low CKS2 expression group were higher than those of the high CKS2 expression group, indicating that HCC patients with low CKS2 expression tended to benefit more from immunotherapy. The function of CKS2 expression in the immune microenvironment was further elucidated by evaluating the functional status of T cells. As indicated in Figure 6K, there was a significant correlation between CKS2 expression and several aspects of T cell function status, including T cell proliferation, Senescence, Cytotoxicity and Terminal exhaustion in the TCGA-LIHC cohort. These results collectively supported that CKS2 may exert an indelible role in the immune microenvironment of HCC by affecting the differentiation and functional status of immune cells.
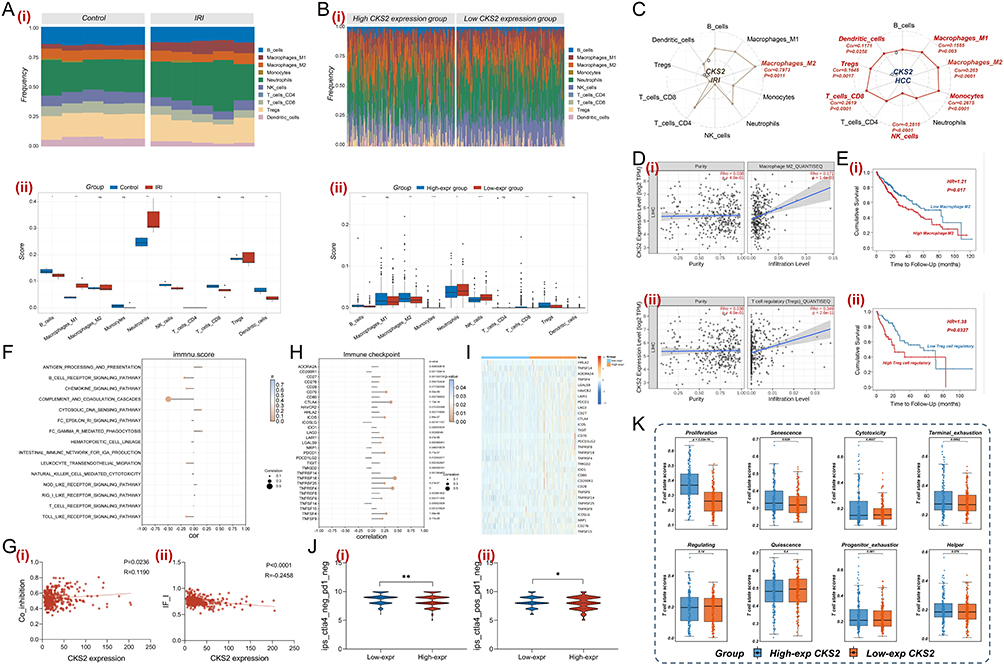 |
Figure 6 Exploration of CKS2 in immune microenvironment. (A) The immune cell proportions of GSE14951 were calculated using the QUANTISEQ algorithm (i), and the differences of various immune cell infiltration proportion between normal tissues and HIRI tissues were compared (ii). (B) Based on CKS2 expression level, the immune cell proportions of TCGA-LIHC cohort were calculated using the QUANTISEQ algorithm (i), and the differences in various immune cell infiltration proportions between different CKS2 expression groups were compared (ii). (C) The correlation between CKS2 expression and various types of immune cell infiltration in HIRI and HCC was shown through radar charts. (D) The correlation between CKS2 expression with M2 macrophage (i) and Tregs (ii) was shown through scatter plot. (E) The prognostic value of M2 macrophages (i) and Treg (ii) infiltration was revealed in HCC population through K&M analysis. (F) The correlation between CKS2 expression and the immune inflammatory pathway was demonstrated through lollipop plot. (G) The scatter plots were used to demonstrate the correlation between CKS2 expression with the immune activation and regulation process, including Co_inhibition (i) and IF_I (ii). (H) The correlation between CKS2 expression and the expression of immune checkpoint genes were presented through lollipop plot. (I) The differences of immune checkpoint genes expression between the different CKS2 expression groups were shown by heatmap. (J) The Immunophenotype Score (IPS) was also used to evaluate the efficacy of immunotherapy between different CKS2 expression, including ips_ctla4_neg_pd1_neg (i) and ips_ctla4_pos_pd1_neg (ii). (K) Evaluation of T cell function status at different CKS2 expression levels in TCGA using TCellSI program. mean ± SEM, *p<0.05, **p<0.01, Student’s t-test. |
Mutation Landscape of HCC Cohort
Somatic mutations are also an essential element influencing the development and recurrence of cancers, providing potential targets for exploring treatment targets. Based on the expression level of CKS2, the somatic mutation waterfall plot of TCGA-LIHC was demonstrated in Figure 7A. It was observed that the main mode of somatic mutation was missense mutation, and TP53, as a classical tumor suppressor gene, exhibited a significantly higher mutation frequency in the high CKS2 expression group compared to the low expression group (Figure 7B). Additionally, the transcriptional level of CKS2 was assessed in patients with and without TP53 mutations, and the results highlighted that TP53-mutated patients had higher CKS2 expression (Figure 7C) and worse clinical prognosis (Figure 7D), indicating that CKS2 may mediate the malignant biological behavior of HCC in association with TP53 mutation. As presented in Figure 7E, the influence of different CKS2 expression levels on oncogenic pathways was analyzed. And the results indicated that the oncogenic pathways were more active in the group with high CKS2 expression. Furthermore, copy number variations (CNV) between different CKS2 expression groups were calculated and analyzed. As illuminated in Figure 7F, the top 20 genes with the largest differences in CNV frequency were listed, and the types of CNV alterations (gain or loss) for these genes were revealed in Figure 7G. The mutant-allele tumor heterogeneity (MATH) score was utilized to evaluate the genetic heterogeneity of tumor samples by quantifying the frequency of all allele mutations within the tumor. In HCC, a higher MATH score indicated a worse clinical prognosis (Figure 7H). As illustrated in Figure 7I, there was a positive correlation between CKS2 expression levels and MATH scores, and patients in the high CKS2 expression group tended to achieve higher MATH scores (Figure 7J). Besides, microsatellite instability (MSI) score is commonly used to assess the stability of microsatellite sequences in tumor tissues, and MSI score could predict the prognosis and treatment effectiveness of patients. Previous literature has confirmed that HCC patients with high MSI scores have a clinical survival disadvantage compared to those with low MSI scores. As presented in Figure 7K, there was a positive correlation between CKS2 expression and MSI score, and HCC patients with high CKS2 expression had higher MSI scores (Figure 7L). These results demonstrated that the expression of CKS2 was tightly related to the genomic mutation features of HCC patients.
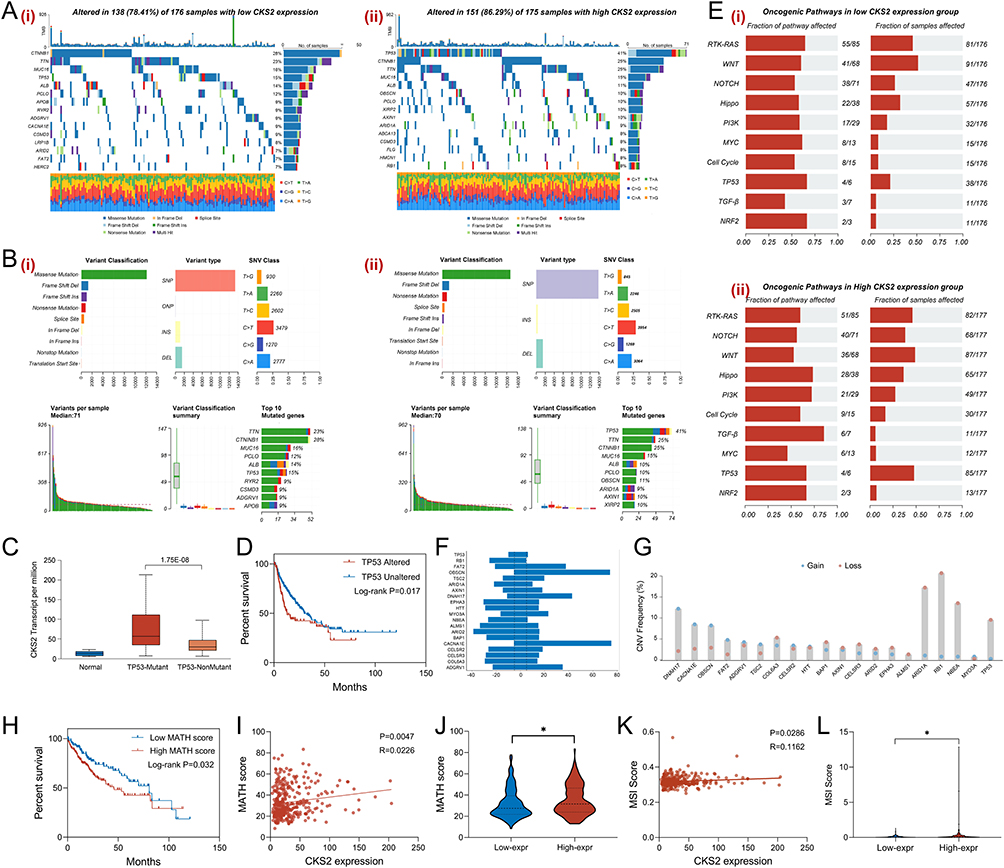 |
Figure 7 Genomic mutation landscape in HCC based on CKS2 expression. (A) Oncoplot presented the somatic mutation landscape in low CKS2 expression (i) and high CKS2 expression (ii), and showed the top 15 genes with highest mutation frequency. (B) The charts illustrated the distribution of variants classification, variant type and SNV class in low CKS2 expression (i) and high CKS2 expression (ii). (C) CKS2 expression in different TP53 mutation states groups were displayed through a bar chart. (D) The correlation between different TP53 mutations states and the prognosis of HCC patients was presented through K&M analysis. (E) The activity of oncogenic pathways was assessed in low CKS2 expression (i) and high CKS2 expression (ii). (F) The top 20 genes with the largest mutation frequency were listed through a bar chart. (G) CNV types (gain/loss) for the top 20 genes. (H) The correlation between the MATH scores and the prognosis of HCC patients was presented through K&M analysis. (I) The correlation between the MATH score and CKS2 expression was illustrated through a scatter plot. (J) The MATH score in different CKS2 expression groups was displayed through a violin plot. (K) The correlation between the MSI score and the CKS2 expression was illustrated through a scatter plot. (L) The MSI score in different CKS2 expression level was displayed through a violin plot. mean ± SEM, *p<0.05, Student’s t-test. |
Sensitivity of Chemotherapy Drugs
Chemotherapy is a vital therapeutic strategy in the process of anti-tumor treatment. However, as treatment progresses, drug resistance has become a major obstacle, and the development of drug resistance often indicates a poor prognosis. And the situation of drug resistance is partly associated with gene expression and mutations. Therefore, it has clinical significance to investigate the sensitivity of different chemotherapy drugs based on CKS2 expression. As illuminated in Figure 8, based on CKS2 expression level, the drug sensitivity analysis was performed by applying the oncoPredict software package, revealing that patients with low CKS2 expression were more sensitive to 12 commonly used chemotherapy drugs for clinical treatment of HCC, including Bleomycin, Cisplatin, Docetaxel, Doxorubicin, Etoposide, Gemcitabine, Mitomycin C, Gefitinib, 5-Fluorouracil, Sorafenib, Vinorelbine and Oxaliplatin. This result suggested that HCC patients with high CKS2 expression were more likely to develop resistance to chemotherapy drugs, thereby increasing the difficulty of clinical drug treatment, and that the expression level of CKS2 could serve as an indicator for predicting clinical drug efficacy.
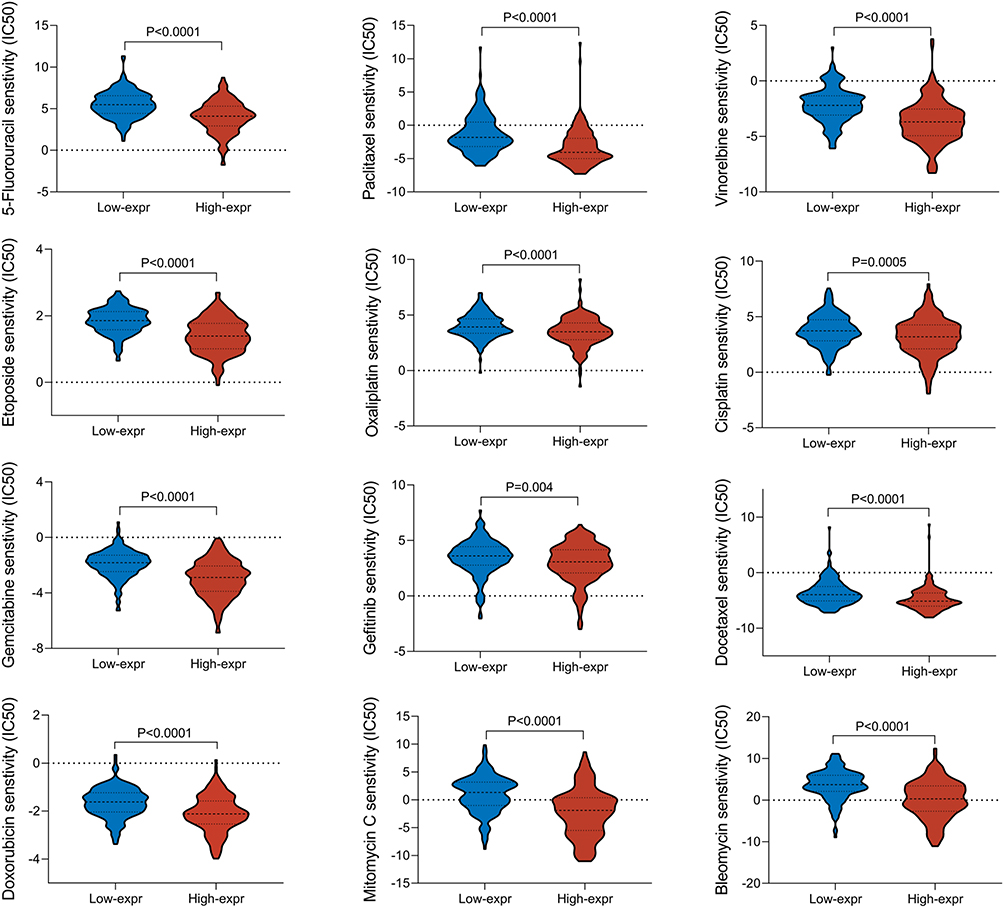 |
Figure 8 Drug sensitivity analysis. In different CKS2 expression groups, the sensitivity of commonly used chemotherapy drugs for HCC patients were presented through violin diagrams. |
The Verification of CKS2 Expression
The above bioinformatics analysis results preliminarily confirmed the undeniable role of CKS2 in the process of HIRI and HCC, and the function of CKS2 was verified in the collected clinical samples. Through analysis of clinical specimens from different groups, the results indicated that the expression of CKS2 in HIRI and HCC was significantly increased at the mRNA (Figure 9A) and protein (Figure 9B) levels, and the quantification of protein expression was exhibited in Figure 9C. M2 macrophages, as one of the crucial macrophage phenotypes, exert an immunosuppressive role in the hepatic immune microenvironment. By utilizing flow cytometry analysis, compared with the control samples, the infiltration abundance of M2 macrophages in the immune microenvironment of HIRI and HCC increased to varying degrees (Figure 9D and E), and the mRNA expression of representative molecular markers of M2 macrophages increased correspondingly (Figure 9F). In addition, liver clinical samples from different groups were subjected to H&E staining to display the microstructure, and immunohistochemical staining was applied to highlight the protein expression intensity of CKS2 (Figure 9G and H). In order to investigate the correlation between CKS2 expression level and M2 macrophage, the infiltration abundance of M2 macrophages was measured in different CKS2 expression groups (Figure 9I). And the results indicated a positive correlation between CKS2 expression and M2 macrophage infiltration abundance (Figure 9J). These results validated the CKS2 expression patterns in different liver diseases, and revealed that CKS2 may mediate the intrahepatic immune microenvironment by regulating M2 macrophages.
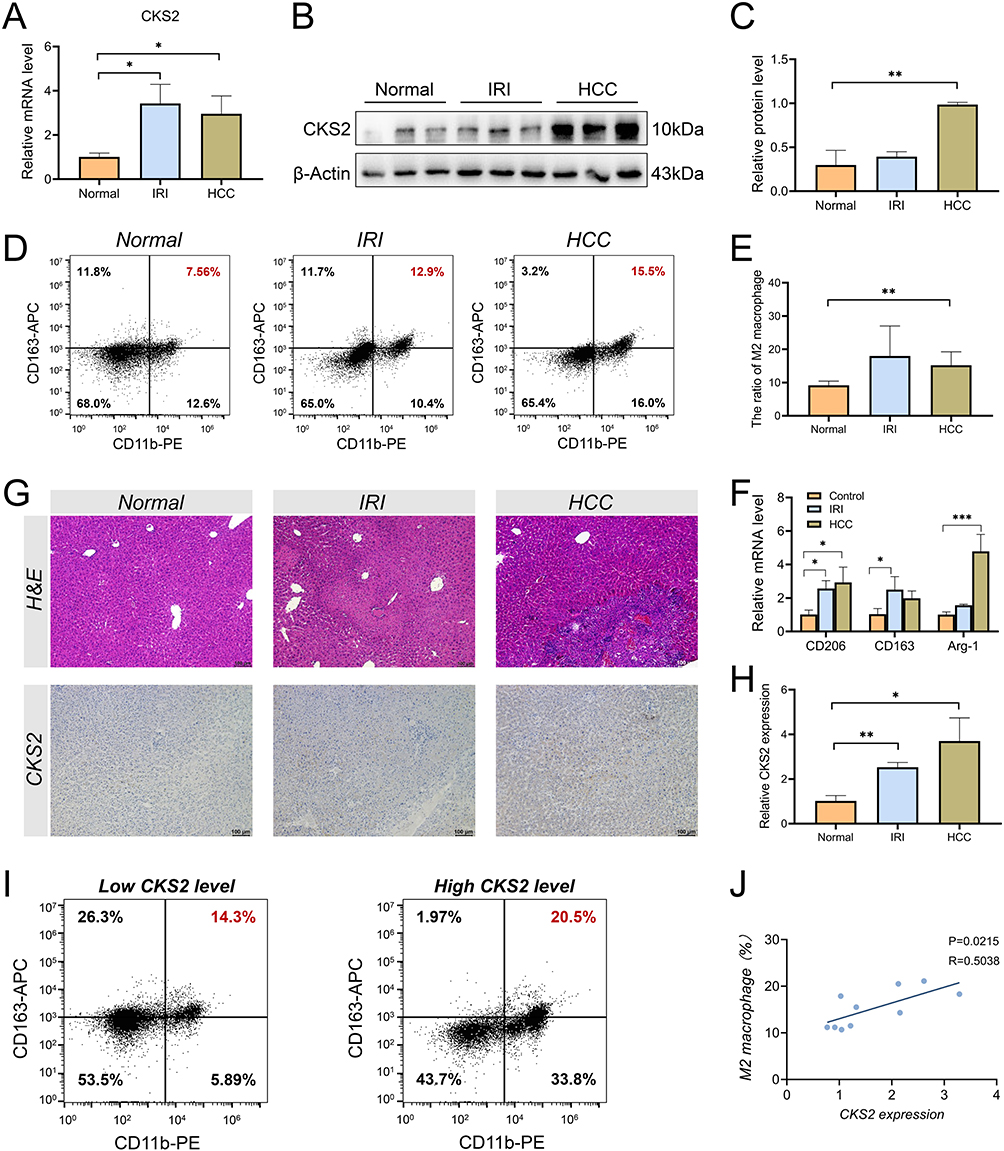 |
Figure 9 Validation of CKS2 expression and function. (A) Differential expression of CKS2 at mRNA level between normal tissues, HIRI tissues and HCC tissues through RT-qPCR. (B) Western blotting images illustrated the differential expression of CKS2 at protein level between normal tissues, HIRI tissues and HCC tissues and quantified in (C). Detection (D) and quantization (E) of M2 macrophage infiltration ratio in normal tissues, HIRI tissues and HCC tissues using flow cytometry. (F) The mRNA expression levels of M2 macrophage markers, including CD206, CD163 and Arg-1, were detected by RT-qPCR in normal tissues, HIRI tissues and HCC tissues. (G) The microstructure of the liver was displayed through H&E staining, and immunohistochemical images presented CKS2 expression in normal tissues, HIRI tissues and HCC tissues (20×, n=5/group), and the quantitation of IHC was shown in (H). (I) The infiltration abundance of M2 macrophages was detected in different CKS2 expression groups of HCC tissues by flow cytometry (n=5/group). (J) The correlation between CKS2 expression levels and M2 macrophages infiltration abundance was demonstrated through a scatter plot. mean ± SEM, *p<0.05, **p<0.01, ***p<0.001, Student’s t-test. |
Discussion
HCC is a malignant tumor that has not been completely conquered at present, and its high incidence and recurrence rate are daunting.17 Currently, hepatectomy or liver transplantation are effective treatment strategies for HCC.18 In order to reduce intraoperative bleeding, it is inevitable for patients to suffer from surgical related complications during surgical procedures, especially hepatic ischemia-reperfusion injury.19,20 The process of HIRI is a complicated and variable pathophysiological process that involves the cellular differentiation and chemotaxis, cytokine secretion, and activation of signaling pathways, profoundly affecting the entire hepatic microenvironment.5,21 However, the hepatic microenvironment induced by HIRI stress appears to provide a more favorable environment for tumor cells, and there may be a potential correlation between the HIRI process and HCC recurrence.21 Previous studies, including clinical and basic research, have focused on how HIRI accelerates HCC recurrence, but the specific mechanism or key factors involved have not been fully elucidated.
Based on our application of bioinformatics approaches, this study performed WGCNA on HIRI transcriptome data to screen characteristic modules, and relevant and significant genes involved in the HIRI process were detected through differential expression analysis. Concurrently, DFS-related genes were screened for the HCC cohort, and CKS2 was identified as a potential factor in HIRI-induced HCC recurrence. Furthermore, we comprehensively analyzed the expression patterns and functions of CKS2 from multiple perspectives, and determined its research significance in the HCC cohort. In addition, in order to further elucidate the role of CKS2 in HCC, the association between CKS2 expression with liver immune microenvironment, tumor stemness, mutation landscape, and drug sensitivity were evaluated. Our results indicated that CKS2 may affect the differentiation of immune cells in the liver immune microenvironment, particularly M2 macrophages, and CKS2 expression was also closely related to tumor stemness indicators. Moreover, we preliminarily confirmed the expression trend and potential function of CKS2 in HCC through analysis of clinical samples.
The immune microenvironment exerts an irreplaceable role in both the HIRI process and HCC.22 Innate immunity and adaptive immunity are activated sequentially, and the crosstalk between cytokines and immune cells amplifies the inflammatory response during the HIRI process.7 Due to the compensatory mechanisms of the body, the macrophages polarization towards M2 macrophages gradually increases after experiencing HIRI-stress, and they secrete anti-inflammatory factors such as IL-10 and TGF-β to alleviate the inflammatory response.23 However, the immunosuppressive characteristics in M2 macrophages are closely related to tumor progression and drug resistance in the HCC immune microenvironment.24 In the immune microenvironment of HCC, a majority of tumor-associated macrophages (TAMs) have a similar phenotype and function to M2 macrophages, and have the ability to secrete immunosuppressive factors and pro-angiogenic factors to promote tumor cell growth and angiogenesis.25,26 Therefore, it is reasonable to assume that the increased polarization of M2 macrophages caused by HIRI has the fundamental conditions to accelerate HCC recurrence. Consistent with this, our results presented a positive correlation between CKS2 expression and M2 macrophage infiltration abundance in HCC, suggesting that this may be one of the potential mechanisms. These conclusions were consistent with previously reported results, which indicated that high CKS2 expression promoted tumor cell proliferation, inhibited apoptosis, and facilitated tumor ferroptosis resistance, and was tightly related to poor clinical prognosis.15,27,28 The Tumor stemness index mainly reflects the degree of stemness characteristics of tumor cells, which provides a quantitative indicator for understanding the occurrence, development, recurrence, treatment and prognosis of tumors.29 Cells with high stemness index have strong self-renewal ability, acting like the “seed cells” of tumors, which can reinitiate new tumor growth, leading to tumor recurrence. In our conclusion, the results presented a positive correlation between CKS2 expression and tumor stemness indicators, indicating that CKS2 can participate in promoting HCC recurrence by regulating tumor cell stemness, which could also be one of the mechanisms by which CKS2 contributes to HCC recurrence. Nevertheless, this study has certain limitations. Our work primarily focused on bioinformatic exploration, identifying the significance of CKS2 in mediating HIRI-induced HCC recurrence. And we initially confirmed the expression pattern of CKS2 and its correlation with M2 macrophages by applying basic experimental techniques in reality. However, the specific molecular mechanisms through which CKS2 regulates HIRI-induced HCC recurrence process are still lacking detailed mechanistic research, and the mechanism by which CKS2 regulates M2 macrophages also requires further in-depth studies.
In short, this study preliminarily revealed the expression patterns and function of CKS2 in HIRI-induced HCC recurrence, and attempted to explore a potential mechanism involving CKS2 in promoting HCC recurrence. However, more studies are needed to elucidate the underlying signaling pathways and cellular mechanisms.
Conclusion
This study comprehensively identified CKS2 as a risk factor in HIRI-induced HCC recurrence, analyzed the expression pattern, molecular function and clinical significance of CKS2 in HCC, and verified its correlation with M2 macrophages infiltration in HCC, providing a novel potential molecular target and research direction for further investigation.
Abbreviations
HIRI, Hepatic ischemia-reperfusion injury; HCC, Hepatocellular carcinoma; WGCNA, Weighted Gene Co-Expression Network Analysis; DFS, Disease-Free Survival; TCGA, The Cancer Genome Atlas; GEO, Gene Expression Omnibus; GEPIA, The Gene Expression Profiling Interactive Analysis; DEGs, differentially expressed genes; LASSO, Least Absolute Shrinkage and Selection Operator; ROC, Receiver Operating Characteristic Curve; OS, Overall Survival; DFS, Disease free survival; K&M, Kaplan-Meier; UALCAN, The University of Alabama at Birmingham Cancer data analysis Portal; HPA, The Human Protein Atlas; CDCP, The Cell-omics Data Coordinate Platform; KEGG, Kyoto Encyclopedia of Genes and Genomes; GO, Gene Ontology; GSEA, Gene Set Enrichment Analysis; GSVA, Gene Set Variation Analysis; TCIA, The Cancer Immunome Atlas; IPS, Immune phenotype score; TCellSI, T Cell State Identifier; CNV, copy number variation; MATH, Mutant-Allele Tumor Heterogeneity; MSI, Microsatellite instability; H&E, Hematoxylin-eosin; IHC, Immunohistochemical.
Data Sharing Statement
The datasets generated during and/or analyzed during the study are available from the corresponding author (Senzhe Xia) on reasonable request.
Ethical Approval and Consent to Participate
All human-involved were approved by the Ethics Committee of Wenzhou Central Hospital, and this study complies with the principles of the Declaration of Helsinki (No. 202502141936000345173).
Consent for Publishment
The manuscript had never been submitted to more than one journal for simultaneous consideration. The submitted work is original and has not been published elsewhere in any form or language.
Acknowledgments
The authors would like to acknowledge the technical assistance provided by the staff of the Department of Comprehensive Surgery, Wenzhou Central Hospital, Wenzhou, China.
Author Contributions
All authors made a significant contribution to the work reported, whether that is in the conception, study design, execution, acquisition of data, analysis and interpretation, or in all these areas; took part in drafting, revising or critically reviewing the article; gave final approval of the version to be published; have agreed on the journal to which the article has been submitted; and agree to be accountable for all aspects of the work.
Funding
There is no funding to report.
Disclosure
The authors have no conflicts to disclose in this work.
References
1. Bray F, Laversanne M, Sung H, et al. Global cancer statistics 2022: GLOBOCAN estimates of incidence and mortality worldwide for 36 cancers in 185 countries. CA. 2024;74(3):229–263. doi:10.3322/caac.21834
2. Siegel RL, Giaquinto AN, Jemal A. Cancer statistics, 2024. CA. 2024;74(1):12–49. doi:10.3322/caac.21820
3. Yeo YH, Abdelmalek M, Khan S, et al. Current and emerging strategies for the prevention of hepatocellular carcinoma. Nat Rev Gastroenterol Hepatol. 2024;22:173–90.
4. European Association for the Study of the Liver. EASL clinical practice guidelines on the management of hepatocellular carcinoma. J Hepatol. 2025;82(2):315–374. doi:10.1016/j.jhep.2024.08.028
5. George J, Lu Y, Tsuchishima M, Tsutsumi M. Cellular and molecular mechanisms of hepatic ischemia-reperfusion injury: the role of oxidative stress and therapeutic approaches. Redox Biol. 2024;75:103258. doi:10.1016/j.redox.2024.103258
6. Zhang W, Liu J, Li P, Wang X, Tang B. Reversible fluorescent probes for dynamic imaging of liver ischemia-reperfusion injury. Acc Chem Res. 2024;57(17):2594–2605. doi:10.1021/acs.accounts.4c00449
7. Liu J, Luo R, Zhang Y, Li X. Current status and perspective on molecular targets and therapeutic intervention strategy in hepatic ischemia-reperfusion injury. Clin Mol Hepatol. 2024;30(4):585–619. doi:10.3350/cmh.2024.0222
8. Yang F, Zhang Y, Ren H, et al. Ischemia reperfusion injury promotes recurrence of hepatocellular carcinoma in fatty liver via ALOX12-12HETE-GPR31 signaling axis. J Exp Clin Cancer Res. 2019;38(1):489. doi:10.1186/s13046-019-1480-9
9. Chen H, Lu D, Yang X, et al. One shoot, two birds: alleviating inflammation caused by ischemia/reperfusion injury to reduce the recurrence of hepatocellular carcinoma. Front Immunol. 2022;13:879552. doi:10.3389/fimmu.2022.879552
10. Ren H, Chen Y, Zhu Z, et al. FOXO1 regulates Th17 cell-mediated hepatocellular carcinoma recurrence after hepatic ischemia-reperfusion injury. Cell Death Dis. 2023;14(6):367. doi:10.1038/s41419-023-05879-w
11. Orouji S, Liu MC, Korem T, Peters MAK. Domain adaptation in small-scale and heterogeneous biological datasets. Sci Adv. 2024;10(51):eadp6040. doi:10.1126/sciadv.adp6040
12. Hrovatin K, Sikkema L, Shitov VA, et al. Considerations for building and using integrated single-cell atlases. Nat Meth. 2024.
13. Grey W, Atkinson S, Rix B, et al. The CKS1/CKS2 proteostasis axis is crucial to maintain hematopoietic stem cell function. HemaSphere. 2023;7(3):e853. doi:10.1097/HS9.0000000000000853
14. Fujimitsu K, Grimaldi M, Yamano H. Cyclin-dependent kinase 1-dependent activation of APC/C ubiquitin ligase. Science. 2016;352(6289):1121–1124. doi:10.1126/science.aad3925
15. Yang L, Fang C, Han J, et al. CKS2 induces autophagy-mediated glutathione metabolic reprogramming to facilitate ferroptosis resistance in colon cancer. Mol Med. 2024;30(1):219. doi:10.1186/s10020-024-00979-5
16. Yu K, Ji Y, Liu M, et al. High expression of CKS2 predicts adverse outcomes: a potential therapeutic target for glioma. Front Immunol. 2022;13:881453. doi:10.3389/fimmu.2022.881453
17. Fuster-Anglada C, Mauro E, Ferrer-Fàbrega J, et al. Histological predictors of aggressive recurrence of hepatocellular carcinoma after liver resection. J Hepatol. 2024;81(6):995–1004. doi:10.1016/j.jhep.2024.06.018
18. Singal AG, Kanwal F, Llovet JM. Global trends in hepatocellular carcinoma epidemiology: implications for screening, prevention and therapy. Nat Rev Clin Oncol. 2023;20(12):864–884. doi:10.1038/s41571-023-00825-3
19. Liu J, Man K. Mechanistic insight and clinical implications of ischemia/reperfusion injury post liver transplantation. CMGH. 2023;15(6):1463–1474. doi:10.1016/j.jcmgh.2023.03.003
20. Hirao H, Nakamura K, Kupiec-Weglinski JW. Liver ischaemia-reperfusion injury: a new understanding of the role of innate immunity. Nat Rev Gastroenterol Hepatol. 2022;19(4):239–256. doi:10.1038/s41575-021-00549-8
21. Maspero M, Yilmaz S, Cazzaniga B, et al. The role of ischaemia-reperfusion injury and liver regeneration in hepatic tumour recurrence. JHEP Rep. 2023;5(11):100846. doi:10.1016/j.jhepr.2023.100846
22. Liu S, Xiao X, Zhang L, et al. Reprogramming exosomes to escape from immune surveillance for mitochondrial protection in hepatic ischemia-reperfusion injury. Theranostics. 2024;14(1):116–132. doi:10.7150/thno.88061
23. Zhang Y, Zhang L, Zhao Y, He J, Zhang Y, Zhang X. PGC-1α inhibits M2 macrophage polarization and alleviates liver fibrosis following hepatic ischemia reperfusion injury. Cell Death Discov. 2023;9(1):337. doi:10.1038/s41420-023-01636-2
24. Li X, Yao W, Yuan Y, et al. Targeting of tumour-infiltrating macrophages via CCL2/CCR2 signalling as a therapeutic strategy against hepatocellular carcinoma. Gut. 2017;66(1):157–167. doi:10.1136/gutjnl-2015-310514
25. Cheng K, Cai N, Zhu J, Yang X, Liang H, Zhang W. Tumor-associated macrophages in liver cancer: from mechanisms to therapy. Cancer Commun. 2022;42(11):1112–1140. doi:10.1002/cac2.12345
26. Chu X, Tian Y, Lv C. Decoding the spatiotemporal heterogeneity of tumor-associated macrophages. Mol Cancer. 2024;23(1):150. doi:10.1186/s12943-024-02064-1
27. Jonsson M, Fjeldbo CS, Holm R, Stokke T, Kristensen GB, Lyng H. Mitochondrial function of CKS2 oncoprotein links oxidative phosphorylation with cell division in chemoradioresistant cervical cancer. Neoplasia. 2019;21(4):353–362. doi:10.1016/j.neo.2019.01.002
28. Lin L, Fang Z, Lin H, et al. Depletion of Cks1 and Cks2 expression compromises cell proliferation and enhance chemotherapy-induced apoptosis in HepG2 cells. Oncol Rep. 2016;35(1):26–32. doi:10.3892/or.2015.4372
29. Loh JJ, Ma S. Hallmarks of cancer stemness. Cell Stem Cell. 2024;31(5):617–639. doi:10.1016/j.stem.2024.04.004
 © 2025 The Author(s). This work is published and licensed by Dove Medical Press Limited. The
full terms of this license are available at https://www.dovepress.com/terms
and incorporate the Creative Commons Attribution
- Non Commercial (unported, 4.0) License.
By accessing the work you hereby accept the Terms. Non-commercial uses of the work are permitted
without any further permission from Dove Medical Press Limited, provided the work is properly
attributed. For permission for commercial use of this work, please see paragraphs 4.2 and 5 of our Terms.
© 2025 The Author(s). This work is published and licensed by Dove Medical Press Limited. The
full terms of this license are available at https://www.dovepress.com/terms
and incorporate the Creative Commons Attribution
- Non Commercial (unported, 4.0) License.
By accessing the work you hereby accept the Terms. Non-commercial uses of the work are permitted
without any further permission from Dove Medical Press Limited, provided the work is properly
attributed. For permission for commercial use of this work, please see paragraphs 4.2 and 5 of our Terms.