Back to Journals » Cancer Management and Research » Volume 18

Circulating Tumor Cell PD-L1 and Peripheral Blood CD8+ T-Cell PD-1 as Dual Liquid Biopsy Biomarkers for Immunotherapy Outcomes in Advanced Non–Small Cell Lung Cancer: A Retrospective Study
Authors Guan S, Huangfu J, Zhu X, Ge Y, Ding Y ![]() , Chen T
, Chen T ![]() , Zhang Y, Yang T
, Zhang Y, Yang T ![]() , Liu H, Zhang L, Chen X, Zhou J
, Liu H, Zhang L, Chen X, Zhou J
Received 17 November 2025
Accepted for publication 4 March 2026
Published 18 March 2026 Volume 2026:18 580857
DOI https://doi.org/10.2147/CMAR.S580857
Checked for plagiarism Yes
Review by Single anonymous peer review
Peer reviewer comments 2
Editor who approved publication: Professor Yong Teng
Shuhong Guan,1,* Junkang Huangfu,2,* Xiaoqin Zhu,1 Yunqi Ge,1 Ying Ding,2 Tianyu Chen,1 Yilei Zhang,1 Tingting Yang,1 Huimin Liu,1 Long Zhang,2 Xiyao Chen,2 Jun Zhou1
1Department of Respiratory and Critical Care Medicine, Changzhou First People’s Hospital, Changzhou, Jiangsu, 213000, People’s Republic of China; 2Soochow University, Suzhou, Jiangsu, People’s Republic of China
*These authors contributed equally to this work
Correspondence: Jun Zhou, Department of Respiratory and Critical Care Medicine, Changzhou First People’s Hospital, Changzhou, Jiangsu, People’s Republic of China, Email [email protected]
Background: Circulating tumor cells (CTCs) and peripheral T-cell immune checkpoints offer minimally invasive biomarkers for immune checkpoint inhibitor (ICI) therapy. We assessed whether a dual biomarker combining PD-L1 on CTCs and PD-1 on circulating CD8+ T cells is associated with outcomes in advanced non–small cell lung cancer (NSCLC).
Methods: We retrospectively enrolled stage IIIB–IV NSCLC patients treated with anti-PD-1/PD-L1 agents (any line) from January 2022 to December 2023. Eligibility required pretreatment blood and evaluable dual-biomarker testing; all 126 included patients had successful CTC assessment and flow-cytometric CD8+ T-cell PD-1 measurement. Patients were classified as CTC PD-L1–positive if ≥ 1 CTC showed membranous and/or cytoplasmic PD-L1 staining. CD8+ PD-1high was defined by the cohort median PD-1+ fraction (35.6%). Patients were stratified by CTC PD-L1 status and CD8+ PD-1 (high/low). The primary endpoint was progression-free survival (PFS); overall survival (OS) and objective response rate (ORR) were secondary endpoints.
Results: Fifty-seven patients (45.2%) were CTC PD-L1–positive. Median PFS was longest in the PD-L1+/PD-1high group (14.2 months) versus the other three groups (8.5, 6.3, and 4.8 months; p< 0.001). ORR followed a similar gradient (41.9%, 30.8%, 22.9%, and 14.7%; p=0.021). After adjustment for baseline covariates, dual-biomarker status remained independently associated with PFS (HR=0.48, 95% CI 0.32– 0.72; p< 0.001) and OS (HR=0.53, 95% CI 0.35– 0.80; p=0.002).
Conclusion: This dual liquid-biopsy approach was associated with response and survival in this retrospective advanced NSCLC cohort receiving ICIs, supporting its potential for prognostic stratification; prospective validation is needed.
Keywords: circulating tumor cells, non-small cell lung cancer, CD8+ T cells, PD-L1, PD-1, immunotherapy, liquid biopsy, predictive biomarkers
Introduction
Non-small cell lung cancer (NSCLC) represents more than 85% of lung cancer cases and stands as the leading cause of cancer-related deaths globally.1 Advanced NSCLC, diagnosed in over 60% of patients at presentation, poses significant therapeutic challenges due to its aggressive nature and limited response to conventional treatments such as chemotherapy and radiotherapy.2 Despite the progress, the 5-year overall survival rate for advanced NSCLC remains dismal, underscoring the urgent need for innovative therapeutic strategies and predictive biomarkers to guide treatment decisions.
Immune checkpoint inhibitors (ICIs), including PD-L1/PD-1 monoclonal antibodies, revolutionize advanced NSCLC management, offering substantial survival benefits for a subset of patients.3 However, response rates to ICIs vary widely, with long-term survivorship ranging from 16% to 37% at 2–5 years in unselected populations.4 Current reliance on tissue-based PD-L1 expression as a predictive marker is hampered by tumor heterogeneity, invasive sampling requirements, and inconsistent correlations with clinical outcomes due to variability in IHC assays and scoring criteria.5 Moreover, the integration of ICIs with chemotherapy as a first-line standard, irrespective of PD-L1 status, highlights the need for more reliable, non-invasive biomarkers to optimize patient selection and therapeutic efficacy.6
Circulating tumor cells (CTCs) are reported as a promising liquid biopsy tool, providing real-time insights into tumor dynamics and PD-L1 expression with reduced interference from spatial heterogeneity.7 Although a great body of literature suggests CTC PD-L1 positivity correlates with immunotherapy response, its prognostic value remains debated due to variability in detection methods and small sample sizes.8–11 Additionally, CD8+ T cells are pivotal for tumor cell elimination, and PD-1 expression increment in these cells tightly associate with T cell exhaustion, which may compromise anti-tumor immunity and influence the response to immune checkpoint inhibitors.12–14 While single biomarkers like CTC PD-L1 or tissue PD-L1 have shown limited predictive power, the interplay between CTC PD-L1 and peripheral CD8+ T cell PD-1 offers a novel avenue to enhance prognostic accuracy, addressing the shortcomings of current approaches.7,15,16
This study aims to establish and validate a dual liquid biopsy platform integrating CTC PD-L1 and peripheral CD8+ PD-1+ T cells proportion to predict immunotherapy efficacy in advanced NSCLC. By leveraging this non-invasive strategy, we hypothesize that dual biomarker stratification can identify patients most likely to response to ICIs, potentially improving clinical decision-making. The findings may provide a practical tool to overcome the limitations of traditional biomarkers, offering a foundation for personalized immunotherapy in this challenging disease. Because CD8+ T cells are key effector cells mediating antitumor responses to PD-1/PD-L1 blockade, we prespecified circulating CD8+ T-cell PD-1 expression as the immune component of the dual-biomarker framework.
Study Population and Methods
Research Design
We employed retrospective cohort research examining the prognostic and predictive value of circulating tumor cell (CTC) PD-L1 expression combined with proportion of CD8+ PD-1+T cells as dual biomarkers for immunotherapy outcomes in advanced NSCLC patients. Clinical data and biological samples were collected between January 2022 and December 2023 as part of routine clinical care. Ethical approval was obtained from the Institutional Review Board (IRB) of Changzhou First People’s Hospital [NO.:F-IRB-SOP-00710, (2024) Science No. 135] before conducting this retrospective analysis. All participants provided written informed consent authorizing the future research use of their clinical data and biological samples at the time of initial treatment. Blood specimens were obtained during routine clinical procedures following a standardized biobanking protocol to ensure consistent sample processing. The retrospective analysis was conducted in compliance with the Personal Information Protection Law of China and the Declaration of Helsinki, with all data de-identified prior to analysis.
Study Population
This retrospective study included patients with advanced NSCLC who received anti–PD-1/PD-L1 immune checkpoint inhibitor (ICI) therapy at Changzhou First People’s Hospital (Changzhou, Jiangsu, China) between January 2022 and December 2023. A total of 280 patients were initially screened. Patients were enrolled according to predefined inclusion and exclusion criteria (Figure 1), and 126 patients were included in the final efficacy cohort after successful baseline dual-biomarker assessment (CTC PD-L1 evaluation and flow-cytometric PD-1 measurement on circulating CD8+ T cells).
 |
Figure 1 Study Flow Diagram. The flow diagram summarizes patient screening and selection for this retrospective cohort. Between January 2022 and December 2023, 280 patients with advanced non–small cell lung cancer (NSCLC) who received anti–PD-1/PD-L1 immune checkpoint inhibitor (ICI) therapy at Changzhou First People’s Hospital (Changzhou, Jiangsu, China) were assessed for eligibility. Patients were screened according to predefined inclusion and exclusion criteria. Reasons for exclusion included failure to meet eligibility criteria (e.g., non-advanced disease), prior immunotherapy exposure, inadequate performance status or clinical condition precluding treatment and follow-up (e.g., ECOG ≥3, severe comorbidities, or life expectancy <3 months), refusal to participate, and insufficient sample quality or technical failure for biomarker analyses (e.g., blood draw failure, CTC detection failure, hemolysis/poor sample quality, flow cytometry failure, or insufficient CD8+ T-cell events). Two patients were excluded prior to efficacy analysis due to early loss to follow-up or early death. The final efficacy cohort consisted of 126 patients who completed baseline dual-biomarker assessment (CTC PD-L1 evaluation and flow-cytometric PD-1 measurement on circulating CD8+ T cells) and had adequate follow-up for outcome assessment. Patients were stratified into four groups based on baseline CTC PD-L1 status (positive vs negative) and circulating CD8+ T-cell PD-1 expression (high vs low): Group A (CTC PD-L1+/CD8+ PD-1 high), Group B (CTC PD-L1+/CD8+ PD-1 low), Group C (CTC PD-L1−/CD8+ PD-1 high), and Group D (CTC PD-L1−/CD8+ PD-1 low). |
Inclusion criteria were: (1) histologically confirmed NSCLC with advanced disease (stage IIIB–IV); (2) treatment with anti–PD-1/PD-L1 agents as monotherapy or in combination regimens (any line of therapy); Stage IIIB patients were included only when treated with systemic anti–PD-1/PD-L1 therapy in an advanced/unresectable setting; adjuvant or neoadjuvant ICI settings were not included. (3) availability of baseline blood samples for CTC PD-L1 assessment and peripheral immune profiling; and (4) adequate clinical follow-up for response and survival assessment. Exclusion criteria included: (1) concurrent malignancies; (2) autoimmune diseases requiring systemic immunosuppressive therapy; (3) inadequate performance status or clinical condition precluding treatment and follow-up (eg., ECOG ≥3, severe comorbidities, or life expectancy <3 months); and (4) insufficient sample quality or technical failure precluding biomarker analyses. Detailed reasons for exclusion at each screening step are provided in Figure 1.
Patients were stratified into four groups based on baseline CTC PD-L1 status (positive vs negative) and circulating CD8+ T-cell PD-1 expression (high vs low).
Sample Collection and Biomarker Analysis
Blood Sample Collection
Prior to initiation of anti–PD-1/PD-L1 therapy, baseline peripheral blood samples were collected as part of routine clinical practice. For CTC analysis, blood was drawn into CellSave preservative tubes (Menarini Silicon Biosystems, Bologna, Italy) and processed within 72 hours according to the manufacturer’s instructions. For flow cytometry, blood was collected into EDTA-coated tubes and processed within 4 hours of collection for peripheral blood mononuclear cell (PBMC) isolation and immunophenotyping. All samples were labeled with unique study identifiers to ensure de-identification and patient confidentiality, and sample handling was performed by trained personnel following standardized operating procedures.
Circulating Tumor Cell (CTC) Detection and PD-L1 Expression
Peripheral blood samples for CTC analysis were collected at baseline (prior to initiation of anti–PD-1/PD-L1 therapy) in CellSave preservative tubes (Menarini Silicon Biosystems, Bologna, Italy) and processed within 72 hours according to the manufacturer’s instructions. CTCs were enriched and enumerated using the CellSearch system (Menarini Silicon Biosystems, Bologna, Italy).
Samples were processed using the CellSearch CTC Kit. Briefly, CTCs were captured with ferrofluid nanoparticles conjugated to anti-EpCAM antibodies. After enrichment, cells were fixed and stained with a panel of antibodies, including an anti-cytokeratin antibody (1:300 dilution, clones C11 and A53-B/A2, Cell Signaling Technology) for CK8/18/19, an anti–PD-L1 antibody (1:150 dilution, clone SP142, Roche Diagnostics, Basel, Switzerland), and an anti-CD45 antibody (1:500 dilution, clone 2B1 and PD7/26, DAKO). Nuclei were counterstained with DAPI (1 μg/mL) for 10 minutes.
CTCs were defined as nucleated cells (DAPI+) exhibiting epithelial marker positivity (EpCAM+ and/or CK+) and lacking leukocyte marker expression (CD45−). PD-L1 expression on CTCs was assessed based on membranous and/or cytoplasmic staining. A PD-L1–positive CTC was defined as a cell meeting the CTC criteria with any detectable PD-L1 staining. Patients were classified as CTC PD-L1–positive if at least one PD-L1–positive CTC was detected; otherwise, they were classified as CTC PD-L1–negative.
Fluorescence images were captured using a Zeiss Axio Imager Z2 fluorescence microscope (Zeiss, Oberkochen, Germany) equipped with filter sets for DAPI, FITC, PE, and APC. All images were reviewed independently by two trained observers who were blinded to clinical data and outcomes. Discrepancies were resolved by consensus.
CD8+ PD-1+T Cell Proportion
Peripheral blood for flow cytometry was collected in EDTA tubes at baseline (prior to initiation of anti–PD-1/PD-L1 therapy). Peripheral blood mononuclear cells (PBMCs) were isolated by density-gradient centrifugation using Ficoll-Paque Premium (Cytiva, USA), washed, and resuspended in staining buffer. Cells were stained with fluorochrome-conjugated antibodies against CD3 (Alexa Fluor® 700, clone UCHT1, Thermo Fisher Scientific), CD4 (BV510, clone L200, BD Biosciences), CD8 (FITC, clone SK1, BioLegend), and PD-1 (BV421, clone J105, Thermo Fisher Scientific). Isotype controls (and/or fluorescence minus one control, if applicable) were used to account for non-specific binding and to define the PD-1–positive gate.
Data acquisition was performed on a BD FACSCanto II flow cytometer, and at least 5×10⁴ CD8+ T cells were collected per sample. Analysis was conducted using FlowJo v10.8 (BD Biosciences). CD8+ T cells were identified as CD3+CD8+ events (with exclusion of debris and doublets), and PD-1 expression was quantified as the proportion of PD-1+ cells within the CD8+ T-cell gate. In the absence of an established clinical cutoff for peripheral CD8+ PD-1 expression, the cohort median value (35.6%) was used to dichotomize patients into PD-1high (≥35.6%) and PD-1low (<35.6%) groups for subsequent analyses.
Treatment and Response Assessment
Treatment Protocol
Patients received anti–PD-1 or anti–PD-L1 immune checkpoint inhibitors as monotherapy or in combination regimens in accordance with routine clinical practice and contemporaneous guideline-based management at our institution. Specific agents, dosing, and treatment schedules followed the approved prescribing information and were determined by the treating physicians based on histology, disease burden, prior treatments, and patient condition. Combination regimens typically included an immune checkpoint inhibitor with platinum-based chemotherapy (eg., carboplatin- or cisplatin-based doublets) and, when clinically indicated, anti-angiogenic therapy (eg., bevacizumab). Treatment was continued until radiographic disease progression, unacceptable toxicity, or patient withdrawal, at the discretion of the treating physician. To account for potential confounding by treatment strategy, treatment type (monotherapy vs combination therapy) was included as a covariate in multivariable analyses.
Response Assessment
Treatment response was evaluated using Response Evaluation Criteria in Solid Tumors (RECIST) version 1.1 criteria. Radiological assessments were performed at baseline and at regular intervals during treatment using contrast-enhanced computed tomography (CT) of the chest, abdomen, and pelvis. Complementary imaging studies, notably brain magnetic resonance imaging (MRI), were performed based on clinical judgment. Response was assessed based on RECIST v1.1 criteria. ORR was defined as CR + PR, and DCR as CR + PR + SD (≥12 weeks). Response assessments were conducted by institutional radiologists and reviewed by treating oncologists, with confirmation scans performed at subsequent visits for patients achieving CR or PR.
Progression-free survival (PFS), the primary endpoint, was defined as the time from the first administration of anti–PD-1/PD-L1 therapy to radiographic disease progression per RECIST v1.1 or death from any cause, whichever occurred first. Patients without an event were censored at the date of the last disease assessment. Overall survival (OS) was defined as the time from treatment initiation to death from any cause, with censoring at the last follow-up for survivors.
Follow-Up
From therapy initiation, patients were tracked until death, loss to follow-up, or the study cutoff date of December 31, 2023. Electronic medical records are the primary resource of treatment details, imaging results, and survival outcomes. Follow-up visits included routine clinical assessments, laboratory tests, and imaging as per institutional protocols. The median follow-up duration was approximately 18 months.
Statistical Analysis
Appropriate statistical tests were employed to compare baseline characteristics across the four dual-biomarker groups. Continuous variables were compared using the Kruskal–Wallis test, and categorical variables were compared using the chi-square test or Fisher’s exact test, as appropriate. The Kaplan–Meier method and Log rank test were used to analyze survival outcomes.
Progression-free survival (PFS), the primary endpoint, was defined as the time from the first administration of anti–PD-1/PD-L1 therapy to radiographic disease progression per RECIST v1.1 or death from any cause, whichever occurred first. Overall survival (OS) was defined as the time from treatment initiation to death from any cause. Time-to-event endpoints were censored at the date of the last disease assessment (for PFS) or the last follow-up (for OS) for patients without events. HRs with 95% CIs were estimated using Cox proportional hazards regression models, adjusted for baseline covariates including age, sex, smoking status, ECOG performance status, clinical stage, histological subtype, prior lines of therapy, treatment type, tissue PD-L1 expression, and metastasis sites. Secondary endpoints included OS and objective response rate (ORR).
ROC curve analysis was conducted to evaluate the discriminative performance of baseline biomarkers for objective response, with AUC values and 95% CIs reported. The optimal cutoff for the dual-biomarker model was determined using the Youden index. Sensitivity analyses were conducted to assess the robustness of the primary findings, including analyses after excluding patients with incomplete baseline assessment or early loss to follow-up. Multiple comparison adjustments using the Benjamini–Hochberg method were applied to secondary endpoints to control the false discovery rate at 5%. A two-sided p-value < 0.05 was regarded as statistically significant. Data visualizations were generated using R version 4.3.0.
Results
Patient Characteristics
Between January 2022 and December 2023, 280 patients with advanced non–small cell lung cancer (NSCLC) receiving anti–PD-1/PD-L1 therapy were screened. The screening process and reasons for exclusion are summarized in Figure 1. A total of 128 patients completed baseline dual-biomarker testing, and two patients were excluded prior to efficacy analysis due to early loss to follow-up or early death, resulting in a final efficacy cohort of 126 patients. At the data cutoff (December 31, 2023), the median follow-up was approximately 18 months. No patients were lost to follow-up in the final efficacy cohort, and no imputation was performed due to the limited missingness.
Patients were stratified into four dual-biomarker groups (Group A, n=31; Group B, n=26; Group C, n=35; and Group D, n=34). The median age was 65 years (IQR, 58–71), with 61.8% male and 38.2% female patients. Histological subtypes included 73.0% adenocarcinoma, 22.2% squamous cell carcinoma, and 4.8% other histologies. The majority of patients had stage IV disease (85.7%), and 64.3% were current or former smokers. ECOG performance status was 0–1 in 81.0% of patients. Treatment regimens comprised 57.1% PD-1 inhibitor monotherapy, 24.6% PD-L1 inhibitor monotherapy, and 18.3% combination therapy. Baseline characteristics were comparable across groups, including age, sex, smoking status, ECOG performance status, histology, clinical stage, driver mutations, treatment regimen, prior lines of therapy, tissue PD-L1 expression, and metastatic sites (all P>0.05), except for circulating CD8+ T-cell PD-1 expression, which differed by definition across groups (P<0.001) (Table 1). For brain and bone metastases, a small number of patients were recorded as “not assessed” (NA) due to the absence of definitive imaging documentation in the clinical records.
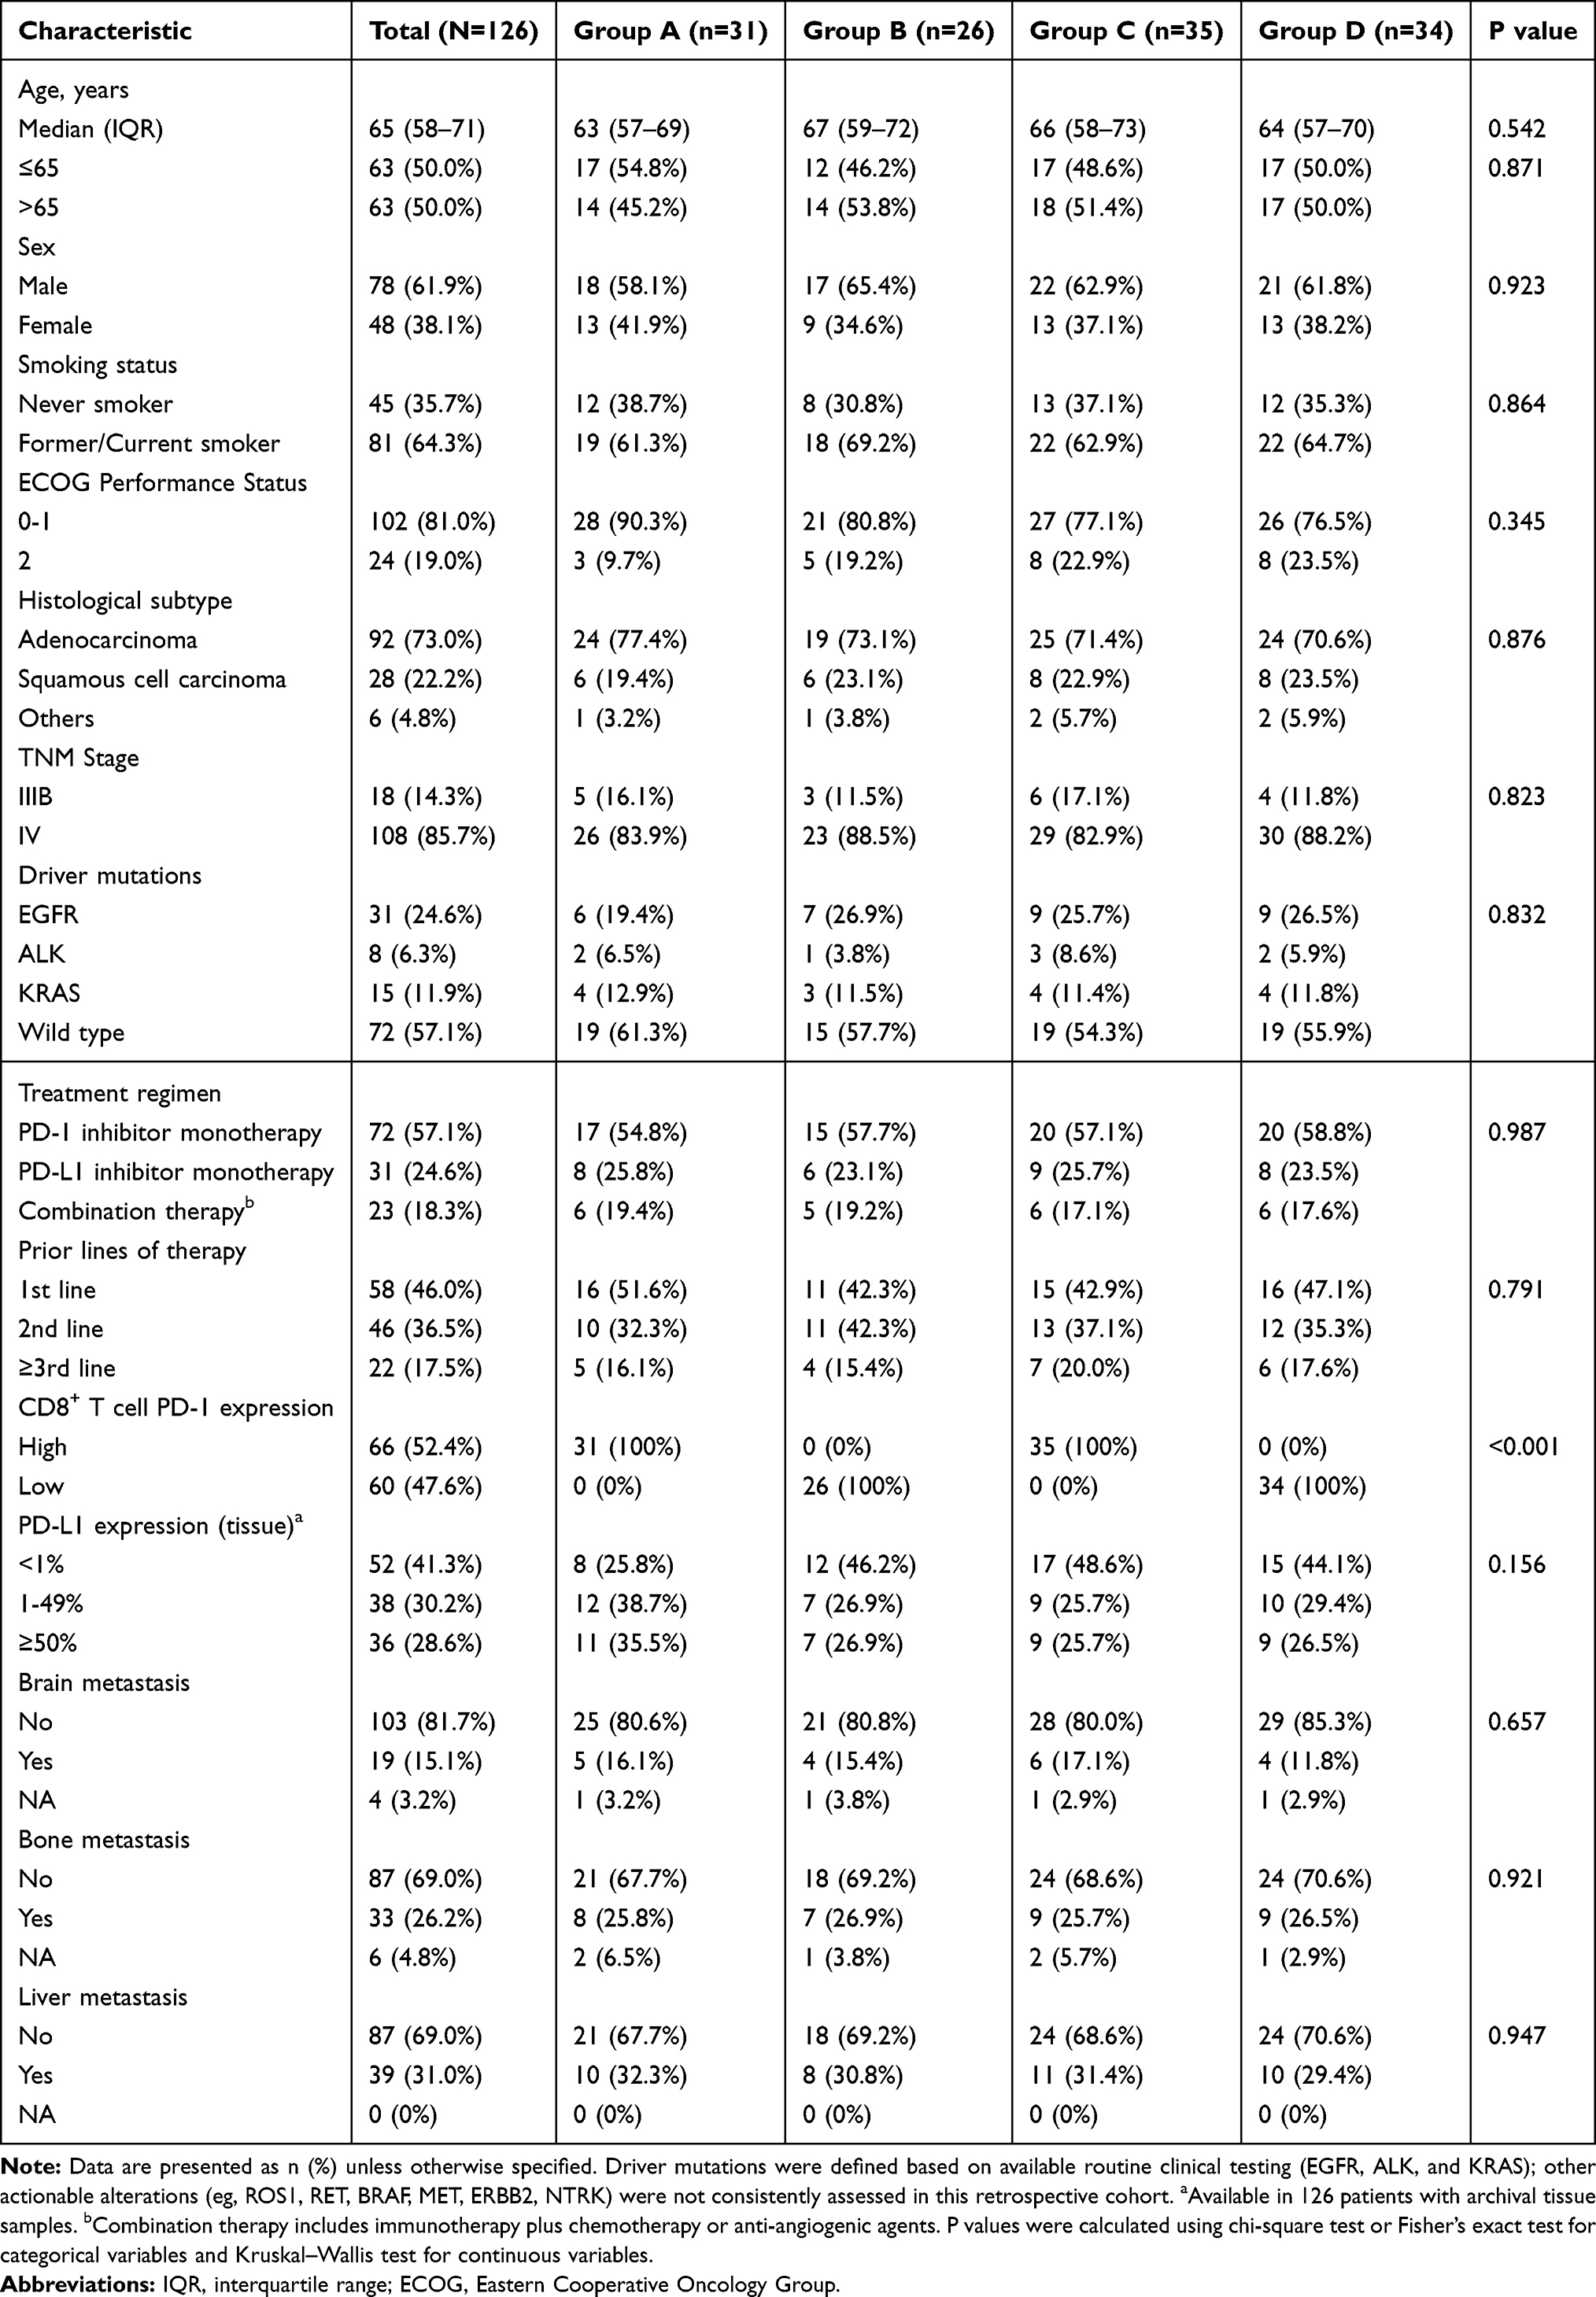 |
Table 1 Baseline Characteristics of Patients by Dual Biomarker Expression Groups |
CD8+ T Cell PD-1 Expression
Analysis of PD-1 expression on CD8+ T cells revealed distinct patterns across the study cohort (Figure 2). The gating strategy, which is illustrated in Figure 2A, defined CD8+ T cell populations using sequential flow cytometry markers, ensuring accurate identification of PD-1 expression. Figure 2B demonstrates the validity of our classification approach: the left panel shows representative flow cytometry plots from patients with low PD-1 expression (26.88%) and high PD-1 expression (52.13%), confirming the distinct expression patterns between groups; the right panel presents a boxplot comparing PD-1+CD8+ cell proportions between the high (≥35.6%) and low (<35.6%) expression groups, validating the robustness of our cutoff threshold. The overall distribution of baseline PD-1 expression in circulating CD8+ T cells is shown in Figure 2C as a histogram (with density overlay). A vertical dashed line indicates the cohort median value (35.6%), which was used as a data-driven cutoff to classify patients into PD-1high (≥35.6%) and PD-1low (<35.6%) groups in the absence of an established clinical threshold.
 |
Figure 2 CD8+ T Cell PD-1 Expression Analysis. (A) Flow cytometry gating strategy for identifying circulating CD3+CD8+ T cells and assessing PD-1 expression. (B) Representative dot plots from patients with low and high PD-1 expression on CD8+ T cells, with comparison of the proportion of PD-1+ cells within the CD8+ gate between PD-1high (≥35.6%) and PD-1low (<35.6%) groups (****, P<0.0001). (C) Distribution of baseline PD-1+CD8+ T-cell proportions in the entire cohort, shown as a histogram (with density overlay), with the cohort median (35.6%) indicated by a vertical dashed line. |
CTC PD-L1 Expression
Evaluation of PD-L1 expression on circulating tumor cells (CTCs) revealed significant variability among the 126 patients. The experimental process, depicted in Figure 3A, involved extracting blood samples from patients and using the CellSearch system to assess PD-L1 expression on CTCs. A stacked bar chart (Figure 3B) demonstrated that 45.2% of patients (n=57) were classified as CTC PD-L1 positive, while 54.8% (n=69) were negative, reflecting the overall distribution within the cohort. A heatmap (Figure 3C), organized by patient ID, illustrated PD-L1 expression patterns, with red indicating positive staining and blue representing negative staining, highlighting the heterogeneity across individuals. Additionally, a four-quadrant diagram (Figure 3D) categorized patients into four groups based on CTC PD-L1 and CD8+ PD-1+: Group A (CTC PD-L1⁺/CD8⁺ PD-1 high), Group B (CTC PD-L1⁺/CD8⁺ PD-1 low), Group C (CTC PD-L1−/CD8⁺ PD-1 high), and Group D (CTC PD-L1−/CD8⁺ PD-1 low).
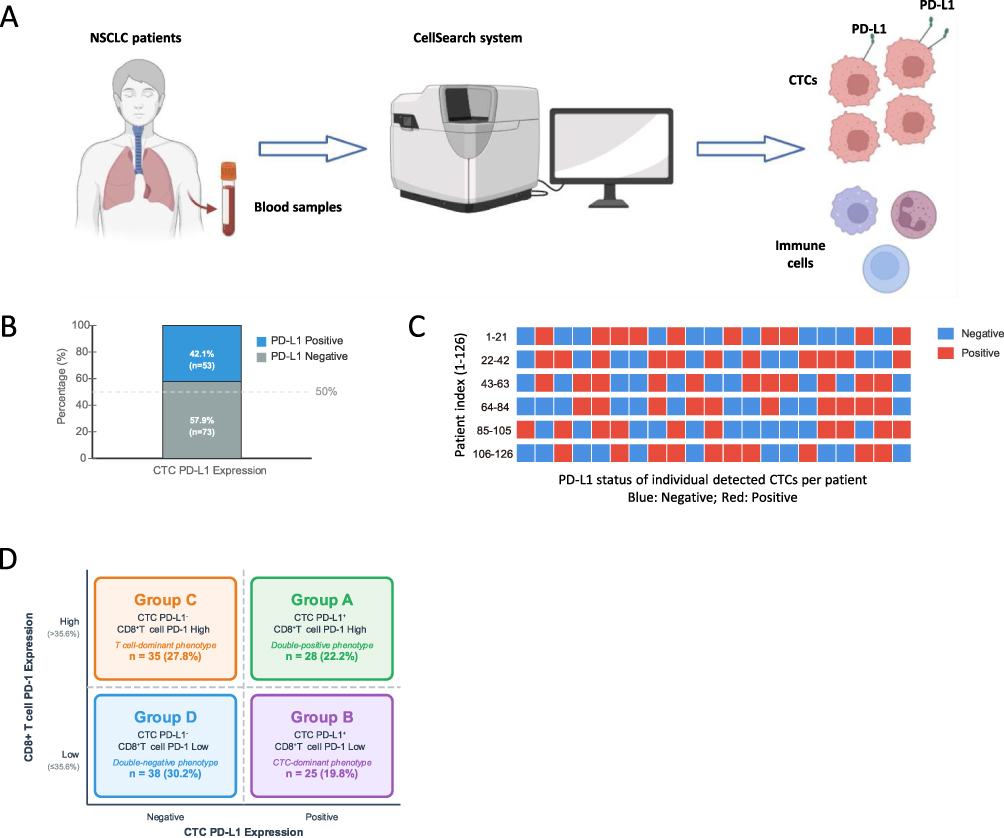 |
Figure 3 CTC PD-L1 Expression Analysis. (A) Experimental workflow for CTC detection and PD-L1 expression analysis using the CellSearch system, including blood sample processing and staining. (B) Stacked bar chart showing the distribution of CTC PD-L1 expression, with 45.2% (n=57) of the 126 patients classified as positive and 54.8% (n=69) as negative. (C) Heatmap of PD-L1 expression patterns across patients, with red indicating positive staining and blue indicating negative staining, organized by patient ID. (D) Four-quadrant diagram categorizing patients into Group A (CTC PD-L1⁺/CD8⁺ PD-1 high), Group B (CTC PD-L1⁺/CD8⁺ PD-1 low), Group C (CTC PD-L1−/CD8⁺ PD-1 high), and Group D (CTC PD-L1−/CD8⁺ PD-1 low) based on dual-biomarker stratification. |
Survival and Response Outcomes
Survival Results
Kaplan-Meier survival analysis revealed distinct survival patterns across the four dual-biomarker stratified groups (Table 2). For PFS, Group A (CTC PD-L1⁺/CD8⁺ PD-1 high) demonstrated the most favorable outcome with 14.2 months (95% CI: 10.8–17.6), followed by Group B 8.5 months (95% CI: 6.2–10.8), Group C 6.3 months (95% CI: 4.9–7.7), and Group D 4.8 months (95% CI: 3.5–6.1). Overall group differences were statistically significant (P<0.001) (Figure 4A).
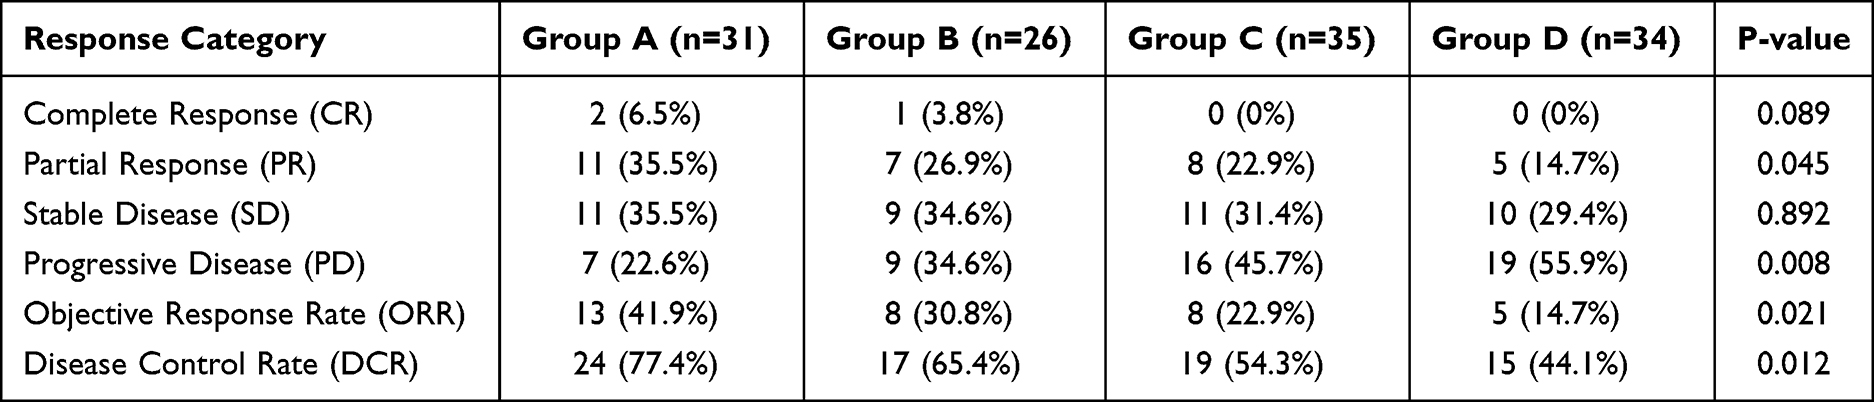 |
Table 2 Treatment Response Rates by Dual-Biomarker Groups |
 |
Figure 4 Survival and Response Outcomes. (A) Kaplan-Meier curves for progression-free survival (PFS) across the four groups, with median PFS of 14.2 months (95% CI: 10.8–17.6) for Group A, 8.5 months (95% CI: 6.2–10.8) for Group B, 6.3 months (95% CI: 4.9–7.7) for Group C, and 4.8 months (95% CI: 3.5–6.1) for Group D (Log rank test, P<0.001). (B) Kaplan-Meier curves for overall survival (OS), with median OS of 20.3 months (95% CI: 16.4–24.2) for Group A, 15.6 months (95% CI: 12.1–19.1) for Group B, 12.4 months (95% CI: 9.8–15.0) for Group C, and 10.2 months (95% CI: 7.9–12.5) for Group D (Log rank test, P<0.001), including 12-month OS rates (78.4%, 61.5%, 48.6%, and 38.2%, respectively). (C) Bar chart of objective response rates (ORR) and disease control rates (DCR) across groups, with ORR of 41.9% (13/31) for Group A, 30.8% (8/26) for Group B, 22.9% (8/35) for Group C, and 14.7% (5/34) for Group D (Chi-square test for trend, P=0.021), and DCR of 77.4%, 65.4%, 54.3%, and 44.1%, respectively (P=0.012). |
Overall survival (OS) analysis showed a similar hierarchical pattern, with Group A achieving the longest median OS of 20.3 months (95% CI: 16.4–24.2), compared to 15.6 months (95% CI: 12.1–19.1) in Group B, 12.4 months (95% CI: 9.8–15.0) in Group C, and 10.2 months (95% CI: 7.9–12.5) in Group D (P<0.001) (Figure 4B). The 12-month OS rates were 78.4% for Group A, 61.5% for Group B, 48.6% for Group C, and 38.2% for Group D, further highlighting the prognostic value of dual biomarker stratification (Figure 4B).
Response Outcomes
Response evaluation according to RECIST v1.1 criteria revealed significant differences across the dual biomarker groups (Table 2 and Figure 4C). The objective response rate (ORR) was highest in Group A at 41.9% (13/31), followed by Group B at 30.8% (8/26), Group C at 22.9% (8/35), and Group D at 14.7% (5/34), showing a statistically significant trend (Chi-square test for trend, P=0.021). Complete responses were observed in 6.5% (2/31) of Group A patients and 3.8% (1/26) of Group B patients, with no complete responses documented in Groups C or D (P = 0.089). Disease control rate (DCR) demonstrated a similar pattern, with Group A achieving 77.4% (24/31), followed by Group B at 65.4% (17/26), Group C at 54.3% (19/35), and Group D at 44.1% (15/34) (P = 0.012). Progressive disease was most frequent in Group D (55.9%, 19/34) and least common in Group A (22.6%, 7/31) (P = 0.008). These response patterns, as summarized in Table 2, demonstrated a clear hierarchy favoring patients with CTC PD-L1 positive expression, particularly when combined with high CD8⁺ T cell PD-1 levels.
Univariate and Multivariate Analysis of Prognostic Factors
Univariate Analysis
Univariate Cox regression results indicated that the dual-biomarker status was the primary significant predictor of PFS. Group A demonstrated significantly superior PFS compared to other groups, with median PFS of 14.2 months versus 8.5, 6.3, and 4.8 months for Groups B, C, and D respectively (P<0.001). Other demographic characteristics including gender, ECOG performance status, age, smoking status, and histology showed no statistical significance in predicting PFS outcomes.
The dual-biomarker stratification remained the most critical factor for OS. Group A patients achieved the longest median OS of 20.3 months, significantly outperforming Group B (15.6 months), Group C (12.4 months), and Group D (10.2 months) (P<0.001). In multivariate analysis, dual-biomarker status emerged as an independent prognostic factor associated with PFS and OS (P=0.002).
Multivariate Analysis
Multivariable Cox proportional hazards regression was employed to determine independent prognostic factors for both PFS and OS, with adjustment for all clinically relevant clinical characteristics. The dual-biomarker status retained its significance as the most powerful predictor of clinical outcomes.
For PFS, Group A maintained significantly superior outcomes compared to other groups after adjustment for confounding variables, with hazard ratios of 0.48 (95% CI: 0.32–0.72, P<0.001) versus Group B, 0.35 (95% CI: 0.23–0.54, p<0.001) versus Group C, and 0.28 (95% CI: 0.18–0.43, P<0.05) versus Group D. Additionally, ECOG performance status emerged as an independent predictor (HR=1.65, 95% CI: 1.12–2.43, P=0.011), while age, gender, histology, and smoking status remained non-significant (Table 3).
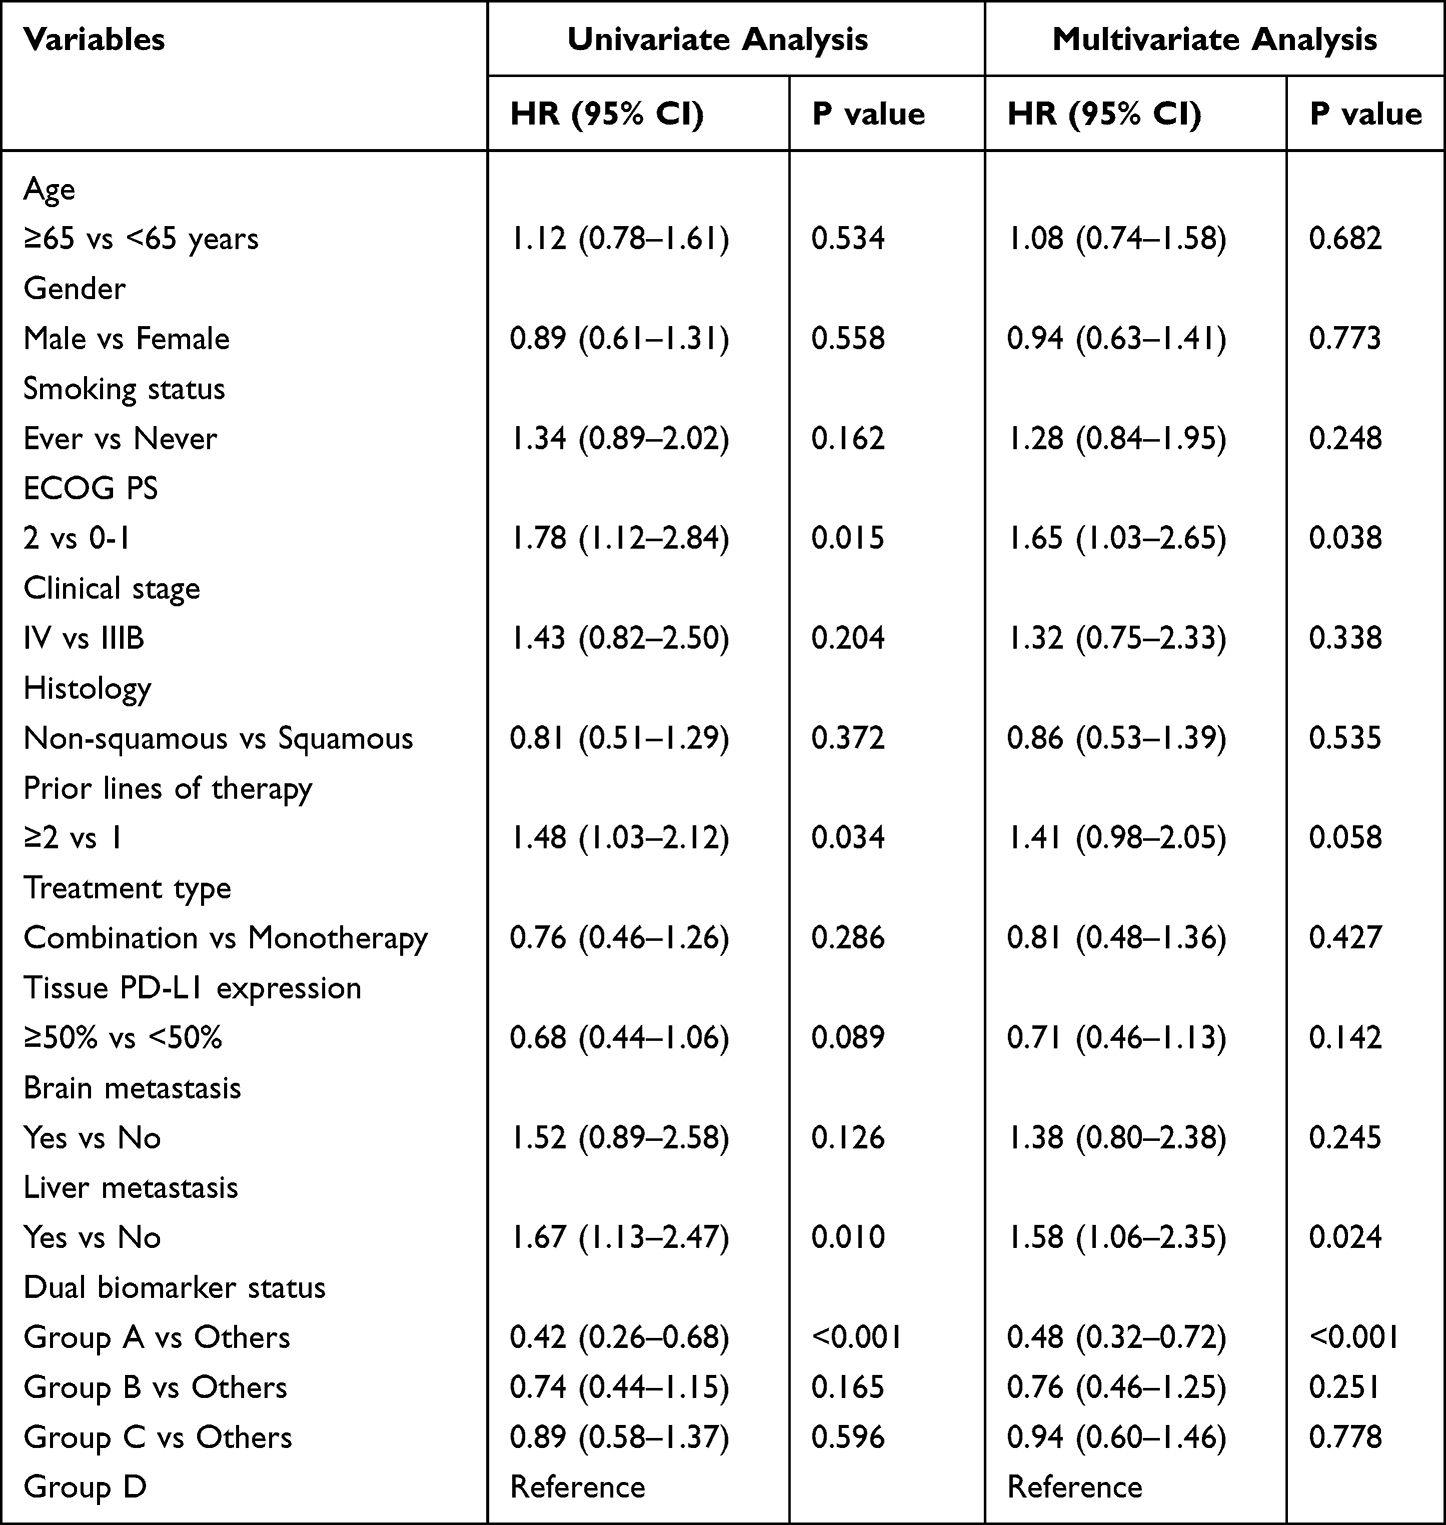 |
Table 3 Univariate and Multivariate Cox Regression Analysis for Progression-Free Survival |
For OS analysis, the dual-biomarker stratification demonstrated an even stronger independent prognostic value. Group A showed hazard ratios of 0.53 (95% CI: 0.35–0.80, P=0.002) versus Group B, 0.41 (95% CI: 0.27–0.62, P<0.001) versus Group C, and 0.33 (95% CI: 0.21–0.51, p<0.001) versus Group D. Tumor histology did not reach significance in univariate analysis (HR=0.85, 95% CI: 0.53–1.36, P=0.495) and was not included in the multivariate model due to the P<0.20 threshold. Other baseline characteristics including age, gender, smoking status, and baseline metastatic burden did not reach statistical significance in the multivariate model (Table 4).
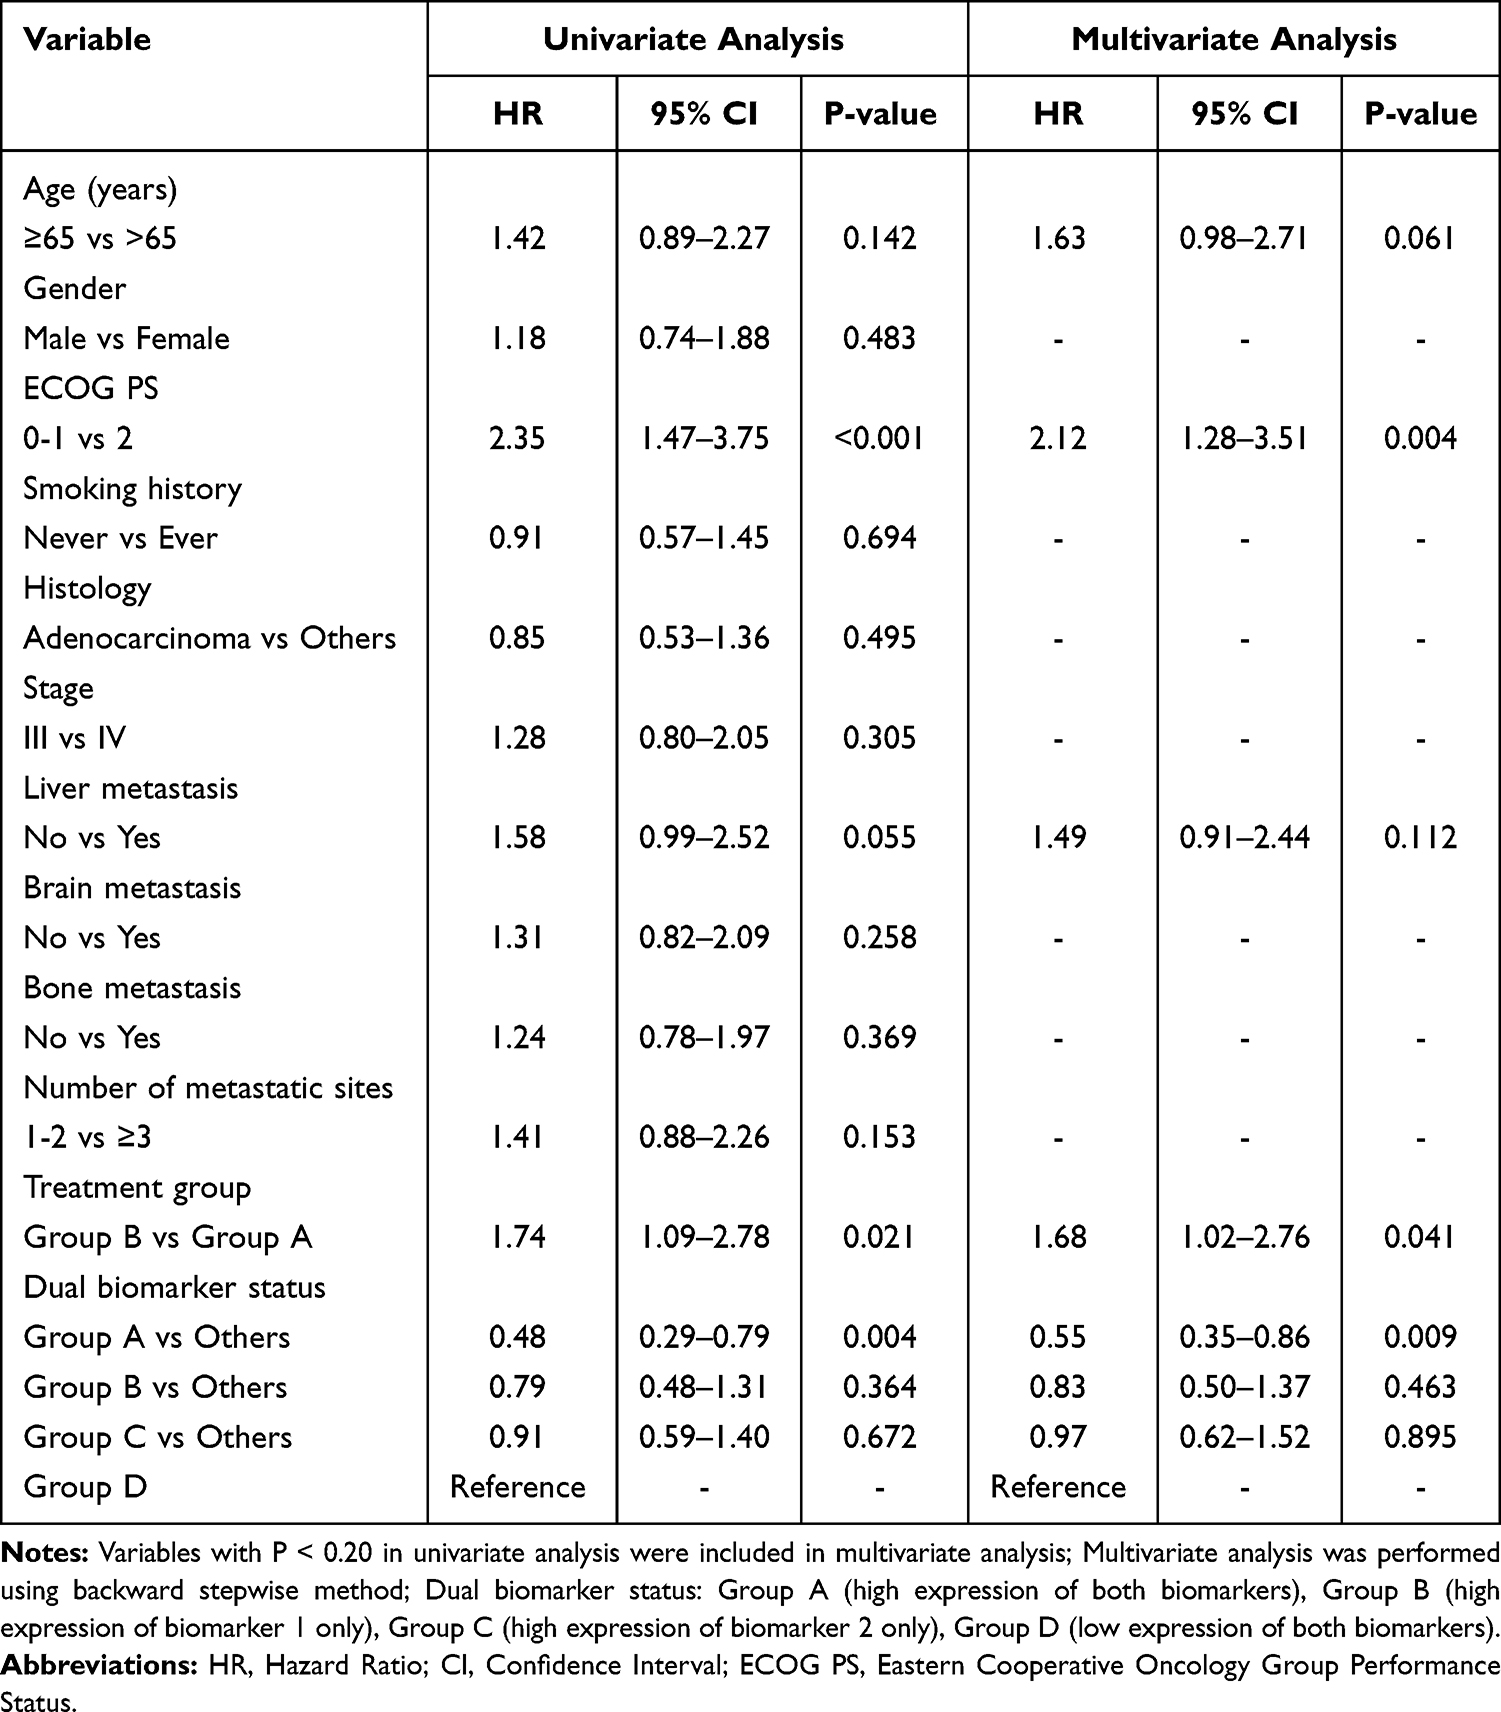 |
Table 4 Cox Regression Analysis for Overall Survival |
Discriminative Performance of Dual-Biomarker Model
The ability of baseline biomarkers to discriminate responders from non-responders was evaluated using receiver operating characteristic (ROC) analysis (exploratory). Responders were defined as patients achieving CR/PR, and non-responders as those with SD/PD according to RECIST v1.1. The ROC curve (Figure 5A) showed an AUC of 0.75 for the dual-biomarker model, which was higher than that of CTC PD-L1 alone (AUC = 0.62) and CD8+ T-cell PD-1 alone (AUC = 0.58) (P = 0.002). Using the Youden index to identify the optimal cutoff, the model yielded a sensitivity of 72% and a specificity of 68% (Figure 5B). The score distribution differed between responders and non-responders (Figure 5C; P < 0.001). These findings suggest that the dual-biomarker approach may improve outcome discrimination; however, given the retrospective design, these analyses should be interpreted as exploratory and do not establish definitive clinical predictive utility.
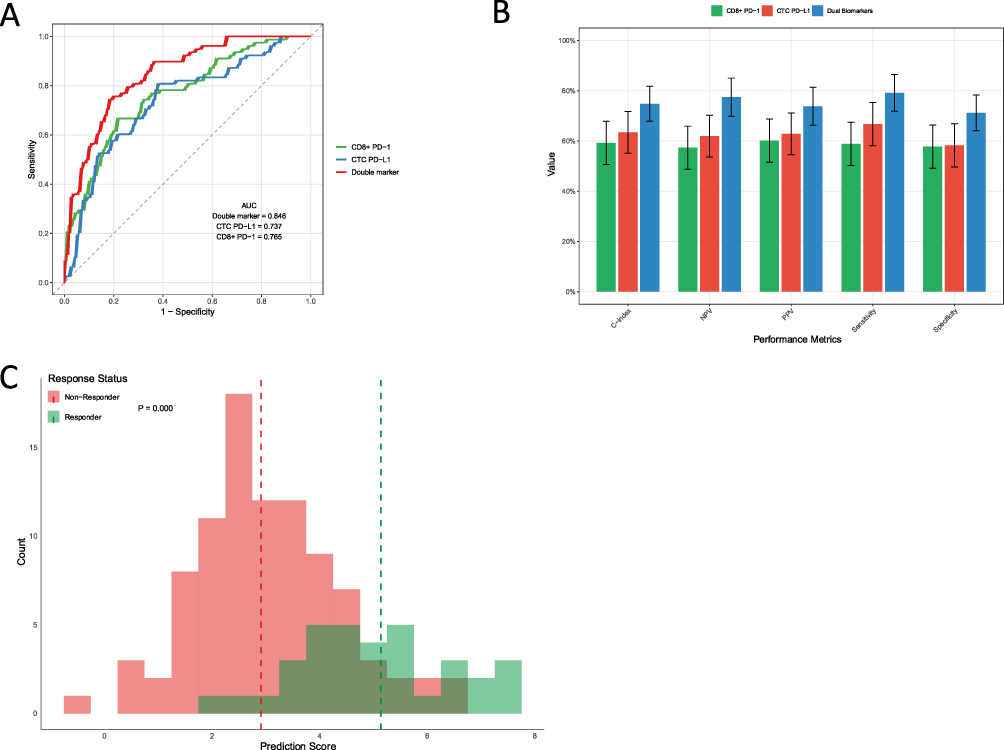 |
Figure 5 Discriminative Performance of the Dual-Biomarker Model (Exploratory). (A) Receiver operating characteristic (ROC) curves comparing the ability of the dual-biomarker model (AUC = 0.75) to discriminate responders from non-responders with CTC PD-L1 alone (AUC = 0.62) and CD8+ T-cell PD-1 alone (AUC = 0.58) (P = 0.002). (B) Performance metrics at the optimal cutoff (Youden index), showing a sensitivity of 72% and a specificity of 68%. (C) Distribution of model scores in responders versus non-responders (Mann–Whitney U-test, P < 0.001), illustrating the model’s discriminative capacity in this retrospective cohort. |
Discussion
The present study evaluates a dual liquid-biopsy approach integrating circulating tumor cell (CTC) PD-L1 status and peripheral blood CD8+ T-cell PD-1 expression and demonstrates an association with clinical outcomes in advanced NSCLC treated with anti–PD-1/PD-L1 therapy. Our key finding demonstrates that patients with both CTC PD-L1 positivity and high CD8+ PD-1+ proportion (Group A) achieved significantly superior clinical outcomes compared to other biomarker combinations, with this dual-biomarker stratification serving as an independent predictor of survival outcomes.
The dual-biomarker model demonstrated superior predictive performance (AUC 0.75) compared to either biomarker alone, remaining independently prognostic after adjusting for clinical confounders. This enhanced accuracy suggests the combination of peripheral blood CD8+ PD-1+ expression and CTC PD-L1 captures different aspects of the tumor-immune interaction that are relevant to checkpoint inhibitor efficacy.
While tissue-based PD-L1 expression remains a cornerstone biomarker for immune checkpoint inhibitor (ICI) therapy, its clinical utility is limited by modest predictive accuracy, with literatures reporting AUC values of 0.60–0.70 across cancers.15,17 Spatial and temporal heterogeneity in PD-L1 expressions within the tumor microenvironment undermines the reliability of single-site biopsies in capturing overall tumor biology.18 Additionally, the invasive nature of tissue sampling restricts real-time monitoring and serial assessments during treatment, limiting its adaptability to dynamic tumor-immune interactions.
Emerging evidence suggests that CTC-based PD-L1 assessment may circumvent some of these limitations. Recent studies in NSCLC have reported CTC PD-L1 positivity rates ranging from 35–60%,11 with some demonstrating correlation with treatment response.19 However, single CTC PD-L1 assessment has shown inconsistent prognostic value, with AUC values typically ranging from 0.58–0.65,20,21 highlighting the need for complementary biomarkers to enhance predictive accuracy.
To further contextualize our findings, we compared the dual-biomarker model with other liquid biopsy approaches explored in NSCLC immunotherapy. Circulating tumor DNA (ctDNA)-based tumor mutation burden (TMB) has emerged as a promising biomarker, with studies reporting AUC values of 0.65–0.70 for predicting ICI response, comparable to tissue-based PD-L1 but inferior to our dual-biomarker model (AUC 0.75).22 Similarly, exosomal PD-L1, another non-invasive marker, has shown predictive potential in NSCLC, with response rates correlating to exosomal PD-L1 levels in small cohorts.23 However, these single-biomarker approaches often fail to capture the complex tumor-immune interactions critical for ICI efficacy. Recent studies have explored multi-biomarker strategies, such as combining TMB with tissue PD-L1 or peripheral immune cell profiles, demonstrating improved predictive accuracy.24 Unlike these approaches, our dual-biomarker model integrates tumor-derived and immune-derived markers, offering a comprehensive assessment of both tumor antigen presentation and systemic immune priming. This integrative strategy aligns with emerging evidence that multi-dimensional biomarker panels outperform single markers in predicting immunotherapy outcomes.25
CD8+ T cells play pivotal role in mediating anti-tumor responses to immune checkpoint inhibitors.26–28 Within the tumor microenvironment, stem-like progenitor exhausted CD8+ T cells (PD-1+TCF-1+) represent the key cellular subset responsible for ICI efficacy, with higher frequencies of this population correlating with superior treatment outcomes.29,30 However, direct assessment of these intratumoral T cell subsets remains technically challenging and clinically impractical due to the invasive nature of tumor sampling and spatial heterogeneity.
Importantly, successful ICI therapy has been associated with dynamic changes in peripheral CD8+ T cell populations, including increased PD-1 expression on circulating CD8+ T cells.31 This peripheral expansion of CD8+ PD-1+ T cells likely reflects systemic mobilization and immune activation of tumor-reactive T cell clones from lymphoid organs into circulation. Unlike the exhausted PD-1high CD8+ T cells predominantly found within tumors, PD-1+ CD8+ T cells in peripheral circulation and lymphoid tissues largely retain stem-like or naïve characteristics and proliferative potential.32,33 While PD-1 overexpression can indeed mark T cell exhaustion, single-marker assessment of PD-1 alone is insufficient to accurately define T cell functional status.34 This biological rationale supports the evaluation of peripheral CD8+ PD-1 expression as a surrogate marker for systemic immune priming in NSCLC patients receiving ICIs.
Our finding that high CD8+ PD-1 expression (≥35.6%) combined with CTC PD-L1 positivity yielded the most favorable outcomes (median PFS 14.2 months, OS 20.3 months) suggests that this population represents patients with both tumor antigen presentation capability and systemically primed immune responses capable of effective checkpoint blockade reversal. The use of median PD-1 expression level as a cutoff threshold is supported by previous studies that have employed similar approaches for immune marker stratification.16 This methodology is particularly relevant when establishing biomarker thresholds in the absence of standardized clinical cutoffs, as it provides a data-driven approach that can be validated across different patient populations.
Although this study presents encouraging results, certain limitations should be recognized. As a single-center retrospective analysis with a cohort of 126 patients, our results may not fully represent the broader NSCLC population, potentially limiting their generalizability due to possible selection biases inherent in single-institution studies. Although a small proportion of patients had stage IIIB disease, clinical stage (IIIB vs IV) was accounted for in multivariable analyses; nevertheless, heterogeneity in disease stage and treatment context remains a limitation, and validation in a stage IV-only cohort is warranted. The use of the median PD-1 expression level (35.6%) as a cutoff, while supported by prior studies, is cohort-specific and may vary across different populations or assay platforms, necessitating validation in larger, multicenter cohorts to establish standardized thresholds. Additionally, the retrospective design introduces potential biases related to variations in sample quality, treatment regimens, or incomplete clinical data. The reliance on the CellSearch system for CTC detection, although highly specific, may miss CTC subpopulations with low EpCAM expression, potentially underestimating PD-L1 positivity rates. Furthermore, PD-1 expressions in CD8+ T cells may be influenced by systemic factors, such as infections or prior therapies, which were not fully accounted for in this study. In addition, our immune profiling focused on circulating CD8+ T cells; broader phenotyping of other subsets (eg., total CD3+PD-1+ or CD4+PD-1+ cells) was not prespecified and was not consistently available in this retrospective cohort and should be evaluated in future prospective studies. The aforementioned limitations highlight the necessity for cautious interpretation of our findings and underscore the urgency of further validation.
To address the limitations of this study, future research should focus on validating the dual-biomarker model in larger, multicenter, prospective cohorts to confirm its predictive performance and establish standardized cutoffs for CD8+ T cell PD-1 expression. Dynamic monitoring of CTC PD-L1 and CD8+ T cell PD-1 levels during ICI therapy could provide insights into temporal changes in tumor-immune interactions, potentially informing adaptive treatment strategies. Additionally, integrating this dual-biomarker approach with other liquid biopsy markers, such as tumor mutation burden (TMB) or circulating inflammatory cytokines, may further enhance predictive accuracy and enable the development of comprehensive multi-biomarker panels. Advances in CTC detection technologies, such as next-generation platforms capable of capturing EpCAM-low CTCs, could improve the sensitivity and specificity of our approach. Standardizing flow cytometry protocols across institutions will also be critical to ensure reproducibility and facilitate clinical translation.
The dual-biomarker platform holds significant promise for clinical application by identifying NSCLC patients most likely to benefit from immune checkpoint inhibitors, particularly those in Group A with CTC PD-L1 positivity and high CD8+ T cell PD-1 expression. This non-invasive approach facilitates serial monitoring of tumor-immune dynamics, overcoming the limitations of invasive tissue-based PD-L1 testing and enabling real-time treatment optimization. By guiding patient stratification, this model could inform clinical decisions, such as prioritizing ICIs for patients with favorable biomarker profiles or selecting combination therapies for others. However, clinical implementation requires addressing practical challenges, including assay standardization, cost-effectiveness, and the accessibility of CTC detection and flow cytometry in routine practice. With further refinement, this platform could serve as a cornerstone for personalized immunotherapy strategies in advanced NSCLC.
In conclusion, baseline CTC PD-L1 status combined with peripheral blood CD8+ T-cell PD-1 expression was associated with immunotherapy outcomes in this retrospective advanced NSCLC cohort and may support prognostic stratification; prospective validation is warranted. By outperforming single-biomarker approaches, this model addresses critical limitations of current predictive strategies and offers a practical, non-invasive tool for patient stratification. These findings provide the groundwork for future validation studies and the development of standardized biomarkers, ultimately advancing the goal of personalized immunotherapy for NSCLC patients.
Funding
2023 Changzhou Science and Technology Support Plan (Social Development) Project “Construction of Multi-technology Integration Standardized Precision Diagnosis and Treatment Platform for Lung Cancer” (No.: CE20235057).
Disclosure
The author report no conflicts of interest in this work.
References
1. Siegel RL, Giaquinto AN, Jemal A. Cancer statistics, 2024. CA Cancer J Clin. 2024;74(1):12–16. doi:10.3322/caac.21820
2. Chen P, Liu Y, Wen Y, Zhou C. Non-small cell lung cancer in China. Cancer Commun. 2022;42(10):937–970.
3. Cheng W, Kang K, Zhao A, Wu Y. Dual blockade immunotherapy targeting PD-1/PD-L1 and CTLA-4 in lung cancer. J Hematol Oncol. 2024;17(1):54. doi:10.1186/s13045-024-01581-2
4. de Langen AJ, Johnson ML, Mazieres J, et al. Sotorasib versus docetaxel for previously treated non-small-cell lung cancer with KRASG12C mutation: a randomised, open-label, Phase 3 trial. Lancet. 2023;401(10378):733–746. doi:10.1016/S0140-6736(23)00221-0
5. Teixidó C, Vilariño N, Reyes R, Reguart N. PD-L1 expression testing in non-small cell lung cancer. Ther Adv Med Oncol. 2018;10:1758835918763493. doi:10.1177/1758835918763493
6. Mao S, Zhou F, Liu Y, et al. ICI plus chemotherapy prolonged survival over ICI alone in patients with previously treated advanced NSCLC. Cancer Immunol Immunother. 2022;71(1):219–228. doi:10.1007/s00262-021-02974-9
7. Guibert N, Delaunay M, Lusque A, et al. PD-L1 expression in circulating tumor cells of advanced non-small cell lung cancer patients treated with nivolumab. Lung Cancer. 2018;120:108–112. doi:10.1016/j.lungcan.2018.04.001
8. Kennedy LC, Lu J, Kuehn S, et al. Liquid biopsy assessment of circulating tumor cell PD-L1 and IRF-1 expression in patients with advanced solid tumors receiving immune checkpoint inhibitor. Target Oncol. 2022;17(3):329–341. doi:10.1007/s11523-022-00891-0
9. Kloten V, Lampignano R, Krahn T, Schlange T. Circulating tumor Cell PD-L1 expression as biomarker for therapeutic efficacy of immune checkpoint inhibition in NSCLC. Cells. 2019;8(8):809. doi:10.3390/cells8080809
10. Yue C, Jiang Y, Li P, et al. Dynamic change of PD-L1 expression on circulating tumor cells in advanced solid tumor patients undergoing PD-1 blockade therapy. OncoImmunology. 2018;7(7):e1438111. doi:10.1080/2162402X.2018.1438111
11. Zhou Q, Liu X, Li J, et al. Circulating tumor cells PD-L1 expression detection and correlation of therapeutic efficacy of immune checkpoint inhibition in advanced non-small-cell lung cancer. Thoracic Cancer. 2023;14(5):470–478. doi:10.1111/1759-7714.14767
12. Zhou W, Kawashima S, Ishino T, et al. Stem-like progenitor and terminally differentiated TFH-like CD4+ T cell exhaustion in the tumor microenvironment. Cell Reports. 2024;43(2):113797. doi:10.1016/j.celrep.2024.113797
13. Verma V, Shrimali RK, Ahmad S, et al. PD-1 blockade in subprimed CD8 cells induces dysfunctional PD-1+CD38hi cells and anti-PD-1 resistance. Nat Immunol. 2019;20(9):1231–1243. doi:10.1038/s41590-019-0441-y
14. Fumet JD, Richard C, Ledys F, et al. Prognostic and predictive role of CD8 and PD-L1 determination in lung tumor tissue of patients under anti-PD-1 therapy. Br J Cancer. 2018;119(8):950–960. doi:10.1038/s41416-018-0220-9
15. Lu S, Stein JE, Rimm DL, et al. Comparison of biomarker modalities for predicting response to PD-1/PD-L1 checkpoint blockade: a systematic review and meta-analysis. JAMA Oncology. 2019;5(8):1195–1204. doi:10.1001/jamaoncol.2019.1549
16. Kamphorst AO, Pillai RN, Yang S, et al. Proliferation of PD-1+ CD8 T cells in peripheral blood after PD-1–targeted therapy in lung cancer patients. Proceedings of the National Academy of Sciences. 2017;114(19):4993–4998. doi:10.1073/pnas.1705327114
17. Tian P, He B, Mu W, et al. Assessing PD-L1 expression in non-small cell lung cancer and predicting responses to immune checkpoint inhibitors using deep learning on computed tomography images. Theranostics. 2021;11(5):2098–2107. doi:10.7150/thno.48027
18. Mariam A, Kamath S, Schveder K, McLeod HL, Rotroff DM. Biomarkers for response to Anti-PD-1/Anti-PD-L1 immune checkpoint inhibitors: a large meta-analysis. Oncology. 2023;37(5):210–219. [Oncology (Williston Park)]. doi:10.46883/2023.25920995
19. Dall’Olio FG, Gelsomino F, Conci N, et al. PD-L1 expression in circulating tumor cells as a promising prognostic biomarker in advanced non–small-cell lung cancer treated with immune checkpoint inhibitors. Clinical Lung Cancer. 2021;22(5):423–431. doi:10.1016/j.cllc.2021.03.005
20. Jiang J, Mo W, Lian X, Cao D, Cheng H, Wang H. Detection of PD‑L1 expression and epithelial‑mesenchymal transition of circulating tumor cells in non‑small cell lung cancer. Exp Ther Med. 2024;28(1):294. doi:10.3892/etm.2024.12583
21. Magri V, De Renzi G, Marino L, et al. Circulating cancer-associated macrophage-like cells as a blood-based biomarker of response to immune checkpoint inhibitors. Int J Mol Sci. 2024;25(7):3752. doi:10.3390/ijms25073752
22. Chae YK, Davis AA, Agte S, et al. Clinical implications of circulating tumor DNA tumor mutational burden (ctDNA TMB) in non-small cell lung cancer. Oncologist. 2019;24(6):820–828. doi:10.1634/theoncologist.2018-0433
23. Kim DH, Kim H, Choi YJ, et al. Exosomal PD-L1 promotes tumor growth through immune escape in non-small cell lung cancer. Exp Mol Med. 2019;51(8):1–13.
24. Dong A, Zhao Y, Li Z, Hu H. PD-L1 versus tumor mutation burden: which is the better immunotherapy biomarker in advanced non-small cell lung cancer? J Gene Med. 2021;23(2):e3294. doi:10.1002/jgm.3294
25. Duchemann B, Remon J, Naigeon M, et al. Current and future biomarkers for outcomes with immunotherapy in non-small cell lung cancer. Transl Lung Cancer Res. 2021;10(6):2937–2954. doi:10.21037/tlcr-20-839
26. Li J, Wu C, Hu H, et al. Remodeling of the immune and stromal cell compartment by PD-1 blockade in mismatch repair-deficient colorectal cancer. Cancer Cell. 2023;41(6):1152–1169.e7. doi:10.1016/j.ccell.2023.04.011
27. Sasson SC, Slevin SM, Cheung VTF, et al. Interferon-gamma-producing CD8+ tissue resident memory T cells are a targetable hallmark of immune checkpoint inhibitor-colitis. Gastroenterology. 2021;161(4):1229–1244.e9. doi:10.1053/j.gastro.2021.06.025
28. Hsu CL, Ou DL, Bai LY, et al. Exploring markers of exhausted CD8 T cells to predict response to immune checkpoint inhibitor therapy for hepatocellular carcinoma. Liver Cancer. 2021;10(4):346–359. doi:10.1159/000515305
29. Minnie SA, Waltner OG, Ensbey KS, et al. Depletion of exhausted alloreactive T cells enables targeting of stem-like memory T cells to generate tumor-specific immunity. Sci Immunol. 2022;7(76):eabo3420. doi:10.1126/sciimmunol.abo3420
30. Viramontes KM, Neubert EN, DeRogatis JM, Tinoco R. PD-1 immune checkpoint blockade and PSGL-1 inhibition synergize to reinvigorate exhausted T cells. Front Immunol. 2022;13:869768. doi:10.3389/fimmu.2022.869768
31. Zhu H, Galdos FX, Lee D, et al. Identification of pathogenic immune cell subsets associated with checkpoint inhibitor-induced myocarditis. Circulation. 2022;146(4):316–335. doi:10.1161/CIRCULATIONAHA.121.056730
32. Connolly KA, Kuchroo M, Venkat A, et al. A reservoir of stem-like CD8+ T cells in the tumor-draining lymph node preserves the ongoing anti-tumor immune response. Sci Immunol. 2021;6(64):eabg7836. doi:10.1126/sciimmunol.abg7836
33. Kennedy BC, Dean I, Withers DR. Migration of stem-like CD8 T cells between tissue microenvironments underpins successful anti-tumour immune responses. Discov Immunol. 2023;2(1):kyad004. doi:10.1093/discim/kyad004
34. Kurachi M. CD8+ T cell exhaustion. Semin Immunopathol. 2019;41(3):327–337. doi:10.1007/s00281-019-00744-5
 © 2026 The Author(s). This work is published and licensed by Dove Medical Press Limited. The
full terms of this license are available at https://www.dovepress.com/terms
and incorporate the Creative Commons Attribution
- Non Commercial (unported, 4.0) License.
By accessing the work you hereby accept the Terms. Non-commercial uses of the work are permitted
without any further permission from Dove Medical Press Limited, provided the work is properly
attributed. For permission for commercial use of this work, please see paragraphs 4.2 and 5 of our Terms.
© 2026 The Author(s). This work is published and licensed by Dove Medical Press Limited. The
full terms of this license are available at https://www.dovepress.com/terms
and incorporate the Creative Commons Attribution
- Non Commercial (unported, 4.0) License.
By accessing the work you hereby accept the Terms. Non-commercial uses of the work are permitted
without any further permission from Dove Medical Press Limited, provided the work is properly
attributed. For permission for commercial use of this work, please see paragraphs 4.2 and 5 of our Terms.