Back to Journals » OncoTargets and Therapy » Volume 12
Circulating serum exosomal aHIF is a novel prognostic predictor for epithelial ovarian cancer
Authors Tang X, Liu S ![]() , Liu Y, Lin X, Zheng T, Liu X, Qiu J, Hua K
, Liu Y, Lin X, Zheng T, Liu X, Qiu J, Hua K ![]()
Received 23 June 2019
Accepted for publication 3 September 2019
Published 19 September 2019 Volume 2019:12 Pages 7699—7711
DOI https://doi.org/10.2147/OTT.S220533
Checked for plagiarism Yes
Review by Single anonymous peer review
Peer reviewer comments 2
Editor who approved publication: Dr Sanjeev K. Srivastava
Xiaoyan Tang,1–3,* Songping Liu,4,* Yinglei Liu,5,* Xiaojing Lin,1–3 Tingting Zheng,1–3 Xin Liu,1–3 Junjun Qiu,1–3 Keqin Hua1–3
1Department of Gynecology, Obstetrics and Gynecology Hospital, Fudan University, Shanghai 200011, People’s Republic of China; 2Department of Obstetrics and Gynecology of Shanghai Medical College, Fudan University, Shanghai 200032, People’s Republic of China; 3Shanghai Key Laboratory of Female Reproductive Endocrine-Related Diseases, Obstetrics and Gynecology Hospital, Fudan University, Shanghai 200011, People’s Republic of China; 4Department of Obstetrics and Gynecology, Zhenjiang Maternal and Child Health Hospital, Zhenjiang, Jiangsu 212001, People’s Republic of China; 5Department of Obstetrics and Gynecology, Nantong First People’s Hospital, Nantong, Jiangsu 226001, People’s Republic of China
*These authors contributed equally to this work
Correspondence: Junjun Qiu; Keqin Hua
Department of Gynecology, Obstetrics and Gynecology Hospital of Fudan University, 419 Fangxie Road, Shanghai 200011, People’s Republic of China
Tel +86 216 345 5050 ext 8261
Fax +86 216 345 5090
Email [email protected]; [email protected]
Purpose: Exosomes are key mediators of cellular communication by transporting molecules, including long noncoding RNAs (lncRNAs), and have been regarded as promising non-invasive biomarkers. This study aimed to evaluate the expression pattern and clinical significance of serum exosomal lncRNA antisense hypoxia inducible factor (aHIF) in epithelial ovarian cancer (EOC).
Patients and methods: Sixty-two EOC patients in Obstetrics and Gynecology Hospital of Fudan University were enrolled. The expression levels of aHIF in tissues and serum exosomes were examined by RT-qPCR. The origin of serum exosomal aHIF was explored in vitro and in vivo. Univariate and multivariate Cox regression analyses were used to evaluate the prognostic factors of EOC. A prognostic predictive nomogram was formulated in R software.
Results: We isolated exosomes, identified exosomal aHIF in the serum of EOC patients. The expression of serum exosomal aHIF was higher in EOC patients and was correlated with the aHIF level in EOC tissues. In vitro and in vivo, the results indicated that serum exosomal aHIF was derived from tumor cells. Kaplan-Meier survival analysis demonstrated that EOC patients with higher serum exosomal aHIF expression had poorer overall survival. Cox multivariate regression model revealed that FIGO stage, residual tumor size, and serum exosomal aHIF level were independent prognostic factors of EOC. Based on the prognostic value of serum exosomal aHIF, we established a nomogram model that showed a good predictive ability for EOC patients.
Conclusion: Serum exosomal aHIF is overexpressed in EOC and can serve as a noninvasive predictive biomarker for unfavorable prognosis.
Keywords: epithelial ovarian cancer; EOC, exosome, antisense hypoxia inducible factor, aHIF, nomogram, biomarker
Corrigendum for this paper has been published
Introduction
Ovarian cancer is the most deadly gynecological malignancies and the fifth leading cause of cancer-related mortality in women.1 It is estimated that there will be 22,240 new cases of ovarian cancer and 14,070 ovarian cancer-related deaths in the United States in 2018.2 Epithelial ovarian cancer (EOC) accounts for 80–90% of ovarian cancer cases.3 Despite recent improvements in cancer treatments, the survival rate of EOC patients remains poor. Therefore, it is urgent to identify more reliable prognostic biomarkers for effectively evaluating the outcomes and improving the therapeutic strategy. Although several prognostic biomarkers have been exploited for EOC, reliable prognostic factors are still relatively scanty. Previously, many studies focused on the oncological characteristics of the tumor itself (such as tumor histology and gene mutations), but an increasing number of studies have begun to investigate the tumor microenvironment.4–6
Recently, emerging evidence has demonstrated that exosomes play important roles in the tumor microenvironment. Exosomes are small (30–150 nm), membranous vesicles that can be released by nearly all types of cells including different cancers.7 Exosomes are key mediators of intercellular communication by transmitting biomolecules such as proteins, lipids, microRNAs and lncRNAs.8 The cargoes of exosomes released by different cells vary and often reflect the source and pathophysiological state of the donor cells to some extent. In addition, exosomes can be detected in multiple body fluids such as blood, urine and milk9,10 with a high degree of stability, which means they can be stored for years in a variety of refrigerated and thawed conditions.11 Hence, exosomes and their specific biomolecules may be stable noninvasive biomarkers in the screening, diagnosis and prognostic prediction of cancers.12–14 An increasing number of studies have suggested that circulating exosomes may represent valuable tumor markers, and exosomes have been included in the novel concept of a “liquid biopsy”.10,15 The potential for exosomes to detect cancer, assess the effectiveness of therapy and predict prognosis has been exploited in gastrointestinal stromal tumors, pancreatic cancer, melanoma and colorectal cancer.10 Despite these findings, research on biomarkers based on exosomes in EOC is lacking.
As one of the molecules carried in exosomes, long noncoding RNAs (lncRNAs) are defined as transcripts with a minimum length of 200 nucleotides and limited protein-coding potential.16 In the past several years, numerous studies have proven that lncRNAs play significant roles in tumor progression.17,18 Some exosomal lncRNAs have been shown to be correlated with the clinicopathological characteristics of cancer and may serve as novel biomarkers.19,20 Antisense hypoxia inducible factor (aHIF), also known as HIF1A-AS2, has been found to be widely expressed in many human tissues and to be overexpressed in various tumors.21,22 Furthermore, the overexpression of aHIF is associated with poor prognosis in gastric cancer,23 breast cancer24 and paraganglioma.25 In our previous study, we found that aHIF was upregulated in EOC tissue and overexpression of aHIF can inhibit apoptosis and enhance proliferation.26 However, whether aHIF can be found in circulating exosomes in EOC patients and the relationship between serum exosomal aHIF and EOC have not been previously elucidated.
In this study, we assessed the expression pattern of serum exosomal aHIF in EOC patients and explored the origin of serum exosomal aHIF for the first time. We also investigated the correlation between the expression level of serum exosomal aHIF and clinicopathological characteristics and evaluated the prognostic value of serum exosomal aHIF in EOC patients. Based on the prognostic value of serum exosomal aHIF, we established a predictive model for EOC prognosis. We finally analyzed the feasibility of using serum exosomal aHIF as a novel noninvasive biomarker for EOC.
Materials and methods
Patients
Written consent was obtained from each participant and the study protocol was approved by the Medical Ethics Committee of the Obstetrics and Gynecology Hospital of Fudan University. EOC patients who were admitted to the Obstetrics and Gynecology Hospital of Fudan University from January 2012 to December 2014 and who met the following criteria were included: 1) patients who underwent standard surgeries and postoperative chemotherapy if needed according to the National Comprehensive Cancer Network (NCCN) guideline for ovarian cancer,27 and the diagnosis of EOC was confirmed by their pathological results; 2) patients did not receive preoperative radiotherapy, chemotherapy or hormonal therapy; 3) patients did not have borderline ovarian tumors or other different malignancies; 4) patients had intact medical records, including age, FIGO stage, histological type, histological grade, residual tumor size and so on. EOC patients with incomplete medical records or withdrew their consent were excluded.
The study was divided into a discovery phase and a validation phase. In the discovery phase, we collected fresh tissue samples that had been surgically resected and their matched serum samples from EOC patients. Samples of normal ovarian epithelial tissues were obtained from participants diagnosed with uterine fibroids during the same period and who underwent a hysterectomy and oophorectomy and did not have a history of ovarian cysts or ovarian pathology.
In the validation phase, serum samples were collected from a cohort of EOC patients (including the EOC patients from the discovery phase). Healthy, age-matched women who received routine physical examinations in the same hospital were enrolled to establish a control group. They had no personal history of cancer or other serious illnesses.
Blood samples were collected by antecubital vein puncture from all EOC patients before their surgeries. The samples were processed within 1 h after collection via centrifugation at 3000 g at 4 °C to separate the serum from the peripheral blood cells. The cell-free serum samples were stored at −80 °C until exosome isolation.
Cell lines and culture
Five human EOC cell lines (SKOV3, SKOV3.ip, HO8910, HO8910.PM, and ES2) and the nontumorous human ovarian surface epithelial cell (HOSEPIC) line were purchased from the Type Culture Collection of the Chinese Academy of Sciences (Shanghai, China). All cell lines were cultured in RPMI1640 medium (Gibco, USA) containing 100 IU/mL penicillin (Invitrogen, USA), 100 mg/mL streptomycin (Invitrogen, USA) and 10% fetal bovine serum (FBS, Gibco, USA) at 37 °C, in humid air containing 5% CO2. When the cells reached 80% confluence, the medium was replaced with 10 mL of FBS-free RPMI1640 medium to rule out the effect of FBS on the exosomes. The supernatant was collected after 24 hrs of culture and stored at −80 °C until exosome isolation.
Exosome isolation
Exosomes were isolated and purified from the cell supernatants by using the total exosome isolation reagent (from cell culture media) kit (#44578259, Thermo Fisher Scientific, USA) according to the manufacturer’s protocol. To isolate exosomes from the human serum samples, an ExoQuick Exosome Precipitation Solution kit (EXOQ5A-1, System Biosciences, USA) was used. Exosome pellets were resuspended in phosphate-buffered saline (PBS) and stored at −80 °C until further use.
Transmission electron microscopy (TEM)
The exosome suspension was added to an equal volume of 4% paraformaldehyde, spotted on a Formvar/carbon film-coated transmission electron microscope grid and then fixed with 1% glutaraldehyde. The grid was washed with PBS, contrasted with 1% uranyl acetate, embedded in epoxy resin, polymerized and subsequently examined under TEM (Hitachi, Ltd., Tokyo, Japan).
Nanoparticle tracking analysis (NTA)
The size distribution of the isolated exosomes was analyzed with the Nanosight NS300 system with NTA (Malvern Instruments, UK). Samples were diluted in PBS until individual nanoparticles could be tracked and measured at the standard conditions recommended by the manufacturer’s instructions. Each sample analysis was conducted for 60 seconds and repeated three times.
Western blot
Total exosomal protein was prepared with RIPA buffer (Sigma-Aldrich, USA), and the protein concentration was measured by the bicinchoninic acid assay (BCA, Thermo Scientific, USA) method. Approximately 20 µg of protein from each sample was separated by sodium dodecyl sulfate-polyacrylamide gel electrophoresis (SDS-PAGE), transferred to a PVDF membrane (BioRad, USA), and blotted with the following antibodies: anti-CD63 (1:2500, ab134045, Abcam, UK), anti-TSG101 (1:200, ab125011, Abcam), anti-Hsp70 (1:100, ab79852, Abcam) and anti-Hsp90 (1:200, ab13495, Abcam). The membranes were incubated with the primary antibodies at 4 °C overnight. After the membrane was washed three times in TBST (0.1% Tween-20), it was incubated with an HRP-conjugated secondary anti-rabbit antibody (1:1000, ab6721, Abcam) for 1 h at 37 °C. The blots were then immersed in ECL solution and digitally imaged on the Tanon 5200 Imaging System (Tanon, China, Shanghai).
RNA extraction
Total RNA was extracted from tissues utilizing TRIzol reagent (Invitrogen, USA) following the manufacturer’s protocol. Exosomal RNA was extracted from the exosome pellets using the Exosome RNA Purification Column kit (System Biosciences, USA). Briefly, the exosome solution was mixed with 200 µL of 100% ethanol and sonicated for 10 seconds; the solution was then transferred to the spin column, which was placed in the matched collection tube. After centrifugation of the tubes at 13,000 rpm for 1 min, the flow-through was discarded and 400 uL of wash buffer was added to the column to wash off any nonspecifically ound material. After another two cycles of centrifugation, flow-through removal and washes, the total exosomal RNA was recovered by adding 30 µL of elution buffer directly to the membrane in the spin column and centrifuging at 2000 rpm for 2 mins, followed by 13,000 rpm for 1 min. The quality and quantity of the recovered RNA was evaluated using a NanoDrop spectrophotometer (Thermo Fisher Scientific, USA).
Quantitative real-time PCR (qRT-PCR)
Reverse transcription was conducted using the PrimeScript RT reagent kit (TaKaRa, Japan). Then, to evaluate the expression of aHIF, qRT-PCR was performed using SYBR Premix Ex Taq (TaKaRa, Japan) and the ABI PRISM 7900 Sequence Detector System (Applied Biosystems, CA, USA); GAPDH was used as an internal control. All primers were purchased from Sangon Biotech (Shanghai, China) and the sequences were as follows: aHIF: forward: 5ʹ-CTACCACGTACTGCTGGCAA-3ʹ, reverse: 5ʹ-CATCATGATCATAGGCAGTTG-3ʹ; GAPDH: forward: 5ʹ-TGACTTCAACAGCGACACCCA-3ʹ, reverse: 5ʹ-CACCCTGTTGCTGTAGCCAAA-3ʹ. The reaction mixtures contained 2 µL of complementary DNA, 10 µL of SYBR Premix Ex Taq, 0.8 µL of gene-specific primers, 0.4 µL of ROX reference dye II, and 6 µL of nuclease-free water for a total reaction volume of 20 µL. All experiments were performed in triplicates for each sample with the following conditions: 94 °C for 30 s, 40 amplification cycles of 95 °C for 5 s, and 60 °C for 34 s. Melting curve analyses were performed to confirm the specificity of the PCR products. The expression of aHIF was normalized (ΔCt) to the recommended housekeeping gene GAPDH, where ΔCt = Ct aHIF − Ct GAPDH. The relative expression of aHIF was calculated as 2−ΔCt.
Transfection
After SKOV3 cells were plated in 6-well plates (1×10⁵ cells/well) and incubated overnight, 1 mL of complete medium containing 20 μL of the luciferase reporter lentiviral system (Genechem, Shanghai, China) and 10 μg/mL polybrene-ENi.S (Genechem, Shanghai, China) was added; the cells were incubated for 12 h at 37 °C. The medium was removed and replaced with fresh complete medium; the cells incubated another 48 h. The transduced cells and the luciferase substrate were added together in a microplate, and the luciferase activity was examined with a luciferase assay (Caliper Life Sciences, USA) to confirm that SKOV3-luc cells were successfully established.
EOC xenograft model
Twenty 4-week-old female Balb/c nude mice were purchased from the Department of Laboratory Animal Science of Fudan University (license# SYXK 2014-0029, Shanghai, China) and divided into an experimental group (n=12) and a control group (n=8). The mice in the experimental group were intraperitoneally injected with 2×10⁷ cells in 200 µL, while mice in the control group received intraperitoneal injections of an equivalent volume of PBS. Tumor growth was monitored weekly with a bioluminescence imaging system until 4 weeks after tumor cell implantation. The mice were then anesthetized by intraperitoneal injection of 1.5% pentobarbital sodium (100 uL/15g, Sigma, USA), followed by intraperitoneal injection with D-luciferin (10 µL/g, 15mg/mL, Sigma, USA). After administration of D-luciferin, bioluminescence imaging was directly performed with a luminescence imaging system for living animals (Caliper Life Sciences, USA). Regions of interest (ROI) were placed over the entire tumor and quantified as the luminescence flux in photons/s by the luminescence imaging system. Blood was collected from the mice in procoagulant tubes by retro-orbital collection at week 1, 2, 3, and 4 (n=3, respectively). Then, the mice were euthanized, and further detection of serum exosomal aHIF was conducted. All animal studies were approved by the Institutional Animal Care and Use Committee of Fudan University.
Statistical analysis
All statistical analyses were conducted using SPSS 20.0 for Windows (SPSS, Chicago, IL). GraphPad Prism 6.0 (GraphPad Software Inc, CA) was used for plotting graphs. The comparison of aHIF expression in EOC tissues and serum exosomes between the two groups was performed by Student’s t-test. The correlations between aHIF expression in EOC tissues and serum exosomes, serum exosomal aHIF and the flux photons from the tumors were analyzed by Spearman’s correlation coefficient. Associations between serum exosomal aHIF levels and clinicopathological variables were analyzed by the Chi square test or Fisher’s exact probability test. Overall survival (OS) was defined as the time interval from the date of surgery to the date of death or final contact. The survival analysis was performed using the Kaplan-Meier method and further compared with the log-rank test. Univariate and multivariate Cox proportional hazards regression analyses were carried out to estimate the impact of clinicopathological factors and the levels of serum exosomal aHIF on OS. A nomogram was formulated based on the results of multivariate Cox analysis in R version 3.4.3 (https://www.r-project.org/). The predictive efficiency of the nomogram was assessed by the concordance index (c-index). Generally, the larger the c-index is, the more accurate the prognostic prediction.28 Calibration curves of the nomogram for 1- and 3-year OS were derived by comparing the predicted survival probability with the observed survival rate. P<0.05 was considered statistically significant. All the related computerized programs used in R to create the nomogram are listed in the supplementary materials.
Results
Exosomes were detected in the serum of EOC patients
The vesicles isolated from the serum were examined through TEM, NTA and Western blot (Figure 1). The vesicles were round in shape with diameters ranging from 30 nm to 100 nm. NTA was used to measure the size distribution of the exosomes, and the average size was 100 nm. Finally, Western blot was performed to detect the protein markers on the vesicles. CD63, TSG101, Hsp70 and Hsp90, which are known typical surface markers on exosomes,29 were present on the isolated vesicles. This evidence suggested that the vesicles we isolated from the serum were exosomes and were consistent with the morphology, size and markers reported previously.30
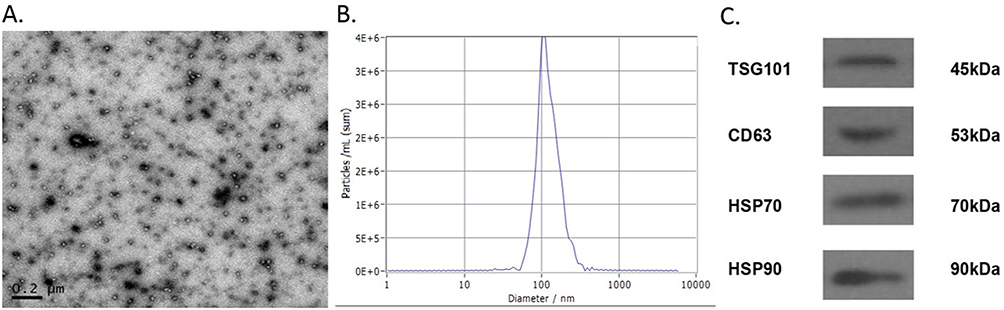 |
Figure 1 Characterization of exosomes derived from serum. TEM showed exosomes derived from serum had round-shaped morphology ranged from 30 nm to 100 nm (A, scale bar =200 nm). Size distribution of exosomes through NTA revealed that average size of exosomes was 100 nm (B). Western blotting for CD63, TSG101, Hsp-70, Hsp-90 as exosomal markers (C). Abbreviations: TEM, transmission electron microscopy; NTA, nanoparticle tracking analysis. |
LncRNA aHIF was upregulated in the serum exosomes of EOC patients in the discovery phase
In the discovery phase, we measured the expression of aHIF in the serum exosomes and paired tissues of 20 EOC patients and 10 controls. The results showed that the relative expression levels of aHIF in both the EOC tissues and the serum exosomes were significantly higher in EOC patients than in the controls (Figure 2A and 2B). Next, we analyzed the correlation of aHIF expression level in EOC tissues and that in serum exosomes. As shown in Figure 2C, a moderately significant correlation was found between the aHIF level in EOC tissues and the level in matched serum exosomes (r=0.6922, P<0.01).
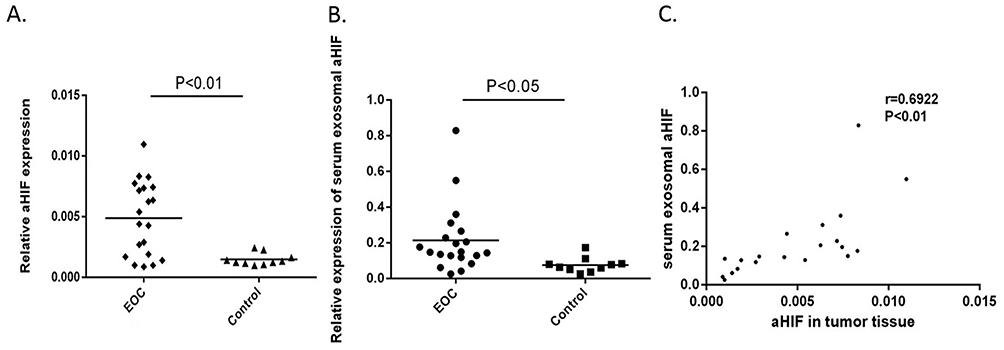 |
Figure 2 Quantitative analyses of exosomal aHIF in discovery phase. Relative expression levels of aHIF in EOC tissues (n=20) and controls (n=10) (A). Relative expression levels of serum exosomal aHIF in EOC patients (n=20) and controls (n=10) (B). Spearman’s correlation analysis between expression levels of exosomal aHIF in tumor tissues and paired serum samples of EOC (C). |
Exosomal aHIF can be released into circulation by tumor cells
Based on the above results, we hypothesized that serum exosomal aHIF is primarily released from tumor cells. To test this hypothesis, we measured the expression of exosomal aHIF in five EOC cell lines (SKOV3, SKOV3.ip, HO8910, HO8910.PM, and ES2) and the nontumorous HOSEPIC line. The results showed that exosomal aHIF was detected in the cell culture medium. Moreover, the levels of exosomal aHIF released from the five EOC cell lines were higher than those released from HOSEPIC cell line (Figure 3A). Next, we observed that the expression level of serum exosomal aHIF in EOC xenograft mice was significantly higher than that in the control group (Figure 3B). In addition, with the prolongation of tumor cell implantation, the expression level of serum exosomal aHIF accordingly elevated (Figure 3C), and the tumor volume was gradually increased (Figure 3D). We used a luminescence imaging system to quantitatively analyze the correlation between tumor size and the expression level of serum exosomal aHIF by calculating the photon flux from the tumor, which has been reported to be positively linearly correlated with tumor volume.31–33 As shown in Figure 3E, there was a strong positive correlation (r=0.8476, P<0.01) between the photon flux from the tumor and the expression level of serum exosomal aHIF, which demonstrated that the increase in serum exosomal aHIF was due to tumor growth. Therefore, serum exosomal aHIF originates from ovarian cancer cells and is released into circulation.
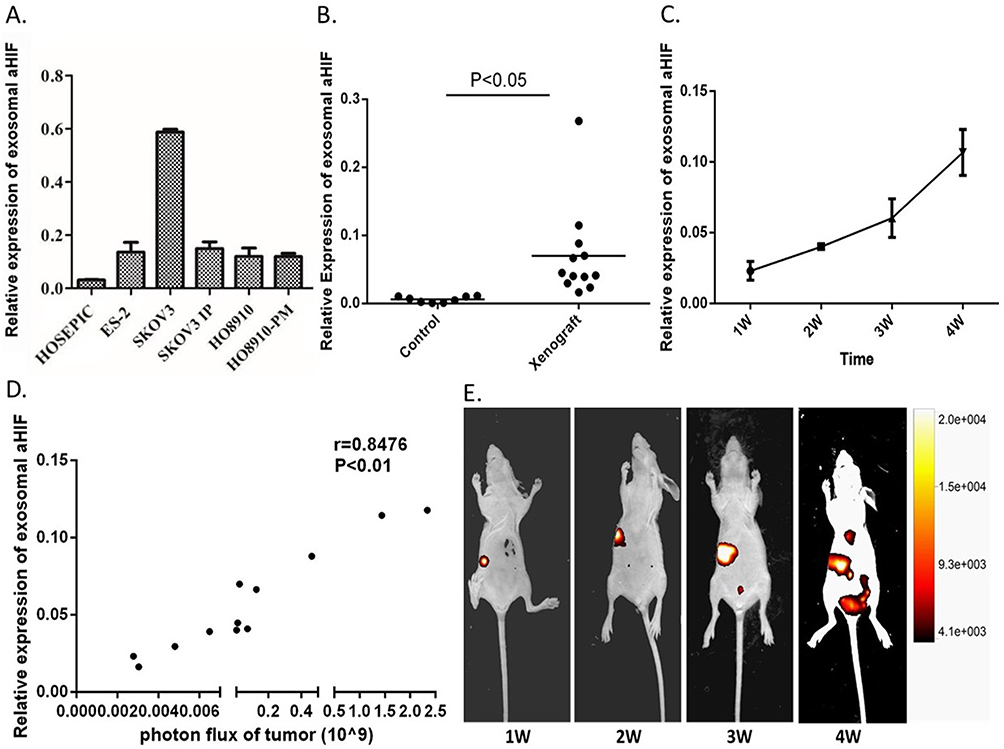 |
Figure 3 Exosomal aHIF is released from the tumor cells and can enter into serum. The relative expression levels of exosomal aHIF in five EOC cell lines and a normal ovarian epithelial cell HOSEPIC culture medium (A). The relative expression levels of serum exosomal aHIF in EOC xenograft mice and controls (B). The dynamic changes of the relative expression levels of serum exosomal aHIF in EOC xenograft mice (C). The growth of tumor metastases as monitored using bioluminescence imaging (D). Spearman’s correlation analysis between expression levels of exosomal aHIF and photon flux of tumor (E). |
Overexpression of serum exosomal aHIF in EOC patients was validated
Another 42 EOC patients in combination with 20 EOC patients in discovery phase were enrolled to form a larger cohort. The baseline characteristics of the EOC patients are shown in Table 1. The expression level of serum exosomal aHIF in EOC patients and 20 healthy women were analyzed. As shown in Figure 4A, the expression levels of serum exosomal aHIF of all 62 EOC patients were significantly higher when compared with those in healthy women (P<0.05).
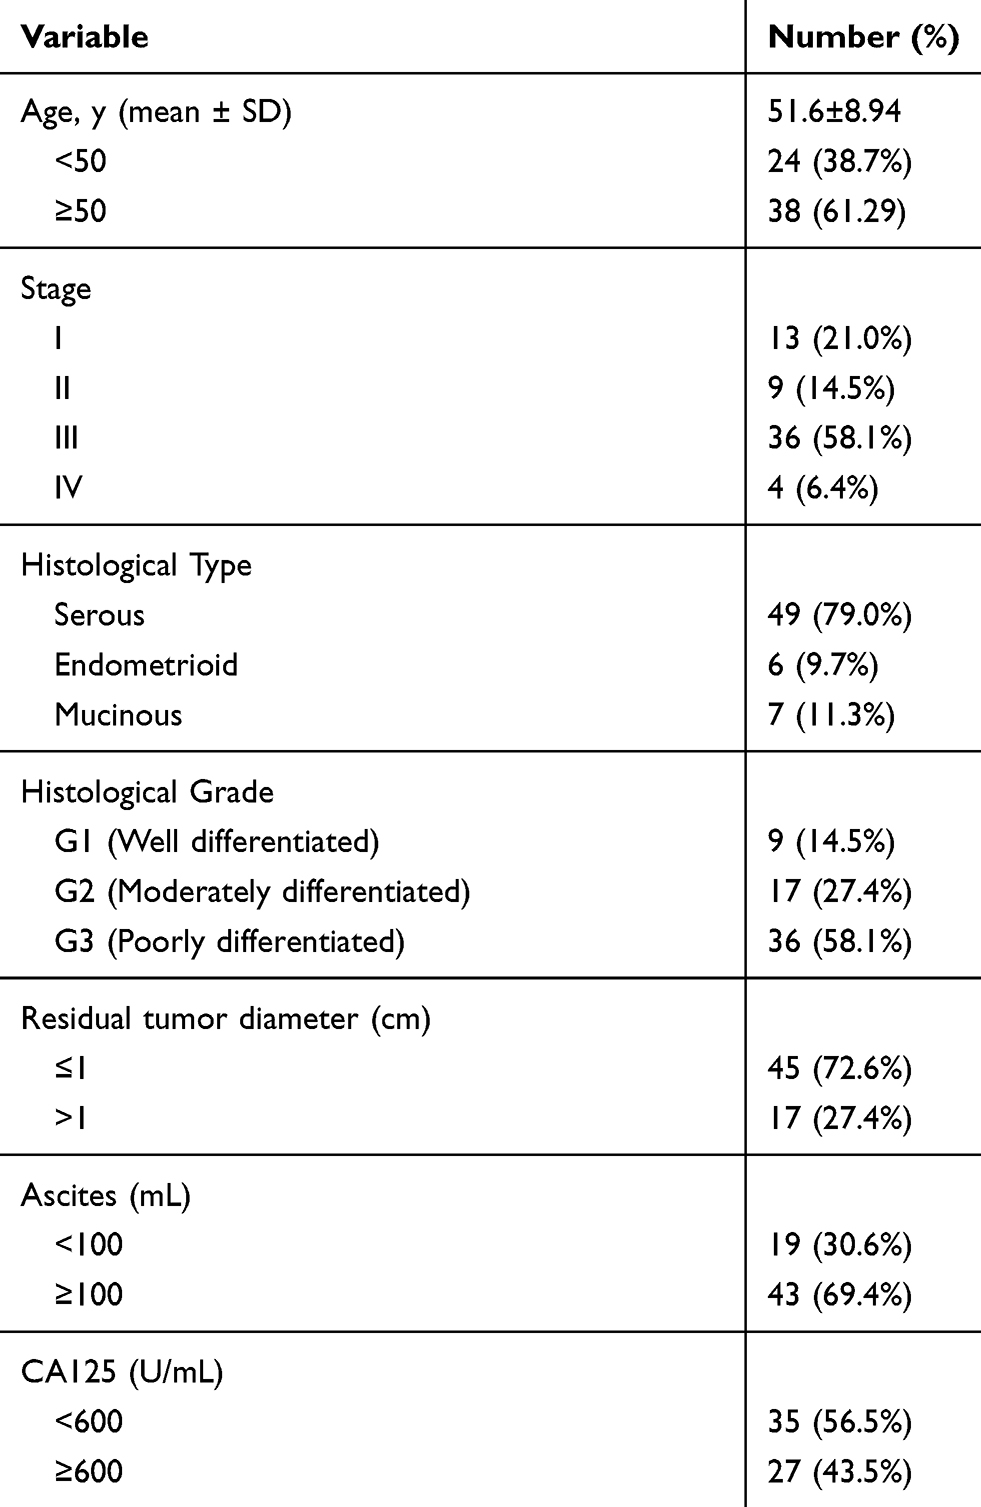 |
Table 1 Demographics and clinicopathologic characteristics of EOC patients |
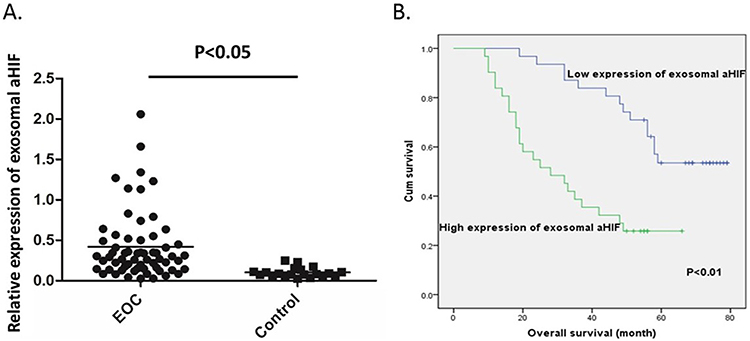 |
Figure 4 Relative expression levels of exosomal aHIF in EOC patients and their clinical significance. Relative expression levels of serum exosomal aHIF in EOC patients (n=62) and controls (n=20) (A) Kaplan–Meier survival curves of EOC patients according to expression levels of serum exosomal aHIF (B). |
Expression of serum exosomal aHIF was correlated with FIGO stage and histological grade in EOC patients
To determine the clinical relevance of serum exosomal aHIF in EOC, we examined the correlations between the expression levels of serum exosomal aHIF and clinicopathological characteristics such as age, FIGO stage, histological type, histological grade, residual tumor size, ascites volume and preoperative CA125 value by the Chi square test or Fisher’s exact probability test. The median value of serum exosomal aHIF expression was used as a cutoff value to divide patients into high expression (n=31) and low expression (n=31) groups. As shown in Table 2, the expression of serum exosomal aHIF was significantly correlated with FIGO stage and histological grade (P<0.05) but not correlated with age, histological type, residual tumor size, ascites volume or preoperative CA125 value (P>0.05). The results suggested that the overexpression of serum exosomal aHIF may be indicative of malignant behavior and may predict the clinical outcome of EOC.
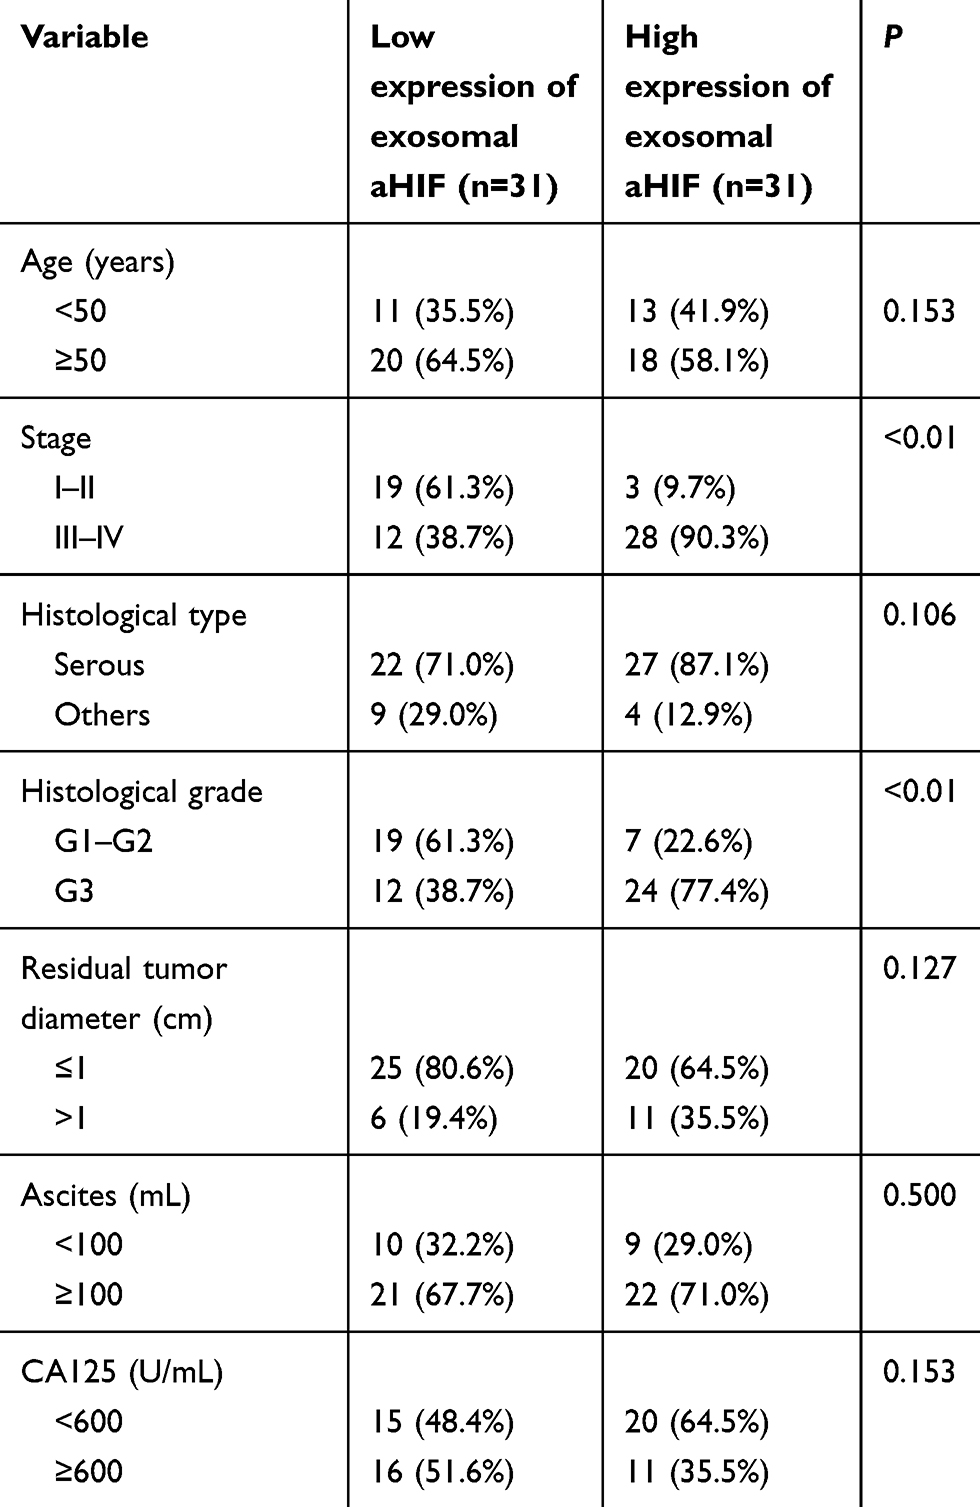 |
Table 2 Correlation between expression levels of serum exosomal aHIF and clinicopathological characteristics |
Expression of serum exosomal aHIF is an important independent prognostic factor for the survival of EOC patients
To evaluate the correlation between the expression of serum exosomal aHIF and overall survival (OS), we first performed univariate analysis of clinicopathological variables for prognosis. The median follow-up time was 49 months (range: 9–79 months). The results demonstrated that FIGO stage (P<0.001), histological grade (P=0.008), residual tumor size (P=0.002), and the expression level of serum exosomal aHIF (P<0.001) were significantly correlated with the OS of EOC patients (Table 3). Furthermore, the Kaplan-Meier survival curves revealed that EOC patients with high expression levels of serum exosomal aHIF had significantly shorter OS than those with low expression levels of serum exosomal aHIF (Figure 4B). FIGO stage, residual tumor size and expression of serum exosomal aHIF were also independent prognostic factors in EOC patients (Table 4). Taken together, the evidence suggests that serum exosomal aHIF may be a potential biomarker for EOC prognosis.
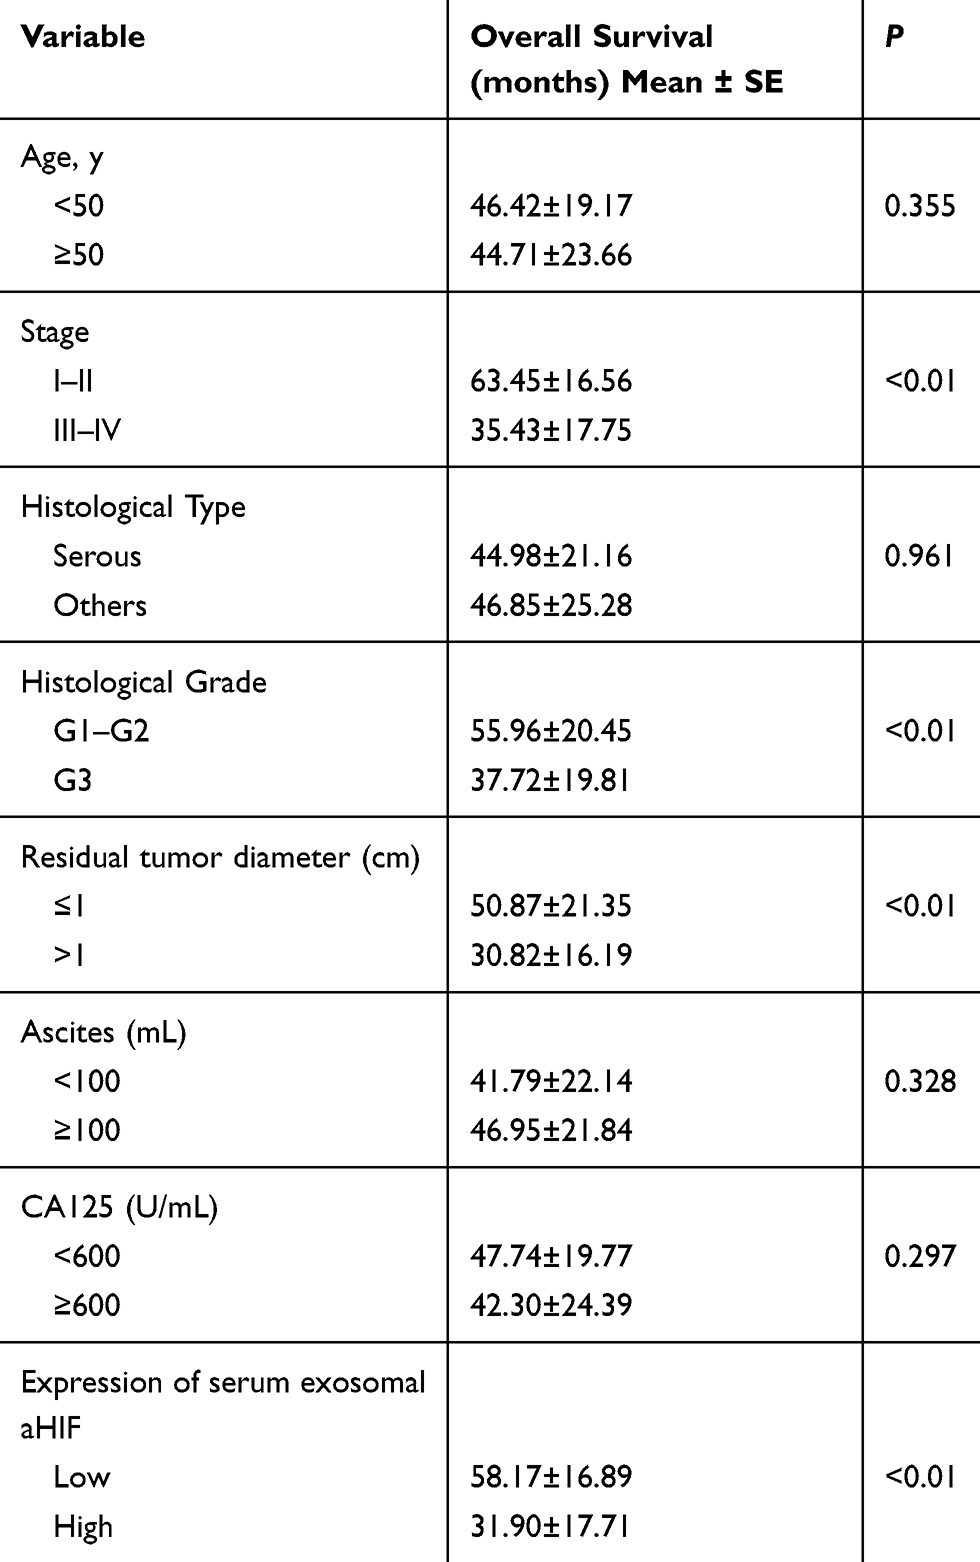 |
Table 3 The correlation between clinicopathological characteristics and the overall survival in 62 EOC patients |
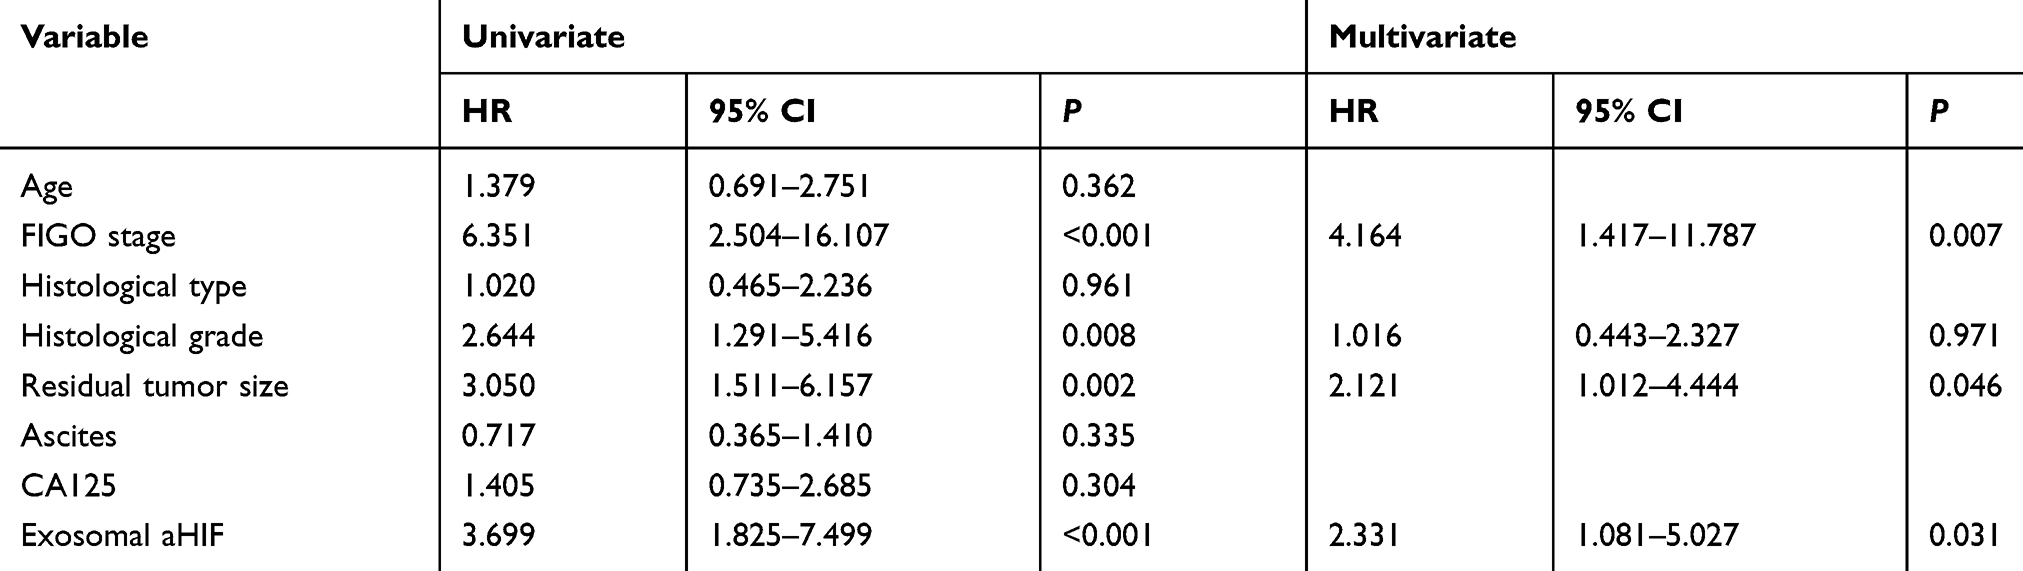 |
Table 4 Univariate and multivariate analysis for overall survival in EOC patients |
A prognostic predictive nomogram for EOC patients was established based on the expression level of serum exosomal aHIF
A nomogram was established that incorporated the significant prognostic factors identified by the multivariate Cox hazards regression analysis including FIGO stage, residual tumor size and the expression level of serum exosomal aHIF (Figure 5). Each level within these factors was assigned a score on the top scale. By summing the scores and identifying that value on the total point scale, we can predict the probability of survival at each time point. Harrell’s c-index for the established nomogram to predict OS was 0.759 (95% CI, 0.690 to 0.828). The calibration plot for the probability of 1- and 3-year OS showed an optimal agreement between the nomogram prediction and actual observation (Figure 6). These results suggest that the nomogram is a useful tool for predicting the survival of EOC patients.
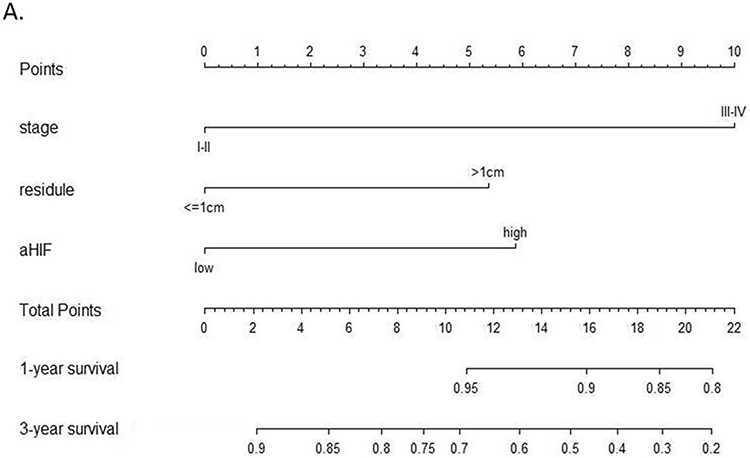 |
Figure 5 Nomogram for predicting overall survival (OS) in EOC patients. For each predictor, a straight upward line is drawn to determine the points. The cumulative points are plotted on the “Total Points” axis, and a straight downward line shows the 1- and 3-year estimated postoperative survival rates. |
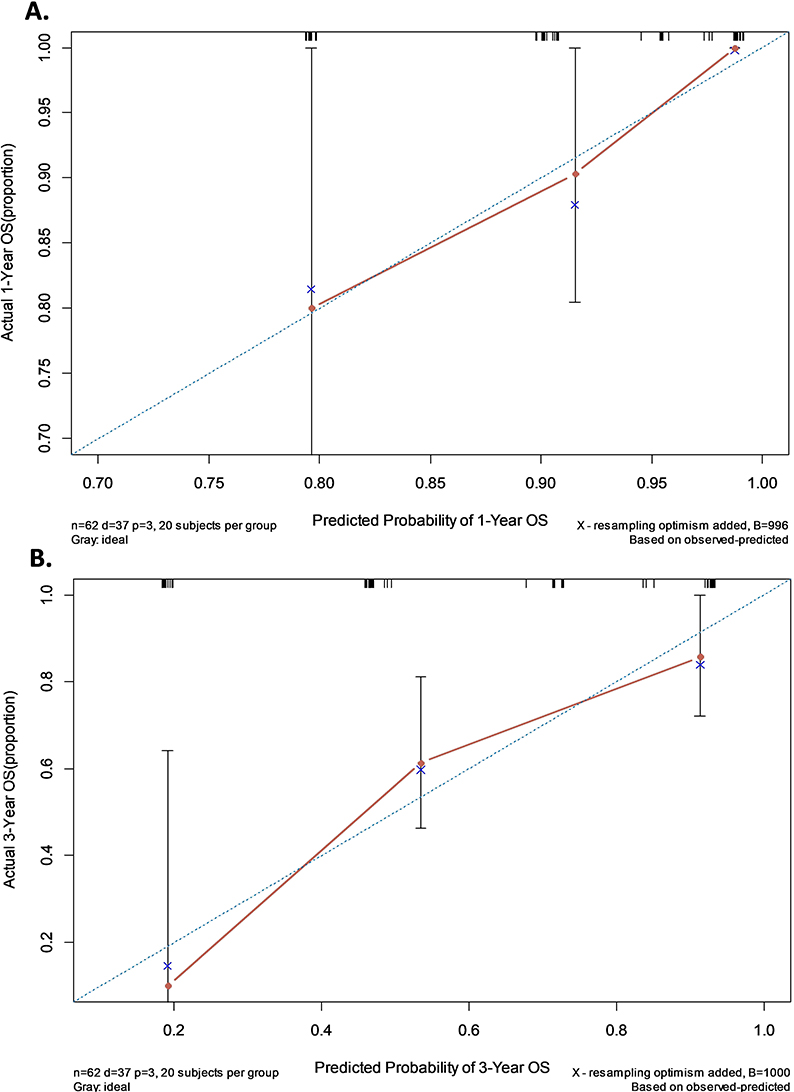 |
Figure 6 The calibration curves of nomogram for predicting overall survival (OS) at (A) one year and (B) three years. Nomogram-predicted probability of OS is plotted on the X-axis; actual OS is plotted on the Y-axis. |
Discussion
It is well known that, as an important part of the tumor microenvironment, exosomes are involved in tumor progression, metastasis and drug resistance. Exosomes carry a large number of biomolecules that are shed from tumor cells and that are cancer-specific. LncRNAs are one of the molecules carried by exosomes, and could play important roles in the progression of various cancers. Therefore, considerable focus has shifted to studying and identifying exosomal lncRNAs as novel biomarkers for the diagnosis and prognosis of tumors. For example, overexpression of exosomal HOTTIP was correlated with poor prognosis and was an independent prognostic factor in gastric cancer.34 Tong Liu et al reported that exosomal CRNDE-h can be a noninvasive serum-based tumor marker for the diagnosis and prognosis of CRC.19 We investigated whether exosomal lncRNAs could be utilized in predicting the prognosis of EOC.
In the current study, we identified exosomal aHIF in the serum of EOC patients and controls. Furthermore, we found that the expression of serum exosomal aHIF was markedly upregulated in EOC patients compared with the controls and that the expression of serum exosomal aHIF was correlated with the expression level of aHIF in paired EOC tissues. Subsequently, the measurable exosomal aHIF in the cell culture medium and the EOC xenograft experiment further indicated that exosomal aHIF is released from tumor cells and can enter into the blood. These results supported the feasibility of utilizing serum exosomal aHIF as a biomarker for EOC.
Recently, emerging evidence has indicated that aHIF is upregulated in various tumor tissues, such as chronic myeloid leukemia and bladder cancer.35,36 The overexpression of aHIF is associated with more aggressive tumor behavior and increased metastatic potential. The upregulation of aHIF in EOC was also confirmed in our previous study. aHIF can activate mitochondrial apoptosis pathway and aHIF-induced dysregulation of Bcl-2, Bax, Caspase-7, and Caspase-9 may mediate EOC apoptosis and proliferation.26 However, whether aHIF can be carried by exosomes and utilized as a biomarker in EOC are uncertain. In this study, we first identified the presence of aHIF in serum exosomes in EOC patients. To explore the clinical significance of serum exosomal aHIF in EOC, we further evaluated the associations between the expression of serum exosomal aHIF and the clinicopathological characteristics and prognosis of EOC. Notably, overexpression of serum exosomal aHIF was significantly correlated with FIGO stage and histological grade. Moreover, EOC patients with higher expression levels of serum exosomal aHIF had poorer prognoses than those with lower exosomal aHIF expression levels. This analysis revealed that serum exosomal aHIF is an independent prognostic predictor for EOC.
Finally, we established a predictive nomogram model for EOC. Recently, nomograms have been widely used as models for risk prediction in malignant tumors because they can predict the outcome of interest for specific individual based on multiple relevant clinical predictors.37–39 Also, the nomogram is simple, easy to understand and can be readily applied in clinical practice. In consideration of these advantages, we established a nomogram model that integrated not only clinicopathological factors but also the expression of serum exosomal aHIF; all included factors were proven to be independent prognostic factors via Cox multivariate analysis. The calibration plots verified a good predictive accuracy and reliability of the nomogram model in predicting the probability of survival of EOC patients. Through this nomogram model, we believe that serum exosomal aHIF has the potential to be a useful prognostic predictor for EOC patients.
Several limitations of our study must be addressed. First, selection biases are inevitable because of the retrospective design and small sample size. The data about medical treatments, such as chemotherapy and maintenance treatments, were not elucidated in this study because of the bias. Also, the association between exosomal aHIF and progression-free survival of EOC was not investigated. Second, our study was single-center analysis, and the experience may not be generalizable to the broader community. Hence, further experimental research is needed with a larger number of EOC patients from multiple centers. Finally, although the clinical significance of serum exosomal aHIF as a prognostic biomarker was examined, whether this factor contribute to the diagnosis for EOC was not explored in detail and needs further investigation. In the future, we will include patients with benign ovarian neoplasms to evaluate their diagnostic value in EOC and enlarge the sample size to further explore the role of the exosomal aHIF in medical treatments and PFS of EOC.
Conclusion
In summary, our study demonstrated for the first time that the lncRNA aHIF is present in serum exosomes and that serum exosomal aHIF originated from tumor cells. Furthermore, serum exosomal aHIF is significantly overexpressed in EOC patients compared with controls, and the expression of serum exosomal aHIF is correlated with FIGO stage and histological grade. EOC patients with higher expression levels of serum exosomal aHIF are associated with poorer prognoses. Our data indicated that serum exosomal aHIF may be a crucial noninvasive predictor of EOC prognosis and also shed light on the potential for using serum exosomal lncRNA as a tumor biomarker for the diagnosis and prognostic prediction of EOC.
Abbreviations
aHIF, antisense hypoxia inducible factor; EOC, epithelial ovarian cancer; FIGO, International Federation of Gynecology and Obstetrics; LncRNA, long noncoding RNA; OS, overall survival; qRT-PCR, Quantitative real-time PCR.
Ethics statement
Written consent was obtained from each participant. The study protocol was approved by the Medical Ethics Committee of Obstetrics and Gynecology Hospital of Fudan University and conducted in accordance with the Declaration of Helsinki. All the animal studies were approved by the Institutional Animal Care and Use Committee of Fudan University and carried out in accordance with the Chinese Laboratory Animal Care and Use Guideline.
Data availability
The datasets used and/or analyzed during the present study are available from the corresponding author on reasonable request.
Acknowledgments
This project was supported by funding from the National Natural Science Foundation of China (No. 81971361; to Junjun Qiu), the Natural Science Foundation of Shanghai Science and Technology (No. 19ZR1406900; to Junjun Qiu), Shanghai “Rising Stars of Medical Talent” Youth Development Program to Junjun Qiu, the National Natural Science Foundation of China (No.81571404; to Keqin Hua), the Shanghai Science and Technology Innovation Foundation (No. 16411950500; to Keqin Hua), and the Research and Innovation Project of Shanghai Municipal Education Commission (No. 2019-01-07-00-07-E00050; to Keqin Hua).
Author contributions
Xiaoyan Tang, Songping Liu, Yinglei Liu are the co-first authors to this article and contributed equally to this research project. All authors contributed to data analysis, drafting or revising the article, gave final approval of the version to be published, and agree to be accountable for all aspects of the work.
Disclosure
The authors report no conflicts of interest in this work.
References
1. Ferlay J, Soerjomataram I, Dikshit R, et al. Cancer incidence and mortality worldwide: sources, methods and major patterns in GLOBOCAN 2012. Int J Cancer. 2015;136(5):E359–E386. doi:10.1002/ijc.29210
2. Siegel RL, Miller KD, Jemal A. Cancer statistics, 2018. CA Cancer J Clin. 2018;68(1):7–30. doi:10.3322/caac.21442
3. Vargas-Hernandez VM, Moreno-Eutimio MA, Acosta-Altamirano G, Vargas-Aguilar VM. Management of recurrent epithelial ovarian cancer. Gland Surg. 2014;3(3):198–202. doi:10.3978/j.issn.2227-684X.2013.10.01
4. Gifford G, Paul J, Vasey PA, Kaye SB, Brown R. The acquisition of hMLH1 methylation in plasma DNA after chemotherapy predicts poor survival for ovarian cancer patients. Clin Cancer Res. 2004;10(13):4420–4426. doi:10.1158/1078-0432.CCR-03-0732
5. Vang R, Ie M S, Kurman RJ. Fallopian tube precursors of ovarian low- and high-grade serous neoplasms. Histopathology. 2013;62(1):44–58. doi:10.1111/his.12046
6. Szajnik M, Czystowska-Kuzmicz M, Elishaev E, Whiteside TL. Biological markers of prognosis, response to therapy and outcome in ovarian carcinoma. Expert Rev Mol Diagn. 2016;16(8):811–826. doi:10.1080/14737159.2016.1194758
7. Pan BT, Johnstone RM. Fate of the transferrin receptor during maturation of sheep reticulocytes in vitro: selective externalization of the receptor. Cell. 1983;33(3):967–978.
8. Skog J, Wurdinger T, van Rijn S, et al. Glioblastoma microvesicles transport RNA and proteins that promote tumour growth and provide diagnostic biomarkers. Nat Cell Biol. 2008;10(12):1470–1476. doi:10.1038/ncb1800
9. Syn N, Wang L, Sethi G, Thiery JP, Goh BC. Exosome-mediated metastasis: from epithelial-mesenchymal transition to escape from immunosurveillance. Trends Pharmacol Sci. 2016;37(7):606–617. doi:10.1016/j.tips.2016.04.006
10. Cappello F, Logozzi M, Campanella C, et al. Exosome levels in human body fluids: a tumor marker by themselves? Eur J Pharm Sci. 2017;96:93–98. doi:10.1016/j.ejps.2016.09.010
11. Kalra H, Adda CG, Liem M, et al. Comparative proteomics evaluation of plasma exosome isolation techniques and assessment of the stability of exosomes in normal human blood plasma. Proteomics. 2013;13(22):3354–3364. doi:10.1002/pmic.201300282
12. Melo SA, Luecke LB, Kahlert C, et al. Glypican-1 identifies cancer exosomes and detects early pancreatic cancer. Nature. 2015;523(7559):177–182. doi:10.1038/nature14581
13. Taylor DD, Gercel-Taylor C. MicroRNA signatures of tumor-derived exosomes as diagnostic biomarkers of ovarian cancer. Gynecol Oncol. 2008;110(1):13–21. doi:10.1016/j.ygyno.2008.04.033
14. Joyce DP, Kerin MJ, Dwyer RM. Exosome-encapsulated microRNAs as circulating biomarkers for breast cancer. Int J Cancer. 2016;139(7):1443–1448. doi:10.1002/ijc.30179
15. Alegre E, Zubiri L, Perez-Gracia JL, et al. Circulating melanoma exosomes as diagnostic and prognosis biomarkers. Clin Chim Acta. 2016;454:28–32. doi:10.1016/j.cca.2015.12.031
16. Ponting CP, Oliver PL, Reik W. Evolution and functions of long noncoding RNAs. Cell. 2009;136(4):629–641. doi:10.1016/j.cell.2009.02.006
17. Bhan A, Soleimani M, Mandal SS. Long noncoding RNA and cancer: a new paradigm. Cancer Res. 2017;77(15):3965–3981. doi:10.1158/0008-5472.CAN-16-2634
18. Jandura A, Krause HM. The new RNA world: growing evidence for long noncoding RNA functionality. Trends Genet. 2017;33(10):665–676. doi:10.1016/j.tig.2017.08.002
19. Liu T, Zhang X, Gao S, et al. Exosomal long noncoding RNA CRNDE-h as a novel serum-based biomarker for diagnosis and prognosis of colorectal cancer. Oncotarget. 2016;7(51):85551–85563. doi:10.18632/oncotarget.13465
20. Qu L, Ding J, Chen C, et al. Exosome-transmitted lncARSR promotes sunitinib resistance in renal cancer by acting as a competing endogenous RNA. Cancer Cell. 2016;29(5):653–668. doi:10.1016/j.ccell.2016.03.004
21. Tasharrofi B, Soudyab M, Nikpayam E, et al. Comparative expression analysis of hypoxia-inducible factor-alpha and its natural occurring antisense in breast cancer tissues and adjacent noncancerous tissues. Cell Biochem Funct. 2016;34(8):572–578. doi:10.1002/cbf.3230
22. Mineo M, Ricklefs F, Rooj AK, et al. The long non-coding RNA HIF1A-AS2 facilitates the maintenance of mesenchymal glioblastoma stem-like cells in hypoxic niches. Cell Rep. 2016;15(11):2500–2509. doi:10.1016/j.celrep.2016.05.018
23. Chen WM, Huang MD, Kong R, et al. Antisense long noncoding RNA HIF1A-AS2 is upregulated in gastric cancer and associated with poor prognosis. Dig Dis Sci. 2015;60(6):1655–1662. doi:10.1007/s10620-015-3524-0
24. Cayre A, Rossignol F, Clottes E, Penault-Llorca F. aHIF but not HIF-1alpha transcript is a poor prognostic marker in human breast cancer. Breast Cancer Res. 2003;5(6):R223–R230. doi:10.1186/bcr652
25. Span PN, Rao JU, Oude Ophuis SB, et al. Overexpression of the natural antisense hypoxia-inducible factor-1alpha transcript is associated with malignant pheochromocytoma/paraganglioma. Endocr Relat Cancer. 2011;18(3):323–331. doi:10.1530/ERC-10-0184
26. Qiu JJ, Lin XJ, Zheng TT, Tang XY, Hua KQ. Natural antisense transcript of hypoxia-inducible factor 1 regulates hypoxic cell apoptosis in epithelial ovarian cancer. Onco Targets Ther. 2018;11:9101–9110. doi:10.2147/OTT.S173816
27. NCCN Clinical Practice Guidelines in Oncology (NCCN Guidelines®) ovarian cancer including fallopian tube cancer and primary peritoneal cancer. Available from: https://www.nccn.org/professionals/physician_gls/pdf/ovarian.pdf.
28. Huitzil-Melendez FD, Capanu M, O’Reilly EM, et al. Advanced hepatocellular carcinoma: which staging systems best predict prognosis? J Clin Oncol. 2010;28(17):2889–2895. doi:10.1200/JCO.2009.25.9895
29. Milane L, Singh A, Mattheolabakis G, Suresh M, Amiji MM. Exosome mediated communication within the tumor microenvironment. J Control Release. 2015;219:278–294. doi:10.1016/j.jconrel.2015.06.029
30. Franquesa M, Hoogduijn MJ, Ripoll E, et al. Update on controls for isolation and quantification methodology of extracellular vesicles derived from adipose tissue mesenchymal stem cells. Front Immunol. 2014;5:525. doi:10.3389/fimmu.2014.00525
31. Frenster JD, Placantonakis DG. Bioluminescent in vivo imaging of orthotopic glioblastoma xenografts in mice. Methods Mol Biol. 2018;1741:191–198. doi:10.1007/978-1-4939-7659-1_15
32. Meerang M, Boss A, Kenkel D, et al. Evaluation of imaging techniques for the assessment of tumour progression in an orthotopic rat model of malignant pleural mesotheliomadagger. Eur J Cardiothorac Surg. 2015;47(1):e34–e41. doi:10.1093/ejcts/ezu393
33. Maruoka Y, Nagaya T, Nakamura Y, et al. Evaluation of early therapeutic effects after near-infrared photoimmunotherapy (NIR-PIT) using luciferase-luciferin photon-counting and fluorescence imaging. Mol Pharm. 2017;14(12):4628–4635. doi:10.1021/acs.molpharmaceut.7b00731
34. Zhao R, Zhang Y, Zhang X, et al. Exosomal long noncoding RNA HOTTIP as potential novel diagnostic and prognostic biomarker test for gastric cancer. Mol Cancer. 2018;17(1):68. doi:10.1186/s12943-018-0817-x
35. Chen M, Zhuang C, Liu Y, et al. Tetracycline-inducible shRNA targeting antisense long non-coding RNA HIF1A-AS2 represses the malignant phenotypes of bladder cancer. Cancer Lett. 2016;376(1):155–164. doi:10.1016/j.canlet.2016.03.037
36. Rossignol F, Vache C, Clottes E. Natural antisense transcripts of hypoxia-inducible factor 1alpha are detected in different normal and tumour human tissues. Gene. 2002;299(1–2):135–140. doi:10.1016/s0378-1119(02)01049-1
37. Yang L, Shen W, Sakamoto N. Population-based study evaluating and predicting the probability of death resulting from thyroid cancer and other causes among patients with thyroid cancer. J Clin Oncol. 2013;31(4):468–474. doi:10.1200/JCO.2012.42.4457
38. Shao Y, Ning Z, Chen J, et al. Prognostic nomogram integrated systemic inflammation score for patients with esophageal squamous cell carcinoma undergoing radical esophagectomy. Sci Rep. 2015;5:18811. doi:10.1038/srep18811
39. Kim SY, Yoon MJ, Park YI, Kim MJ, Nam BH, Park SR. Nomograms predicting survival of patients with unresectable or metastatic gastric cancer who receive combination cytotoxic chemotherapy as first-line treatment. Gastric Cancer. 2018;21(3):453–463. doi:10.1007/s10120-017-0756-z
 © 2019 The Author(s). This work is published and licensed by Dove Medical Press Limited. The
full terms of this license are available at https://www.dovepress.com/terms
and incorporate the Creative Commons Attribution
- Non Commercial (unported, 3.0) License.
By accessing the work you hereby accept the Terms. Non-commercial uses of the work are permitted
without any further permission from Dove Medical Press Limited, provided the work is properly
attributed. For permission for commercial use of this work, please see paragraphs 4.2 and 5 of our Terms.
© 2019 The Author(s). This work is published and licensed by Dove Medical Press Limited. The
full terms of this license are available at https://www.dovepress.com/terms
and incorporate the Creative Commons Attribution
- Non Commercial (unported, 3.0) License.
By accessing the work you hereby accept the Terms. Non-commercial uses of the work are permitted
without any further permission from Dove Medical Press Limited, provided the work is properly
attributed. For permission for commercial use of this work, please see paragraphs 4.2 and 5 of our Terms.