Back to Journals » Nature and Science of Sleep » Volume 13
Circulating microRNAs as Potential Diagnostic Biomarkers for Poor Sleep Quality
Authors Baek SJ, Ban HJ, Park SM, Lee B, Choi Y, Baek Y ![]() , Lee S, Cha S
, Lee S, Cha S ![]()
Received 22 March 2021
Accepted for publication 21 May 2021
Published 29 June 2021 Volume 2021:13 Pages 1001—1012
DOI https://doi.org/10.2147/NSS.S311541
Checked for plagiarism Yes
Review by Single anonymous peer review
Peer reviewer comments 2
Editor who approved publication: Prof. Dr. Ahmed BaHammam
Su-Jin Baek, Hyo-Jeong Ban, Sang-Min Park, Boyoung Lee, Yoorae Choi, Younghwa Baek, Siwoo Lee, Seongwon Cha
Future Medicine Division, Korea Institute of Oriental Medicine, Daejeon, Republic of Korea
Correspondence: Seongwon Cha
Future Medicine Division, Korea Institute of Oriental Medicine (KIOM), Daejeon, Republic of Korea
Tel +82-42-868-9310
Fax +82-42-868-9370
Email [email protected]
Purpose: Persistent poor sleep quality leads to impaired cognitive performance and an inability to perform daily activities. Biomarker-assisted diagnosis is important for the early treatment of poor sleep quality; however, diagnostic biomarkers for poor sleep quality remain unidentified. Circulating microRNAs (miRNAs) have been reported to be linked to the pathogenesis of poor sleep quality, indicating their possible role in sleep problem diagnosis. The present study aimed to identify potential miRNA biomarkers for poor sleep quality.
Patients and Methods: Differentially expressed serum miRNAs in patients with poor sleep quality and healthy controls (n=20) were analyzed via small RNA sequencing. Two-step quantitative RT-PCR in the two independent populations and receiver operating characteristic (ROC) analyses were used to validate the identified miRNAs. In silico analysis was then used to identify the target genes.
Results: Of the 59 circulating miRNAs identified via differential analysis, six were validated for differential expression by quantitative RT-PCR (n=60). Two of these six miRNAs, miR-4433b-3p and miR-619-5p, were reconfirmed in the second validation with an independent validation cohort (n=59). ROC analyses (n=40) revealed the probability of the two miRNAs as potential biomarkers with areas under the ROC curve (AUCs) of 0.81 and 0.70, respectively. The combined AUC was 0.86, which was much higher than that of each miRNA. Using in silico target gene analysis, the target genes of the two miRNAs were identified to be associated with the regulation of the circadian rhythm and inflammatory pathways.
Conclusion: Our results revealed that miR-619-5p and miR-4433b-3p could be developed as potential diagnostic biomarkers for poor sleep quality. The combination of both miRNAs may be more effective than the use of the individual miRNA for sleep problem diagnosis.
Keywords: inappropriate sleep quality, miRNA, serum, expression profiling
Introduction
Poor sleep quality is common and associated with short- and long-term effects on human health and well-being. Poor sleep quality has been linked to leading causes of death, including cancers1–3 and chronic diseases such as cardiovascular disease,4–6 hypertension,7,8 and diabetes.9 Various methods for assessment of sleep quality have been developed, of which the Pittsburgh Sleep Quality Index (PSQI) is the most widely used.10 The PSQI provides a measure of global sleep quality based on the respondent’s subjective answers to a questionnaire evaluating parameters of sleep quality such as sleep latency, sleep duration, habitual sleep efficiency, sleep disturbance, daytime disturbance, sleep quality, and use of sleep medications.10 A global PSQI score >5 indicates poor sleep quality (score range from 0–21).11 Sleep problem induced by low-quality sleep leads to the aggravation of diseases, such as hypertension, cardiovascular disease, dyslipidemia, and metabolic syndrome, and reduces the overall quality of life.12 The pathogenic molecular mechanisms of poor sleep quality are not fully understood, indicating the difficulty in effective prediction and development of treatments. Therefore, the diagnosis and therapy of poor sleep quality are important clinical issues.
The recent identification of circulating miRNAs has enabled the profiling of multivariate models or signatures that could predict sleep problem diagnosis in patients.13 miRNAs are endogenous post-transcriptional regulators of gene signatures and are crucial for the regulation of biological processes. The differential expression signatures of miRNAs depend on pathological stimuli and reflect the functional state of the cell, making the miRNA signature an attractive biomarker candidate. Numerous reports have indicated circulating miRNAs as potential biomarkers for the diagnosis of diseases, such as cancer14 and cardiovascular disease.15 In the serum, miRNAs are highly stable, and significant changes in their expression have been reported in cardiovascular diseases16 and several types of cancer.17 Thus, miRNAs have been suggested as highly useful biomarkers for the diagnosis of such disorders.18
In this study, we performed miRNA profiling via high-throughput sequencing to explore a method for the prediction or diagnosis of poor sleep quality. Herein, we report the identification of two miRNAs as potential biomarkers that are differentially expressed in individuals comprising both adult men and women with poor sleep quality, compared to healthy controls, and their validation as putative biomarkers for sleep problem prediction or diagnosis.
Patients and Methods
Subject Selection
Subjects for NGS and the First Validation
In the first analytical step, next-generation sequencing (NGS) was carried out on subjects who visited an oriental medicine clinic due to recurrent poor sleep quality, and 40 individuals (17 men and 23 women, aged 35–45 years, recruited between 2014 and 2015) within the normal body mass index (BMI) range (≥18.5 kg/m2 and <25 kg/m2) were set as the poor sleep quality group based on their scores on the poor sleep quality questionnaire of the PSQI (Table S1). The PSQI measures the subjective sleep quality and disturbances during the previous month, and it comprises 19 items that assess a broad range of parameters related to sleep quality. There are seven component scores (subjective sleep quality, sleep latency, sleep duration, habitual sleep efficiency, sleep disturbances, use of sleeping medication, and daytime dysfunction). Each component score has a range of 0–3, with higher scores indicating more severe sleep complaints. The PSQI score, obtained by adding the scores of all seven categories, ranges from 0 (good sleeper) to 21 (poor sleeper). Using a cut-off score of 5, the individuals were categorized as having: poor sleep quality (PSQI score >5) or good sleep quality (PSQI score ≤5).11 The poor sleep quality group had no subjects with medical history affecting sleep quality such as severe insomnia, depression, and related medications, or female subjects in the pregnancy, breast-feeding, or menstruation stage. The control group consisted of 40 healthy individuals (20 men and 20 women), with no medical history of cardio-cerebrovascular diseases, cancer, psychological disorders, arthritis, thyroid disorders, and medications for neuropsychiatry in the past one month, and no pregnant or breast-feeding women as assessed by both subjective diagnosis and testing for metabolic syndrome factors. Ten individuals each (five men and five women, aged 30–49 years, recruited between 2016 and 2017) from the poor sleep quality and the control groups were selected for NGS analysis. The remaining 30 individuals in each group were evaluated via quantitative reverse transcription-polymerase chain reaction (RT-qPCR). The inclusion and exclusion criteria are shown in Table S2.
Subjects for the Second Validation and ROC Curve Analysis
The poor sleep quality group for the second test consisted of 49 subjects (23 men and 26 women, aged 35–45 years, recruited between 2015 and 2016), selected from among the people who visited an oriental medicine clinic due to persistent and recurrent symptoms of fatigue, with a poor sleep quality-PSQI score >5, BMI within the normal range, and no history of specific diseases possibly affecting sleep or related to metabolic syndrome. The control group consisted of 50 healthy individuals (24 men and 26 women, aged 30–49 years; recruited between 2016 and 2017) with a PSQI score ≤5 and fulfilling the above mentioned criteria regarding BMI and disease history. We randomly divided the poor sleep quality and control subjects into two subgroups for the second validation (29 cases and 30 controls) and the receiver operating characteristic (ROC) curve analysis (20 cases and controls each).
Small RNA Sequencing and Data Analysis
Serum RNA Extraction and Library Preparation
Total RNA was isolated from 1.5 mL serum using the mirVana Paris kit (Ambion, Carlsbad, CA, USA), and miRNAs were subsequently isolated using a Bioanalyzer (Agilent Technologies, Santa Clara, CA, USA). For each sample, a cDNA library based on 10 ng of small RNAs was prepared using the NEBNext® Multiplex Small RNA Library Prep Set.
Circulating miRNA Profiling Using High-Throughput Sequencing
The nucleotide sequence of the prepared cDNA library was analyzed using an Illumina NextSeq 500 platform (Illumina, San Diego, CA, USA) with 76 bp single reads. Reads were trimmed using the FASTQ Toolkit to remove adapters and low-quality reads (per-base quality <15 nt), thereby improving mapping. High-quality sequence reads were mapped to the human genome (hg19), and the expression levels of miRNAs were quantified using the BaseSpace® Small RNA v1.0. The differences in miRNA expression between the poor sleep quality and control groups, in terms of the rate of change (log transformation) and statistical significance (|log FC| ≥2 and p-value <0.05) were analyzed using the DESeq2 packages.19
Functional Annotation of DEmiRs
To study the biological function of the differentially expressed miRNAs (DEmiRs) in poor sleep quality, we performed gene ontology enrichment analysis based on the online software TAM 2.0,20 and a p-value of <0.05 was set as statistically significant.
Target Gene Expression and Correlation Analysis
Target genes of the identified six DEmiRs were predicted using TargetScan.21 Expression data for poor sleep quality were downloaded from the GEO database (available at https://www.ncbi.nlm.nih.gov/geo/; accession number: GSE80612). Each sample was grouped into two distinct groups (short and long sleep).22 Differentially expressed genes (DEGs) were identified using GEO2R.23 The pairwise Pearson correlation coefficients between target genes and DEmiRs were calculated to identify miRNA-target pairs with correlations in expression (p-value <0.05).
Functional Annotation of Target Gene-miRNAs and Visualization
To gain insight into the functions of miRNA target genes, we performed gene set enrichment analysis based on fast gene set enrichment analysis (fgsea).24 The cut-off value for the hallmark gene sets was p-value <0.05. Two miRNA-target pairs were used to establish the miRNA-target regulatory network, which was visualized using the Cytoscape software.25 Furthermore, the interactions in the network module were investigated using the GeneMANIA Cytoscape plugin (Cytoscape software, version 3.8.2).26
ROC Curve Analysis
The diagnostic value for differentiating between the poor sleep quality (n=20) and sleep control (n=20) groups was assessed by calculating the area under the ROC curve. The poor sleep quality prediction probability, sensitivity, and 1-specificity for each sample were calculated based on a logistic regression model with age, gender, and miRNA expression level as variables, using the SPSS program. Based on the calculated values, an ROC was drawn using the SPSS program, with 1-specificity as the x-axis and sensitivity as y-axis. The area under the curve (AUC) for determining the accuracy as well as the p-value for statistical significance was estimated.
RT-qPCR Validation
Serum miRNA Isolation
Spike-in control RNA (Cel-miR-39) was added to 0.4 mL of the same serum used in Section “Serum RNA extraction and library preparation”, and the total RNA was isolated from the serum using the mirVana Paris kit (Ambion). The cDNA library was prepared using the miScript II RT kit (Qiagen).
RT-qPCR Analysis
A pre-amplification (12 cycles) was carried out using primers that could selectively recognize the base sequence and the miScript PreAMP PCR kit (Qiagen). Next, a qualitative analysis of miRNAs was carried out using the miScript SYBR Green PCR kit (Qiagen) and a real-time PCR system (LifeScience, ABI).
Statistical Analysis of the Differences in miRNA Expression Level
After correction of experimental errors for the threshold cycle (Ct) value of miRNAs using the spike-in control RNA (Cel-miR-39) Ct values, and following the log transformation for the rate of change in the expression of miRNAs between the poor sleep quality and control groups, a t-test was performed to evaluate the statistical significance (p-value <0.05).
Results
Patient Characteristics
A total of 179 participants, including 89 patients with poor sleep quality and 90 controls, were enrolled in this study. Table 1 shows the demographics and clinical features of the patients with poor sleep quality and healthy controls. There were no significant differences in age and BMI between cases and controls in all the four study groups (p-value > 0.05 with Mann–Whitney U-test; data not shown). The gender ratios, especially in cases of validation steps, appeared to be different in that the percentage of women was slightly higher than that of men. The study procedure is illustrated in Figure 1.
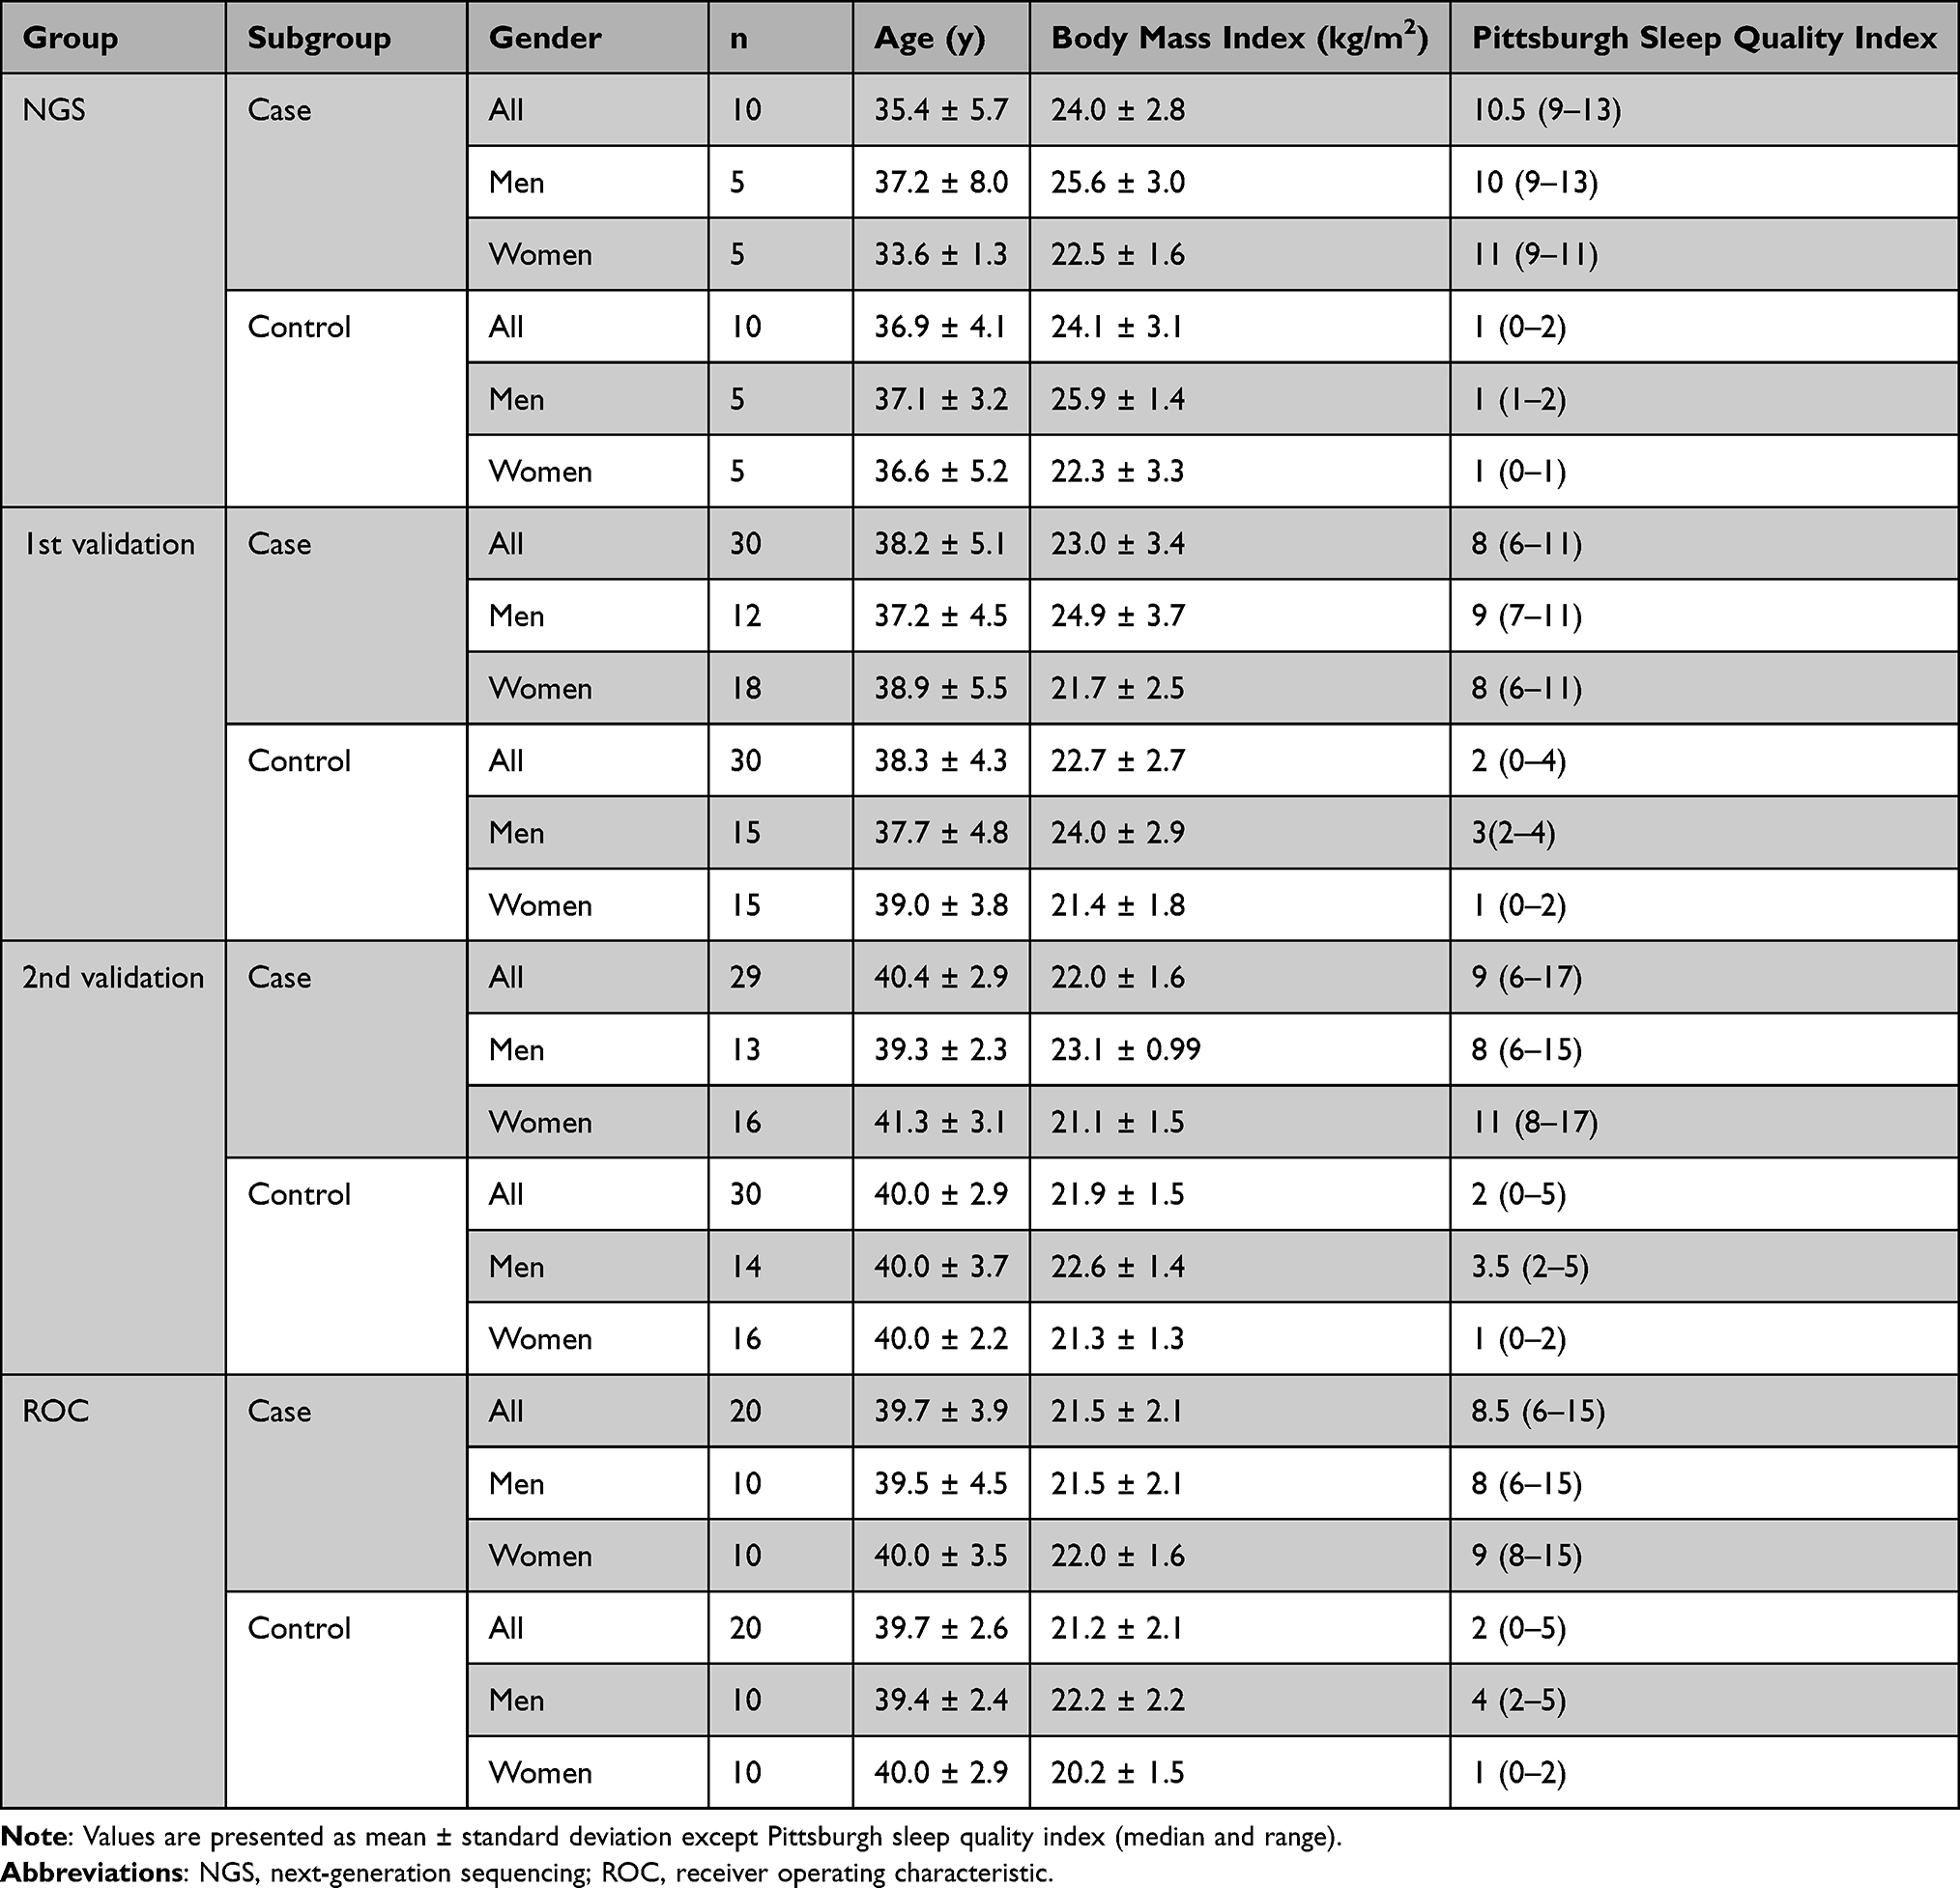 |
Table 1 Characteristics of the 179 Participants in This Study |
 |
Figure 1 Overall flow diagram of study inclusion. Overall scheme to identify miRNA as potential biomarker. Number of study participants according to overall design. Abbreviations: NGS, next-generation sequencing; ROC, receiver operating characteristic; AUCs, areas under the ROC curve. |
DEmiRs in Poor Sleep Quality versus Control Groups
We performed miRNA profiling using 10 (five women and men each) patients with poor sleep quality and 10 (five women and men each) controls to identify DEmiRs between the two groups. Of them, approximately 8.72% (26/298) were upregulated and 4.70% (14/298) were downregulated in women (|fc| ≥2 and p-value <0.05) (Figure 2A). In men, 0.67% (2/298) and 7.38% (22/298) DEmiRs were upregulated and downregulated, respectively, in the poor sleep quality group compared to that in the control group (Figure 2B). In total, 59 miRNAs were identified as differentially expressed between the poor sleep quality and control groups (Figure 2C).
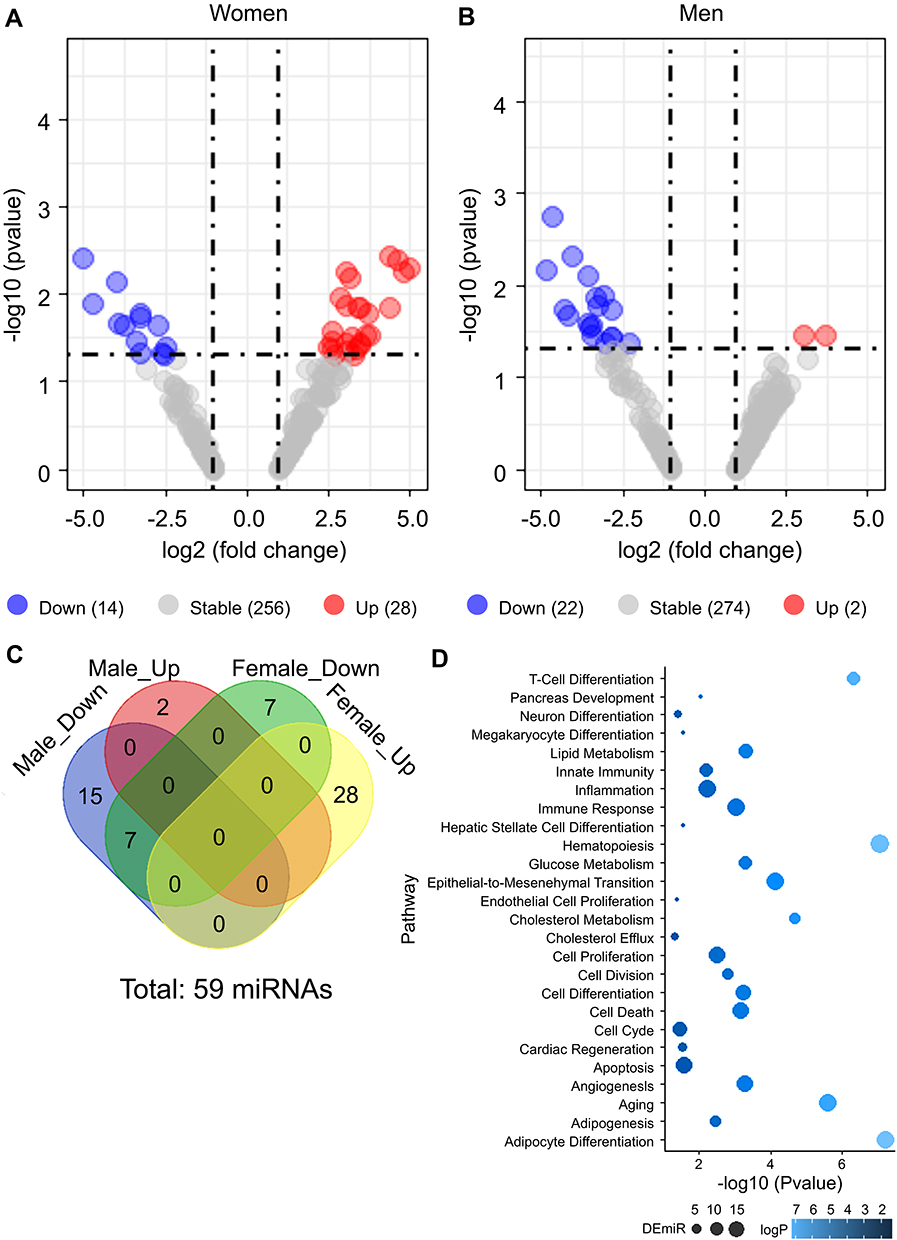 |
Figure 2 The 59 DEmiRs in the serum of patients with poor sleep quality compared with that in controls. A volcano plot to visualize the DEmiRs between the poor sleep quality and sleep control groups in women (A) and men (B). The red dots represent upregulated expression, and the blue dots represent downregulated expression. (C) Venn diagram is illustrated to compare the number of DEmiRs between women and men. Venn diagram showing detailed distributions among the number of DEmiRs. (D) Dot plot showing gene ontology functions for the 59 DEmiRs. Only the enriched pathways with a p-value <0.05 are shown. The size of the dots represents the DEmiR count, and the colors represent p-values. |
Functional annotation of these 59 DEmiRs revealed that they were significantly enriched in T-cell differentiation (p-value: 4.41E-07), hematopoiesis (p-value: 8.71E-08), and adipocyte differentiation (p-value: 6.40E-08; Figure 2D; Table S3). Table S4 shows the DEmiRs, their fold changes, and p-values in the serum of patients with poor sleep quality.
Selection of Two miRNAs Relevant to Poor Sleep Quality Based on the Results of the Two-Step Validation
To confirm the expression profiles obtained from high-throughput sequencing, two-step RT-qPCR was performed to validate the 59 DEmiRs previously identified by NGS analysis. The expression patterns of the selected miRNAs were consistent with those determined using NGS, indicating that the sequencing data produced in the present study were reliable and could be subjected to further analysis. Six miRNAs were consistently verified in the first validation cohort (60 independent subjects; 30 patients with poor sleep quality and 30 controls) using RT-qPCR analysis (Figure 3). Out of the six miRNAs, let-7a and miR-296 were upregulated in patients with poor sleep quality compared to that in controls (Figure 3A and B), whereas miR-619-5p, miR-642, miR-1273d, and miR-4433b-3p were downregulated in patients with poor sleep quality (Figure 3C–F). For two of these miRNAs, miR-4433b-3p and miR-619-5p, a statistically significant difference between the two groups in an independent second validation cohort of 59 subjects (59 independent subjects, 29 patients with poor sleep quality, and 30 controls) was observed (Figure 4A and B). Expression of both the miRNAs was downregulated in the poor sleep quality group compared to that in the control group. This result was in accordance with the NGS data and the first RT-qPCR validation. We identified a strong correlation between the two identified miRNAs (Figure 4C; miR-4433b-3p and miR-619-5p: r=0.5, p-value=0.026) in both the poor sleep quality and control groups. Interestingly, miR-4433b-3p indicated reproducibility in men, while both the miRNAs indicated reproducibility in women.
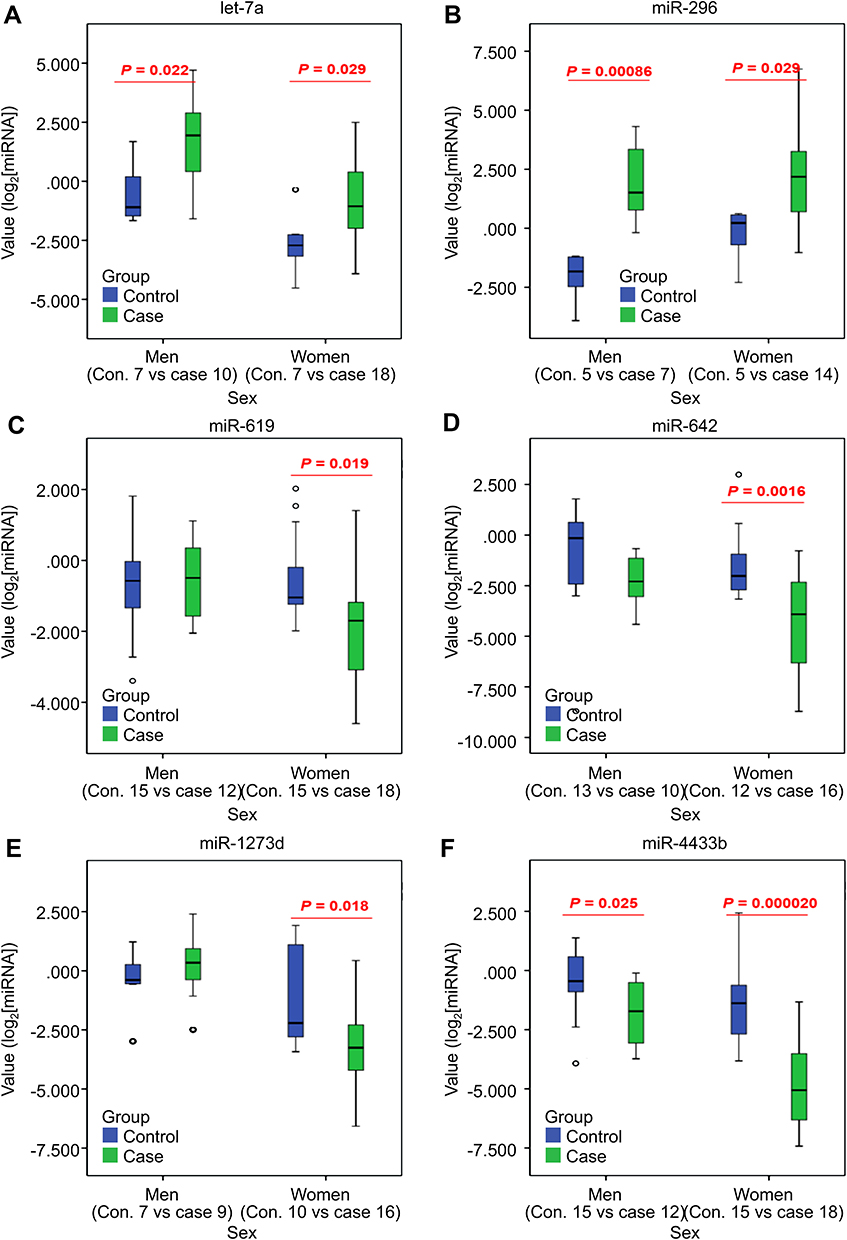 |
Figure 3 The first verification of the six candidate miRNAs via RT-qPCR. The expression levels of circulating miRNAs in the poor sleep quality group compared with that in the sleep control group. (A) let-7a (B) miR-296 (C) miR-619 (D) miR-642 (E) miR-1273d, and (F) miR-4433b. (Blue box: control; green box: poor sleep quality). |
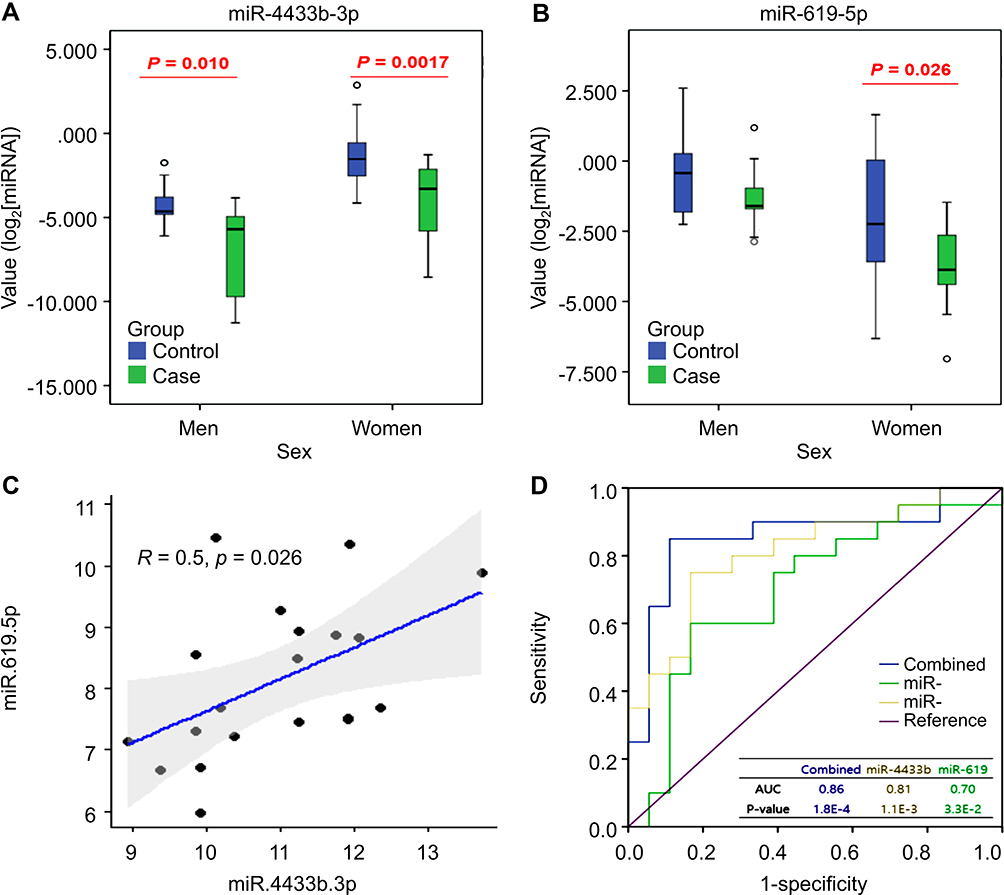 |
Figure 4 Detection of two candidate miRNAs. (A) Expression levels of miR-4433b-3p via RT-qPCR (B) Expression levels of miR-619-5p via RT-qPCR (C) Scatter plot based on Pearson correlation between miR-4433b-3p and miR-619-5p expression levels (D) Diagnostic power of the two miRNA candidates using ROC analysis. |
Assessment of the Diagnostic Potential of Validated miRNAs Using ROC Analysis
The ROC curves of miR-4433b-3p and miR-619-5p revealed their potential as useful biomarkers with AUCs of 0.81 and 0.70, respectively. As shown in Figure 4D, miR-4433b-3p and miR-619-5p were significantly associated with each other, indicating their effectiveness for joint diagnosis. The combined AUC value was 0.86, which was much higher than that of each single miRNA, suggesting the highest discriminatory power.
Identification of miRNA-Target Gene Interaction Networks for Poor Sleep Quality
To identify the potential roles of differentially expressed target genes in poor sleep quality, we conducted target gene prediction, statistical differential analysis of target genes, and functional enrichment analysis. The distribution of differentially expressed target genes is summarized in Table S5 and Figure S1. Enrichment analysis of the six miRNA target sets showed that target genes of the upregulated miRNAs were most frequently associated with TGF beta signaling (p-value: 0.02) and E2F targets (p-value: 0.04), while the targets genes of downregulated miRNAs were enriched in MYC targets (p-value: 0.03), PI3K-AKT-MTOR signaling (p-value: 0.02), and inflammatory response (p-value: 0.02; Figure S2 and Table S6). Among the differentially expressed target genes of miR-4433b-3p and miR-619-5p from the total target genes of the six miRNAs, we identified the previously reported circadian rhythm or clock-related genes. CREBBP, RPS27A, and HDAC2, which were the differentially expressed target genes of miR-4433b-3p, were previously reported to be related to the circadian rhythm (Figure S3A). Additionally, six genes (PPP1CB, PPP1CC, CREBBP, HELZ2, NCOA1, and TBL1X) which were the differentially expressed target genes of miR-619-5p, were associated with the circadian rhythm or clock-related genes (Figure S3B).
To identify the direct target genes regulated by the two poor sleep quality-miRNAs, we analyzed the reverse correlation of expression of each miRNA with its target mRNA expression. A total of 100 genes were identified via the Pearson correlation test with a p-value <0.05 (Table S7). The miRNA-mRNA analysis identified 41 genes, which accounted for 41% (41/100) of the target genes that were inversely correlated with the two miRNAs. The integrated miRNA-mRNA network of the two poor sleep quality-miRNAs and 100 target genes is shown in Figure 5. Network analyses showed that the predicted target genes of the two poor sleep quality-miRNAs overlapped with DHX40 and ZNF160. Functional enrichment of the network genes identified 15 pathways related to “inflammation” and “circadian” terms, which could possibly be poor sleep quality-associated (Table S8). Significantly enriched pathways by miR-4433b-3p included inflammation (p-value: 0.048) and inflammatory bowel disease (p-value: 0.006) pathways. Among the two genes showing a significant correlation with miR-619-5p expression levels, GBN5 and TP53 were associated with circadian entrainment and entrainment of the circadian clock by photoperiod.
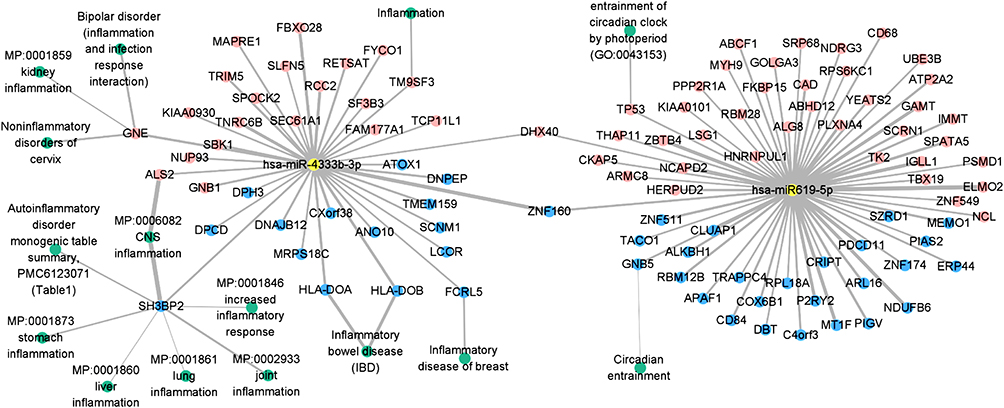 |
Figure 5 The miRNA-mRNA interaction network for poor sleep quality. Integrated networks of the miRNA-mRNA interaction (correlation p-value <0.05). Yellow and green circles represent miRNAs and functional terms, the blue and red circles represent the inversely correlated target genes and positively correlated target genes. |
Discussion
Circulating miRNAs in the serum may serve as clinically important biomarkers of various diseases, including poor sleep quality.27 The lack of effective biomarkers, such as circulating miRNAs that could indicate sleep problem needs to be addressed. Altered expression of miRNAs is associated with sleep related diseases.27–31 This suggests that altered expression levels of miRNAs may not only be an important physiological component associated with sleep quality but may also serve as a useful biomarker for the detection of poor sleep quality. Recent studies have focused on the detection and identification of circulating miRNAs associated with sleep-related diseases such as OSA (obstructive sleep apnea),27,28 also referred to as OSAHS (obstructive sleep apnea-hypopnea syndrome),29 narcolepsy,30 and habitual short sleep.31 To our knowledge, this is the first study regarding the role of circulating miRNAs in identifying signatures of patients with poor sleep quality, assessed for global sleep quality using the PSQI. The key findings of the present study were that low quality of sleep (PSQI >5) is associated with alteration in the expression levels of miR-4433b-3p and miR-619-5p, key miRNAs underlying the diagnosis of poor sleep quality, and that an miRNA-mRNA network related to poor sleep quality has been identified. miR-4433b-3p has been reported as an associated biomarker in breast cancer,32 autism,33 and stroke.34 Dysregulation of miR-619-5p was found to be a prognostic indicator in colorectal cancer.35 However, currently, there is no report on miR-4433b-3p and miR-619-5p correlating them with sleep-related diseases.
The ROC curve analysis of the two miRNA signatures revealed that the combined AUC value was 0.86, implying good predictive performance. Functional network analyses revealed that the target genes of the two miRNAs function in the circadian cycle in inflammatory diseases, such as IBD (Inflammatory bowel disease), and in the inflammation of the stomach, liver, lung, and joints. These new miRNAs and target mRNAs showed good predictive power in poor sleep quality groups. The target genes of these miRNAs were related to circadian genes; and therefore, they may be used as novel markers for poor sleep.
Detection of miRNA-target genes and functional analysis to understand the molecular basis of sleep problem pathogenesis is an important challenge since there are numerous pathways that drive poor sleep quality. To predict the changes in expression of target genes of the validated miRNAs, we performed differential expression analysis related to sleep problem from GEO data for functional analysis. Functional analysis showed that the differentially expressed target genes of the poor sleep quality-miRNAs were related to TNFA signaling via NFKB, TGF beta signaling, interferon-gamma response, and inflammatory response (Figure S2). A proinflammatory vascular environment is a common consequence of insufficient sleep and is thought to be a major contributor to poor sleep quality.36,37
Recent studies have investigated the regulatory mechanisms of the circadian clock affecting diverse diseases.38,39 We focused on recent research findings regarding circadian clock regulation within the miRNA systems,40 shedding light on circadian rhythm-related regulation. Investigation of the roles of the circadian clock genes regulated by miRNAs in poor sleep quality is expected to help identify new targets for sleep-related diseases. In this study, we identified differentially expressed target genes previously reported in the circadian rhythm or clock regulation. CREBBP (also known as CBP), a common target gene of both miR-4433b-3p and miR-619-5p, has been reported to play an important role in the rapid activation of the CLOCK-BMAL1 heterodimer that leads to phase resetting of the circadian clock.41 From the mRNA-miRNA interaction network, two genes (TP53 and GNB5) related to circadian genes were correlated with miR-619-5p expression. TP53 is known to have a regulatory role in period2 (PER2) expression,42 and GNB5 plays a crucial role in controlling the clock genes in the hippocampus.43 Additionally, many studies have reported that molecular interactions between TP53 and coactivators CBP/p300 are critical for the regulation of TP53 transactivation, associated with disease progression and treatment.44,45 Therefore, the interplay between TP53 and CREBBP appears to play a crucial role in poor sleep quality through its effects on the circadian clock.
This study had a few limitations. First, the sample size of the test was small. Hence, large-scale prospective cohort studies in different ethnic populations are necessary to verify our findings. Second, the exact molecular mechanisms and roles of these miRNAs remain unclear, and further experimental validation studies are needed.
Conclusions
We identified two serum miRNAs to distinguish patients with poor sleep quality from controls. Among these miRNAs, the combination of miR-4433b-3p and miR-619-5p has better potential to diagnose poor sleep quality. Our findings on these candidate miRNAs for sleep problem diagnosis are preliminary, and the mechanisms of how these miRNAs affect the pathogenesis of poor sleep quality require further investigation. Since these miRNAs may play a critical role in regulating target genes (especially circadian rhythm), they have the potential to be used as tools for the diagnosis of sleep problems.
Abbreviations
miRNAs, microRNAs; ROC, receiver operating characteristic; AUCs, areas under the ROC curves; PSQI, Pittsburgh Sleep Quality Index; NGS, next-generation sequencing; BMI, body mass index; RT-qPCR, quantitative reverse transcription-polymerase chain reaction; DEmiRs, differentially expressed miRNAs; DEGs, differentially expressed genes; OSA, obstructive sleep apnea; OSAHS, obstructive sleep apnea-hypopnea syndrome.
Data Sharing Statement
Small RNA sequencing data were deposited in the NCBI’s Gene Expression Omnibus (Accession number: GSE165041).
Ethics Approval and Informed Consent
All participants were recruited in South Korea, and they provided written informed consent for participation in the study. The study was approved by the Institutional Review Boards of the Daejeon University Hospital (for case groups in NGS and first validation test, IRB No. P2014-04-2), the Kyung Hee University Hospital (for the case group in the first validation test, IRB No. KOMCIRB-160819-HRBR-041), and the Gandong Kyung Hee University Hospital (for the case group in the second validation test, IRB No. KHNMCOH 2015-08-002-002; for the control group in the second validation test, IRB No. KHNMCOH 2016-07-004). All procedures involving human participants were in accordance with the ethical standards of the institutional and/or national research committee and with the 1964 Helsinki declaration and its later amendments or comparable ethical standards.
Acknowledgments
This study was supported by the research program of the Korea Institute of Oriental Medicine (No. KSN2022120) and by the National Research Foundation in Korea (NRF-2014M3A9D7034335).
Disclosure
Ms Boyoung Lee is currently an emplyee of Bioneer Corporation, she was an employee of KIOM during the conduct of the study. Ms Yoorae Choi is currently an emloyee of National Institute of Food and Drug Safety Evaluation, she was an employee of KIOM during the conduct of the study. Dr Seongwon Cha reports grants from National Research Foundation in Korea (NRF-2014M3A9D7034335), and from Korea Institute of Oriental Medicine (No. KSN2022120), during the conduct of the study. In addition, Dr Seongwon Cha has a patent “A marker for the determination of sleep disturbance” issued during the preparation of the manuscript. The authors report no other potential conflicts of interest for this work.
References
1. Collins KP, Geller DA, Antoni M, et al. Sleep duration is associated with survival in advanced cancer patients. Sleep Med. 2017;32:208–212. doi:10.1016/j.sleep.2016.06.041
2. Lu C, Sun H, Huang J, et al. Long-term sleep duration as a risk factor for breast cancer: evidence from a systematic review and dose-response meta-analysis. Biomed Res Int. 2017;2017:4845059. doi:10.1155/2017/4845059
3. Trudel-Fitzgerald C, Zhou ES, Poole EM, et al. Sleep and survival among women with breast cancer: 30 years of follow-up within the Nurses’ Health Study. Br J Cancer. 2017;116(9):1239–1246. doi:10.1038/bjc.2017.85
4. Cappuccio FP, Cooper D, D’Elia L, Strazzullo P, Miller MA. Sleep duration predicts cardiovascular outcomes: a systematic review and meta-analysis of prospective studies. Eur Heart J. 2011;32(12):1484–1492. doi:10.1093/eurheartj/ehr007
5. Grandner MA, Jackson NJ, Pak VM, Gehrman PR. Sleep disturbance is associated with cardiovascular and metabolic disorders. J Sleep Res. 2012;21(4):427–433. doi:10.1111/j.1365-2869.2011.00990.x
6. Ludka O. Sleep apnea and cardiovascular disease. Cas Lek Cesk. 2019;158(5):178–184. Spankova apnoe a kardiovaskularni onemocněni.
7. Makarem N, Shechter A, Carnethon MR, Mullington JM, Hall MH, Abdalla M. Sleep duration and blood pressure: recent advances and future directions. Curr Hypertens Rep. 2019;21(5):33. doi:10.1007/s11906-019-0938-7
8. Mansukhani MP, Covassin N, Somers VK. Neurological sleep disorders and blood pressure: current evidence. Hypertension. 2019;74(4):726–732. doi:10.1161/HYPERTENSIONAHA.119.13456
9. Chattu VK, Manzar MD, Kumary S, Burman D, Spence DW, Pandi-Perumal SR. The global problem of insufficient sleep and its serious public health implications. Healthcare (Basel). 2018;7(1). doi:10.3390/healthcare7010001
10. Casement MD, Harrington KM, Miller MW, Resick PA. Associations between Pittsburgh sleep quality index factors and health outcomes in women with posttraumatic stress disorder. Sleep Med. 2012;13(6):752–758. doi:10.1016/j.sleep.2012.02.014
11. Buysse DJ, Reynolds CF
12. Medic G, Wille M, Hemels ME. Short- and long-term health consequences of sleep disruption. Nat Sci Sleep. 2017;9:151–161. doi:10.2147/NSS.S134864
13. Verderio P, Bottelli S, Pizzamiglio S, Ciniselli CM. Developing miRNA signatures: a multivariate prospective. Br J Cancer. 2016;115(1):1–4. doi:10.1038/bjc.2016.164
14. Papadaki C, Stratigos M, Markakis G, et al. Circulating microRNAs in the early prediction of disease recurrence in primary breast cancer. Breast Cancer Res. 2018;20(1):72. doi:10.1186/s13058-018-1001-3
15. Zhou SS, Jin JP, Wang JQ, et al. miRNAS in cardiovascular diseases: potential biomarkers, therapeutic targets and challenges. Acta Pharmacol Sin. 2018;39(7):1073–1084. doi:10.1038/aps.2018.30
16. Mompeon A, Ortega-Paz L, Vidal-Gomez X, et al. Disparate miRNA expression in serum and plasma of patients with acute myocardial infarction: a systematic and paired comparative analysis. Sci Rep. 2020;10(1):5373. doi:10.1038/s41598-020-61507-z
17. Blenkiron C, Goldstein LD, Thorne NP, et al. MicroRNA expression profiling of human breast cancer identifies new markers of tumor subtype. Genome Biol. 2007;8(10):R214. doi:10.1186/gb-2007-8-10-r214
18. Chen X, Ba Y, Ma L, et al. Characterization of microRNAs in serum: a novel class of biomarkers for diagnosis of cancer and other diseases. Cell Res. 2008;18(10):997–1006. doi:10.1038/cr.2008.282
19. Love MI, Huber W, Anders S. Moderated estimation of fold change and dispersion for RNA-seq data with DESeq2. Genome Biol. 2014;15(12):550. doi:10.1186/s13059-014-0550-8
20. Li J, Han X, Wan Y, et al. TAM 2.0: tool for MicroRNA set analysis. Nucleic Acids Res. 2018;46(W1):W180–W185. doi:10.1093/nar/gky509
21. Friedman RC, Farh KK, Burge CB, Bartel DP. Most mammalian mRNAs are conserved targets of microRNAs. Genome Res. 2009;19(1):92–105. doi:10.1101/gr.082701.108
22. Watson NF, Buchwald D, Delrow JJ, et al. Transcriptional signatures of sleep duration discordance in monozygotic twins. Sleep. 2017;40(1). doi:10.1093/sleep/zsw019
23. Barrett T, Wilhite SE, Ledoux P, et al. NCBI GEO: archive for functional genomics data sets–update. Nucleic Acids Res. 2013;41(Database issue):D991–5. doi:10.1093/nar/gks1193
24. Korotkevich G, Sukhov V, Sergushichev A. Fast gene set enrichment analysis. bioRxiv. 2019;060012. doi:10.1101/060012
25. Otasek D, Morris JH, Boucas J, Pico AR, Demchak B. Cytoscape automation: empowering workflow-based network analysis. Genome Biol. 2019;20(1):185. doi:10.1186/s13059-019-1758-4
26. Montojo J, Zuberi K, Rodriguez H, et al. GeneMANIA cytoscape plugin: fast gene function predictions on the desktop. Bioinformatics. 2010;26(22):2927–2928. doi:10.1093/bioinformatics/btq562
27. Santamaria-Martos F, Benitez I, Ortega F, et al. Circulating microRNA profile as a potential biomarker for obstructive sleep apnea diagnosis. Sci Rep. 2019;9(1):13456. doi:10.1038/s41598-019-49940-1
28. Santamaria-Martos F, Benitez I, Zapater A, et al. Identification and validation of circulating miRNAs as endogenous controls in obstructive sleep apnea. PLoS One. 2019;14(3):e0213622. doi:10.1371/journal.pone.0213622
29. Yang X, Niu X, Xiao Y, Lin K, Chen X. MiRNA expression profiles in healthy OSAHS and OSAHS with arterial hypertension: potential diagnostic and early warning markers. Respir Res. 2018;19(1):194. doi:10.1186/s12931-018-0894-9
30. Holm A, Bang-Berthelsen CH, Knudsen S, et al. miRNA profiles in plasma from patients with sleep disorders reveal dysregulation of miRNAs in narcolepsy and other central hypersomnias. Sleep. 2014;37(9):1525–1533. doi:10.5665/sleep.4004
31. Hijmans JG, Levy M, Garcia V, et al. Insufficient sleep is associated with a pro-atherogenic circulating microRNA signature. Exp Physiol. 2019;104(6):975–982. doi:10.1113/EP087469
32. Ozawa PMM, Vieira E, Lemos DS, et al. Identification of miRNAs enriched in extracellular vesicles derived from serum samples of breast cancer patients. Biomolecules. 2020;10(1):150. doi:10.3390/biom10010150
33. Wu X, Li W, Zheng Y. Recent progress on relevant microRNAs in autism spectrum disorders. Int J Mol Sci. 2020;21(16):5904. doi:10.3390/ijms21165904
34. Sonoda T, Matsuzaki J, Yamamoto Y, et al. Serum MicroRNA-based risk prediction for stroke. Stroke. 2019;50(6):1510–1518. doi:10.1161/STROKEAHA.118.023648
35. Qiu G, Zhang XB, Zhang SQ, et al. Dysregulation of MALAT1 and miR-619-5p as a prognostic indicator in advanced colorectal carcinoma. Oncol Lett. 2016;12(6):5036–5042. doi:10.3892/ol.2016.5312
36. Besedovsky L, Lange T, Born J. Sleep and immune function. Pflugers Arch. 2012;463(1):121–137. doi:10.1007/s00424-011-1044-0
37. Grandner MA, Sands-Lincoln MR, Pak VM, Garland SN. Sleep duration, cardiovascular disease, and proinflammatory biomarkers. Nat Sci Sleep. 2013;5:93–107. doi:10.2147/NSS.S31063
38. Kelly RM, Healy U, Sreenan S, McDermott JH, Coogan AN. Clocks in the clinic: circadian rhythms in health and disease. Postgrad Med J. 2018;94(1117):653–658. doi:10.1136/postgradmedj-2018-135719
39. Rijo-Ferreira F, Takahashi JS. Genomics of circadian rhythms in health and disease. Genome Med. 2019;11(1):82. doi:10.1186/s13073-019-0704-0
40. Zhou L, Miller C, Miraglia LJ, et al. A genome-wide microRNA screen identifies the microRNA-183/96/182 cluster as a modulator of circadian rhythms. Proc Natl Acad Sci U S A. 2021;118(1):e2020454118. doi:10.1073/pnas.2020454118
41. Lee Y, Lee J, Kwon I, et al. Coactivation of the CLOCK-BMAL1 complex by CBP mediates resetting of the circadian clock. J Cell Sci. 2010;123(Pt20):3547–3557. doi:10.1242/jcs.070300
42. Miki T, Matsumoto T, Zhao Z, Lee CC. p53 regulates Period2 expression and the circadian clock. Nat Commun. 2013;4(1):2444. doi:10.1038/ncomms3444
43. Ma Z, Jiang W, Zhang EE. Orexin signaling regulates both the hippocampal clock and the circadian oscillation of Alzheimer’s disease-risk genes. Sci Rep. 2016;6(1):36035. doi:10.1038/srep36035
44. Avantaggiati ML, Ogryzko V, Gardner K, Giordano A, Levine AS, Kelly K. Recruitment of p300/CBP in p53-dependent signal pathways. Cell. 1997;89(7):1175–1184. doi:10.1016/s0092-8674(00)80304-9
45. Lill NL, Grossman SR, Ginsberg D, DeCaprio J, Livingston DM. Binding and modulation of p53 by p300/CBP coactivators. Nature. 1997;387(6635):823–827. doi:10.1038/42981
 © 2021 The Author(s). This work is published and licensed by Dove Medical Press Limited. The
full terms of this license are available at https://www.dovepress.com/terms
and incorporate the Creative Commons Attribution
- Non Commercial (unported, 3.0) License.
By accessing the work you hereby accept the Terms. Non-commercial uses of the work are permitted
without any further permission from Dove Medical Press Limited, provided the work is properly
attributed. For permission for commercial use of this work, please see paragraphs 4.2 and 5 of our Terms.
© 2021 The Author(s). This work is published and licensed by Dove Medical Press Limited. The
full terms of this license are available at https://www.dovepress.com/terms
and incorporate the Creative Commons Attribution
- Non Commercial (unported, 3.0) License.
By accessing the work you hereby accept the Terms. Non-commercial uses of the work are permitted
without any further permission from Dove Medical Press Limited, provided the work is properly
attributed. For permission for commercial use of this work, please see paragraphs 4.2 and 5 of our Terms.