Back to Journals » Cancer Management and Research » Volume 13
Circular RNA-Related CeRNA Network and Prognostic Signature for Patients with Osteosarcoma
Authors Man G, Duan A ![]() , Liu W, Cheng J, Liu Y, Song J, Zhou H, Shen K
, Liu W, Cheng J, Liu Y, Song J, Zhou H, Shen K
Received 9 July 2021
Accepted for publication 26 September 2021
Published 1 October 2021 Volume 2021:13 Pages 7527—7541
DOI https://doi.org/10.2147/CMAR.S328559
Checked for plagiarism Yes
Review by Single anonymous peer review
Peer reviewer comments 3
Editor who approved publication: Professor Yong Teng
Gu Man,1,* Ao Duan,2,* Wanshun Liu,2,* Jiangqi Cheng,2 Yu Liu,3 Jiahang Song,4 Haisen Zhou,5 Kai Shen2
1Department of Orthopedics, Nanjing Lishui District Traditional Chinese Medicine Hospital, Nanjing, Jiangsu, People’s Republic of China; 2Department of Orthopedics, The First Affiliated Hospital of Nanjing Medical University, Nanjing, Jiangsu, People’s Republic of China; 3Department of Ophthalmology, The First Affiliated Hospital of Nanjing Medical University, Nanjing, Jiangsu, People’s Republic of China; 4Department of Radiation Oncology, The First Affiliated Hospital of Nanjing Medical University, Nanjing, Jiangsu, People’s Republic of China; 5Department of Pathology, Nanjing Lishui District Traditional Chinese Medicine Hospital, Nanjing, Jiangsu, People’s Republic of China
*These authors contributed equally to this work
Correspondence: Kai Shen
Department of Orthopedics, The First Affiliated Hospital of Nanjing Medical University, Nanjing, Jiangsu, People’s Republic of China
Tel +86-15152639976
Email [email protected]
Haisen Zhou
Department of Pathology, Nanjing Lishui District Traditional Chinese Medicine Hospital, Nanjing, Jiangsu, People’s Republic of China
Tel +86-13915913055
Email [email protected]
Introduction: Osteosarcoma (OSA) is characterized by its relatively high morbidity in children and adolescents. Patients usually have advanced disease at the time of diagnosis, resulting in poor outcomes. This study focused on building a circular RNA-based ceRNA network to develop a reliable model for OSA risk prediction.
Methods: We used the Gene Expression Omnibus (GEO) datasets to explore the expression patterns of circRNA, miRNA, and mRNA in OSA. The prognostic value of circRNA host genes was assessed with data from the Therapeutically Applicable Research to Generate Effective Treatments (TARGET) database using Kaplan–Meier survival analysis. We established a circRNA-related ceRNA network and annotated its biological functions. Next, we developed a prognostic risk signature based on mRNAs extracted from the ceRNA network. We also developed a prognostic model and constructed a nomogram to enhance the prediction of OSA prognosis.
Results: We identified 166 DEcircRNAs, 233 DEmiRNAs, and 1317 DEmRNAs and used them to create a circRNA-related ceRNA network. We then established a prognostic risk model consisting of four genes (MLLT11, TNFRSF11B, SLC7A7, and PARVA). Moreover, we found that inhibition of MLLT11 and SLC7A7 blocked OSA cell proliferation and migration in in vitro experiments.
Conclusion: Our study identifies crucial prognostic genes and provides a circRNA-related ceRNA network for OSA, which will contribute to the elucidation of the molecular mechanisms underlying the oncogenesis and development of OSA.
Keywords: osteosarcoma, ceRNA network, prognosis, nomogram, TARGET
Graphical Abstract:

Introduction
Osteosarcoma (OSA) is a frequently occurring primary bone cancer, with an annual morbidity of ~4.8 per million worldwide. It mainly occurs in childhood and adolescence.1–3 Although great efforts have been made to explore novel treatments for OSA, and current treatments, including radical surgery, radiotherapy, and chemotherapy, have favorable therapeutic outcomes, 5-year survival rates remain stagnant (the survival rate was < 25%).4,5 Many recent articles report that the genesis and prognosis of OSA are closely associated with gene variations.6,7 As a result, the understanding of the molecular mechanisms related to the genesis and development of OSA, as well as identification of the specific targets to create management strategies, is of great importance.
Circular RNAs (circRNAs), the non-coding RNAs (ncRNAs) discovered in recent years, have been found in diverse malignant tumors.8,9 circRNAs exhibit numerous activities, including the regulation of miRNA function by modulating cytoplasmic miRNA levels via the “sponging effect.” Therefore, they can be used as endogenous competitive RNAs (ceRNAs); alternatively, they can upregulate the corresponding nuclear parental genes via RNA polymerase II.9 Due to their abundance and stability, circRNAs have gained widespread attention in the last few years as potential new agents for mediating multiple biological processes.10–12 Accumulating evidence indicates the importance of circRNAs to OSA; for example, circECE1 has been identified as a novel target for OSA therapy due to its regulation of the Warburg effect.13 In addition, Nie and colleagues discovered the potential role of circ-NT5C2 as a new prognostic marker for OSA.14 However, the precise functions of circRNAs in OSA remain unclear.
Moreover, although the TNM staging system has been extensively used in cancer prognosis, patients at the same clinical stage show varied responses and have different survival outcomes due to cancer heterogeneity.15,16 Therefore, the development of superior prognostic signatures is important for more accurate prediction of OSA outcomes. Fortunately, due to the advances made in high-throughput gene sequencing, gene signatures constructed on the basis of changed gene levels are suggested for predicting cancer prognosis.17–19
This study systematically analyzed circRNA, miRNA, and mRNA expression profiles in OSA, and identified a ceRNA network based on differentially expressed genes (DEGs) in paracancerous and OSA tissue. We successfully established a prognostic gene prediction model from the ceRNA network and further explored its related molecular function. In addition, we investigated the roles of myeloid/lymphoid or mixed-lineage leukemia (MLLT11) and solute carrier family 7 member 7 (SLC7A7), two genes of the proposed prognostic signatures, which were identified to positively regulate cell growth and invasion of OSA cell lines.
Materials and Methods
Data Collection
This study collected three data sets (GSE33382, GSE65071, and GSE96964) in the Gene Expression Omnibus (GEO) database (http://www.ncbi.nlm.nih.gov/geo). Each probe was then transformed into the related gene symbol based on platform annotation data. The GSE96964 data set had seven human OSA cell lines (MTX300, U2OS, MG63, HOS, 143B, ZOSM, and ZOS) and one human osteoblast cell line (hFOB1.19). The GSE65071 data set had 20 OSA cases and 15 normal subjects. In the GSE33382 data set, there were 83 OSA samples and three human osteoblast cell lines. Another 88 OSA samples with sufficient clinical data from the Therapeutically Applicable Research to Generate Effective Treatments (TARGET) database (https://ocg.cancer.gov/programs/target) were enrolled in this study. Ethics Committee approval was waived since the data used in this study were extracted from openly accessible databases (TARGET and GEO).
Detection of Differentially Expressed circRNAs, miRNAs, and mRNAs
Differentially expressed circRNAs (DEcircRNAs), miRNAs (DEmiRNAs), and mRNAs (DEmRNAs) were detected in OSA and normal samples using edgeR and Limma packages at the thresholds of p < 0.05 and log [fold change (FC)] > 0.5.
Construction of the ceRNA Network and Function Annotation
To further clarify the potential role of dysregulated circRNAs, three data sets were used to construct ceRNA networks. circRNA data were obtained from the circBase website (http://www.circb.ase.org/). Target miRNAs were predicted using the circBank database (http://www.circbank.cn/index.html). Thereafter, this study selected target miRNAs from DEmiRNAs in GSE65071. Candidate genes were validated using three different datasets, including miRDB, TargetScan, and miRTarBase; then, genes were intersected with the detected DEmRNAs to identify the target DEmRNAs of DEmiRNAs. We then screened the miRNA–mRNA and circRNA–miRNA groups to construct the circRNA–miRNA–mRNA network. Subsequently, to more fully understand the roles of DEmRNAs within the ceRNA network, this study conducted Gene Ontology (GO) and Kyoto Encyclopedia of Genes and Genomes (KEGG) pathway analyses of the identified DEmRNAs using the “clusterProfiler” package in R software. Statistical significance was set at the p < 0.05 level.
Hub Gene Identification
The Search Tool for the Retrieval of Interacting Genes (STRING) database was used in this study to establish a DEmRNA-based PPI network with a threshold interaction score of > 0.9. Cytoscape (v3.7.0; www.cytoscape.org) was then employed to identify hub genes.
Construction and Validation of Prognostic Signatures
We constructed a circRNA prognostic model to investigate the significance of the targeted mRNAs associated with the circRNA-related ceRNA network for predicting the prognosis of OSA. To find possible OSA-related genes, we carried out univariate Cox proportional hazards regression. We then incorporated the significant genes found by the univariate analysis into LASSO regression. Finally, we built a novel ceRNA-based prognostic signature based on multivariate regression. All cases were later classified as low or high risk according to the determined median risk score (⅀exp(mRNA) * β).
Cell Culture and Transfection
Human OSA cell lines, 143B and MG-63, were sourced from the American Type Culture Collection (ATCC, Manassas, VA, USA). The cell lines tested negative for mycoplasma. All cell lines were cultured in Dulbecco’s modified Eagle’s medium (DMEM) supplemented with 1% penicillin/streptomycin (Invitrogen, Carlsbad, CA, USA) and 10% fetal bovine serum (FBS) (Gibco, Grand Island, NY, USA). All cells were incubated in an incubator at 37 °C with 5% CO2 in a humidified atmosphere. The OSA cells were transfected with MLLT11 or SLC7A7 plasmids (GenePharma Co., Shanghai, China) using lipofectamine 3000 (Invitrogen, Carlsbad, CA, USA). MLLT11 and SLC7A7 expressions were detected in the OSA cells 24 h after transfection, and an in vitro cell experiment was carried out after another 24 hours. In addition, OSA cells were transfected with the wild-type vector to create a negative control.
Quantitative Polymerase Chain Reaction
Osteosarcoma cells were washed with PBS and total RNA was isolated using TRIzol (Invitrogen, Carlsbad, California, United States) according to the manufacturer’s instructions. cDNA was reversed from mRNA using the PrimeScript™ RT reagent kit (Takara Bio, Inc., Otsu, Japan) based on the manufacturer’s protocol. Quantitative polymerase chain reaction (qPCR) was performed using the SYBR Ex Taq kit (Takara Bio, Inc.) on a real-time qPCR system (7900HT Fast Real-Time PCR System, Thermo Fisher Scientific, Waltham, MA, USA). qPCR reactions were performed for three independent experiments, and the 2−∆∆Ct method was used for quantification, with the β‐actin gene being the housekeeping gene. The sequences of the primer pairs used in this study are provided in Supplementary Table 1.
Colony Formation Assay
Osteosarcoma cells in different experimental groups were seeded at a density of 300 cells/well into 6-well plates. After 14 days, colonies were twice washed with PBS, fixed with 4% paraformaldehyde (PFA) for 20 min at room temperature, and then dyed with 5 mg/mL of crystal violet (Sigma–Aldrich; Merck KGaA, Darmstadt, Germany) for 30 min. Colonies containing more than 50 cells were randomly selected and then counted manually under a light microscopy. The experiments were replicated at least three times.
Transwell Assay
Transwell assays were performed according to the published protocol to assess cell migration;20 5×10⁴ human OSA cells transfected with Si-MLLT11 or Si-SLC7A7 and their negative controls in 200 µL serum-free DMEM were inoculated into the upper chambers with 8-µm-pore membranes and incubated for 24 h. Then, the cells in the upper chambers were induced to migrate to the bottom chambers containing DMEM supplemented with FBS. After incubation, non-migrated cells in the upper chamber were gently removed with a cotton swab, and those in the lower chamber were fixed in 4% PFA, stained with 0.2% crystal violet at room temperature for 30 min, and counted under a light microscope (Olympus, Tokyo, Japan) at a magnification of 200.
Cell Counting Kit-8 Assay
The Cell Counting Kit-8 (CCK-8) assay was used to analyze OSA cell viability in the different experimental groups. In brief, OSA cells transfected with Si-MLLT11 or Si-SLC7A7 plasmids and control cells were seeded into 96-well plates at an initial density of 2×10⁴ cells/well and cultured in an incubator at 37 °C with 5% CO2. At 24, 48, 72, and 96 h post-transfection, the OSA cells were treated with CCK-8 solutions (MCE, United States) for 1 h according to the manufacturer’s instructions. The absorbance at 450 nm of each well was assessed by microplate reader (Multiskan MK3; Thermo Fisher Scientific).
Statistical Analysis
This study used GraphPad v.8.0 (GraphPad Software, La Jolla, CA, USA) to analyze data. Prognosis was assessed through Kaplan–Meier analysis. Student’s t-test was used to compare the different experimental groups; * p<0.05, ** p< 0.01, *** p< 0.001 indicated statistical significance. Data are displayed as mean ± SD for the three individual assays.
Results
Detection of DEcircRNAs, DEmiRNAs, and DEmRNAs
We adopted the “edgeR” package of R to identify DEcircRNAs at the thresholds of p < 0.05 and |logFC| > 0.5. We identified 166 DEcircRNAs, including 20 showing upregulation and 146 showing downregulation (Figure 1A). By adopting the above thresholds, we identified 233 DEmiRNAs, consisting of 109 with upregulation and 124 with downregulation (Figure 1B), and 1317 DEmRNAs comprising 415 with upregulation and 902 with downregulation (Figure 1C).
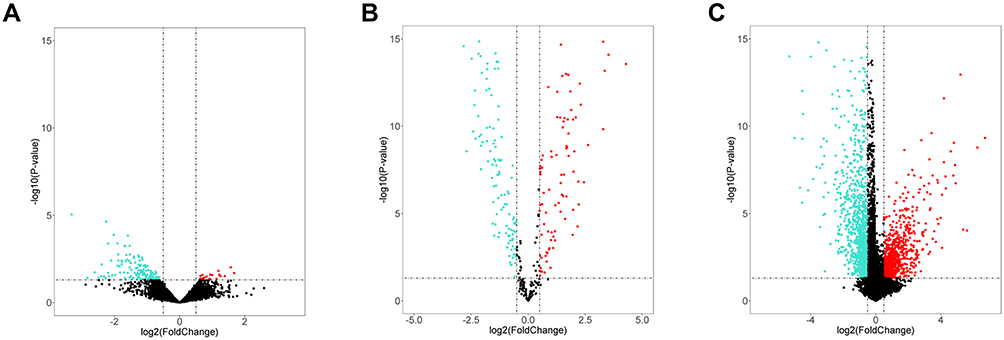 |
Figure 1 Volcano plot of DEcircRNAs, DEmiRNAs, and DEmRNAs. Volcano plot displayed 20 upregulated and 146 downregulated circRNAs (A), 109 upregulated and 124 downregulated miRNAs (B), 415 upregulated and 902 downregulated mRNAs (C). Red and blue indicate up-regulated and down-regulated genes respectively. |
Identification of Candidate circRNAs
First, we obtained the host gene information of the above 166 DEcircRNAs from the circBase database. Then, to identify the possible circRNAs, we detected the corresponding host gene levels from the GSE33382 data set and analyzed their significance in the prognosis of TARGET dataset samples through Kaplan–Meier analysis. The ANXA2 (hsa_circ_0035554 host gene), MAP3K5 (hsa_circ_0009034 host gene), and CTNNA1 (hsa_circ_0007440 and hsa_circ_0003205 host gene) levels were significantly downregulated in the tumor specimen (Figure 2A). As shown in Figure 2B, OSA patients with high expression of ANXA2, MAP3K5, and CTNNA1 had a dramatically better survival outcome than those in the low-expression group. Next, receiver operating characteristic (ROC) curve analysis showed the powerful diagnostic ability of ANXA2, MAP3K5, and CTNNA1. The area under the ROC curve (AUC) values of their five-year survival rates were 0.793, 0.745, and 0.820, respectively (Figure 2C).
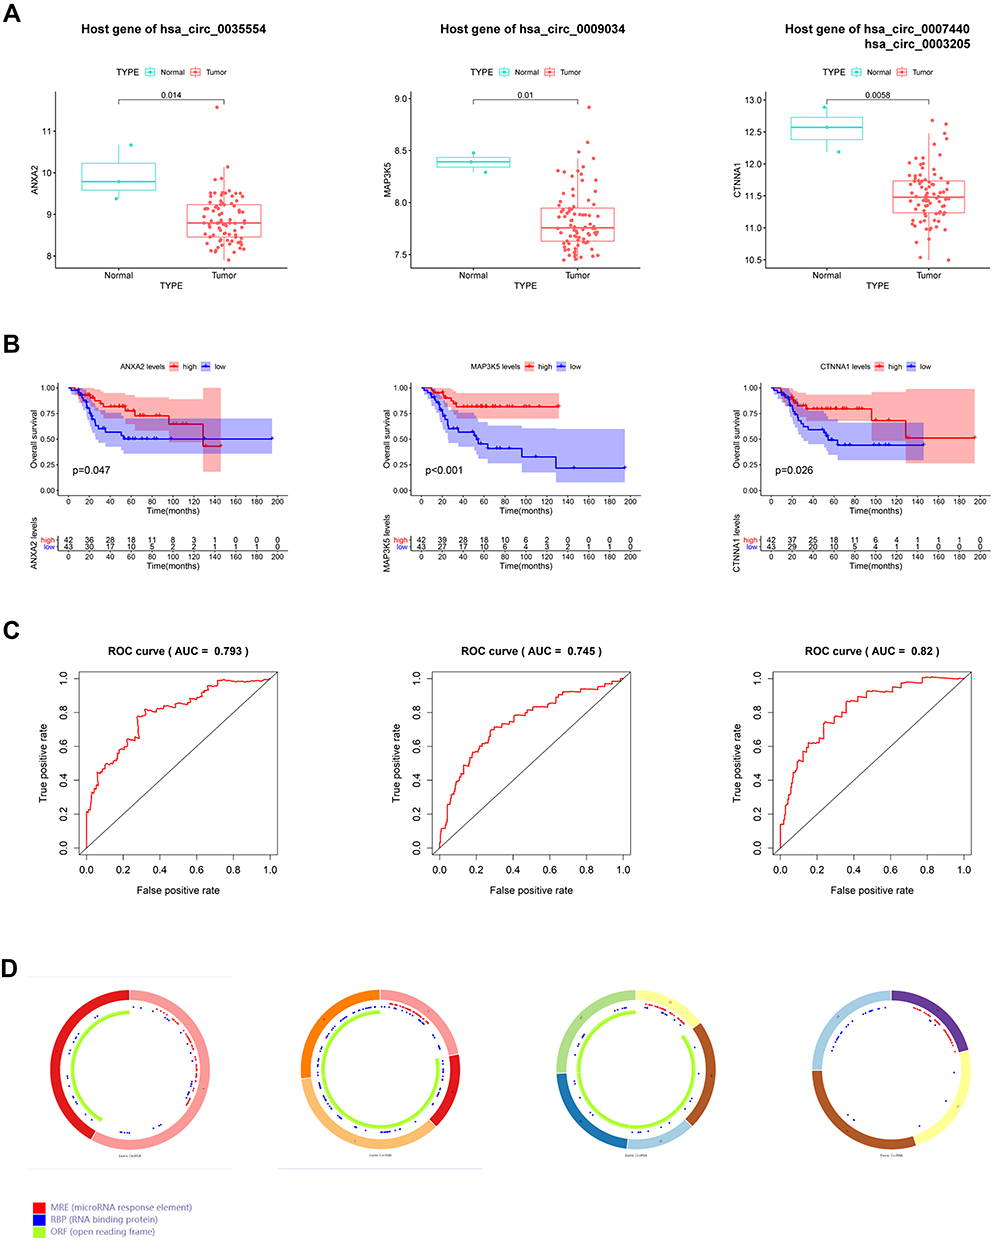 |
Figure 2 Four circular RNA (circRNA) and matched host genes. (A) Levels of hsa_circ_0035554, hsa_circ_0009034, hsa_circ_0007440 and hsa_circ_0003205 host genes. (B) Kaplan–Meier survival analysis on those 4 circRNAs host genes within OSA cases. (C) ROC curve of ANXA2, MAP3K5 and CTNNA1 for predicting 5-years overall survival of OSA patients. (D) Structural patterns of the four circRNAs. |
Based on the above results, we identified four circRNAs (hsa_circ_0035554 host gene, hsa_circ_0009034, hsa_circ_0007440, and hsa_circ_0003205) as candidates for the next analysis. The basic structural pattern of the four circRNAs is shown in Figure 2D.
Validation of Candidate circRNA Expression Levels
We used qPCR to analyze the levels of the four candidate circRNAs within human OSA cell lines (143B and MG63) and human hFOB1.19 osteoblasts. The results indicated that hsa_circ_0035554, hsa_circ_0009034, hsa_circ_0007440, and hsa_circ_0003205 levels were significantly reduced in OSA cells (p < 0.01; Figure 3A–D); these results are in line with the microarray results.
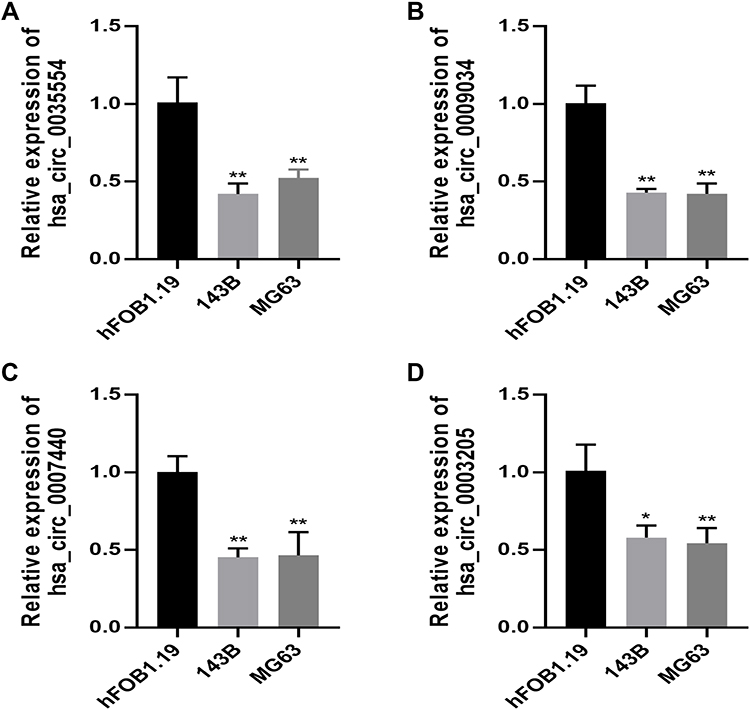 |
Figure 3 RT-qPCR validation of four circRNAs expression in OSA cells. The relative expression level of hsa_circ_0035554 (A), hsa_circ_0009034 (B), hsa_circ_0007440 (C) and hsa_circ_0003205 (D) in hFOB1.19, 143B, and MG63. Data were presented as mean ± SD of three number of replicates. *P<0.05 and **P<0.01. |
Construction of the ceRNA Network
We found 186 target miRNAs of the four circRNAs in the circBank database; they were intersected with 233 DEmiRNAs to obtain 16 miRNAs. The target genes for these 16 miRNAs were then predicted using three different databases, TargetScan, miRDB, and miRTarBase, which further overlapped with 1317 DEmRNAs. As a result, 53 creditable DEmRNAs remained. A circRNA-related ceRNA network was established by combining these results (Figure 4).
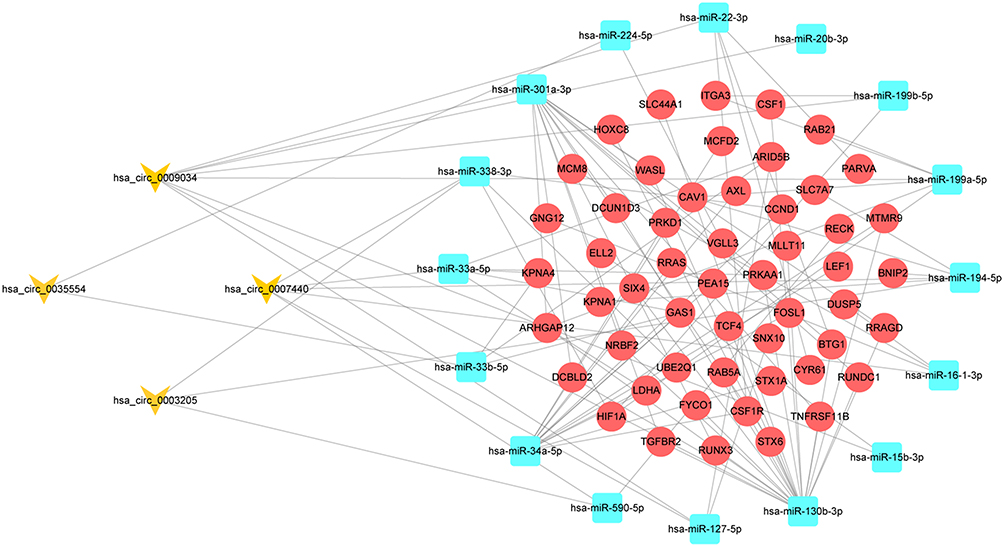 |
Figure 4 The circRNA-miRNA-mRNA regulatory network construction in OSA. |
Functional Enrichment Analysis
Subsequently, GO analysis was performed for the up- and downregulated genes. The mRNAs detected were mostly associated with “autophagy,” “process utilizing autophagic mechanism,” and “response to oxidative stress” (BPs); “RNA nuclear transcription factor complex,” “polymerase II transcription factor complex,” and “transcription factor complex” (CCs); and “GTPase activity,” “GDP binding,” and “transmembrane receptor protein kinase activity” (MFs) (Figure 5A). In terms of KEGG pathway analysis, strong enrichment in the “PI3K-Akt signal transduction pathway,” “Ras signal transduction pathway,” and “MAPK signal transduction pathway” was identified as shown in Figure 5B.
 |
Figure 5 Functional Enrichment Analysis of DEmRNAs. GO analysis (A) KEGG pathway analysis (B) of up- and down-regulated genes. (C) PPI network for DEG. (D) 10 hub genes including CCND1, CAV1, CYR61, FOSL1, RAB5A, AXL, LEF1, RUNX3, HIF1A and WASL regulate DEGs in OSA. |
PPI Network Construction
For better exploration of the associations of the 53 overlapped DEGs, a PPI network was built (Figure 5C) based on the STRING database. The network consisted of 38 edges and 53 nodes. We used Cytoscape to select 10 hub genes according to their corresponding maximal clique centrality (MCC) scores. These hub genes were CCND1, CAV1, CYR61, FOSL1, RAB5A, AXL, LEF1, RUNX3, HIF1A, and WASL (Figure 5D).
Exploration of the ceRNA-Based Prognostic Signature
Fifty-three DEGs were adopted for univariate analysis. Four genes were significantly correlated with overall survival (p < 0.05), which were subsequently included in LASSO and Cox regression (Figure 6A and B). The four genes, MLLT11, tumor necrosis factor receptor superfamily member 11B (TNFRSF11B), SLC7A7, and Parvin alpha (PARVA), were identified to construct a risk prognostic model using multivariate analysis (Figure 6C). The risk score was = [MLLT11 expression × (−0.1692)] + [TNFRSF11B expression × (0.3629)] + [SLC7A7 expression × (−0.7207)] + [PARVA expression × (−0.2896)]. The cases were subdivided into two groups, low- or high-risk, according to whether their calculated risk scores were lower or higher than the median risk score. The predictive power of the prognostic signature for overall survival in training cohorts is shown in Figure 6D and E. Differences in overall survival were statistically significant according to the Kaplan–Meier Log rank test (p < 0.05) (Figure 6F). Furthermore, we calculated the area under the curve (AUC) to demonstrate the accuracy of our proposed model; the AUC values for 1-, 3- and 5-year overall survival were 0.867, 0.955, and 0.943, respectively (Figure 6G). In addition, we assessed the prognostic power in the validation and all cohorts to confirm its reliability (Figure 7A–H).
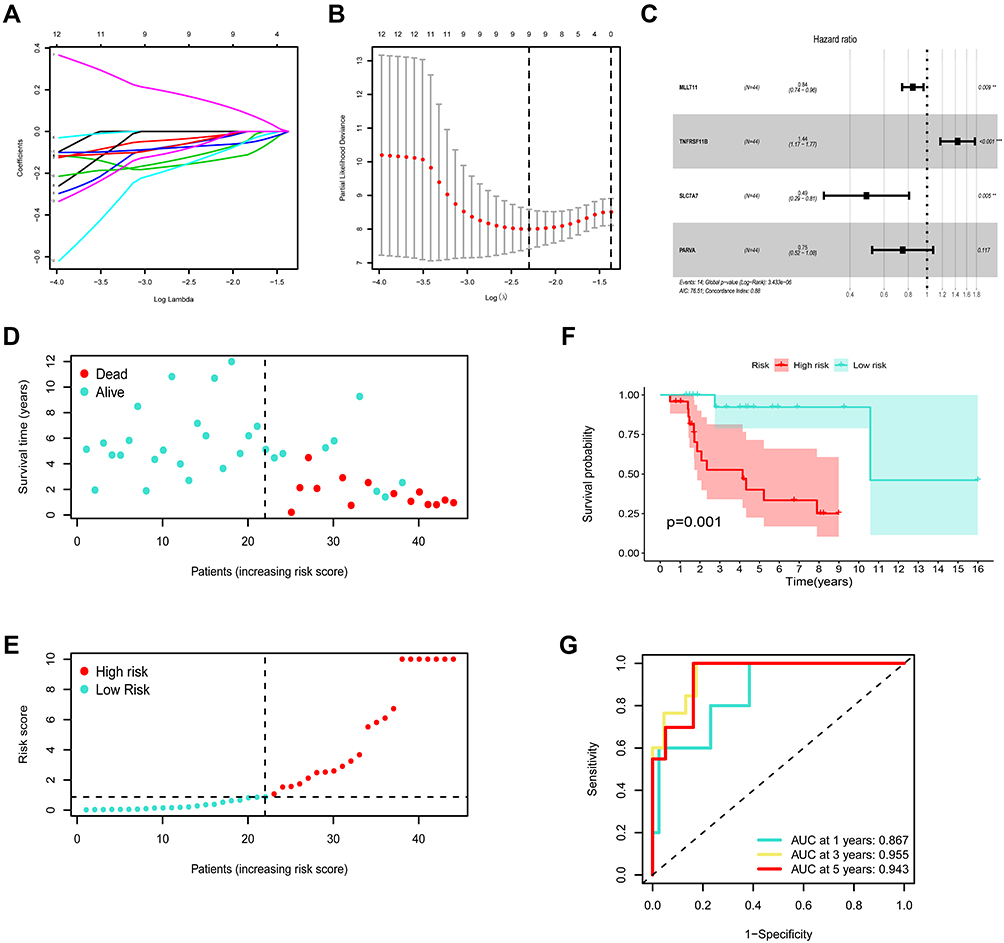 |
Figure 6 Construction of the ceRNA-based risk signature in training set. (A) LASSO coefficient profiles in training cohort. (B) A coefficient profile plot was generated against the log (lambda) sequence. Selection of the optimal parameter (lambda) in the LASSO model for training cohort. (C) Forest plot for the prognostic risk genes. (D) The survival status patients with OSA in training cohort. (E) The risk scores of patients with OSA in training cohort. (F) Kaplan-Meier survival analysis on low- and high-risk patients. (G) ROC curves for 1-, 3-, and 5-year survival. **P<0.01, and ***P<0.001. |
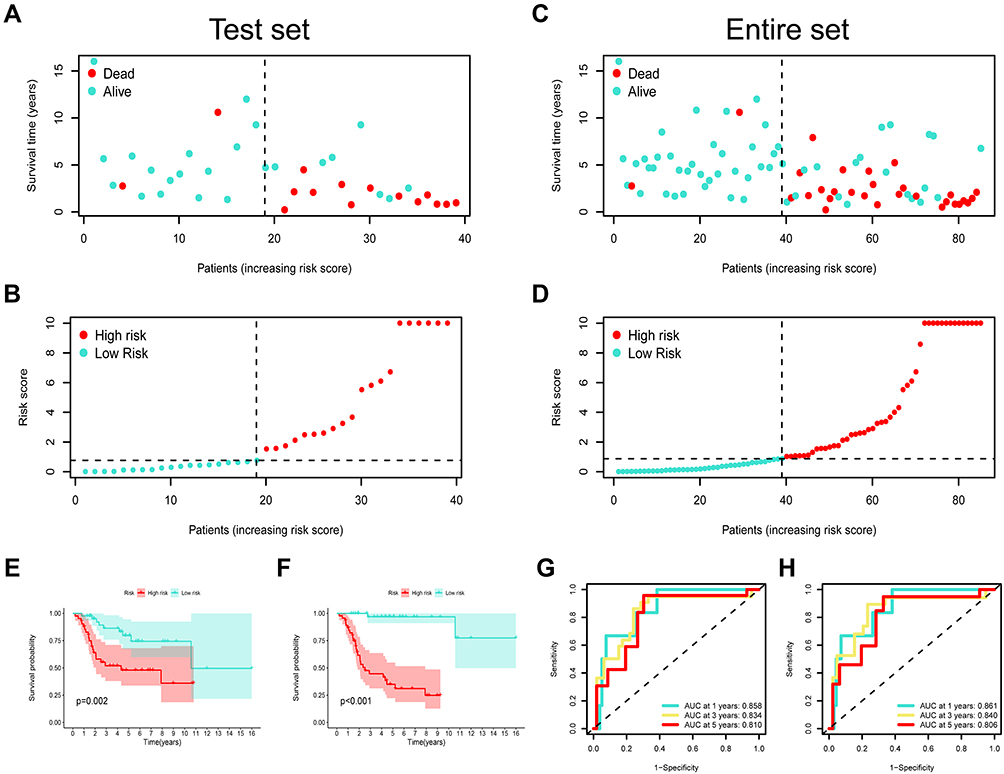 |
Figure 7 Risk model validation in both test set and entire set. (A) The survival status patients with OSA in test cohort. (B) The risk scores of patients with OSA in test cohort. (C) The survival status patients with OSA in entire cohort. (D) The risk scores of patients with OSA in entire cohort. Kaplan–Meier survival curves for OS of test set (E) and entire set (F) samples classified by risk scores. ROC analysis curves for the risk signature in both test set (G) and entire set (H). |
Nomogram Establishment and Validation
Univariate as well as multivariate Cox regression analyses were performed to determine whether our constructed signature could be employed as an independent predictor of OSA. As shown in Figure 8A, univariate analysis identified that the risk score and metastasis were markedly related to overall survival. We then selected the significant factors identified from univariate analysis to perform multivariate Cox regression; the risk score and metastasis were still of statistical significance (p < 0.05; Figure 8B). We built a nomogram to predict the 3- and 5-year overall survival for OSA cases (Figure 8C). As shown by the calibration curves, our nomogram performed favorably in the prediction of 3- and 5-year overall survival (Figure 8D and E).
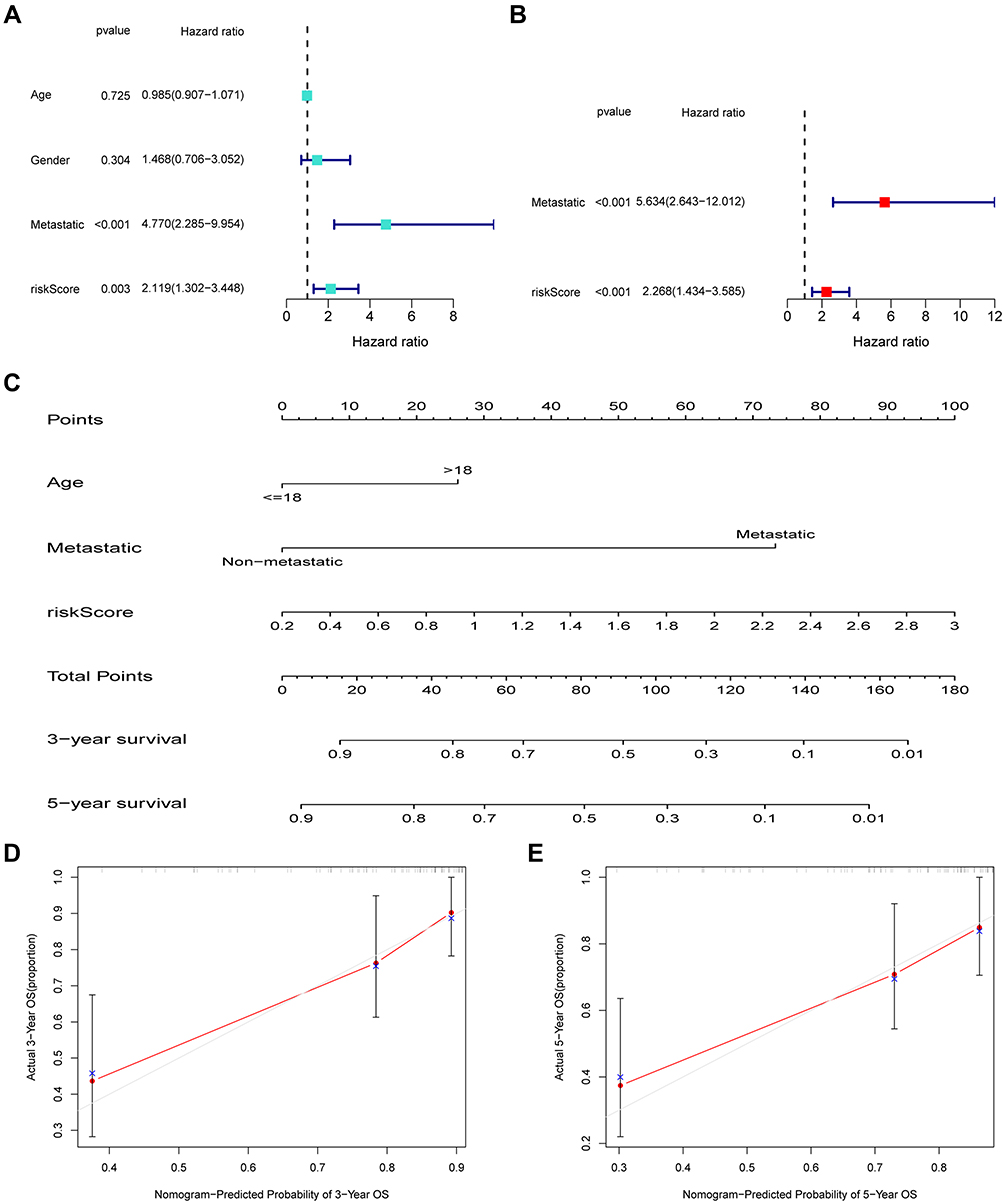 |
Figure 8 Nomogram according to risk score and clinical factors to predict overall survival of patients with OSA. Independent prognostic analysis by univariate (A) and multivariate Cox regression analyses (B). (C) The nomogram includes prognostic model and clinical factors. (D and E) The calibration curve was utilized to confirm the accuracy of predicting 3-, and 5-year OS. |
Downregulation of MLLT11 and SLC7A7 Inhibits the Proliferation and Migration of OSA
Although the roles of NFRSF11B and PARVA in OSA have been explored before, the functions of MLLT11 and SLC7A7 in the progression of OSA have not. Therefore, we selected MLLT11 and SLC7A7 for further verification of our risk model. qPCR results confirmed that the levels of expression of MLLT11 and SLC7A7 were notably increased within OSA cells (143B and MG63) relative to those in control hFOB1.19 cells (Figure 9A). To validate the functions of MLLT11 and SLC7A7 in OSA cells, we downregulated MLLT11 with si-MLLT11 and SLC7A7 with si-SLC7A7 in both 143B and MG63 cells. The expressions of MLLT11 and SLC7A7 were downregulated effectively after transfection (Figure 9B and C). The results of the CCK-8 assay demonstrated that the expression of MLLT11 or SLC7A7 was reduced and the ability of 143B and MG63 to proliferate was attenuated (Figure 9D and E). The same results were also observed for the clone formation assay (Figure 9F and G). Moreover, the migration ability of OSA cells was measured using the transwell assay; inhibition of MLLT11 or SLC7A7 was shown to diminish the migration of the two different OSA cell lines (p < 0.05; Figure 9H and I).
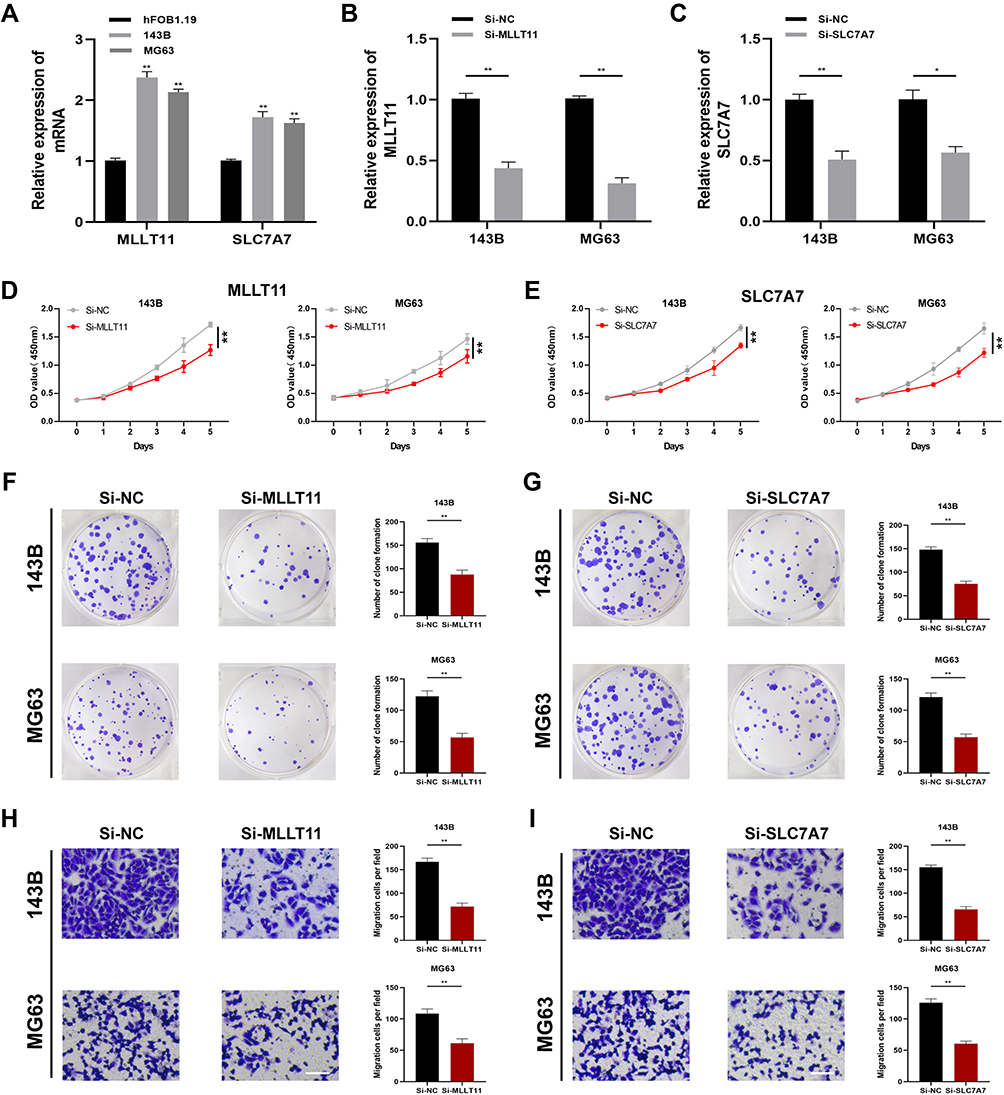 |
Figure 9 Expressions and effects of MLLT11 and SLC7A7 in OSA cells. (A) The expression levels of MLLT11 and SLC7A7 were measured through qPCR. Transfection efficiency of MLLT11 (B) and SLC7A7 (C) in 143B and MG63. MLLT11 inhibition reduced the proliferation of 143B and MG63 (D). SLC7A7 inhibition reduced the proliferation of 143B and MG63 (E). (F and G) Colony formation downregulated by Si-MLLT11 and Si-SLC7A7. (H and I) Ability of migration was inhibited by Si-MLLT11 and Si-SLC7A7. Data were presented as mean ± SD of three number of replicates. *P<0.05 and **P<0.01. |
Discussion
Osteosarcoma is one of the most common and devastating cancers with relatively high morbidity in children and adolescents. It has heterogeneous subtypes characterized by different molecular and clinical features.21 Great achievements have been attained in OSA management, but the overall survival remains unsatisfactory, mainly due to untimely diagnosis. It is urgently necessary to identify the prognostic biomarkers that can provide precise diagnoses and outcome information to OSA patients.
Accumulating evidence indicates that circRNAs have different biological activities, such as alternative mediation, behavior as miRNA sponges, and post-transcription gene regulation. In recent years, with the rapid development of bioinformatic analysis and RNA sequencing technologies, the crucial regulatory role of circRNAs has been explored in a series of tumors.22–24 Chen et al found that circCAMSAP1 expression markedly increased within human OSA cells and tissue, which was closely related to OSA progression.25 More recently, Qiu et al26 established a circRNA–miRNA–mRNA network in OSA, in which four mRNAs were suggested as the overall survival-related mRNAs according to survival analysis. Although several studies have demonstrated the relationship between the ceRNA network and OSA prognosis, the interactions between nodes in the ceRNA network are complicated. Therefore, a precise ceRNA network and a better understanding of the regulatory mechanism of the network may provide new insights for the treatment of OSA. In this study, we constructed a novel circRNA–miRNA–mRNA network and further established a prognostic risk model consisting of four genes based on the ceRNA network to predict clinical outcomes of OSA patients.
Based on the datasets, four candidate DEcircRNAs, hsa_circ_0035554 host gene, hsa_circ_0009034, hsa_circ_0007440, and hsa_circ_0003205, were identified. Survival analysis showed that the downregulation of ANXA2, MAP3K5, and CTNNA1 significantly limited overall survival, indicating that they were involved in the malignant progression of OSA. The downregulated expression of these four circRNAs in the 143B and MG63 cell lines was also confirmed, which suggests that they may be promising diagnostic biomarkers for OSA.
Furthermore, a ceRNA network was established based on the four DEcircRNAs. The biological functions of 53 creditable DEmRNAs were analyzed through GO functional annotation and KEGG pathway enrichment. The results of GO analysis revealed that autophagy participates in the functions of these DEmRNAs. The role of autophagy in the progression of OSA has been extensively studied,27,28 and the ceRNA network we established also confirmed these findings, providing potential guidance for the investigation of OSA. The results of KEGG analysis showed that the DEmRNAs are widely involved in the “PI3K-AKT,” “MAPK,” and “Ras” pathways. These pathways have been confirmed as regulating the progress of OSA,29–32 which indicates that the model we built has research value. In addition, we constructed a PPI network and identified 10 hub genes.
A prognostic risk model comprising four genes was built through the integration of LASSO regression and Cox regression analysis. Kaplan–Meier curve analysis demonstrated that our prognostic model could accurately distinguish between high-risk and low-risk groups. In addition, the AUCs of ROC plots for 1-, 3- and 5-year overall survival were 0.867, 0.955, and 0.943, respectively. The results confirmed that our risk signature possess excellent predictive value.
In the prognostic risk model, four candidate genes (MLLT11, NFRSF11B, SLC7A7, and PARVA) were proposed to be associated with OSA. All four genes have been shown to be involved in the initiation and progress of various cancers. TNFRSF11B, also called osteoprotegerin (OPG), belonging to the TNF receptor family, has been confirmed to participate in OSA growth. Rubio et al found that OPG was upregulated in p53-deficient MSCs and accelerated the development of OSA while p53 was depleted.33 OPG also promotes the migration of OSA cells and facilitates tumor formation by increasing neovascularization through the SDF-1/CXCR4 axis.34 Previous studies have indicated that the functions of PARVA vary in different tumors.35–37 Yu et al demonstrated that PARVA exerts its carcinogenic effects by promoting extracellular matrix (ECM) degradation in tongue squamous carcinoma.38 Pignatelli et al reported that the phosphorylation of PARVA could elevate the activity of Rac1 and mediate the spreading, motility, and matrix degradation of OSA.35 As a prognostic biomarker of various hematological diseases, MLLT11 (also known as AF1Q) has been confirmed to be involved in cancer progression. Xin and colleagues discovered that MLLT11 upregulation predicted the poor prognostic outcome of breast cancer (BC), and that MLLT11 enhanced the proliferation of BC cells by regulating RhoC expression or the MMP pathway.39 As an important amino acid transporter, SLC7A7 transports amino acids across the membrane by binding 4F2hc surface antigen.40 The crucial role of SLC7A7 in cancers has been extensively studied; for instance, SLC7A7 is highly expressed in chemoresistant ovarian cancer and in glioblastoma patients with poor overall survival.41–43 However, the roles of MLLT11 and SLC7A7 in OSA have been unclear.
To confirm whether MLLT11 and SLC7A7 could mediate the progress of OSA, several in vitro studies were conducted. The results showed that the levels of expression of MLLT11 and SLC7A7 were significantly higher in OSA cell lines compared to hFOB1.19. The downregulation of MLLT11 or SLC7A7 could inhibit the proliferation, clone formation, and migration of OSA cells, which indicates that MLLT11 and SLC7A7 could be employed as promising biomarkers for OSA prognosis.
In previous studies, prognostic genes of OSA were predicted only using the GEO database with limited OSA samples. By contrast, we also used the TARGET dataset, which has more OSA samples with available clinical data, thus facilitating the identification of more prognostic genes. Nonetheless, this study also has certain limitations. Firstly, the data we analyzed were obtained from public databases. The clinical accuracy and effectiveness of the signature we constructed need to be further confirmed using more clinical cases. Secondly, the mechanisms related to signature-mediated OSA initiation and progression need further investigation in vivo and in vitro.
Conclusion
In this study, we identified four crucial circRNAs and constructed a circRNA-related ceRNA network involved in OSA, which will contribute to further illustration of the molecular mechanisms underlying the carcinogenesis and progression of the disease. Furthermore, we built an OSA-related risk model, which may enhance the prediction of clinical outcomes for patients with OSA and provide a novel reference for personalized treatment.
Data Sharing Statement
Data analyzed in this article were available in public databases (GEO and TARGET). The results published here are part based upon data generated by the Therapeutically Applicable Research to Generate Effective Treatments (TARGET) (https://ocg.cancer.gov/programs/target) initiative, phs000468. The data used for this analysis are available at https://portal.gdc.cancer.gov/projects. Data analyzed from GEO database can be accessible here: https://www.ncbi.nlm.nih.gov/geo/.
Ethics Statement
Ethics Committee approval was waived since the data used in this study were extracted from openly accessible databases (TARGET and GEO).
Acknowledgments
We acknowledge the contributions of the GEO database and the TARGET database. The present work was performed at Core Facility of the First Affiliated Hospital of Nanjing Medical University, the authors acknowledge the contribution of the Core Facility.
Disclosure
The authors report no conflicts of interest in this work.
References
1. Mirabello L, Zhu B, Koster R, et al. Frequency of pathogenic germline variants in cancer-susceptibility genes in patients with osteosarcoma. JAMA Oncol. 2020;6(5):724–734. doi:10.1001/jamaoncol.2020.0197
2. Matsuoka K, Bakiri L, Wolff LI, et al. Wnt signaling and Loxl2 promote aggressive osteosarcoma. Cell Res. 2020;30(10):885–901. doi:10.1038/s41422-020-0370-1
3. Davis LE, Bolejack V, Ryan CW, et al. Randomized double-blind phase II study of regorafenib in patients with metastatic osteosarcoma. J Clin Oncol. 2019;37(16):1424–1431. doi:10.1200/JCO.18.02374
4. Link MP, Goorin AM, Miser AW, et al. The effect of adjuvant chemotherapy on relapse-free survival in patients with osteosarcoma of the extremity. N Engl J Med. 1986;314(25):1600–1606. doi:10.1056/NEJM198606193142502
5. Meyers PA, Healey JH, Chou AJ, et al. Addition of pamidronate to chemotherapy for the treatment of osteosarcoma. Cancer. 2011;117(8):1736–1744. doi:10.1002/cncr.25744
6. Hasenfratz M, Mellert K, Marienfeld R, et al. Profiling of three H3F3A-mutated and denosumab-treated giant cell tumors of bone points to diverging pathways during progression and malignant transformation. Sci Rep. 2021;11(1):5709. doi:10.1038/s41598-021-85319-x
7. Weglarz-Tomczak E, Rijlaarsdam DJ, Tomczak JM, Brul S. GEM-based metabolic profiling for human bone osteosarcoma under different glucose and glutamine availability. Int J Mol Sci. 2021;22(3):1470. doi:10.3390/ijms22031470
8. Gao X, Xia X, Li F, et al. Circular RNA-encoded oncogenic E-cadherin variant promotes glioblastoma tumorigenicity through activation of EGFR-STAT3 signalling. Nat Cell Biol. 2021;23(3):278–291. doi:10.1038/s41556-021-00639-4
9. Goodall GJ, Wickramasinghe VO. RNA in cancer. Nat Rev Cancer. 2021;21(1):22–36. doi:10.1038/s41568-020-00306-0
10. Tang K, Zhang H, Li Y, Sun Q, Jin H. Circular RNA as a potential biomarker for melanoma: a systematic review. Front Cell Dev Biol. 2021;9:638548. doi:10.3389/fcell.2021.638548
11. Jiang T, Xia Y, Lv J, et al. A novel protein encoded by circMAPK1 inhibits progression of gastric cancer by suppressing activation of MAPK signaling. Mol Cancer. 2021;20(1):66. doi:10.1186/s12943-021-01358-y
12. Wu X, Xiao S, Zhang M, et al. A novel protein encoded by circular SMO RNA is essential for Hedgehog signaling activation and glioblastoma tumorigenicity. Genome Biol. 2021;22(1):33. doi:10.1186/s13059-020-02250-6
13. Shen S, Yao T, Xu Y, Zhang D, Fan S, Ma J. CircECE1 activates energy metabolism in osteosarcoma by stabilizing c-Myc. Mol Cancer. 2020;19(1):151. doi:10.1186/s12943-020-01269-4
14. Nie WB, Zhao LM, Guo R, Wang MX, Ye FG. Circular RNA circ-NT5C2 acts as a potential novel biomarker for prognosis of osteosarcoma. Eur Rev Med Pharmacol Sci. 2021;25(5):2154.
15. Li Y, Shen R, Wang A, et al. Construction of a prognostic immune-related LncRNA risk model for lung adenocarcinoma. Front Cell Dev Biol. 2021;9:648806. doi:10.3389/fcell.2021.648806
16. Tan Y, Sun R, Liu L, et al. Tumor suppressor DRD2 facilitates M1 macrophages and restricts NF-kappaB signaling to trigger pyroptosis in breast cancer. Theranostics. 2021;11(11):5214–5231. doi:10.7150/thno.58322
17. Geng W, Lv Z, Fan J, et al. Identification of the prognostic significance of somatic mutation-derived LncRNA signatures of genomic instability in lung adenocarcinoma. Front Cell Dev Biol. 2021;9:657667. doi:10.3389/fcell.2021.657667
18. Fuca G, Corti F, Ambrosini M, et al. Prognostic impact of early tumor shrinkage and depth of response in patients with microsatellite instability-high metastatic colorectal cancer receiving immune checkpoint inhibitors. J Immunother Cancer. 2021;9(4):e002501. doi:10.1136/jitc-2021-002501
19. Hu Y, Zheng M, Wang S, et al. Identification of a five-gene signature of the RGS gene family with prognostic value in ovarian cancer. Genomics. 2021;113(4):2134–2144. doi:10.1016/j.ygeno.2021.04.012
20. Wu Y, Xie Z, Chen J, et al. Circular RNA circTADA2A promotes osteosarcoma progression and metastasis by sponging miR-203a-3p and regulating CREB3 expression. Mol Cancer. 2019;18(1):73. doi:10.1186/s12943-019-1007-1
21. Gianferante DM, Mirabello L, Savage SA. Germline and somatic genetics of osteosarcoma - connecting aetiology, biology and therapy. Nat Rev Endocrinol. 2017;13(8):480–491. doi:10.1038/nrendo.2017.16
22. Lin Z, Xie X, Lu S, Liu T. Noncoding RNAs in osteosarcoma: implications for drug resistance. Cancer Lett. 2021;504:91–103. doi:10.1016/j.canlet.2021.02.007
23. Liu Y, Wu H, Jing J, Li H, Dong S, Meng Q. Downregulation of hsa_circ_0001836 induces pyroptosis cell death in glioma cells via epigenetically upregulating NLRP1. Front Oncol. 2021;11:622727. doi:10.3389/fonc.2021.622727
24. Chen S, Yang X, Yu C, et al. The potential of circRNA as a novel diagnostic biomarker in cervical cancer. J Oncol. 2021;2021:5529486. doi:10.1155/2021/5529486
25. Chen Z, Xu W, Zhang D, et al. circCAMSAP1 promotes osteosarcoma progression and metastasis by sponging miR-145-5p and regulating FLI1 expression. Mol Ther Nucleic Acids. 2021;23:1120–1135. doi:10.1016/j.omtn.2020.12.013
26. Qiu Y, Pu C, Li Y, Qi B. Construction of a circRNA-miRNA-mRNA network based on competitive endogenous RNA reveals the function of circRNAs in osteosarcoma. Cancer Cell Int. 2020;20:48. doi:10.1186/s12935-020-1134-1
27. Liao YX, Yu HY, Lv JY, et al. Targeting autophagy is a promising therapeutic strategy to overcome chemoresistance and reduce metastasis in osteosarcoma. Int J Oncol. 2019;55(6):1213–1222.
28. Niu J, Yan T, Guo W, Wang W, Zhao Z. Insight into the role of autophagy in osteosarcoma and its therapeutic implication. Front Oncol. 2019;9:1232. doi:10.3389/fonc.2019.01232
29. Zhang J, Yu XH, Yan YG, Wang C, Wang WJ. PI3K/Akt signaling in osteosarcoma. Clin Chim Acta. 2015;444:182–192. doi:10.1016/j.cca.2014.12.041
30. Zhao GS, Gao ZR, Zhang Q, et al. TSSC3 promotes autophagy via inactivating the Src-mediated PI3K/Akt/mTOR pathway to suppress tumorigenesis and metastasis in osteosarcoma, and predicts a favorable prognosis. J Exp Clin Cancer Res. 2018;37(1):188. doi:10.1186/s13046-018-0856-6
31. Xue Y, Zhang G, Zhou S, et al. Iron chelator induces apoptosis in osteosarcoma cells by disrupting intracellular iron homeostasis and activating the MAPK pathway. Int J Mol Sci. 2021;22(13):7168. doi:10.3390/ijms22137168
32. Zhang J, Liu M, Liu W, Wang W. Ras-ERK1/2 signalling promotes the development of osteosarcoma through regulation of H4K12ac through HAT1. Artif Cells Nanomed Biotechnol. 2019;47(1):1207–1215. doi:10.1080/21691401.2019.1593857
33. Rubio R, Gutierrez-Aranda I, Saez-Castillo AI, et al. The differentiation stage of p53-Rb-deficient bone marrow mesenchymal stem cells imposes the phenotype of in vivo sarcoma development. Oncogene. 2013;32(41):4970–4980. doi:10.1038/onc.2012.507
34. Benslimane-Ahmim Z, Pereira J, Lokajczyk A, et al. Osteoprotegerin regulates cancer cell migration through SDF-1/CXCR4 axis and promotes tumour development by increasing neovascularization. Cancer Lett. 2017;395:11–19. doi:10.1016/j.canlet.2017.02.032
35. Pignatelli J, LaLonde SE, LaLonde DP, Clarke D, Turner CE. Actopaxin (alpha-parvin) phosphorylation is required for matrix degradation and cancer cell invasion. J Biol Chem. 2012;287(44):37309–37320. doi:10.1074/jbc.M112.385229
36. Ng L, Tung-Ping Poon R, Yau S, et al. Suppression of actopaxin impairs hepatocellular carcinoma metastasis through modulation of cell migration and invasion. Hepatology. 2013;58(2):667–679. doi:10.1002/hep.26396
37. Velazquez-Torres G, Shoshan E, Ivan C, et al. A-to-I miR-378a-3p editing can prevent melanoma progression via regulation of PARVA expression. Nat Commun. 2018;9(1):461. doi:10.1038/s41467-018-02851-7
38. Yu H, Yu Z, Wang X, Wang D. Circular RNA circCLK3 promotes the progression of tongue squamous cell carcinoma via miR-455-5p/PARVA axis. Biotechnol Appl Biochem. 2021. doi:10.1002/bab.2120
39. Li DQ, Hou YF, Wu J, et al. Gene expression profile analysis of an isogenic tumour metastasis model reveals a functional role for oncogene AF1Q in breast cancer metastasis. Eur J Cancer. 2006;42(18):3274–3286. doi:10.1016/j.ejca.2006.07.008
40. Ji X, Yang X, Wang N, et al. Function of SLC7A7 in T-cell acute lymphoblastic leukemia. Cell Physiol Biochem. 2018;48(2):731–740. doi:10.1159/000491899
41. Fan S, Meng D, Xu T, et al. Overexpression of SLC7A7 predicts poor progression-free and overall survival in patients with glioblastoma. Med Oncol. 2013;30(1):384. doi:10.1007/s12032-012-0384-8
42. Dai W, Feng J, Hu X, et al. SLC7A7 is a prognostic biomarker correlated with immune infiltrates in non-small cell lung cancer. Cancer Cell Int. 2021;21(1):106. doi:10.1186/s12935-021-01781-7
43. Tina E, Prosen S, Lennholm S, Gasparyan G, Lindberg M, Gothlin Eremo A. Expression profile of the amino acid transporters SLC7A5, SLC7A7, SLC7A8 and the enzyme TDO2 in basal cell carcinoma. Br J Dermatol. 2019;180(1):130–140. doi:10.1111/bjd.16905
 © 2021 The Author(s). This work is published and licensed by Dove Medical Press Limited. The
full terms of this license are available at https://www.dovepress.com/terms
and incorporate the Creative Commons Attribution
- Non Commercial (unported, 3.0) License.
By accessing the work you hereby accept the Terms. Non-commercial uses of the work are permitted
without any further permission from Dove Medical Press Limited, provided the work is properly
attributed. For permission for commercial use of this work, please see paragraphs 4.2 and 5 of our Terms.
© 2021 The Author(s). This work is published and licensed by Dove Medical Press Limited. The
full terms of this license are available at https://www.dovepress.com/terms
and incorporate the Creative Commons Attribution
- Non Commercial (unported, 3.0) License.
By accessing the work you hereby accept the Terms. Non-commercial uses of the work are permitted
without any further permission from Dove Medical Press Limited, provided the work is properly
attributed. For permission for commercial use of this work, please see paragraphs 4.2 and 5 of our Terms.