Back to Journals » Cancer Management and Research » Volume 12
circ-NRIP1 Promotes Glycolysis and Tumor Progression by Regulating miR-186-5p/MYH9 Axis in Gastric Cancer
Authors Liu Y, Jiang Y, Xu L, Qu C, Zhang L, Xiao X, Chen W, Li K, Liang Q, Wu H
Received 14 January 2020
Accepted for publication 22 May 2020
Published 17 July 2020 Volume 2020:12 Pages 5945—5956
DOI https://doi.org/10.2147/CMAR.S245941
Checked for plagiarism Yes
Review by Single anonymous peer review
Peer reviewer comments 2
Editor who approved publication: Dr Chien-Feng Li
Yanhong Liu, Yuanyuan Jiang, Lidong Xu, Chongxing Qu, Lei Zhang, Xingguo Xiao, Wenxia Chen, Kunkun Li, Qianping Liang, Huili Wu
Department of Gastroenterology, Zhengzhou Central Hospital Affiliated to Zhengzhou University, Zhengzhou 450007, People’s Republic of China
Correspondence: Huili Wu
Department of Gastroenterology, Zhengzhou Central Hospital Affiliated to Zhengzhou University, No. 124, Funiu Road, Zhongyuan District, Zhengzhou City, Henan Province 450007, People’s Republic of China
Tel +86-0371-67690972
Email [email protected]
Background: Gastric cancer (GC) is a severe threat to human life, with high incidence and mortality. Circular RNAs (circRNAs) play crucial roles in the progression of GC. This study attempted to investigate the potential role of circ-NRIP1 and associated action mechanisms in GC cells.
Methods: The expression of circ-NRIP1 and miR-186-5p was measured by quantitative real-time polymerase chain reaction (qRT-PCR). Cell viability, apoptosis, and migration were assessed by 3-(4,5-dimethyl-2-thiazolyl)-2,5-diphenyl-2-H-tetrazolium bromide (MTT) assay, flow cytometry assay, and transwell assay, respectively. Cellular glycolysis, including cellular glucose uptake, lactate, and ATP/ADP ratios, was also detected by commercial assay kits. The protein levels of hexokinase 2 (HK2) and pyruvate kinase M2 (PKM2) were quantified by Western blot. The relationship between miR-186-5p and circ-NRIP1 or myosin heavy chain 9 (MYH9) was predicted by the online bioinformatics tool, starBase, and verified by dual-luciferase reporter assay. Xenograft tumor model was used to evaluate biological function in vivo.
Results: The expression of circ-NRIP1 was up-regulated in tissues of GC patients and cells, as well as negatively associated with that of miR-186-5p in tissues. circ-NRIP1 knockdown inhibited cell proliferation, migration, and glycolysis, but induced apoptosis in HGC-27 and AGS cells. circ-NRIP1 competitively targeted miR-186-5p, and MYH9 was a target of miR-186-5p. miR-186-5p knockdown inverted the bio-function effects and glycolytic activation from circ-NRIP1 silencing in HGC-27 and AGS cells. Meanwhile, MYH9 overexpression could rescue the effects of miR-186-5p. Besides, miR-186-5p knockdown inverted the expression pattern of si-circ-NRIP1 transfection in GC cells. Additionally, in vivo experiments confirmed that sh-circ-NRIP1 inhibited tumor growth.
Conclusion: circ-NRIP1 accelerated the glycolysis and GC progression by modulating MYH9 via miR-186-5p, suggesting that circ-NRIP1 was a promising biomarker for the treatment of GC.
Keywords: GC, circ-NRIP1, miR-186-5p, glycolysis, MYH9
Introduction
Gastric cancer (GC) is a common malignant tumor, ranking as the second leading cause of cancer-related death around the world.1 Despite advances in therapeutic during past decades, the prognosis for patients with GC is still poor, and the 5-year survival rate is less than 25%.2,3 Including GC, most of the fast-growing malignant cells have active glycolysis and gain more energy through glycolysis. The active glycolysis of malignant tumors plays a large role in the cellular structure and function of glycolysis and the enzymes that catalyze glycolysis. Although plenty of research has illuminated the role of glycolysis in GC pathogenesis, the underlying molecular mechanisms and effective treatment way during GC therapy were mostly deficient.
Currently, circular RNAs (circRNAs) were a series of endogenous noncoding RNAs with covalently closed loop structure.4 A previous study clarified that circRNAs were more stable than linear mRNA, due to it lacked the 5ʹcap and 3ʹ polyadenylated tail.5 There was evidence that circRNAs were specifically expressed in hematological malignancies or developmental-stage, indicating circRNAs had considerable regulatory potential by as post-transcriptional regulators.6,7 Research showed that circRNAs took part in the regulation of diverse cancers progression, including lung adenocarcinoma,8 bladder cancer,9 colon cancer,10 hepatocellular carcinoma,11 and GC.12 Moreover, previous report has shown that circRNAs could exert the function through sponging miRNAs.13 In recent years, studies have shown that circ-NRIP1 could promote the growth and metastasis of GC cells. As reported in Zhang’s research, the pattern of circ-NRIP1 was upregulated in GC tissues and cells, and low expression of which could predict the poor prognosis. Importantly, circNRIP1 could facilitate glucose consumption via sponging the miR149-5p that targeted AKT1.14 However, there are few reports on the mechanism of circ-NRIP1 linking the growth and metastasis of GC. In addition, circ-NRIP1 has not been reported in the regulation of glycolysis in GC.
Furthermore, it is widely accepted that miRNA could negatively regulate gene expression at the post-transcriptional level by degrading or repressing the translation of mRNA.15,16 MiR-186-5p, located on chromosome 1p31.1,17 was decreased in ovarian cancer,18 osteosarcoma17 colon cancer,19 colorectal cancer,20 and GC.21 As a tumor suppressor, it could regulate bio-function effects of GC, including growth and metastasis, with the low-expressed pattern. For instance, circ-PDSS1/miR-186-5p/NEK2 axis could promote the cell cycle, but inhibited apoptosis of GC in vitro.21 However, the potential role of miR-186-5p in GC has not been fully reported.
As is well-known, myosin heavy chain 9 (MYH9) is a subtype of non-muscle myosin heavy chain IIA (NMHCIIA), which causes a complex disease called MYH9-associated disease characterized by a series of different phenotypic characteristics and functions as in regulation of cell cytokinesis, movement, and morphology maintenance.22,23 A foregone study had shown that MYH9 played a key role as a tumor-promoting gene in tumor cell invasion. In specific, let-7f overexpression could inhibit the abilities of invasion and migration in GC cells through directly targeting the tumor metastasis-associated gene MYH9.24 Ye et al showed that the activated SRF/MYH9 axis promoted GC metastasis and was associated with poor prognosis in GC.25
Given the above studies, this study was designed to better understand the molecular mechanism of glycolysis and GC progression, and the relationships among circ-NRIP1, miR-186-5p, and MYH9 in GC.
Materials and Methods
Samples Collection
This study acquired the authorization of the Ethics Committee of Zhengzhou Central Hospital Affiliated to Zhengzhou University. 30 GC tissues and paired adjacent parts from GC patients were collected from Zhengzhou Central Hospital Affiliated to Zhengzhou University. All tissue samples were collected and stored at −80°C conditions. Written informed consent was obtained from each patient. All procedures performed in studies involving human participants were conducted in accordance with the Declaration of Helsinki.
Cell Lines and Cell Culture
The human gastric mucosa cell line (GES-1) and GC cell lines (HGC-27, AGS) were purchased from Shanghai Innovation Biotechnology Co., Ltd. (Shanghai, China). All cells were cultured in 90% Dulbecco’s modified Eagle’s medium (DMEM; Gibco, Grand Island, NY, USA) with 10% fetal Bovine Serum (FBS; Gibco) at 37°C condition with 5% CO2.
Quantitative Real-Time Polymerase Chain Reaction (qRT-PCR)
Total RNA was separated from GC tissues and cells using Total RNA Extractor (Sangon Biotech, Shanghai, China). Then the HiScript III First Strand cDNA Synthesis Kit (Vazyme, Nanjing, China) or Mir-X™ miRNA First Strand Synthesis Kit (Clontech, Mountain View, CA, USA) was used to assemble complementary DNA (cDNA) for circ-NRIP1 and MYH9 or miR-186-5p. Next, qRT-PCR was performed using AceQ Universal SYBR qPCR Master Mix (Vazyme) on CFX Connect system (Bio-Rad, Hercules, CA, USA). The fold-change of expression was calculated using the 2−ΔΔCt method and normalized by glyceraldehyde-3-phosphate dehydrogenase (GAPDH) or small nuclear RNA U6. The used primers were listed as below: circ-NRIP1 forward (5ʹ-GCTGGGCATAATGAAGAGGA-3ʹ), circ-NRIP1 reverse (5ʹ-CAAAGAGGCCAGTAATGTGCTATC-3ʹ), miR-186-5p forward (5ʹ-CCGCGCGCAAAGAATTCTCCTTT-3ʹ), miR-186-5p reverse (5ʹ-ATCCAGTGCAGGGTCCGAGG-3ʹ), MYH9 forward (5ʹ-AGAGCTCACGTGCCTCAACG-3ʹ), MYH9 reverse (5ʹ-TGACCACACAGAACAGGCCTG-3ʹ), GAPDH forward (5ʹ-ACCACAGTCCATGCCATCAC-3ʹ), GAPDH reverse (5ʹ-TCCACCACCCTGTTGCTGTA-3ʹ), U6 forward (5ʹ-GCUUCGGCAGCACAUAUACUAAAAU-3ʹ), U6 reverse (5ʹ-CGCUUCACGAAUUUGCGUGUCAU-3ʹ).
Cell Transfection
For circ-NRIP1 downregulation, small interfering RNA (siRNA) against circ-NRIP1 (si-circ-NRIP1) and its negative control (si-NC) was constructed by Genepharma (Shanghai, China). For circ-NRIP1 upregulation, circ-NRIP1 sequence was amplified by PCR and inserted into pcDNA vector (Invitrogen, Carlsbad, CA, USA) to generate fusion plasmids, named as circ-NRIP1, pcDNA empty vector (vector) as the control. For miR-186-5p enrichment or inhibition, miR-186-5p mimics (miR-186-5p), miR-186-5p inhibitor (anti-miR-186-5p) and its own negative control (miR-NC and anti-miR-NC) were purchased from Ribobio (Guangzhou, China). For MYH9 overexpression, MYH9 sequence was amplified by PCR and inserted into pcDNA vector (Invitrogen) to generate fusion plasmids, namely MYH9, pcDNA empty vector (vector) as the control. All items were introduced into HGC-27 and AGS cells using Lipofectamine 2000 (Invitrogen). At 48 h post-transfection, HGC-27 and AGS cells were collected and used for further analyses. The used sequence was listed as below: si-circ-NRIP1 sequence (3ʹ-CTAGGGAATCCAAACGTTCA-5ʹ).
3-(4, 5-Dimethyl-2-Thiazolyl)-2, 5-Diphenyl-2-H-Tetrazolium Bromide (MTT) Assay
The proliferation capacity of GC cells was evaluated through MTT assay. Briefly, transfected GC cells (3×10³/well) were seeded into 96-well plates (Corning Inc., Corning, NY, USA) and maintained in an incubator with 5% CO2 at 37°C for 24 h, 48 h, and 72 h. Then, MTT (20 μL) (Sigma, St Louis, MO, USA) was replenished to each well and kept for 4 h. Following this, the supernatant of each well was discarded, and DMSO (150 μL, Sigma) was added for the dissolution of the formazan crystals. In the end, the Microplate Absorbance Reader (Thermo Fisher Scientific, Waltham, MA, USA) was executed for the assessment of the optical density value at 490 nm.
Flow Cytometry Assay
Annexin V-FITC/PI Apoptosis Detection Kit (Vazyme) was used for flow cytometry assay. In brief, HGC-27 and AGS cells with different transfection were seeded into 6-well plates, treated with 0.25% trypsin and washed with pre-cooled phosphate buffer saline (PBS). Thereafter, cells (2×10⁵) were resuspended by 100 µL 1 × binding buffer and then incubated by 5 µL Annexin V- fluorescein isothiocyanate (FITC) and propidium iodide (PI) staining solution for 10 min at room temperature without light. Finally, the apoptotic cells were analyzed using flow cytometer (BD Biosciences, San Jose, CA, USA).
Transwell Assay
The rate of cell migration was investigated by transwell chamber (Corning Inc.). The lower chamber was added with DMEM medium with 10% FBS, while the transfected HGC-27 and AGS cells were injected into the upper one with 100 μL of serum-free medium, and the whole steps were carried out according to the manufacturer’s instructions. In the end, paraformaldehyde (PFA; Sigma) was used to attach cells located on lower surface of the upper chamber. Cells were analyzed under a microscope after staining with crystal violet.
Glucose Consumption and Lactate Production Detection
Glucose uptake assays were performed according to the Glucose Test Kit (BioVision, Milpitas, CA, USA). HGC-27 and AGS cells were seeded in a 6-well plate at a density of 106 per well at 37°C for 48 hours, and the collected medium at 0 hour was used as a standard control glucose concentration. The calculation formula is as follows: glucose uptake = (standard control concentration -reading concentration)/protein concentration. The amount of extracellular lactic acid production in the cell culture medium was measured according to the instructions of the lactic acid assay kit (BioVision). This value is normalized to the protein concentration.
Detection of ATP/ADP Ratio
The Apo SENSOR ADP/ATP Ratio Assay Kit (BioVision) was used to measure intracellular ATP/ADP ratios. Spectromax (Molecular Devices, Sunnyvale, CA, USA) was used for luminescence measurements. Cells at density of 1×10⁴ were seeded onto a luminometer plate and then nucleotide release buffer was added. ATP-monitoring enzyme (1 μL) was added, followed by reading the samples at 1 and 10 minutes, respectively, and finally adding ADP-converting enzyme, and reading the sample values; The calculation method could be found in the previous article.26
Western Blot
Western blot analysis was executed in agreement with the methods mentioned previously.27 Briefly, the segregated proteins were blotted on the membranes (Polyvinylidene Fluoride; Millipore, Bedford, MA, USA). Then, the membranes were incubated with unique primary antibodies overnight at 4°C after blocking for 1 h. At the next day, the corresponding secondary antibody was used for the combination with the primary antibody, and the combined signals were appeared via adding the reagents of an enhanced chemiluminescence kit (Millipore). The primary antibodies against HK2 (hexokinase 2, ab209847, 1:1000, Abcam), PKM2 (pyruvate kinase M2, ab137852, 1:1000, Abcam), MYH9 (ab75590, 1:1000, Abcam), GAPDH (ab9485, 1:2500, Abcam) and goat anti-rabbit secondary antibodies (ab205718, 1:5000, Abcam) were used in this study.
Bioinformatics Analysis and Dual-Luciferase Reporter Assay
The online bioinformatics tool starBase v2.0 (http://starbase.sysu.edu.cn/starbase2/) was adapted to predict the potential target genes and conclude the specific binding sites. The relationship between miR-186-5p and circ-NRIP1 or MYH9 was verified by dual-reporter assay. In brief, the sequences of circ-NRIP1 wild type (WT) containing the binding sites with miR-186-5p and corresponding circ-NRIP1 mutant (MUT) sequences were amplified and cloned into the pRL-CMV vector (Promega, Madison, WI, USA), named as WT-circ-NRIP1 and MUT-circ-NRIP1. Then, WT-circ-NRIP1 and MUT-circ-NRIP1 were introduced into HGC-27 and AGS cells together with miR-186-5p or miR-NC, respectively. After 48 h, the luciferase activity was detected using the Dual-Luciferase Reporter Assay Kit (Promega). In a similar way, WT-MYH9 and MUT-MYH9 were also constructed and used for luciferase activity analysis.
Xenograft Tumor Model
A total of 6 BALB/c male nude mice, purchased from Charles River Laboratories (Beijing, China), were randomly divided into two groups (n=3 per group). 2×10⁶ AGS cells stably transfected with sh-circ-NRIP1 were injected subcutaneously into the left hind back of nude mice, while the control group received an equal amount of sh-NC. The tumor volume was measured using a caliper every 3-day. Mice were euthanized on the 22nd day under anesthesia to separate the tumor tissues for tumor weighing, qRT-PCR, and Western blot assay. The experiments were approved by the Experimental Animal Ethics Committee of Zhengzhou Central Hospital Affiliated to Zhengzhou University and were performed in accordance with the institutional guide for the care and use of laboratory animals.
Statistical Analysis
Data were collected from at least 3 independent experiments, processed by GraphPad Prism 7.0 (GraphPad software Inc., San Die, CA, USA), and exhibited as mean ± standard deviation (SD). The difference analyses between groups were performed using one-way analysis of variance (ANOVA) or Student’s t-test. P value < 0.05 was regarded as statistically significant.
Results
The Role of circ-NRIP1 and miR-186-5p in GC
To verify the role of circ-NRIP1 or miR-186-5p in GC tumors, according to the data from clinical samples, we detected higher circ-NRIP1 but lowered miR-186-5p expression in 30 GC samples relative to adjacent normal samples via qRT-PCR (Figure 1A and C). We next confirmed the higher level of circ-NRIP1 but lower level of miR-186-5p in the HGC-27 and AGS cells (Figure 1B and D). Afterward, we also confirmed that the expression of circ-NRIP1 negatively correlated with that of miR-186-5p in GC tissues (Figure 1E).
 |
Figure 1 The role of circ-NRIP1 and miR-186-5p in GC. (A, C) qRT-PCR was used to detect the expression of circ-NRIP1 (A) or miR-186-5p (C) in tissues from 30 patients with GC compared with the adjacent parts. (B, D) The expression of circ-NRIP1 (B) or miR-186-5p (D) in human gastric mucosa cell line (GES-1) and GC cells (HGC-27, AGS) was measured by qRT-PCR assay. (E) A correlation between the expression of miR-186-5p and circ-NRIP1 was explored. *P<0.05. |
Knockdown of circ-NRIP1 Inhibited Cell Proliferation, Migration, and Glycolysis, but Promoted Apoptosis in GC
To further investigate the effects of circ-NRIP1, we conducted a loss of function experiments, and the expression of circ-NRIP1 was weakened in two different GC cells (Figure 2A). To further evaluate whether the circ-NRIP1 phenotype could affect the proliferation, the MTT assay showed that circ-NRIP1 knockdown significantly suppressed cell proliferation, compared with negative controls (Figure 2B and C). Besides, the apoptosis ability was assessed by the flow cytometry analysis. It was found that apoptosis assays also indicated that si-circ-NRIP1 could promote the apoptosis in GC cells (Figure 2D). Intriguingly, knockdown of circ-NRIP1 significantly suppressed the migratory ability of HGC-27 and AGS cells (Figure 2E). Blocked expression of circ-NRIP1 of HGC-27 and AGS cells inhibited cellular glucose consumption (Figure 2F), lactate consumption (Figure 2G), and ATP/ADP ratios (Figure 2H). We then revealed that the protein level of glycolytic targets proteins, including HK2 and PKM2, of which were downregulated in HGC-27 and AGS cells with downregulation of circ-NRIP1 (Figure 2I–J). Besides, Western blot results also suggested that the protein levels of HK2 and PKM2were increased caused by the upregulation of circ-NRIP1 (Figure S1)
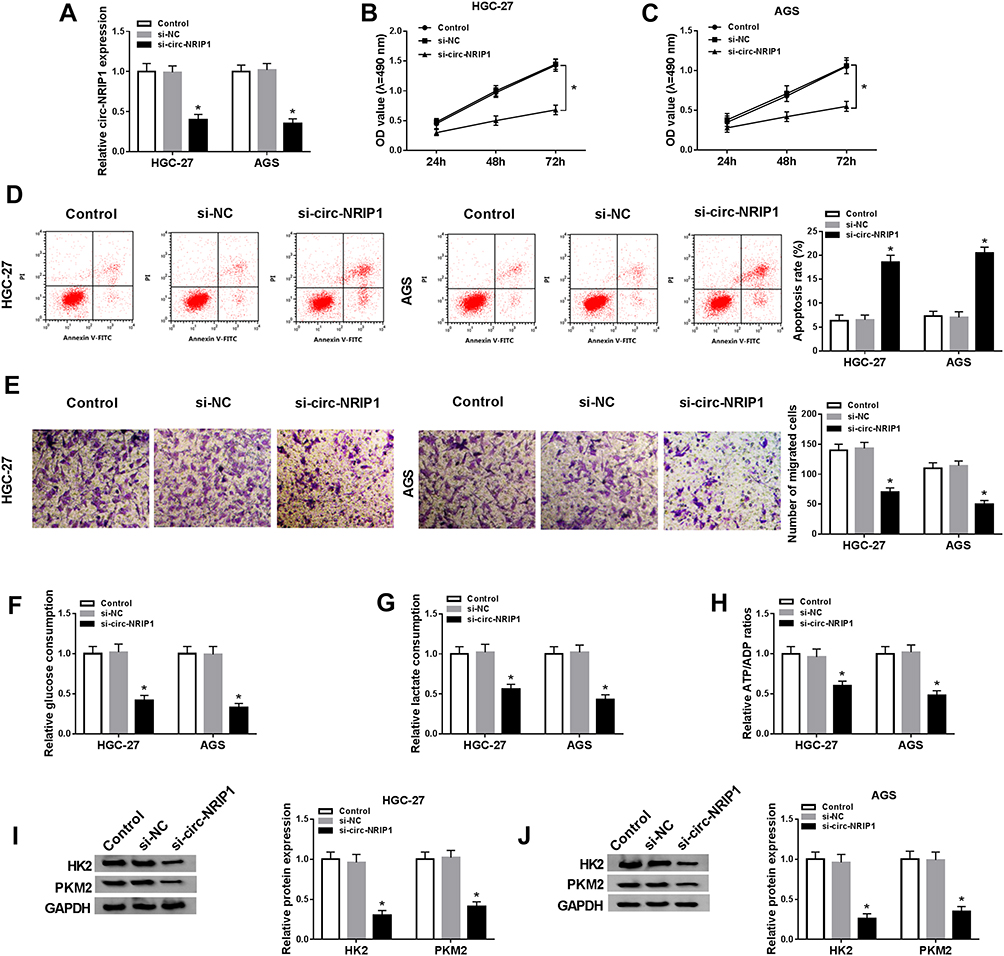 |
Figure 2 Knockdown of circ-NRIP1 inhibited cell proliferation, migration, and glycolysis, but promoted apoptosis in GC. The GC cells were transfected with si-NC or si-circ-NRIP1. By the loss of function experiments, the bio-function effects and glycolytic activities of circ-NRIP1 were performed. (A) The efficiency of circ-NRIP1 knockdown was confirmed. (B–C) The cell viability at determined times (24 h, 48 h, 72 h) was analyzed by MTT assay in HGC-27 and AGS cells. (D) The rate of apoptosis was measured by flow cytometry assay. (E) The cell migration was evaluated by transwell assay. (F–H) The glucose consumption assay (F), lactate assumption (G), and ATP/ADP (H) ratio of HGC-27 and AGS cells stably knockdown of circ-NRIP1. (I–J) HK2 (I) and PKM2 (J) expression levels were downregulated by si-circ-NRIP1 in Western blotting assays in HGC-27 and AGS cells.*P<0.05. |
circ-NRIP1 Directly Interacted with miR-186-5p, and miR-186-5p Knockdown Restored the Function of Silencing of Circ-NRIP1 on Proliferation, Apoptosis, Migration, Glycolytic Rate-Limiting Enzyme HK2, PFKP Content and Activities
To further clarify the precise regulation mechanism of circ-NRIP1, binding prediction was explored by starBase v2.0 software online (Figure 3A) and confirmed by dual-luciferase reporter assay (Figure 3B and C). The results showed that the fluorescence intensity was weaker in the group co-transfected with miR-186-5p and WT-circ-NRIP1 compared with the control group; however, fluorescence density did not change in the group co-transfected with miR-186-5p and MUT-circ-NRIP1 (Figure 3B and C). What is more, we conducted loss and gain of function experiments, as shown in Figure 3D and E, the expression of circ-NRIP1 was nearly a half decrease after circ-NRIP1 knockdown in cells, while around the four-fold high expression of circ-NRIP1 after overexpression, compared with its own controls (Figure 3D). Interestingly, the expression of miR-186-5p witnessed nearly one and a half-fold high pattern after circ-NRIP1 knockdown in HGC-27 and AGS cells, with a low half expression of miR-186-5p after circ-NRIP1 overexpression, compared corresponding controls (Figure 3E). To further investigate whether circ-NRIP1 could function through targeting miR-186-5p, anti-miR-NC or anti-miR-186-5p was transfected into circ-NRIP1 stable knockdown cells. The establishment of stably transfected cells is described in detail in Materials and methods section. In the si-circ-NRIP1+anti-miR-186-5p group, miR-186-5p expression level was obviously decreased compared with the si-circ-NRIP1+anti-miR-NC group (Figure 3F). The results in Figure 3G–J showed that the attenuated proliferation and migration (Figure 3G and H), and enhanced apoptosis (Figure 3I) induced by si-circ-NRIP1 could be corrected through miR-186-5p knockdown; also, a low expression upon HK2 and PKM2 caused by si-circ-NRIP1 could be facilitated by miR-186-5p knockdown (Figure 3N–O). As for the glycolysis process, circ-NRIP1 knockdown inhibited glucose uptake, lactate, and ATP consumption, whereas anti-miR-186-5p co-transfection rescued the glucose uptake (Figure 3K), lactate (Figure 3L), and ATP (Figure 3M) production.
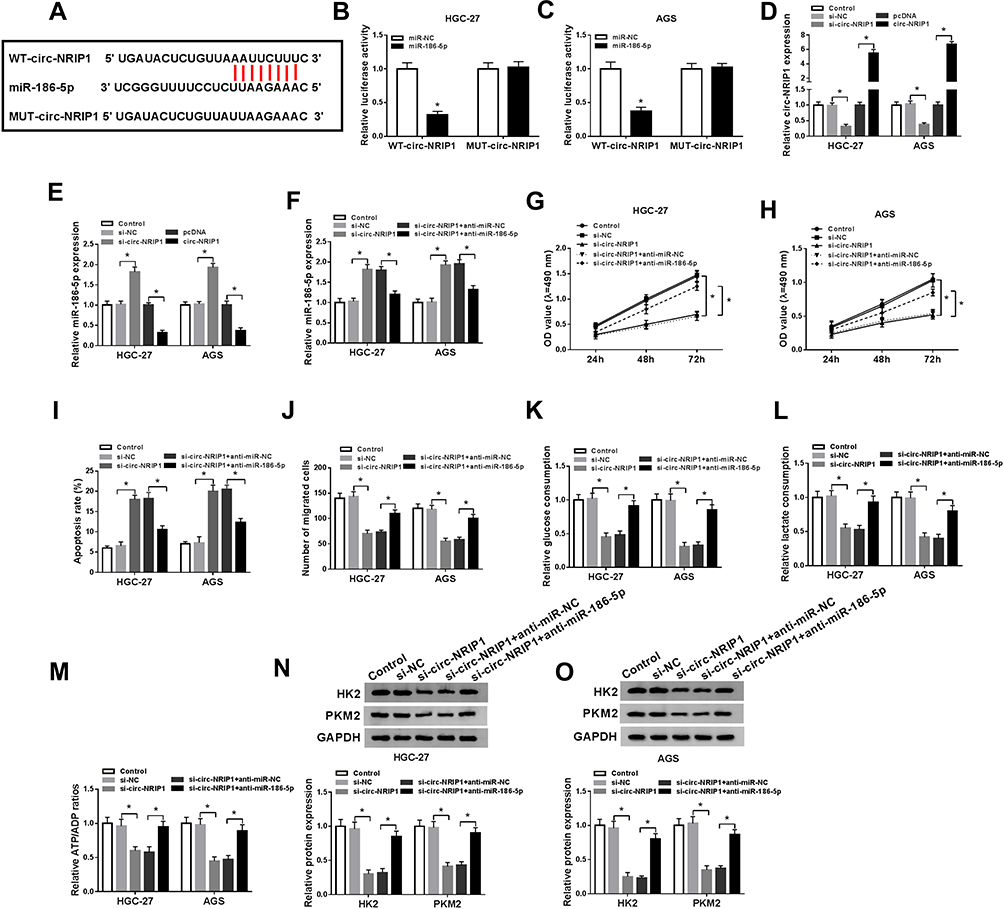 |
Figure 3 circ-NRIP1 directly interacted with miR-186-5p, and miR-186-5p knockdown restored the function of silencing of circ-NRIP1 on proliferation, apoptosis, migration, glycolytic rate-limiting enzyme HK2, PFKP content, and activities. (A) The putative binding sites between miR-186-5p and circ-NRIP1 were predicted by starBase. (B–C) The predicted sites were identified by dual-luciferase reporter assay. (D) The expression of circ-NRIP1 in cells was detected by qRT-PCR after circ-NRIP1 knockdown or overexpression. (E) The expression of miR-186-5p in cells was detected by qRT-PCR after circ-NRIP1 knockdown or overexpression. (F) The expression of miR-186-5p was explored by qRT-PCR after cells co-transfected with si-circ-NRIP1 and anti-miR-186-5p. (G–J) Function assays, namely MTT assessment (G), flow cytometry assay (I), transwell assay (J), were conducted to analyze the cell proliferation, apoptosis, migration individually. Down-expression of miR-186-5p partly reversed si-circ-NRIP1-induced glucose consumption (K), lactate consumption (L), cellular ATP/ADP (M) ratio in MGC-27 and AGS cells. (N–O) PKM2 and HK2 enzyme activities were restored by anti-miR-186-5p introduction. *P<0.05. |
MYH9Was a Target for miR-186-5p
To further clarify the precise regulation mechanism of miR-186-5p to MYH9, the starBase predicted the binding sequences between miR-186-5p and MYH9 (Figure 4A), dual-luciferase reporter assay results showed that the fluorescence intensity was weaker in cells co-transfected with miR-186-5p and MYH9-3ʹUTR-WT, while fluorescence density did not change in cells co-transfected with miR-186-5p and MYH9-3ʹUTR-MUT (Figure 4B–C). The results confirmed that MYH9 was the direct target of miR-186-5p in GC cells. Besides, the expression of miR-186-5p in HGC-27 and AGS cells was decreased by anti-miR-186-5p transfection or increased by miR-186-5p transfection (Figure 4D). Subsequently, the protein pattern of MYH9 was promoted in the cells transfected with anti-miR-186-5p, or blocked in cells transfected with miR-186-5p (Figure 4E). Also, we explored the level of MYH9 in GC tissues, and the data showed significant improvement of MYH9 in GC tissues, at mRNA (Figure 4F) or protein (Figure 4G) level. In line with this, a promotion of MYH9 either mRNA (Figure 4H) or proteins pattern (Figure 4I) could be seen in the HGC-27 and AGS cells. Additionally, the relative MYH9 expression kept a reversed correlation with that of miR-186-5p in GC tissues (Figure 4J).
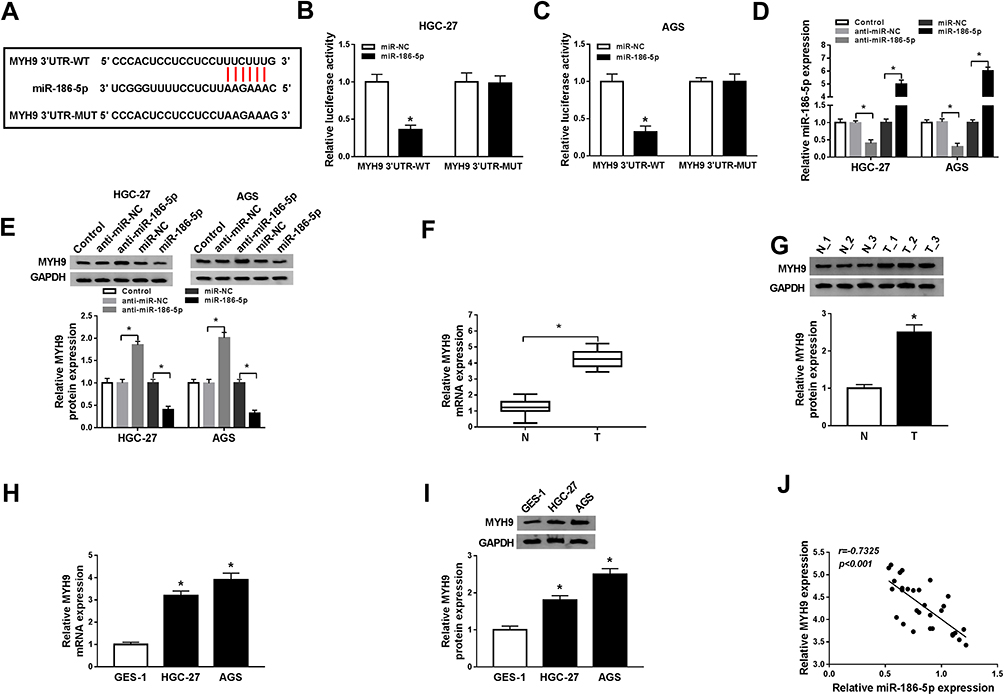 |
Figure 4 miR-186-5p was a target forMYH9. (A) MYH9 was predicted by starBase as a potential target for miR-186-5p. (B–C) Dual-luciferase reporter assay was conducted to verify the interaction between miR-186-5p and MYH9. (D) The efficiency of miR-186-5p knockdown or overexpression was shown. (E) The expression of MYH9 after the loss-and gain- experiment was measured in GC cells using Western blot. (F–G) The expression of MYH9 on GC tissues was explored at mRNA (F) and protein (G) level. (H–I) Verification of MYH9 expression pattern in GC tissues or cells. (J) A correlation analysis between MYH9 and miR-186-5p was repressed. *P<0.05. |
Upregulation of MYH9 Inverted the Effects of miR-186-5p
To figure out whether MYH9 worked as downstream of miR-186-5p, the experimental groups were designed, namely control, miR-NC, miR-186-5p, miR-186-5p+pcDNA, miR-186-5p+MYH9. Obviously, MYH9 transfection recovered the protein expression of MYH9 in miR-186-5p-knocked down cells (Figure 5A). MYH9 transfection inverted the limited proliferation of GC cells transfected with miR-186-5p as well (Figure 5B and C). After that, MYH9 overexpression re-blocked the pro-apoptosis ability (Figure 5D), but re-facilitated the low-migratory ability due to cells miR-186-5p overexpressed transfection (Figure 5E). When it referred to the glycolysis process, miR-186-5p knockdown inhibited glucose uptake, lactate, and ATP consumption, whereas MYH9 co-transfection rescued the above results upon glucose uptake (Figure 5F), lactate (Figure 5G), ATP (Figure 5H) production. Upregulation of miR-186-5p in HGC-27 and AGS cells could suppress the protein expression of HK2 and PKM2, which could be restored by MYH9 transfection as well (Figure 5I and J).
 |
Figure 5 Upregulation of MYH9 inverted the effects of miR-186-5p. (A) The HGC-27 and AGS cells were administrated by co-overexpression miR-186-5p and MYH9, and the MYH9 expression was measured by Western blot. (B–E) The functional assays, namely proliferation (B–C), apoptosis (D), migration (E) were determined by MTT analysis, flow cytometry assays, transwell migration assay individually. (F–H) Overexpression of MYH9 partly reversed miR-186-5p-induced glucose consumption (F), lactate consumption (G), cellular ATP/ADP ratio (H) in HGC-27 and AGS cells. (I–J) The biomarkers of glycolysis (HK and PKM2) were assessed by Western blot. *P<0.05. |
circ-NRIP1 Contributed toMYH9Expression by Sponging with miR-186-5p
To verify the circ-NRIP1 regarded as upstream to regulate the miR-186-5p/MYH9 axis, we assessed the expression of MYH9 by using Western blot assay in the absence of circ-NRIP1 condition (Figure 6A and B). The results uncovered that anti-miR-186-5p rescued the low-expression of MYH9 from si-circ-NRIP1 administration in GC cells. Apart from that, our data also verified that the overexpression of circ-NRIP1 could enhance the protein level of MYH9 in GC cells (Figure S1).
 |
Figure 6 circ-NRIP1contributed to MYH9 expression by sponging with miR-186-5p. The HGC-27 and AGS cells were co-transfected with si-circ-NRIP1 and miR-186-5p inhibitor; the expression pattern of MYH9 was investigated by Western blot in HGC-27 (A) and AGS (B) cells, separately.*P<0.05. |
circ-NRIP1 Knockdown Suppressed Tumor Growth in Nude Mice Xenograft Assay
The results above prompted us to examine the effective mechanism of the circ-NRIP1/miR-186-5p/MYH9 axis on tumorous growth in vivo.
sh-circ-NRIP1 stably transfected AGS cells were constructed (Figure 7A), followed by inoculation into nude mice. Subsequently, our data suggested that tumor volume in sh-circ-NRIP1 group was smaller than that in the sh-NC group (Figure 7B). Also, compared with sh-NC, the sh-circ-NRIP1 group exhibited a light weight (Figure 7C). The qRT-PCR results showed that detached tissues witnessed an expressed promotion of miR-186-5p or suppression of circ-NRIP1 and MYH9 (Figure 7D). The trend of Western blot result is consistent with that of qRT-PCR on MYH9 (Figure 7E).
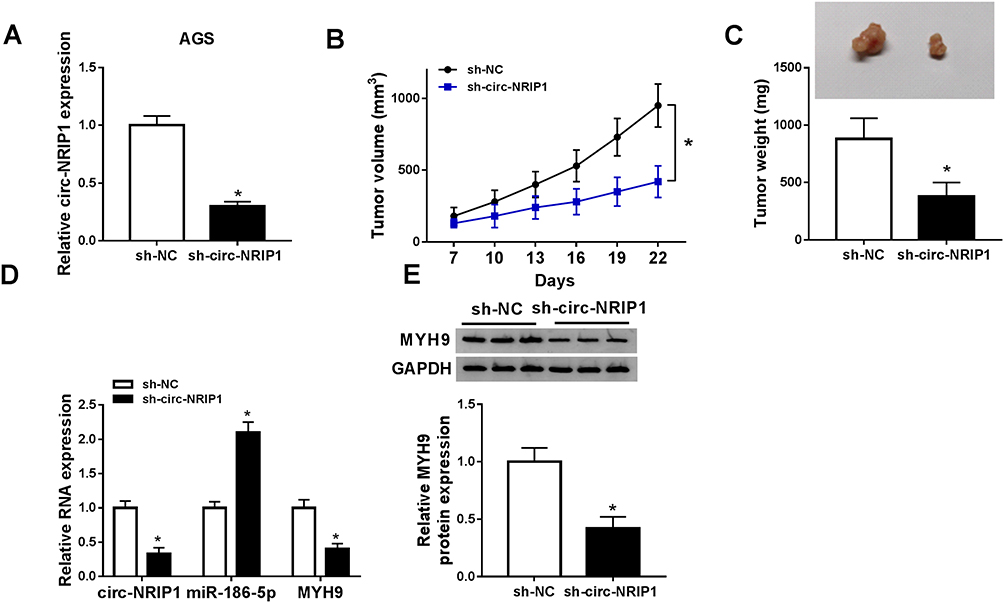 |
Figure 7 circ-NRIP1 knockdown suppressed tumor growth in nude mice xenograft assay. Mice (3 mice/group) were subcutaneously injected with AGS (2×10⁶) stably transfected with sh-circ-NRIP1 or an equal volume of the vehicle into the left flank; the animals were sacrificed after 22 days. (A) circ-NRIP1 level was measured in AGS cells transfected with sh-circ-NRIP1 or sh-NC by qRT-PCR assay. (B) Tumor volume and (C) tumor weight were measured. (D) QRT-PCR analysis was performed to measure the expression levels of circ-NRIP1, miR-186-5p, and MYH9 in excised tumor tissues. (E) Western blotting was performed to measure the expression of MYH9. *P<0.05. |
Discussion
In previous studies, it was reported that circ-NRIP1 was strongly expressed in human GC tissues and cells, and promoted the growth and metastasis of GC cells.14 Consistent with previous results, in our research, the level of circ-NRIP1 was improved in GC tissues and cells and inversely related to that of miR-186-5p in tissues.
We subsequently knocked out circ-NRIP1 to assess its biological function and found that down-regulated circ-NRIP1 expression in GC cells inhibited the cell proliferation, migration, and glycolysis, including glucose consumption, lactate uptake, ATP/ADP ratios and activation of phosphorylases (HK2 and PKM2), but promoted apoptosis.
We predicted and confirmed that miR-186-5p was a downstream target miRNA for circ-NRIP1, previous studies shown that miR-186-5p was lowly expressed in human GC tissues and cells, and regulated tumor cell growth and metastasis, as a tumor-suppressor.21 In current restoration assay, down-regulated miR-186-5p successfully reversed the changes in biological function and glycolysis phenotype caused by circ-NRIP1 deletion, and this piece of data demonstrated that miR-186-5p evidently was the downstream of circ-NRIP1.
In the next part of our research, we also explored how miR-186-5p acted the downstream potential target gene. MYH9, which was predicted as the downstream oncogene of miR-186-5p, several papers indicated that MYH9 was highly expressed in human GC tissue samples and cells as well as participated in the regulation of tumor cell growth and metastasis,24,25 consistent with previous reports. In this experiment, the trend of the up-regulation of MYH9 also appeared in GC tissues and cells. Interestingly, there was also a significant negative correlation between miR-186-5p and MYH9. In the restorative test, overexpressed MYH9 reversed the tumor-suppressive effects of GC cells after miR-186-5p overexpression and clearly produced a pro-cancer phenotype: promoted abilities of cell proliferation and migration, glycolytic enzyme activation, or low apoptosis state. What is more, the down-regulated miR-186-5p also reversed the protein expression of MYH9 from si-circ-NRIP1 transfection.
In the final xenograft model, the group for sh-circ-NRIP1 stable AGS cells showed a reduced tumor volume and weight, and the isolated tissues witnessed low levels of circ-NRIP1 and MYH9 and high expression of miR-186-5p.
In conclusion, circ-NRIP1 was enhanced in tissues of GC clinical patients and cells. Besides, circ-NRIP1 promoted the progress of glycolysis in GC by regulating MYH9 via miR-186-5p. In addition, this is the first report verified that circ-NRIP1 was involved in the activation of glycolysis and the mechanism of the circ-NRIP1-miR-186-5p-MYH9 axis in GC progression. This study provided new insight into the prevention or treatment of GC.
Highlights
- circ-NRIP1 was highly expressed in GC tissues and cells.
- circ-NRIP1 knockdown inhibited cell proliferation, migration, and glycolysis, but induced apoptosis in HGC-27 and AGS cells.
- miR-186-5p is a target of circ-NRIP1, and MYH9 is a target of miR-186-5p.
- circ-NRIP1 functions in the development of GC and glycolysis activation by regulating MYH9 via miR-186-5p.
Disclosure
The authors declare that they have no conflicts of interest in this work.
References
1. Sheikh IA, Mirza Z, Ali A, et al. A proteomics based approach for the identification of gastric cancer related markers. Curr Pharm Des. 2016;22(7):804–811. doi:10.2174/1381612822666151209151848
2. Ferlay J, Soerjomataram I, Dikshit R, et al. Cancer incidence and mortality worldwide: sources, methods and major patterns in GLOBOCAN 2012. Int J Cancer. 2015;136(5):E359–386. doi:10.1002/ijc.29210
3. Siegel RL, Miller KD, Jemal A. Cancer statistics, 2017. CA Cancer J Clin. 2017;67(1):7–30. doi:10.3322/caac.21387
4. Ebbesen KK, Hansen TB, Kjems J. Insights into circular RNA biology. RNA Biol. 2017;14(8):1035–1045.
5. Zhang Y, Yang L, Chen LL. Life without A tail: new formats of long noncoding RNAs. Int J Biochem Cell Biol. 2014;54:338–349. doi:10.1016/j.biocel.2013.10.009
6. Bonizzato A, Gaffo E, TeKronnie G, et al. CircRNAs in hematopoiesis and hematological malignancies. Blood Cancer J. 2016;6(10):e483. doi:10.1038/bcj.2016.81
7. Dykes IM, Emanueli C. Transcriptional and post-transcriptional gene regulation by long non-coding RNA. Genomics Proteomics Bioinformatics. 2017;15(3):177–186. doi:10.1016/j.gpb.2016.12.005
8. Wang C, Tan S, Liu WR, et al. RNA-Seq profiling of circular RNA in human lung adenocarcinoma and squamous cell carcinoma. Mol Cancer. 2019;18(1):134. doi:10.1186/s12943-019-1061-8
9. Bi J, Liu H, Dong W, et al. Circular RNA circ-ZKSCAN1 inhibits bladder cancer progression through miR-1178-3p/p21 axis and acts as a prognostic factor of recurrence. Mol Cancer. 2019;18(1):133. doi:10.1186/s12943-019-1060-9
10. Ju HQ, Zhao Q, Wang F, et al. A circRNA signature predicts postoperative recurrence in stage II/III colon cancer. EMBO Mol Med. 2019;11:e10168.
11. Wang L, Long H, Zheng Q, et al. Circular RNA circRHOT1 promotes hepatocellular carcinoma progression by initiation of NR2F6 expression. Mol Cancer. 2019;18(1):119. doi:10.1186/s12943-019-1046-7
12. Shan C, Zhang Y, Hao X, et al. Biogenesis, functions and clinical significance of circRNAs in gastric cancer. Mol Cancer. 2019;18(1):136. doi:10.1186/s12943-019-1069-0
13. Hansen TB, Jensen TI, Clausen BH, et al. Natural RNA circles function as efficient microRNA sponges. Nature. 2013;495(7441):384–388. doi:10.1038/nature11993
14. Zhang X, Wang S, Wang H, et al. Circular RNA circNRIP1 acts as a microRNA-149-5p sponge to promote gastric cancer progression via the AKT1/mTOR pathway. Mol Cancer. 2019;18(1):20. doi:10.1186/s12943-018-0935-5
15. Filipowicz W, Bhattacharyya SN, Sonenberg N. Mechanisms of post-transcriptional regulation by microRNAs: are the answers in sight? Nat Rev Genet. 2008;9(2):102–114. doi:10.1038/nrg2290
16. Valencia-Sanchez MA, Liu J, Hannon GJ, et al. Control of translation and mRNA degradation by miRNAs and siRNAs. Genes Dev. 2006;20(5):515–524. doi:10.1101/gad.1399806
17. Cao Q, Wang Z, Wang Y, et al. TBL1XR1 promotes migration and invasion in osteosarcoma cells and is negatively regulated by miR-186-5p. Am J Cancer Res. 2018;8(12):2481–2493.
18. Dong S, Wang R, Wang H, et al. HOXD-AS1 promotes the epithelial to mesenchymal transition of ovarian cancer cells by regulating miR-186-5p and PIK3R3. J Exp Clin Cancer Res. 2019;38(1):110. doi:10.1186/s13046-019-1103-5
19. Islam F, Gopalan V, Vider J, et al. MicroRNA-186-5p overexpression modulates colon cancer growth by repressing the expression of the FAM134B tumour inhibitor. Exp Cell Res. 2017;357(2):260–270. doi:10.1016/j.yexcr.2017.05.021
20. Li J, Xia L, Zhou Z, et al. MiR-186-5p upregulation inhibits proliferation, metastasis and epithelial-to-mesenchymal transition of colorectal cancer cell by targeting ZEB1. Arch BiochemBiophys. 2018;640:53–60. doi:10.1016/j.abb.2018.01.002
21. Ouyang Y, Li Y, Huang Y, et al. CircRNA circPDSS1 promotes the gastric cancer progression by sponging miR-186-5p and modulating NEK2. J Cell Physiol. 2019;234(7):10458–10469. doi:10.1002/jcp.27714
22. Seri M, Pecci A, Di Bari F, et al. MYH9-related disease: may-Hegglin anomaly, Sebastian syndrome, Fechtner syndrome, and Epstein syndrome are not distinct entities but represent a variable expression of a single illness. Medicine (Baltimore). 2003;82(3):203–215. doi:10.1097/01.md.0000076006.64510.5c
23. Sellers JR. Myosins: a diverse superfamily. Biochim Biophys Acta. 2000;1496(1):3–22.
24. Liang S, He L, Zhao X, et al. MicroRNA let-7f inhibits tumor invasion and metastasis by targeting MYH9 in human gastric cancer. PLoS One. 2011;6(4):e18409. doi:10.1371/journal.pone.0018409
25. Ye G, Huang K, Yu J, et al. MicroRNA-647 Targets SRF-MYH9 axis to suppress invasion and metastasis of gastric cancer. Theranostics. 2017;7(13):3338–3353. doi:10.7150/thno.20512
26. Liu L, Wang Y, Bai R, et al. MiR-186 inhibited aerobic glycolysis in gastric cancer via HIF-1alpha regulation. Oncogenesis. 2017;6(4):e318. doi:10.1038/oncsis.2017.20
27. Liu Q, Liu H, Cheng H, et al. Downregulation of long noncoding RNA TUG1 inhibits proliferation and induces apoptosis through the TUG1/miR-142/ZEB2 axis in bladder cancer cells. Onco Targets Ther. 2017;10:2461–2471. doi:10.2147/OTT.S124595
 © 2020 The Author(s). This work is published and licensed by Dove Medical Press Limited. The
full terms of this license are available at https://www.dovepress.com/terms
and incorporate the Creative Commons Attribution
- Non Commercial (unported, 3.0) License.
By accessing the work you hereby accept the Terms. Non-commercial uses of the work are permitted
without any further permission from Dove Medical Press Limited, provided the work is properly
attributed. For permission for commercial use of this work, please see paragraphs 4.2 and 5 of our Terms.
© 2020 The Author(s). This work is published and licensed by Dove Medical Press Limited. The
full terms of this license are available at https://www.dovepress.com/terms
and incorporate the Creative Commons Attribution
- Non Commercial (unported, 3.0) License.
By accessing the work you hereby accept the Terms. Non-commercial uses of the work are permitted
without any further permission from Dove Medical Press Limited, provided the work is properly
attributed. For permission for commercial use of this work, please see paragraphs 4.2 and 5 of our Terms.