Back to Journals » Nature and Science of Sleep » Volume 14
Chronic Sleep Deprivation Impaired Bone Formation in Growing Rats and Down-Regulated PI3K/AKT Signaling in Bone Tissues
Received 20 December 2021
Accepted for publication 6 April 2022
Published 14 April 2022 Volume 2022:14 Pages 697—710
DOI https://doi.org/10.2147/NSS.S351850
Checked for plagiarism Yes
Review by Single anonymous peer review
Peer reviewer comments 3
Editor who approved publication: Prof. Dr. Ahmed BaHammam
Xiaoye Duan,1,2 Qi Pan,1 Lixin Guo1,2
1Department of Endocrinology, Beijing Hospital, National Center of Gerontology, Institute of Geriatric Medicine, Chinese Academy of Medical Sciences, Beijing, People’s Republic of China; 2Graduate School of Peking Union Medical College, Chinese Academy of Medical Sciences, Beijing, People’s Republic of China
Correspondence: Lixin Guo, Email [email protected]
Background: This study aimed to assess the effects of chronic sleep deprivation (CSD) on bone metabolism in growing rats and the likely underlying mechanism.
Methods: Twenty 5-week-old male Wistar rats and randomly divided into the CSD and normal control (NC) groups after one-week acclimatization. After a 6-week intervention of sleep deprivation, the distal femurs of both groups were harvested for micro-computed tomography scans and histological analysis. Meanwhile, the femur tissues were measured the mRNA and protein expression via RNA sequencing and immunohistochemical analysis. Serum bone turnover markers were evaluated at 0, 2, 4, and 6 weeks.
Results: CSD impaired the bone growth, showing an imbalance of bone turnover status, dysphasia in the metaphysis growth plate, and deterioration of bone microarchitecture. Further, CSD suppressed bone formation, showing that the expression of osteogenesis-related proteins (col1α 1 and osteocalcin) and mRNA (igf1, bglap, runx2, col1α 1, pth1r) are down-regulated. Differentially expressed genes were detected, and functional enrichment analyses revealed that the PI3K/AKT pathway was significantly down-regulated in the CSD group.
Conclusion: These results suggest that CSD can significantly impaire bone health, and it may exert these effects in part by suppressing bone formation and osteoblast differentiation, and inactivating the PI3K/AKT signaling pathway.
Keywords: chronic sleep deprivation, sleep loss, growth, bone formation, RNA sequencing, PI3K/AKT pathway
Introduction
Sleep deprivation (SD), recognized as a public health epidemic, is associated with adverse health conditions,1 yet little is known about the association between sleep and bone health. A recent study for a cohort in children and adolescents, showed that the subjects with inadequate sleep duration often exhibit abnormal bone growth with low bone density or bone stiffness, suggesting that sleep homeostasis plays an important role in bone growth.2 Some studies have shown that long-term sleep disorders are also risk factors for osteoporosis,3,4 and inadequate sleep duration has been linked to bone growth retardation in children and bone mass loss in adolescents.2 However, additional research in this area is needed to determine how sleep deprivation impairs skeletal health and the skeletal features and underlying mechanisms.
Under healthy conditions, bone is maintained by the constant process of bone remodeling. Normal bone remodeling maintains a balance between bone resorption and formation to maintain bone density. Osteoblasts are generated from the osteogenic differentiation of bone marrow-derived mesenchymal stem cells (BMSCs), which are common precursors for osteoblasts. The direction of BMSC differentiation depends on specific regulatory factors. RUNX family transcription factor 2 (RUNX-2) acts as a key transcriptional modulator that mediates the conversion of BMSCs into osteoblasts.5 As osteoblasts mature, they begin producing the bone extracellular matrix by secreting bone matrix proteins including collagen type I alpha 1 (Col1α1), osteocalcin (OCN), and alkaline phosphatase (ALP). Type I collagen is the main constituent of bone, comprising the non-mineralized bone matrix. Mature osteoblasts express ALP, Col1α1, OCN, and osterix.6 Insulin-like growth factor-1 (IGF-1) is also a key factor for bone formation that promotes osteoblast growth, differentiation, cell cycle progression, and increases cell activity.7 The action of neuropeptides among people with sleep disorders may also take under consideration. For example, orexin A, as a kind of hypothalamic peptides, may target on rat osteoblasts affecting metabolism, especially during their early stages of differentiation into mature osteoblasts.8,9 Previous clinical studies and animal experiments have failed to reach a consensus on the effect of sleep deprivation on bone growth and development, and have not indicated bone metabolic status and the related possible mechanisms associated with chronic sleep deprivation (CSD).10,11
In our study, RNA sequencing (RNA-seq) analysis suggested that several signaling pathways of CSD, including phosphatidylinositol 3-kinase (PI3K)/AKT, were found to play a role in chondrogenesis and bone development. As it is known, the PI3K/AKT pathway critically regulates the process of bone formation and acts as a chief regulator for the proliferation and differentiation of bone cells including BMSCs.12 The downregulation of PI3K and AKT protein expression in CSD animal model has also been reported by different researchers in other tissue or cells such as the hippocampus, adipocytes, liver, and hypothalamus.13–16 However, to our knowledge, the data on bone tissue has not been reported so far. We believe ours is the first study to report that mRNA and protein expressions of AKT and PI3K were downregulated in CSD rats.
CSD is a common condition and may lead to a cascade of complex endocrine derangements that can affect longitudinal growth, bone remodeling, and bone micro-architecture in puberty, but few studies have evaluated these risks.
Owing to the difficulty in controlling diet and sleep behavior in humans through long periods of clinical research, laboratory-based animal studies are crucial. Further animal studies are warranted to determine the relationship of short sleep duration with bone mass and bone metabolism. Therefore, the present study aimed to explore the effects of long-term CSD on bone mass and bone metabolism in rats, and to further investigate the related possible mechanisms.
To our knowledge, this is the first study to show genetic expression in bone metabolism/architecture abnormalities induced by long-term SD in a growing rat model. It is possible that CSD impaired bone growth via decreased transcription factor igf1 and the PI3K/AKT pathway in bone tissue, which can cause bone mass loss and decreased osteoblast differentiation. CSD suppressed the bone growth, suggesting that good sleep for adolescents is very important for accumulation of bone mass and prevention of osteoporosis in later life.
Materials and Methods
Animals and Experimental Design
Twenty 5-week-old male Wistar rats were obtained from the Beijing Vital River Laboratory Animal Technology Co. Ltd (Beijing, China). The rats were fed a standard laboratory diet and kept in a sound-attenuated room under constant conditions (temperature: 24±1°C, relative humidity: 50–60%, and 12/12 h light/dark cycle starting at 8 AM) in groups of 3–4 in standard cages. Before the rats were divided into experimental groups, they were acclimated for a week. CSD was induced by gentle handling by using a slowly rotating bar placed above the cage floor, lightly nudging the animal from sleep, and encouraging low levels of activity until the animal maintained wakefulness on its own. The speed, direction, and duration of bar rotation were fully controlled as previous described.17 The CSD rats were kept awake by gently pushing and shaking by the rotating bar, which is similar to gentle stimulus by experimenters, a kind of total sleep deprivation. Prior to the study, we ensured that all mice were able to groom themselves, eat, and drink during orbital rotor movement of the platform, and could still be awakened upon orbital rotor movement. The rats from the CSD group were intervened for 10 h (8:00 am-6:00 pm) per day for 6 weeks. All blood samples were collected from the angular vein plexus between 08:00 and 9:00 am at 0, 2, 4 and 6 weeks, centrifuged at 2000×g for 15 min at 4 °C, and the serum sample was stored at −80 °C for next measurement.
The present study was approved by institutional animal care and use committee of Beijing Vital River Laboratory Animal Technology Co., Ltd. (Beijing, China) (No. P2020097) and in compliance with the “Laboratory animals-Guideline for ethical review of animal welfare” (GB/T 35892–2018, China).
Measurement for Serum Bone Turnover Markers by Enzyme-Linked Immunosorbent Assay (ELISA)
Procollagen type I N-terminal propeptide (PINP) and C-terminal telopeptide of type 1 collagen (β-CTX) in the rat serum were measured by ELISA kits according to the manufacturer’s instructions. (Elabscience Biotechnology, China) and measured by microplate reader scanning (Synergy H1, USA) at λ = 450 nm. All procedures were performed according to the manufacturer’s instructions.
Microcomputed Tomographic (µ-CT) Measures for Bone Analysis
Bone microarchitecture of the distal femoral metaphysis was acquired ex vivo by µ-CT scan (SCANCO MEDICAL μCT 100, Hangzhou, China). The femurs were scanned with a resolution of 14.8μm at a source voltage of 70kV at a current of 200μA. The region of interests (ROI) were selected for 80 slices from the 1mm below the proximal growth plate, to study primary spongiosa. Femur cortical microarchitecture was assessed using 100 slices located at the midshaft femur. The parameter, including percentage of bone volume (BV/TV, %) relative to the total measured area, trabecular thickness (Tb.Th, mm), trabecular number (Tb.N, mm−1), trabecular spacing (Tb.Sp, mm), cortical thickness (Ct.Th, mm) and the structural model index (SMI) were obtained from the ROIs. SMI represents an estimation of the plate-rod characteristic of the structure where 0 illustrates a plate and 3 illustrates rods.
Hematoxylin and Eosin (HE) for Bone Staining
The left femurs were decalcified in 10% ethylenediaminetetraacetic acid (pH 7.4) for 5 weeks. They were then dehydrated using ethanol solutions and embedded in paraffin by using standard histological procedures. Sections of 4 μm were cut and stained with HE. Bone histology was evaluated under a light microscope. The images of chondrocyte zone at the growth plate and primary and secondary spongiosa at the distal femoral metaphysis of the extremities were captured.
Immunohistochemical Analysis of OCN and Col1α1 Expression
To identify the osteogenesis markers of femoral tissues, the expression levels of OCN and Col1α1 in the femur were measured by immunohistochemical (IHC) analysis. The paraffin-embedded slices around the distal femurs were quenched in 3% (v/v) H2O2 for 10 min in methanol before blocking with serum. After overnight incubation at 4°C with the primary antibodies anti-Col1α1 (GB13022-2, Servicebio, Wuhan, China) and anti-OCN (GB11233, Servicebio, Wuhan, China), the sections were washed with PBS before incubation at 37°C for 30 min with the secondary antibody PV-6001 goat anti-rabbit IgG-HRP multimer (GB23303, Servicebio, Wuhan, China). The sections were then incubated for 5–10 min with diaminobenzidine, rinsed with distilled water, counterstained with hematoxylin for 1 min, and viewed under a Moticam 3000 microscope photomicrography system. Quantification of the brown staining for target protein was evaluated by the AOD (integral optical density (IOD)/area) based on ImageJ software (Version 1.53e, America) from three random fields per slide (×40 magnification).
RNA Sequencing Data Processing and Differential Expression Analyses
Total RNA were extracted from femur tissues. RNA degradation and contamination was monitored on 1% agarose gels. To purity of RNA was evaluated by the NanoPhotometer® spectrophotometer (IMPLEN, CA, USA). RNA concentrations were measured using Qubit® RNA Assay Kit in Qubit® 2.0 Flurometer (Life Technologies, CA, USA). The quality of RNA was evaluated by the RNA Nano 6000 Assay Kit of the Bioanalyzer 2100 system (Agilent Technologies, CA, USA). RNA-seq was performed on an Illumina Novaseq platform and 150 bp paired-end reads were generated.
Raw data of FASTQ format were aligned to UCSC rn6 using hisat2 (v2.2.1) and the genes were quantified by HTSeq (v0.12.4). The principal component analysis (PCA) was performed with the R function prcomp with the logarithmic sequencing counts. The differential expression analysis between CSD and NC groups (each with n = 3) were performed by DESeq2 (v1.20.0). Genes with adjusted p-value (q-value) < 0.1 were assigned as differentially expressed genes (DEGs). Subnetworks of DEGs was analyzed by MCODE v1.4.2 in Cytoscape v3.5.1. Subnetworks with score > 5.0 were selected for further analysis. Enrichment of DEGs for Gene Ontology (GO) and Kyoto Encyclopedia of Genes and Genomes (KEGG) pathways were performed by the Database for Annotation, Visualization and Integrated Discovery (DAVID) v6.8. Terms with false discovery rate (FDR) < 0.05 were considered to be significantly enriched terms. Gene Set Enrichment Analysis (GSEA) was performed by the GSEA tool v4.1.0 with each gene’s homolog in human converted by R package biomaRt v2.48.2. All other analyses were performed by R v4.1.0.
Quantitative Real-Time PCR
Total mRNA was extracted using TRIzol buffer (Invitrogen Life Technologies) according to the manufacturer’s protocol. Complementary DNA (cDNA) was synthesized using a PrimeScript™ RT reagent kit (Takara, China). TB Green® Premix Ex Taq™ II kit (Takara, Japan) was used for cDNA amplification on the Bio-Rad iQ5 real-time PCR system (Bio-Rad, USA). The sequences of the primers are listed in Table 1. The expression of the target gene was normalized to that of GAPDH. The relevant expression level of the mRNA was reflected by the Ct value calculated by the 2− ΔΔCT method. Each sample was tested in triplicate.
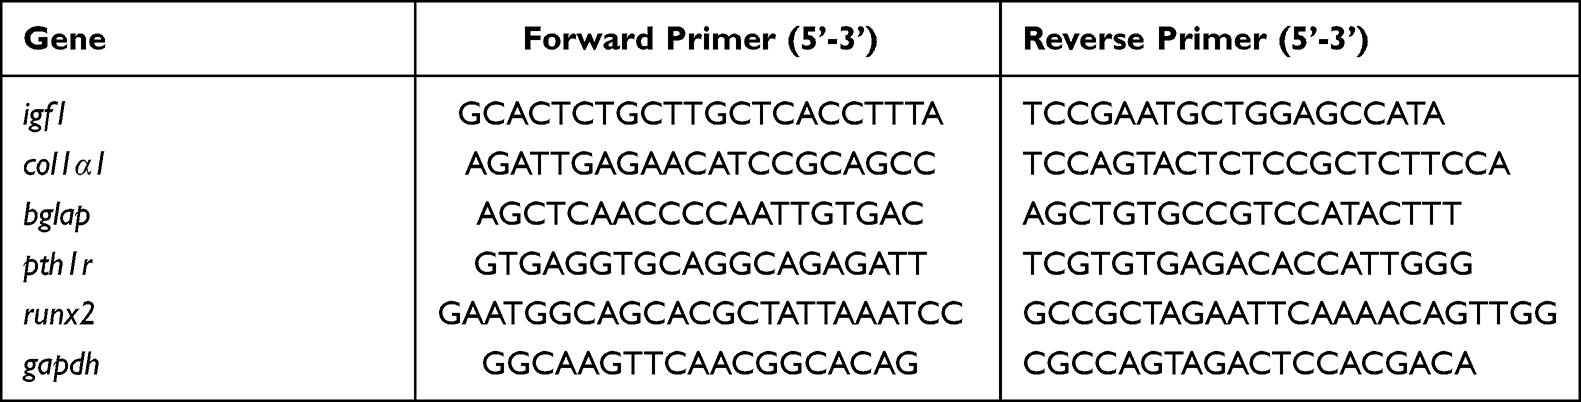 |
Table 1 Primer Sequences Used for Real-Time PCR Analyses |
Statistical Analyses
Non-normally distributed variables were compared using non-parametric Mann–Whitney U-test. Student’s t-test was conducted for comparison between normally distributed variables. For comparison of P1NP and β-CTX between the NC and CSD groups, analysis of covariance with covariates including body weight was used. All analyses were performed with SPSS 24.0 software (IBM Corporation, Armonk, NY, USA). P<0.05 (two-tailed) was considered to indicate statistical significance.
Results
Effect of CSD on Bone Growth
Body Weight
The body weight of rats from both groups increased over time, but the increase in body weight of rats from the CSD group was significantly less than that of rats from the NC group after one week of sleep deprivation (Figure 1A). At the end of the 6-week sleep deprivation intervention, the percentage of body weight gain for CSD and NC groups were 243% and 256%, respectively, suggesting that growth rate in CSD rats was slightly less than in NC rats (5.08%, P=0.025).
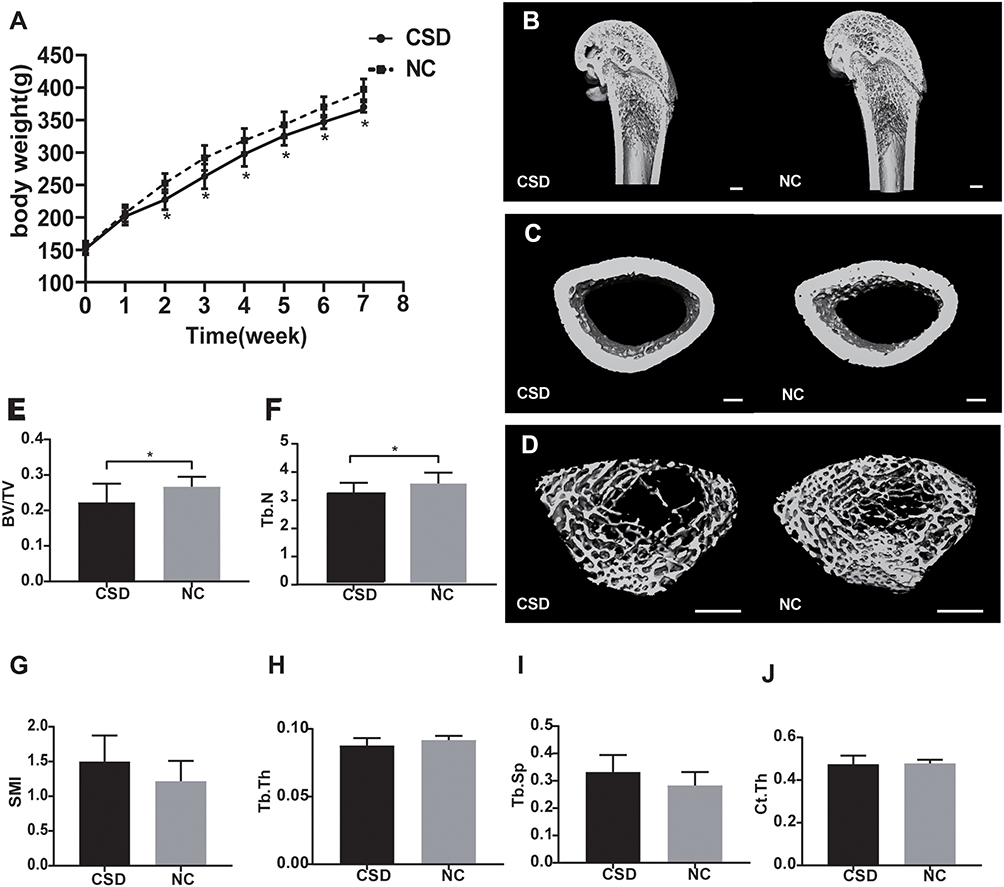 |
Figure 1 Chronic sleep deprivation (CSD) impaired bone growth in growing rats. (A) The changes of body weight of CSD and normal control (NC) group. (B–D) Three-dimensional reconstruction from microcomputed tomography (μCT) scans of the full distal femurs (B), cortex (C), trabeculae (D) of CSD and NC groups. Scale bar, 1.0mm. (E–J) Quantitative analysis of the bone volume/tissue volume (BV/TV, %), trabecular number (Tb.N, mm−1), SMI (structure model index), trabecular thickness (Tb.Th, mm), trabecular separation/spacing (Tb.Sp, mm), cortical thickness (Ct.Th, mm). Data represent mean ± standard deviation. The NC and CSD groups were compared using an unpaired, two-tailed Student’s t-test. *Significant differences were defined as P<0.05, n=10 rats per group. |
Bone Histomorphology and Bone Microstructure Analysis
To assess the effects of CSD on bone growth, µ-CT and HE staining were used to measure distal femoral microarchitecture of growing rats. Features of the femoral bone (Figure 1B) and the microarchitecture of their trabeculae (Figure 1C) and cortices (Figure 1D) of both groups are illustrated. The microarchitecture of the trabeculae showed that the BV/TV decreased by 16.43% (P=0.03, Figure 1E); Tb.N decreased by 13.01% (P=0.03, Figure 1F); Tb.Th decreased by 4.35% (P=0.06, Figure 1H); and Tb.Sp increased by 17.40% (P=0.07, Figure 1I) in the CSD group compared with the NC group, suggesting that rats from the CSD group had lower bone mass and showed greater deterioration of microarchitecture of the trabecular bone than the NC rats. Other bone parameters were consistent with a bone loss phenotype in the distal femoral epiphysis of the femur in the CSD group. The SMI of the CSD group was 18.87% (P=0.07) higher than that of the NC group (Figure 1G), which was not statistically significant. However, CSD had no significant influence on Ct.Th (P>0.05, Figure 1J), compared with the control.
The representative histological images of the distal femoral metaphysis revealed remarkable bone abnormalities by HE staining (Figure 3A–D). The proliferative zone of the CSD rats was shorter than that of the NC rats, suggesting decreased osteogenesis in the CSD rats. In addition, the CSD rats had an increased hypertrophic zone of chondrocytes and a decreased osteoid content of the primary spongiosa zone, indicating impaired mineralization of the newly formed bones (Figure 3A and B–G). In the secondary spongiosa zone, the CSD rats showed increased disconnections and separation among the trabecular bone network and a decreased trabecular bone mass (Figure 3C and D).
Effect of CSD on Osteogenesis and Osteoblast Differentiation
The effects of CSD on both bone formation and resorption in growing rats were evaluated by bone turnover markers, PINP, and β-CTX (Figure 2A and B). Compared to the NC rats, The CSD rats showed significantly lower levels of serum PINP at the beginning of the intervention than the NC rats (P<0.05); whereas, the serum β-CTX levels in the CSD rats showed a significant decrease at last (P<0.05). After the 6-week CSD intervention, the bone formation and bone resorption makers were both significantly lower than in the NC group (P<0.05), suggesting that CSD suppressed bone turnover status of growing rats, mainly affecting bone formation. Since the body weight has been shown to positively correlate with the bone loss,16 the differences remained significant even after adjustment for covariates, weight.
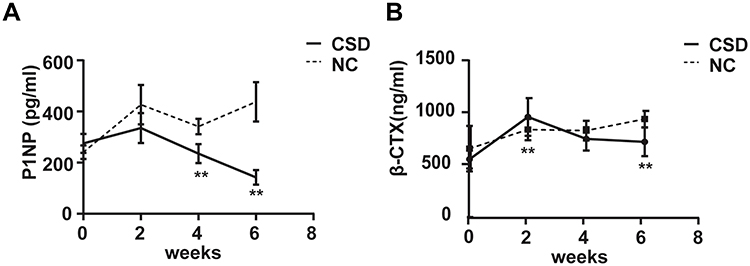 |
Figure 2 Chronic sleep deprivation (CSD) leaded to bone remodeling imbalance in growing rats. (A and B) The changes of serum procollagen type I N-terminal propeptide (PINP) and carboxyl-terminal telopeptide of type 1 collagen (β-CTX) in the normal control (NC) group and CSD groups. Data represent mean ± standard deviation. **Significant differences were defined as P<0.05, after adjusting for weight via analysis of covariance, n=10 rats per group. |
To explore the effects of CSD on the bone formation in growing rats on a cellular level, IHC analyses were conducted to determine the expression of osteogenesis markers (OCN and Col1α1) in the femur of growing Wistar rats (Figure 3E and F). Several osteocytes and osteoblasts from the NC group and CSD group are clearly visible. IHC analysis of OCN and Col1α1 on femoral bone of growing rats showed that CSD decreased the AOD value of target protein expression in osteogenic differentiation and decreased OCN levels and Col1α1 levels by 5.62% and 7.13%, respectively (Figure 3H) relative to the NC group. Overall, CSD decreased the expression of osteogenic differentiation proteins compared with the NC group, suggesting that CSD can promote osteogenic differentiation in vivo. Meanwhile, the osteoblast was more active and numerous in NC group, compared with CSD group (Figure 3C and D), suggesting the potential and activity of osteoblast was suppressed by CSD.
 |
Figure 3 Chronic sleep deprivation (CSD) suppressed bone formation and osteoblast differentiation in growing rats. (A–D) The representative histological images of the extremity distal femoral metaphysis, including growth plate (A and B) and the secondary spongiosa zone (C and D) in CSD and normal control (NC) groups. The arrows indicate osteoblasts, shown here as either plump (D), considered activated, or flattened (C), considered quiescent. Scale bar, 50μm. (E and F) Representative images for the immuno-histochemical staining detection of: Collagen type alpha 1 (Col1α1) (E) and Osteocalcin (OCN) (F), scale bar, 50μm. (G) The chondrocyte zone width of the growth plate showed that the CSD group had a shorter proliferative zone (PZ), increased hypertrophic zone (HZ) of chondrocytes, and decreased osteoid content of the primary spongiosa (PS) zone, than the NC group. (H) The integrated optical density/area (AOD) of the target protein from IHC was quantified by ImageJ software for OCN and Col1α1. Data are represented as mean ± standard deviation. *Significant differences were defined as P<0.05, n=10 rats per group. |
Effect of CSD on Gene Expression
RNA-seq methods employed samples collected from the femur in growing rats with or without CSD and a principal component analysis (PCA) of the samples was showed (Figure 4A). The RNA-Seq data was submitted to GEO (GSE189337). Using fairly stringent criteria (q-value < 0.1), a total of 451 genes were expressed significantly different in the CSD rats: 272 up-regulated genes and 179 down-regulated genes (Figure 4B). And of these down-regulated genes, 39 genes associated with bone and cartilage formation, such as igf1, bglap, runx2, col1α1, pth1r, sp7, Col11a2, Col13a1, Ctnnb1, were also downregulated in LPS injured samples (Figure 4C), which was related to the functional enrichment of bone development and osteoblast differentiation. Some of them were connected densely and subnetwork of DEGs with Igf1 was showed (Figure 4D).
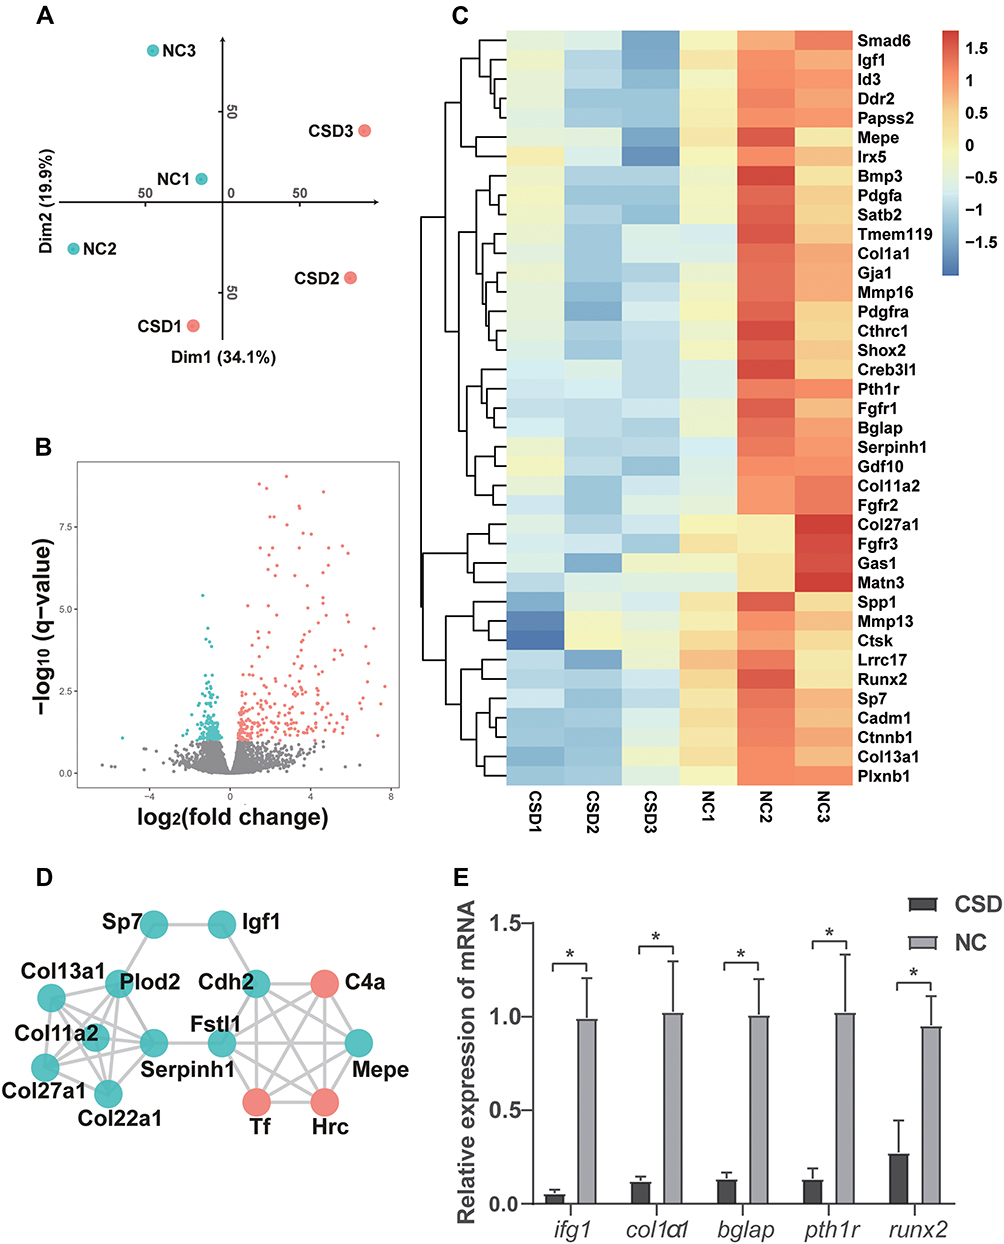 |
Figure 4 Differentially expressed gene (DEG) analysis between chronic sleep deprivation (CSD) and normal control (NC) groups. (A) principal component analysis (PCA) of the samples. (B) Differentially expressed genes are shown by the volcano plot. The distribution of genes is shown in the volcano plots built based on log2 (fold change) and log10 (q-value). The red and green dots represent statistically upregulated and downregulated genes, respectively. (C) Bone and cartilage formation genes. (log10 normalized count) (D) Subnetwork of DEGs with Igf1. (E) Quantitative real-time PCR validation for DEGs. The mRNA of igf1, col1α1, bglap, pth1r, and runx2 were downregulated in the CSD group, compared to the NC group. Each sample was measured in triplicate and the experiment was repeated twice with similar results. Data are presented as mean±standard deviation. *Significant differences were defined as P<0.05. |
To better explore the function and molecular pathway of DEGs, functional enrichment was conducted using GO (Figure 5A) and KEGG (Figure 6) analyses. GO analysis was based on aspects: molecular functions, biological processes, and cellular components. Some of the biological processes such as osteoblast differentiation, bone development, cartilage development, bone remodeling, and bone mineralization deserved special recognition, because they were down-regulated in the CSD group compared with the NC group, while purine ribonucleoside monophosphate metabolic process and ATP metabolic process were two of the most significantly up-regulated processes. In molecular functions, the growth factor binding function and collagen binding function showed considerable downregulation, while there were barely any up-regulated genes (data was not shown). Some genes in cellular components involved in the response to CSD such as the extracellular matrix and collagen were significantly downregulated, while mitochondria-related genes were up-regulated (data was not shown). Significantly downregulated KEGG pathways related to PI3K-AKT signaling were enriched for differentially expressed mRNAs. Diabetic cardiomyopathy, Oxidative phosphorylation, and Neurodegenerative disease-related pathways were up-regulated. The results from GSEA again showed that bone development- and osteoblast differentiation-correlated genes were significantly reduced in CSD-exposed rats compared to NC rats (Figure 5B and C).
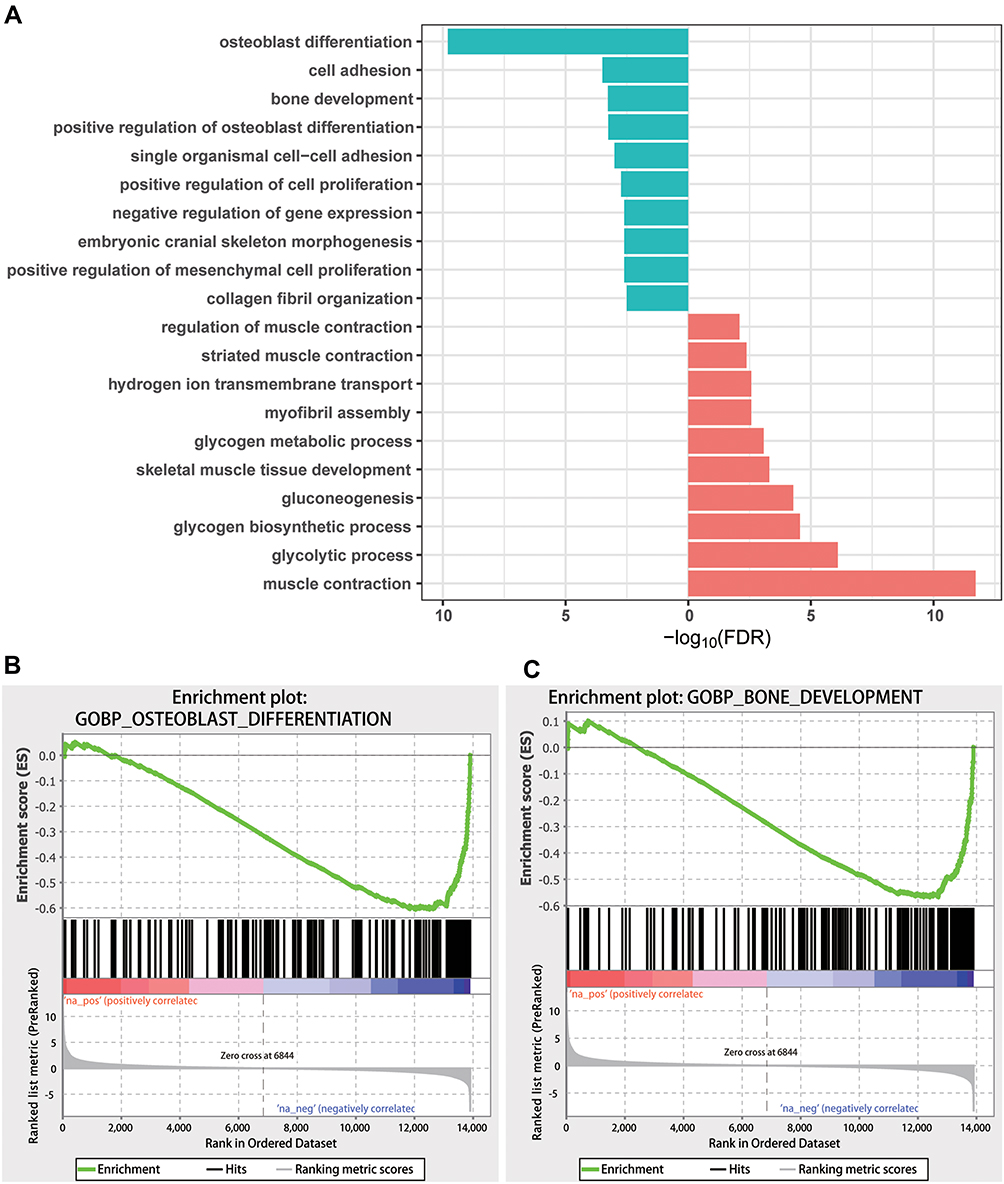 |
Figure 5 Gene function analysis of differentially expressed genes (DEGs). (A) GO-term enrichments from biological processes and terms and pathways with false discovery rate (FDR) <0.05 were considered to be significant, and the top 10 significant terms and pathways are shown. (B) Gene set enrichment analysis (GSEA) for bone development. (C) GSEA analysis for bone development. |
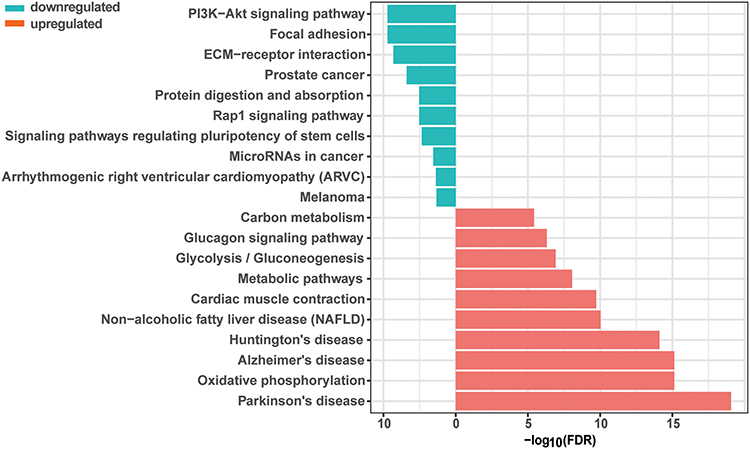 |
Figure 6 The PI3K/AKT signaling pathway was inhibited in chronic sleep deprivation (CSD), compared with normal control (NC) groups. Functional enrichment of mRNAs was conducted using KEGG pathway analyses. |
Validation of Osteogenesis Gene Expression
To validate the RNA-Seq data, five osteogenesis genes with >twofold changes were selected (igf1, bglap, runx2, col1α1, pth1r) and subjected to qRT-PCR to verify the RNA-Seq data. As shown in Figure 4E, five genes were significantly downregulated, consistent with those of RNA-seq. Although there was variation in the fold changes between qRT-PCR and RNA-Seq, the expression trends of the selected genes were consistent, indicating high quality of our RNA-Seq data.
Discussion
Several studies have identified that sleep disturbance, including both inadequate sleep, narcolepsy and circadian disruption, such as those that occur with shift work, jet lag, or social jet lag could be additional risk factors for low BMD, bone loss, and fracture.19–21 In addition, due to the co-occurrence of sleep disruption and accelerated bone turnover during puberty, it is possible that adolescents who experience SD are at greater risk for excess bone loss than adolescents who get adequate sleep. If SD is found to be an important risk factor for bone mass loss, then evaluation for sleep disturbance should be included in the health examination for students. Screening could lead to diagnosis and intervention for SD, and pharmacological interventions for low bone mass may be avoided and/or their efficacy improved by prompt amelioration of the sleep abnormality.
CSD suppressed bone growth, especially decreased bone formation, in growing rats. The data showed that CSD led to deterioration of bone microarchitecture, including significant decreases in BV/TV and Tb.N (Figure 1E and F). Bone histomorphology showed that the CSD group had abnormality in the metaphysis growth plate with a less proliferative zone and more hypertrophic zone of chondrocytes and a decreased osteoid content of the primary spongiosa zone, suggesting decreased osteogenesis in growing rats in this group. Impaired mineralization of the newly formed bones, and deteriorative trabecular bone in the secondary spongiosa zone (Figure 3A and B). The level of serum bone formation marker (P1NP) significantly decreased, even after adjusting for confounding factors such as body weight, suggesting a low bone turnover after 6 weeks of CSD. These findings indicate that CSD induces a significantly rapid decline in serum bone formation marker levels (P1NP) and uncouple with the bone resorption marker (β-CTX) (Figure 2A and B). The initial decline in P1NP continued with ongoing exposure to SD and was increasingly aggravated during the intervention duration. As previously reported,22 P1NP levels remain lower in young men who have experienced >3 weeks of sleep restriction and concurrent circadian disruption. Swanson et al23 also found similar results in a previous study wherein SD alters bone formation more than resorption. Some recent small-sample cohort studies revealed an imbalance in bone turnover status in subjects with sleep restriction and circadian disruption, but the conclusions have not reached a consensus.18 In our study, we infer that SD can impair bone development and growth in adolescents owing to the relatively rapid suppressed bone formation.
An important outcome from the current experiment is that CSD downregulated bone development and osteoblast differentiation. The data of IHC indicated that bone development and growth was suppressed in the CSD group via downregulation of Col1α1, and OCN in the femoral tissue, which might impair its differentiation and induce severe defects in bone formation (Figure 3A and B). The results from qPCR also showed that the expression of osteogenesis-related mRNAs such as igf1, bglap, runx2, col1α1, and pth1r were significantly downregulated (Figure 4E). It is known that these genes pay a key role in bone formation and osteoblast differentiation.5–7 The functional enrichment of the biological processes and GSEA suggested that the osteoblast differentiation pathway and bone development pathway were significantly downregulated in the CSD group compared with the controls (Figure 5B and C). Most genes in these two pathways were markedly downregulated in CSD rats. This evidence suggested that CSD could limit attainment of optimal peak bone mass via suppressing the bone formation and osteoblast differentiation if they occur early in life or accelerate the age-related decline in bone mass later in life over time. Therefore, puberty for young male subjects might represent the main therapeutic window for mitigating bone loss.
We found that long-term SD decreased the phosphorylation of PI3K and AKT and inhibited the PI3K/AKT pathway in skeletal tissue in a possible way of explaining inhibited osteogenic differentiation and bone development. We observed strong enrichment of the PI3K/AKT membrane in KEGG enrichment analysis (Figure 6A). Interestingly, previous outcomes reported that activation of PI3K/AKT signaling has also been found to promote the osteoblastic differentiation in both BMSCs and pre-osteoblasts, and targeted disruption of PI3K/AKT signaling has been found to attenuate bone formation and induce bone loss in vivo or in vitro.9,24 Furthermore, PI3K signaling has a positive role in chondrocyte differentiation and is involved in the endochondral bone growth process. Lin et al24 found that inhibiting PI3K/AKT signaling also resulted in attenuation of chondrocyte hypertrophy and cartilage degeneration. The results of these investigations are consistent with our findings. Our data further provided evidence to show that inhibiting PI3K/AKT signaling reduced osteogenesis and decreased osteogenic differentiation in subchondral bone and osteocytes, respectively, in CSD mouse models (Figure 6).
More evidence revealed that sleep may play an equally important role in peripheral energy metabolism in addition to central nervous system function. Moreover, phosphorylation of AKT, a crucial step of the PI3K/AKT pathway that mediates most metabolic actions of hormones, was markedly impaired after SD. In 2012, a randomized clinical study found a significant reduction of insulin sensitivity in subcutaneous fat tissues of healthy adults after 4-night SD. Additionally, the p-AKT and the ratio of p-AKT/AKT decreased in their adipocytes.13 Li et al14 reported that autophagy in the liver induced by SD and the p-AKT /AKT ratio was significantly lower in rat liver tissues after 21 days of SD. Xue et al15 found the expression level of protein p-AKT decreased significantly in the hippocampus with increasing inflammation and oxidative stress after 7 days of SD. Sun et al16 also reported the reduced expression of IRS/PI3K/AKT/mTOR and FoxO1 signaling pathways in the hypothalamus of 4-week SD rats. Due to PI3K/AKT pathway reduced by SD, some drugs prevent the disorder induced by SD via activating this pathway. Modafinil, a drug promoting wakefulness, could counteract excessive neuronal autophagy and apoptosis in male C57BL mice after 48h SD through activation of the PI3K/Akt/m TOR/P70S6K signaling pathway.25 Chen et al26 found that acute SD for 5 days in Sprague–Dawley rats caused significant degradation of the cardiac tissue accompanied by elevated levels of cardiomyocyte apoptosis and markers associated with inflammation, which can be relieved by exogenously administered IGF-1 via the PI3K/AKT pathway. Saponins, a traditional Chinese medicine beneficial to blood circulation and hemostasis, reduced cardiac injury induced by 48-h SD in mice through the PI3K/AKT/mTOR signaling pathway.27 Orexin A acted on osteoblasts differentiation in early stages8 and induced cell apoptosis through the OX1R/PI3K/AKT signaling pathway.9 Therefore, for young male subjects, therapies targeted to promote the PI3K/AKT pathway might improve bone growth during puberty.
A major limitation of most previous studies was the relatively small size of samples. In these studies, the investigators did not confirm if the observed negative changes of bone turnover markers could translate into changes in BMD and bone quality in humans exposed to SD.18,22,23 For most metabolic bone diseases in humans, significant changes in BMD generally take up to 6 months to 1 year or even longer to be manifested, whereas the exposure duration to SD in their subjects were no more than 3 weeks, and in some cases, only 2 or 3 days. The age and body mass index of subjects were relatively greater, especially when the sample size was very limited.28,29 However, both age and BMI are known significant and strong factors of bone turnover markers levels, especially among children and elder.29 We believe our study adequately addresses these limitations.
In our study, rats had a slight loss of weight gain (~5%) across the course of the study, which may be a confounding factor. Body mass can affect bone mineral density and bone mass. However, it is difficult to explain the reduced osteoblast differentiation and imbalance in bone turnover status, which was likely unrelated to the negligible decrease in body mass. Furthermore, if these changes were mediated by other possible effects of the SD, such as increased inflammation30,31 and vitamin D deficiency, then an increase in bone resorption would have been expected;30,32 however, this was not observed. Our finding of marked alterations in transcriptome of bone tissue shows that the SD directly acts on osteocytes rather than via central nervous system function and further suggests that sleep may play an equally important role in peripheral energy metabolism, as previous reported.13,27 As for physical activity, our SD model mimics the gentle handling procedures by slowly rotating the bar thereby compelling the rats to change their position at all times. Therefore the SD rats avoided too much physical movement or limited the exercises. Our study has some limitations. Although we used RNA-seq detection and bio-information analysis to reveal bone manifestation induced by chronic sleep deprivation, the more novel molecular mechanism for deeper exploration was needed in the further research. In addition, it is a pity that we do not have EEG/EMG for detection in real time. We expect further and more studies to investigate the ability to recover from these detrimental changes in bone metabolism by activating the PI3K/AKT pathway need to be further investigated in future research.
Overall, the present study aimed to investigate the role of CSD in bone formation. We explored the underlying mechanisms of bone growth by RNA-seq and analyses of signaling pathways. A total of 451 DEGs identified mainly had functions in bone development and osteoblast differentiation. Although a few of the aforementioned genes were previously shown to be associated with bone development, to our knowledge, most were identified for the first time to be related to the decline of male bone tissues in growing CSD rats. This finding suggests that the bone growth and development was impaired in adolescents with long-term sleep loss, which might be partly responsible for reduction of bone formation. The KEGG analysis of mRNA revealed that the PI3K/AKT signaling pathway was significantly downregulated in CSD groups, which play an important role in bone formation.
Conclusions
CSD during puberty can effectively impair bone development by suppressing bone formation, and the PI3K/AKT pathway is an important candidate pathway in this process. The period of puberty for young male subjects is likely the main therapeutic window for mitigating bone loss; therefore, therapies targeting the promotion of PI3K/AKT pathway might improve bone growth during puberty. CSD may be more detrimental to bone health in early adulthood, suggesting that good sleep for adolescents is extremely important to accumulate bone mass and prevent osteoporosis in later life. Further studies are needed to explore the sex-based differences and complex underlying molecular mechanisms.
Data Sharing Statement
The raw data supporting the conclusions of this article will be made available by the authors, without undue reservation, to any qualified researcher.
Ethics Statement
All animal experiments were carried out after approval by the institutional animal care and use committee of Beijing Vital River Laboratory Animal Technology Co., Ltd. (Beijing, China) (No. P2020097) and in compliance with the “Laboratory animals-Guideline for ethical review of animal welfare” (GB/T 35892-2018, China).
Acknowledgment
We sincerely thank editors at Charlesworth Author Services for editing the language of this article.
Author Contributions
All authors made a significant contribution to the work reported, whether that is in the conception, study design, execution, acquisition of data, analysis and interpretation, or in all these areas; took part in drafting, revising or critically reviewing the article; gave final approval of the version to be published; have agreed on the journal to which the article has been submitted; and agree to be accountable for all aspects of the work. All authors read and approved the submitted version.
Funding
This work was supported by the National Natural Science Foundation of China (grant nos. 81670763 and 81471050).
Disclosure
The authors report no conflicts of interest for this work and declare that the research was conducted in the absence of any commercial or financial relationships that could be construed as a potential conflict of interest.
References
1. Zhu B, Shi C, Park CG, Zhao X, Reutrakul S. Effects of sleep restriction on metabolism-related parameters in healthy adults: a comprehensive review and meta-analysis of randomized controlled trials. Sleep Med Rev. 2019;45:18–30. doi:10.1016/j.smrv.2019.02.002
2. Cheng L, Pohlabeln H, Ahrens W, et al. Cross-sectional and longitudinal associations between sleep duration, sleep quality, and bone stiffness in European children and adolescents. Osteoporosis Int. 2021;32(5):853–863. doi:10.1007/s00198-020-05753-x
3. Cauley JA, Hovey KM, Stone KL, et al. Characteristics of self‐reported sleep and the risk of falls and fractures: the Women’s Health Initiative (WHI). J Bone Miner Res. 2019;34(3):464–474. doi:10.1002/jbmr.3619
4. Yen CM, Kuo CL, Lin MC, et al. Sleep disorders increase the risk of osteoporosis: a nationwide population-based cohort study. Sleep Med. 2014;15(11):1339–1344. doi:10.1016/j.sleep.2014.07.005
5. Zanatta M, Valenti MT, Donatelli L, Zucal C, Dalle CL. Runx-2 gene expression is associated with age-related changes of bone mineral density in the healthy young-adult population. J Bone Miner Metab. 2012;30(6):706–714. doi:10.1007/s00774-012-0373-1
6. Elsafadi M, Manikandan M, Atteya M, et al. Characterization of cellular and molecular heterogeneity of bone marrow stromal cells. Stem Cells Int. 2016;2016:9378081. doi:10.1155/2016/9378081
7. Zhang M, Xie Y, Zhou Y, et al. Exendin-4 enhances proliferation of senescent osteoblasts through activation of the IGF-1/IGF-1R signaling pathway. Biochem Bioph Res Co. 2019;516(1):300–306. doi:10.1016/j.bbrc.2019.06.112
8. Ziolkowska A, Rucinski M, Tortorella C, et al. Cultured rat calvarial osteoblast-like cells are provided with orexin type 1 receptors. Int J Mol Med. 2007;20(6):779–782.
9. Baker N, Sohn J, Tuan RS. Promotion of human mesenchymal stem cell osteogenesis by PI3-kinase/Akt signaling, and the influence of caveolin-1/cholesterol homeostasis. Stem Cell Res Ther. 2015;6(1):238. doi:10.1186/s13287-015-0225-8
10. Everson CA, Folley AE, Toth JM. Chronically inadequate sleep results in abnormal bone formation and abnormal bone marrow in rats. Exp Biol Med. 2012;237(9):1101–1109. doi:10.1258/ebm.2012.012043
11. Xu X, Wang L, Chen L, et al. Effects of chronic sleep deprivation on bone mass and bone metabolism in rats. J Orthop Surg Res. 2016;11(1):87. doi:10.1186/s13018-016-0418-6
12. Qamar H, Waqas M, Li A, Iqbal M, Mehmood K, Li J. Plastrum testudinis extract mitigates thiram toxicity in broilers via regulating PI3K/AKT signaling. Biomolecules. 2019;9(12):784. doi:10.3390/biom9120784
13. Broussard JL, Ehrmann DA, Van Cauter E, Tasali E, Brady MJ. Impaired insulin signaling in human adipocytes after experimental sleep restriction. Ann Intern Med. 2012;157(8):549. doi:10.7326/0003-4819-157-8-201210160-00005
14. Li Y, Zhang Y, Ji G, et al. Autophagy triggered by oxidative stress appears to be mediated by the AKT/mTOR signaling pathway in the liver of sleep-deprived rats. Oxid Med Cell Longev. 2020;2020:1–11. doi:10.1155/2020/6181630
15. Xue R, Wan Y, Sun X, Zhang X, Gao W, Wu W. Nicotinic mitigation of neuroinflammation and oxidative stress after chronic sleep deprivation. Front Immunol. 2019;10:2546. doi:10.3389/fimmu.2019.02546
16. Sun Q, Liu Y, Wei W, et al. Chronic timed sleep restriction attenuates LepRb-mediated signaling pathways and circadian clock gene expression in the rat hypothalamus. Front Neurosci. 2020;14:909. doi:10.3389/fnins.2020.00909
17. Li Y, Panossian LA, Zhang J, et al. Effects of chronic sleep fragmentation on wake-active neurons and the hypercapnic arousal response. Sleep. 2014;37(1):51–64. doi:10.5665/sleep.3306
18. Depner CM, Rice JD, Tussey EJ, et al. Bone turnover marker responses to sleep restriction and weekend recovery sleep. Bone. 2021;152:116096. doi:10.1016/j.bone.2021.116096
19. Ochs Balcom HM, Hovey KM, Andrews C, et al. Short sleep is associated with low bone mineral density and osteoporosis in the women’s health initiative. J Bone Miner Res. 2020;35(2):261–268. doi:10.1002/jbmr.3879
20. Song C, Wang J, Kim B, et al. Insights into the role of circadian rhythms in bone metabolism: a promising intervention target? Biomed Res Int. 2018;2018:1–11. doi:10.1155/2018/9156478
21. Chang ET, Lin CL, Chen SF, Hsu CY, Shen YC. Risk of bone fractures in patients with narcolepsy: a nationwide population-based cohort study. Sleep Med. 2020;70:55–59. doi:10.1016/j.sleep.2020.02.015
22. Swanson CM, Kohrt WM, Wolfe P, et al. Rapid suppression of bone formation marker in response to sleep restriction and circadian disruption in men. Osteoporosis Int. 2019;30(12):2485–2493. doi:10.1007/s00198-019-05135-y
23. Swanson CM, Shea SA, Wolfe P, et al. Bone turnover markers after sleep restriction and circadian disruption: a mechanism for sleep-related bone loss in humans. J Clin Endocrinol Metab. 2017;102(10):3722–3730. doi:10.1210/jc.2017-01147
24. Lin C, Shao Y, Zeng C, et al. Blocking PI3K/AKT signaling inhibits bone sclerosis in subchondral bone and attenuates post-traumatic osteoarthritis. J Cell Physiol. 2018;233(8):6135–6147. doi:10.1002/jcp.26460
25. Ling D, Zhao Y, Zhang Z, Li J, Zhu C, Wang Z. Morphine inhibits the promotion of inflammatory microenvironment on chronic tibial cancer pain through the PI3K-Akt-NF-kappaB pathway. Am J Transl Res. 2020;12(10):6868–6878.
26. Chen H, Zhao Z, Zheng J, et al. The effect of IGF-1 on symptoms of sleep deprivation in a rat model of inflammatory heart disease and metabolic syndrome. Biochem Bioph Res Co. 2014;446(4):843–849. doi:10.1016/j.bbrc.2014.02.123
27. Cao Y, Li Q, Yang Y, et al. Cardioprotective effect of stem-leaf saponins from panax notoginseng on mice with sleep derivation by inhibiting abnormal autophagy through PI3K/Akt/mTOR pathway. Front Cardiovasc Med. 2021;8:694219. doi:10.3389/fcvm.2021.694219
28. Swanson CM, Shea SA, Kohrt WM, et al. Sleep restriction with circadian disruption negatively alter bone turnover markers in women. J Clin Endocrinol Metab. 2020;105(7):7. doi:10.1210/clinem/dgaa232
29. Li M, Li Y, Deng W, et al. Chinese bone turnover marker study: reference ranges for C-terminal telopeptide of type I collagen and procollagen I N-terminal peptide by age and gender. PLoS One. 2014;9(8):e103841. doi:10.1371/journal.pone.0103841
30. Zhu X, Zheng H. Factors influencing peak bone mass gain. Front Med. 2021;15(1):53–69. doi:10.1007/s11684-020-0748-y
31. Stich FM, Huwiler S, Hulst GD, Lustenberger C. The potential role of sleep in promoting a healthy body composition: underlying mechanisms determining muscle, fat, and bone mass and their association to sleep. Neuroendocrinology. 2021. doi:10.1159/000518691
32. Evatt ML. Vitamin D associations and sleep physiology-promising rays of information. Sleep. 2015;38(2):171–172. doi:10.5665/sleep.4386
 © 2022 The Author(s). This work is published and licensed by Dove Medical Press Limited. The
full terms of this license are available at https://www.dovepress.com/terms
and incorporate the Creative Commons Attribution
- Non Commercial (unported, 3.0) License.
By accessing the work you hereby accept the Terms. Non-commercial uses of the work are permitted
without any further permission from Dove Medical Press Limited, provided the work is properly
attributed. For permission for commercial use of this work, please see paragraphs 4.2 and 5 of our Terms.
© 2022 The Author(s). This work is published and licensed by Dove Medical Press Limited. The
full terms of this license are available at https://www.dovepress.com/terms
and incorporate the Creative Commons Attribution
- Non Commercial (unported, 3.0) License.
By accessing the work you hereby accept the Terms. Non-commercial uses of the work are permitted
without any further permission from Dove Medical Press Limited, provided the work is properly
attributed. For permission for commercial use of this work, please see paragraphs 4.2 and 5 of our Terms.