Back to Journals » Clinical Ophthalmology » Volume 16
Chromatic Full-Field Stimulus Thresholds in Patients with Treatment-Naive Age-Related Macular Degeneration
Authors William A, Dias Blak M, Eshref A, Gekeler F, Schatz A, Gekeler K
Received 26 October 2021
Accepted for publication 17 January 2022
Published 29 January 2022 Volume 2022:16 Pages 223—229
DOI https://doi.org/10.2147/OPTH.S346291
Checked for plagiarism Yes
Review by Single anonymous peer review
Peer reviewer comments 2
Editor who approved publication: Dr Scott Fraser
Antony William,1 Matthias Dias Blak,2 Altan Eshref,2 Florian Gekeler,2,3 Andreas Schatz,2,3 Katrin Gekeler2,3
1Department of Ophthalmology, University Hospital Wuerzburg, Wuerzburg, Germany; 2Department of Ophthalmology, Klinikum Stuttgart, Stuttgart, Germany; 3Centre for Ophthalmology, University Hospital Tuebingen, Tuebingen, Germany
Correspondence: Andreas Schatz
Department of Ophthalmology, University Hospital Tuebingen, Tuebingen, Elfriede –Alhorn-Straße 7, Tuebingen, 72076, Germany
, Tel +4970712988088
, Email [email protected]
Purpose: To evaluate retinal sensitivity using chromatic full-field stimulus thresholds (FST) in patients with treatment naive exudative age-related macular degeneration (e-ARMD) before and during the first intravitreal anti-vascular endothelial growth factor (anti-VEGF) treatment.
Patients and Methods: After general ophthalmological examinations to diagnose patients with e-ARMD the FST, the central foveal thickness (FCt) and the visual acuity were assessed in 20 eyes of 20 patients during this prospective study. Examinations were performed before and during the first treatment series with three intravitreal anti-VEGF injections. Normal values for FST were assessed in 19 eyes of 19 healthy subjects. Results were analyzed using Student’s two-tailed t-test and Pearson’s correlation coefficients between all functional parameters.
Results: At baseline and before the 1st intravitreal anti-VEGF treatment, a moderately significant negative correlation between VA and FCt was found in the e-ARMD group (p = 0.02, r = − 0.45 and p = 0.03, r = − 0.45), respectively. After the 2nd intravitreal anti-VEGF injection, no significant correlation between VA and FCt was found (p = 0.12). However, a significant correlation between FCt and blue FST was evident (p = 0.04, r = 0.4). After the 3rd intravitreal anti-VEGF treatment, there was no correlation evident between VA and FCt (p = 0.31) but a high significant correlation between FCt and FST using red (p = 0.01, r = 0.53), green (p = 0.002, r = 0.6) and blue light (p = 0.007, r = 0.66).
Conclusion: During anti-VEGF treatment in patients with e-ARMD, the FST test showed higher significant correlations with the morphology measured by FCt, as it is the case for VA. These findings support that the FST test might serve as a valuable diagnostic tool for monitoring patients with e-ARMD and enhance functional assessment of retinal function under treatment with anti-VEGF.
Keywords: chromatic full-field stimulus thresholds, foveal central thickness, intravitreal anti-vascular endothelial growth factor
Introduction
Exudative age-related macular degeneration (e-ARMD) is a chronic progressive disease, which is one of the leading causes of vision loss in industrialized nations.1,2 Exudative age-related macular degeneration is characterized by growth of anomalous vessels commonly originating from the choroidal vasculature causing leaking and hemorrhage into subretinal space, intraretinally and intravitreally. The pathophysiology of choroidal neovascularization (CNV) is complex and still not completely understood; however, vascular endothelial growth factor (VEGF) plays an important role in the angiogenesis and increases the vascular permeability not least of all shown by the vastly successful treatment of anti-VEGF factors.1–7 In these studies, evaluation of the treatment effect of the intravitreal anti-VEGF agents and the requirement of re-injections was based on VA and optical coherence tomography (OCT). However, VA testing in low vision patients is most probably error-prone: the assessment is based on a subjective testing technique with a potential learning effect due to a restricted number of test signs and without any control of fixation. Thus, VA does not seem undoubtedly appropriate as the main test method for monitoring treatment effects of anti-VEGF on the retina or assessing new treatment strategies or molecules. None of the previously mentioned studies have evaluated the role of retinal sensitivity in patients with e-ARMD and its correlations with VA and OCT. The full-field stimulus threshold test (FST) is a psychophysical test of luminance threshold to assess retinal sensitivity.8,9 It is used to stimulate the entire retina using a full-field illumination with different light emitting diodes (different wavelength). The FST test therefore allows to stimulate different photoreceptor pathways independent from a defined fixation.10 A strong correlation between FST parameters and microperimetry in macular regions has been described before.11 Hence, the aim of this study was to evaluate the role of retinal sensitivity measured by a commercially available chromatic FST in patients with e-ARMD undergoing intravitreal anti-VEGF treatment.
Materials and Methods
Design and Patient Involvement
In this prospective cohort study, twenty patients with e-ARMD were recruited from the regular clinics of the Department of Ophthalmology, Klinikum Stuttgart (Stuttgart, Germany). Nineteen healthy subjects were examined during a previous study and served as control group for the chromatic full field stimulus threshold test (IEC project number: 258/2010B01). The study was performed adhering to the tenets of the Declaration of Helsinki after approval of the local ethics committee in Baden-Württemberg (F-2014-089). Written informed consent was obtained from all patients after explanation of the purpose of the study. Each patient underwent ophthalmological examinations with VA using ETDRS Charts, foveal central thickness (FCt) using spectral-domain OCT, fundus photography (FP) and chromatic full-field stimulus thresholds test (FST) using blue, red and green LED light. The diagnosis of e-ARMD was confirmed on the basis of fluorescein angiography (FA) and OCT findings in the e-ARMD. Inclusion criteria were e-ARMD without any prior treatment and age above 50 years. Exclusion criteria were previous vitreoretinal surgery, previous laser treatment, or inability to adhere to the study protocol.
Study Protocol and Visit Schedule
Study Protocol
Visual Acuity
Best corrected far visual acuity (BCVA) was measured using the standardized Early Treatment Diabetic Retinopathy Study Charts (ETDRS) at 4 m (Precision Vision®, USA).
Fundus Photography and Fluorescein Angiography
FP and FA were done at baseline examination to confirm the diagnosis after pupillary dilatation with mydriatics (Mydriaticum Stulln®, Stulln, Germany).
Spectral Domain Optical Coherence Tomography
SD-OCT was performed using Spectralis HRA-OCT® (Heidelberg Engineering, Heidelberg, Germany) after pupillary dilation with tropicamide (Mydriaticum Stulln®, Stulln, Germany) and phenylephrine hydrochloride (Neosynephrin POS 5%®, Ursapharm GmbH, Germany). For OCT, each patient underwent 20° x 15° degree2 raster scans using the built-in volumetric software protocol. The number of frames was set to 100 to improve the image quality. Foveal central thickness was defined as the thickness of the innermost 1-mm ring of the built-in ETDRS macular map (FCt).
Chromatic Full Field Stimulus Threshold
FST examinations were performed using the Espion Color Dome® (Diagnosys, Cambridge, UK). Pupils were fully dilated using tropicamid (Mydriaticum Stulln®, Stulln, Germany) and phenylephrine hydrochloride (Neosynephrin Pos 5%®, Ursapharm GmbH, Germany). Patients were tested monocularly using three different light emitting diodes (blue LED = 470 nm, red LED = 635 nm and green LED = 513 nm). A simple ʽʽseen-not seen” strategy was used to determine all thresholds. Sensitivity was set to 0 dB as stimulus intensity of 0.01 cd.s/m2 (4 ms duration). The stimulus luminance varied in steps of 4 dB until the first response reversal and subsequently in the opposite direction with steps of 2 dB. When a second response reversal occurred, the algorithm stopped, and the last seen stimulus luminance was taken as the starting point for a second sample following the same protocol.
A built-in two parameter Weibull function was used to estimate the final threshold determined by 50% probability in detecting the stimulus intensity.
Visit Schedule
Five visits were scheduled. During the first visit (baseline screening), all patients underwent a screening examination (Figure 1). During the second visit all patients received their first intravitreal injection after they underwent an additional ophthalmological examination with VA, FCt and FST. Four weeks after the first injection they received their 2nd and further 4 weeks later the 3rd intravitreal injection at their 3rd and 4th visit, respectively. The fifth visit (last examination visit) was timed four weeks after the 3rd intravitreal injection. The baseline examination consisted of VA, FP, FA, FCt and FST to confirm the diagnosis of e-ARMD (Figure 1). During the second visit, re-examinations of the VA, FCt and FST were performed to validate results before treatment. At the third visit, the 2nd intravitreal injection was performed. At the fourth visit, VA, FCT and FST were examined and the 3rd intravitreal injection was performed. At the fifth visit, VA, FCT and FST were examined (Figure 1).
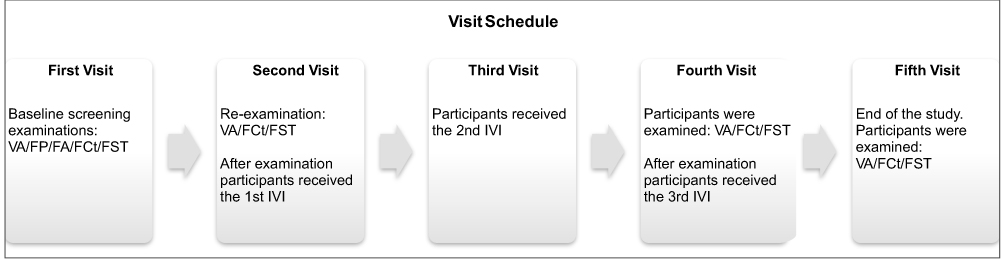 |
Figure 1 Visit schedule with ophthalmological examinations and intravitreal injections at all visits. Abbreviations: VA, visual acuity; FP, fundus photography; FA, fluorescein angiography; FCt, foveal optical coherence tomography thickness; FST, full-stimulus threshold; IVI, intravitreal injection. |
Statistical Analysis
For statistical analysis, Student’s two-tailed t-test was used after ensuring that the distribution of the data showed a normal distribution. Pearson correlation test and linear regression analysis were used to analyse possible correlation of functional parameters (VA and FST) to morphological changes during treatment (FCt). Ranges are given as standard deviations (SD). All tests were performed using JMP® software (version 13.0, SAS Institute Inc., Cary, NC, USA). A p-value <0.05 was considered statistically significant.
Results
The demographic characteristics of the patients and all healthy subjects are summarized in Tables 1 and 2. The mean age of patients with e-ARMD was 73.2 ± 14.0 years. In the e-ARMD group, a mean VA of 0.44 ± 0.27 (decimal notation) was examined. The mean FCt was 323.9 ± 186.9 µm. The FST test was −31.9 ± 10.4 dB using the blue light, −25.8 ± 9.0 dB using the green light and −14.4 ± 8.1 dB using the red light at baseline examination. Examinations of the healthy group revealed a mean of −54.28 ± 12.0 dB for the blue FST, a mean of −45.56 ± 2.55 dB for the green FST and a mean of −28.52 ± 7.95 dB for the red FST. All FST parameters showed higher values in the e-ARMD patient group in comparison to the healthy group (Table 1).
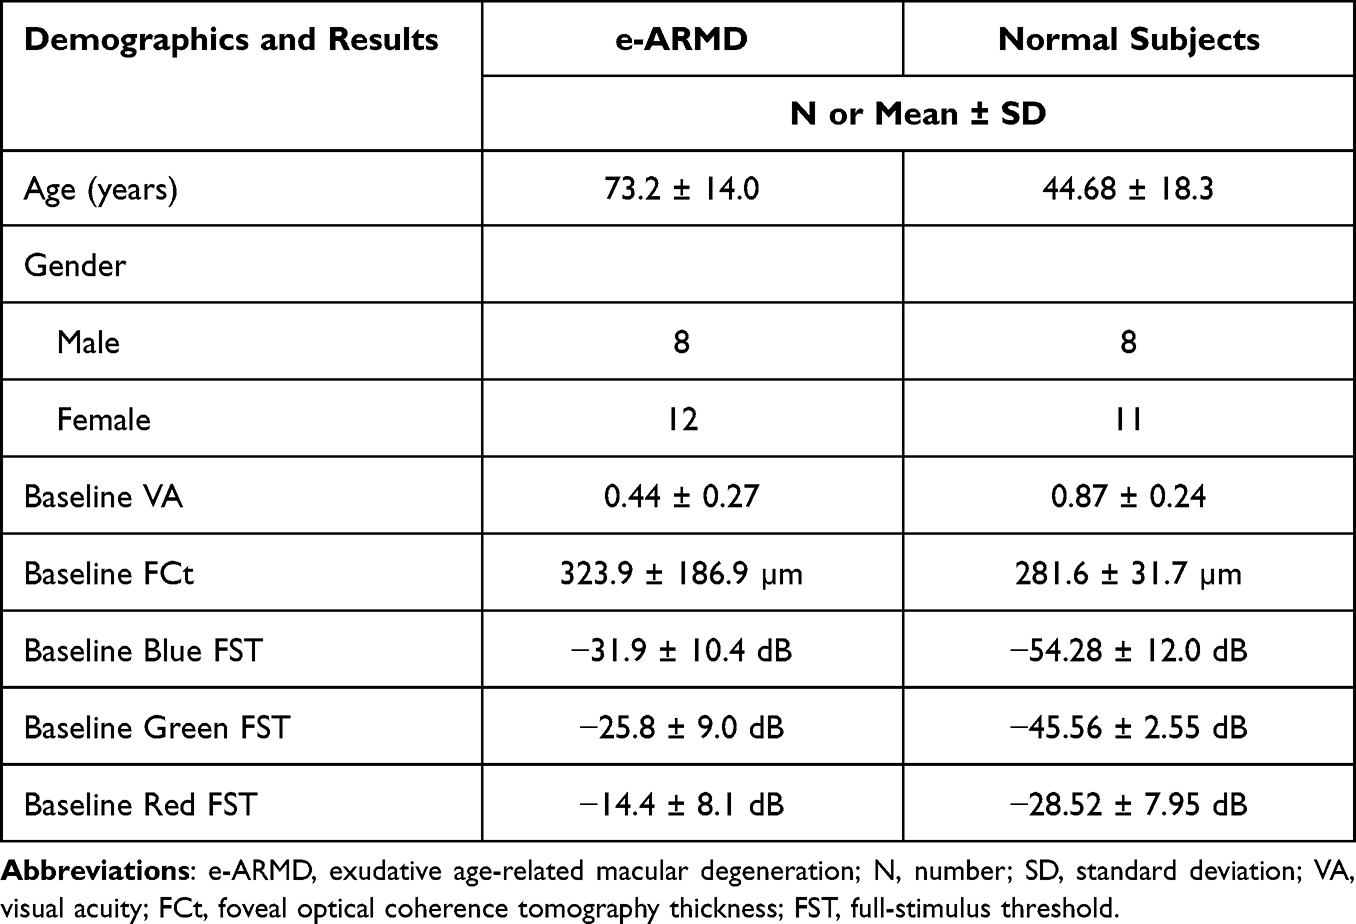 |
Table 1 General Demographics and Results of All Patients at Baseline |
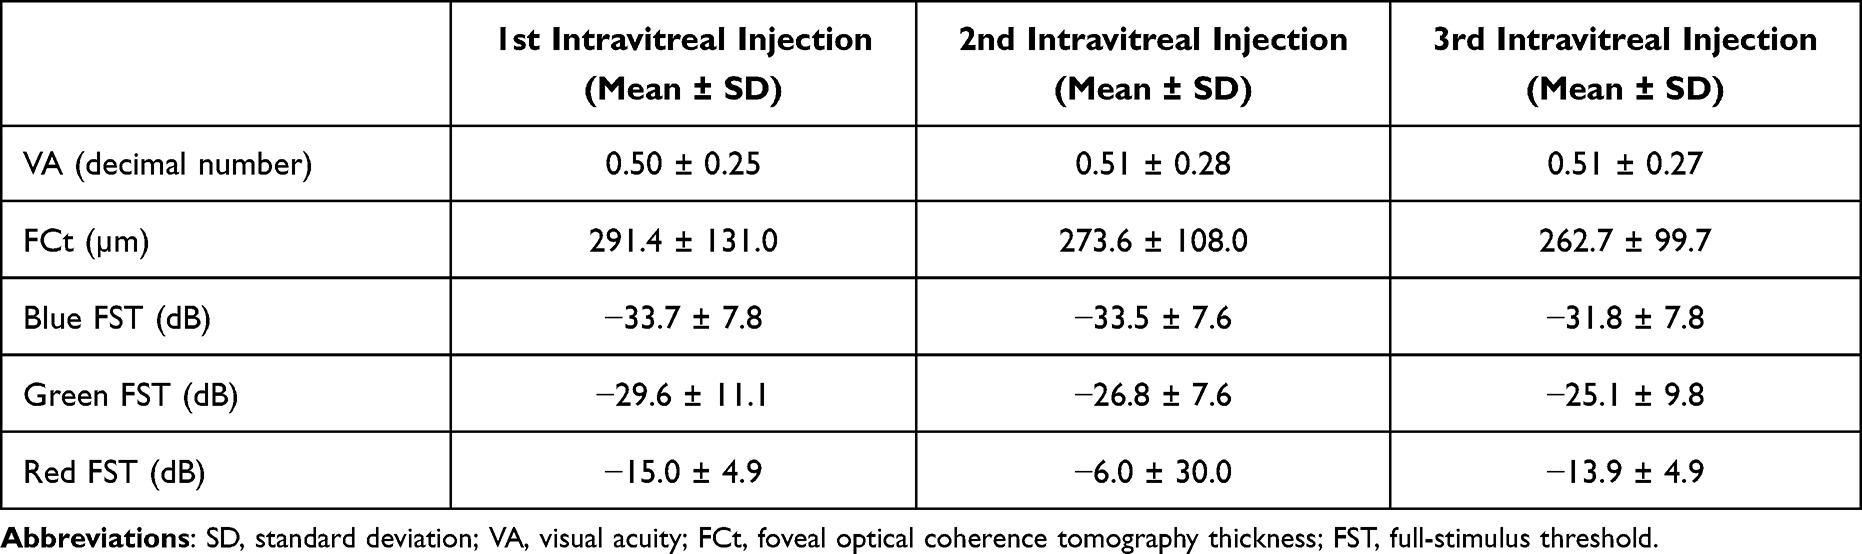 |
Table 2 Results of All Patients in the e-ARMD Group Before the 1st, After the 2nd and the 3rd Intravitreal Injection |
At baseline, VA in the e-ARMD group was statistically significantly correlated to the FCt (p = 0.02, r = −0.45). This statistically significant correlation was still present before the 1st intravitreal treatment (p = 0.03, r = −0.45). After the 2nd intravitreal treatment, no significant correlation between VA and FCt was evident (p = 0.12). However, FCt showed a moderate significant correlation with the blue FST (p = 0.04, r = 0.44; Figure 2A. After the 3rd intravitreal treatment, no significant correlation was found between VA and FCt (p = 0.31), but a high significant correlation was evident between the FCt and the green FST, blue FST, and the red FST (p = 0.003, r = 0.61 and p = 0.0007, r = 0.67, p = 0.01, r = 0.54, respectively; Figure 2B–D)).
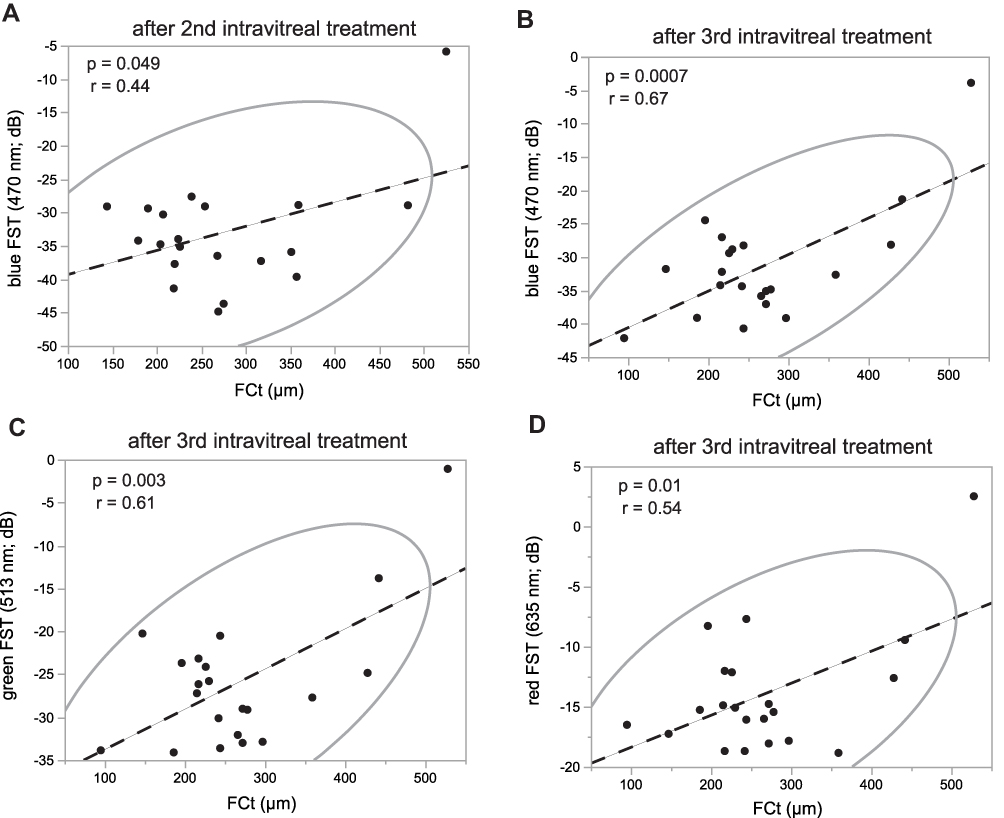 |
Figure 2 Correlation analysis of foveal central thickness (FCt) with parameters of the chromatic FST (blue, green and red FST). A moderate significant correlation between the blue FST and the FCt after the 2nd intravitreal treatment is shown in (A) (p = 0.04, r = 0.44 of Pearson's correlation coefficient test). After the 3rd intraviral treatment, a highly significant correlation between the blue FST and the FCt is shown in (B) (p = 0.0007, r = 0.67). For the green and red FST a similar high correlation is show after the 3rd intravitreal treatment in (C) (green: p = 0.003, r = 0.61) and (D) (red: p = 0.01, r = 0.54). Abbreviations: FCt, foveal optical coherence tomography thickness; FST, full-stimulus threshold; r, Pearson’s correlation coefficient. |
Discussion
The FST test has been valuable in determining visual perception in patients with severe retinal degeneration and in patients with difficulty in steady fixation.9,10 Recently, Stingl et al demonstrated that FST act as a valid clinical marker in determining late-stage early-onset retinitis pigmentosa and correlates significantly with the disease duration.12 Using LEDs of three different wavelengths, ie, blue, green and red, allows examination of selected populations of photoreceptors and their pathways. Of the available LEDs, the rod system is most sensitive to the blue LED (470 nm).13 The cone system is most sensitive to the red LED (635 nm).13 The entire retina with all cone populations is most sensitive to the green LED (513 nm).13 Our study is the first reporting the use of FST in treatment-naive patients with e-ARMD undergoing anti-VEGF therapy and to investigate its correlation with FCt in comparison to VA. We were able to demonstrate the feasibility of this fairly new testing method in monitoring retinal function and a correlation with OCT measurements. In the previous decade after the breakthrough of anti-VEGF treatment, most patients with e-ARMD have predominantly been examined by VA, FP, FA and OCT. In Phase III clinical anti-angiogenic therapy trials, mainly VA and OCT were used for monitoring the disease and possible treatment effects, including determination of treatment schedules and re-treatment regimens.5,6,14 In earlier studies, VA was taken as an indication for re-injection or recurrence of CNV.4 In the PrONTO study, a loss of 5 letters after a loading phase of Ranibizumab in conjunction with fluid within the macula was seen as indicative parameter for CNV activity and hence an indication for re-treatment. It was the commonest reasons for re-injection.4 However, Ross et al have later shown in a larger cohort study that the mean change of VA in different stages of e-ARMD is potentially misleading. Their findings showed that the majority of VA gains occur at the end of the loading phase with little further gain or loss thereafter and that the gain of VA is dependent to the VA at baseline.7 Simader et al have more recently demonstrated that VA is not correlated to FCt after the loading phase of Ranibizumab. They have found a correlation of VA with FCt only at baseline examinations. They argued that the loss of correlation between VA and FCt during follow-up was due to the irreversible damage of the retinal architecture.15 Additionally, VA may be influenced by lens disease or ocular surface diseases. In a prospective study by Malet et al in patients with a mean age of 80 years, ocular dry eye disease was seen in 29.6%, from which 14.7% were under treatment with artificial tears.16 This might constitute another potential reason for unjustified influences of VA during the treatment of e-ARMD.
In our study, we found that VA is not correlated with FCt after the second intravitreal injection of anti-VEGF in the loading phase. Hence, our results are similar to those recently mentioned by Simader et al regarding the fact that VA should not be taken as a sole marker for controlling patients with e-ARMD, neither as an indicator for CNV activity.15 Unlike VA, OCT seems to be a robust, crucial tool in assessing the morphological response of the retina to antiangiogenic agents. It can assess anatomical macular changes such as intraretinal fluid (IRF), subretinal fluid (SRF), sub-RPE fluid (fluid under the retinal pigment epithelium), retinal hyper reflective material (sub-SHRM) and retinal pigment epithelial elevation (RPEE).17 In the phase III clinical trials, MARINA, ANCHOR and VEGF Trap, and TD-OCT were used to monitor patients along the study course.5,6 Sayanagi et al have shown that TD-OCT is inferior to SD-OCT in evaluating the activity of CNV after treatment with intravitreal injections. SD-OCT was superior to TD-OCT in detecting sub-RPE fluid, IRF and intraretinal cysts.18 Recently, Folgar et al published almost similar results to those of Sayanagi et al.19 The presence or absence of retinal fluid and its location is of significant importance in the management of e-ARMD. This is due to its impact as marker of the disease activity and its prognostic factor on the visual outcome. Jaffe et al have shown in a prospective study that eyes with residual IRF, especially foveal IRF had worse VA than those without IRF.20 Foveal IRF and extrafoveal IRF are associated with a negative impact on the VA, which was previously observed in the 2 years results.21 Jaffe et al also determined that SHRM, abnormal thin or thick retina and large CNV area are further poor prognostic factors.21 While profound knowledge is necessary to correctly and meaningfully interpret scans of different OCT imaging techniques and scan protocols, FST may serve as a new independent and robust additional tool in assessing patients with e-ARMD. We have found a significant correlation between the mean blue FST sensitivity and FCt after the 2nd intravitreal injection, a correlation which remained after the 3rd intravitreal injection. It is not clear why the blue FST was correlated with the FCt earlier in the treatment course than the green and red FST. In our study, no dark adaptation has been performed, therefore isolated rod-function response cannot be expected by stimulations with blue light using the FST technique. But the rod system is highly sensitive to wavelengths near the implemented blue light stimulation at 470 nm and the highest rod density is surrounding the foveola, not directly in the foveola. Since e-ARMD is typically a disease of central macular regions involving the foveola, this may express the important role of the foveola surrounding retinal function in assessment of disease activity in patients with e-ARMD.22 A previously published study has discussed the loss of different types of photoreceptors in e-ARMD. Surprisingly, a greater loss of rod photoreceptors in comparison to cones was detected in e-ARMD.22 After the 3rd intravitreal injection, we have found a significant correlation between all FST stimulation colors (blue, red and green FST) and FCt. The highest concentration of cones, which are highly sensitive to green and red light is in the central foveolar region.23 It can be speculated that the rods or the function around the foveolar region correlate earlier and stronger with FCt (after the 2nd intravitreal injection) under treatment of e-ARMD, as it is the case for cones or the central foveolar region (after the 3rd intravitreal injection).
But, in contrast to the FST results, no correlations were found between VA and FCt after the baseline examination. This also underlines a possibly inferior role of VA in solely monitoring disease activity of e-ARMD under treatment. The validity of our data might be lowered by the relatively short study duration with a small number of data points. A longer examination period should help to establish the role of FST in determining the significance, prognostic and predictive value of FST in e-ARMD. The healthy subjects group was significantly younger compared to the e-ARMD group in our study. But the healthy subjects group serves not as a control group for the e-ARMD group, rather than as indicator for normal FST values unaffected by possible influences as age or the lens status. Further studies should address to investigate the relationship between FST parameters and other OCT markers as central foveal thickness, or an OCT-derived scoring system. Additional information may reveal from examinations under dark-adapted conditions to explore different photoreceptor types.
In conclusion, the presented study is, to the best of our knowledge, the first examining retinal sensitivity parameters with the FST test and correlations with FCt in patients with e-ARMD undergoing anti-VEGF treatment. We demonstrated significant correlations between the blue, the red and the green FST with FCt after the 2nd and the 3rd injection of the first series of intravitreal anti-VEGF injections. In contrast to the results of the FST test, VA was correlated to FCt only at baseline. We believe that FST therefore offers an additional functional marker and might be used in combination with OCT in monitoring patients with e-ARMD, especially under treatment with anti-VEGF.
Ethics Approval and Informed Consent
All procedures performed in studies involving human participants were in accordance with the ethical standards of the institutional and/or national research committee and with the 1964 Helsinki declaration and its later amendments or comparable ethical standards. The study was conducted after approval of the local ethics committee in Baden-Württemberg (F-2014-089). Informed consent was obtained from all individual participants included in the study.
Funding
This study was supported by Novartis Pharma, Germany.
Disclosure
The authors report no conflicts of interest in this work.
References
1. Abraham P, Yue H, Wilson L. Randomized, double-masked, sham-controlled trial of ranibizumab for neovascular age-related macular degeneration: PIER study year 2. Am J Ophthalmol. 2010;150(3):315–324 e311. doi:10.1016/j.ajo.2010.04.011
2. Kliffen M, Sharma HS, Mooy CM, Kerkvliet S, de Jong PT. Increased expression of angiogenic growth factors in age-related maculopathy. Br J Ophthalmol. 1997;81(2):154–162. doi:10.1136/bjo.81.2.154
3. Bashshur ZF, Bazarbachi A, Schakal A, Haddad ZA, El Haibi CP, Noureddin BN. Intravitreal bevacizumab for the management of choroidal neovascularization in age-related macular degeneration. Am J Ophthalmol. 2006;142(1):1–9. doi:10.1016/j.ajo.2006.02.037
4. Fung AE, Lalwani GA, Rosenfeld PJ, et al. An optical coherence tomography-guided, variable dosing regimen with intravitreal ranibizumab (Lucentis) for neovascular age-related macular degeneration. Am J Ophthalmol. 2007;143(4):566–583. doi:10.1016/j.ajo.2007.01.028
5. Heier JS, Brown DM, Chong V, et al. Intravitreal aflibercept (VEGF trap-eye) in wet age-related macular degeneration. Ophthalmology. 2012;119(12):2537–2548. doi:10.1016/j.ophtha.2012.09.006
6. Kaiser PK, Blodi BA, Shapiro H, Acharya NR, Group MS. Angiographic and optical coherence tomographic results of the MARINA study of ranibizumab in neovascular age-related macular degeneration. Ophthalmology. 2007;114(10):1868–1875. doi:10.1016/j.ophtha.2007.04.030
7. Ross AH, Donachie PH, Sallam A, et al. Which visual acuity measurements define high-quality care for patients with neovascular age-related macular degeneration treated with ranibizumab? Eye (Lond). 2013;27(1):56–64. doi:10.1038/eye.2012.225
8. Roman AJ, Schwartz SB, Aleman TS, et al. Quantifying rod photoreceptor-mediated vision in retinal degenerations: dark-adapted thresholds as outcome measures. Exp Eye Res. 2005;80(2):259–272. doi:10.1016/j.exer.2004.09.008
9. Roman AJ, Cideciyan AV, Aleman TS, Jacobson SG. Full-field stimulus testing (FST) to quantify visual perception in severely blind candidates for treatment trials. Physiol Meas. 2007;28(8):N51–N56. doi:10.1088/0967-3334/28/8/N02
10. Collison FT, Fishman GA, McAnany JJ, Zernant J, Allikmets R. Psychophysical measurement of rod and cone thresholds in stargardt disease with full-field stimuli. Retina. 2014;34(9):1888–1895. doi:10.1097/IAE.0000000000000144
11. Dimopoulos IS, Freund PR, Knowles JA, MacDonald IM. The natural history of full-field stimulus threshold decline in choroideremia. Retina. 2018;38(9):1731–1742. doi:10.1097/IAE.0000000000001764
12. Stingl KT, Kuehlewein L, Weisschuh N, et al. Chromatic full-field stimulus threshold and pupillography as functional markers for late-stage, early-onset retinitis pigmentosa caused by CRB1 mutations. Transl Vis Sci Technol. 2019;8(6):45. doi:10.1167/tvst.8.6.45
13. Bowmaker JK, Dartnall HJ. Visual pigments of rods and cones in a human retina. J Physiol. 1980;298:501–511. doi:10.1113/jphysiol.1980.sp013097
14. Brown DM, Kaiser PK, Michels M, et al. Ranibizumab versus verteporfin for neovascular age-related macular degeneration. N Engl J Med. 2006;355(14):1432–1444. doi:10.1056/NEJMoa062655
15. Simader C, Ritter M, Bolz M, et al. Morphologic parameters relevant for visual outcome during anti-angiogenic therapy of neovascular age-related macular degeneration. Ophthalmology. 2014;121(6):1237–1245. doi:10.1016/j.ophtha.2013.12.029
16. Malet F, Le Goff M, Colin J, et al. Dry eye disease in French elderly subjects: the Alienor Study. Acta Ophthalmol. 2014;92(6):e429–436. doi:10.1111/aos.12174
17. DeCroos FC, Toth CA, Stinnett SS, et al. Optical coherence tomography grading reproducibility during the comparison of age-related macular degeneration treatments trials. Ophthalmology. 2012;119(12):2549–2557. doi:10.1016/j.ophtha.2012.06.040
18. Sayanagi K, Sharma S, Yamamoto T, Kaiser PK. Comparison of spectral-domain versus time-domain optical coherence tomography in management of age-related macular degeneration with ranibizumab. Ophthalmology. 2009;116(5):947–955. doi:10.1016/j.ophtha.2008.11.002
19. Folgar FA, Jaffe GJ, Ying GS, Maguire MG, Toth CA; Comparison of Age-Related Macular Degeneration Treatments Trials Research Group. Comparison of optical coherence tomography assessments in the comparison of age-related macular degeneration treatments trials. Ophthalmology. 2014;121(10):1956–1965. doi:10.1016/j.ophtha.2014.04.020
20. Jaffe GJ, Martin DF, Toth CA, et al. Macular morphology and visual acuity in the comparison of age-related macular degeneration treatments trials. Ophthalmology. 2013;120(9):1860–1870. doi:10.1016/j.ophtha.2013.01.073
21. Jaffe GJ, Ying GS, Toth CA, et al. Macular morphology and visual acuity in year five of the comparison of age-related macular degeneration treatments trials. Ophthalmology. 2018126:252–260.
22. Curcio CA, Medeiros NE, Millican CL. Photoreceptor loss in age-related macular degeneration. Invest Ophthalmol Vis Sci. 1996;37(7):1236–1249.
23. Muthiah MN, Gias C, Chen FK, et al. Cone photoreceptor definition on adaptive optics retinal imaging. Br J Ophthalmol. 2014;98(8):1073–1079. doi:10.1136/bjophthalmol-2013-304615
 © 2022 The Author(s). This work is published and licensed by Dove Medical Press Limited. The
full terms of this license are available at https://www.dovepress.com/terms
and incorporate the Creative Commons Attribution
- Non Commercial (unported, 3.0) License.
By accessing the work you hereby accept the Terms. Non-commercial uses of the work are permitted
without any further permission from Dove Medical Press Limited, provided the work is properly
attributed. For permission for commercial use of this work, please see paragraphs 4.2 and 5 of our Terms.
© 2022 The Author(s). This work is published and licensed by Dove Medical Press Limited. The
full terms of this license are available at https://www.dovepress.com/terms
and incorporate the Creative Commons Attribution
- Non Commercial (unported, 3.0) License.
By accessing the work you hereby accept the Terms. Non-commercial uses of the work are permitted
without any further permission from Dove Medical Press Limited, provided the work is properly
attributed. For permission for commercial use of this work, please see paragraphs 4.2 and 5 of our Terms.