Back to Journals » Pharmacogenomics and Personalized Medicine » Volume 14
CHN1 is a Novel Prognostic Marker for Diffuse Large B-Cell Lymphoma
Authors Sun J ![]() , Zhu X, Zhao Y, Zhou Q
, Zhu X, Zhao Y, Zhou Q ![]() , Qi R, Liu H
, Qi R, Liu H
Received 12 January 2021
Accepted for publication 15 March 2021
Published 1 April 2021 Volume 2021:14 Pages 397—408
DOI https://doi.org/10.2147/PGPM.S301718
Checked for plagiarism Yes
Review by Single anonymous peer review
Peer reviewer comments 2
Editor who approved publication: Dr Martin H Bluth
Jie Sun,1,2 Xiaoquan Zhu,3 Yanyang Zhao,3 Qi Zhou,3 Ruomei Qi,3 Hui Liu1,2
1Department of Hematology, Beijing Hospital, National Center of Gerontology, Institute of Geriatric Medicine, Chinese Academy of Medical Sciences, Beijing, People’s Republic of China; 2Graduate School of Peking Union Medical College, Chinese Academy of Medical Sciences, Beijing, People’s Republic of China; 3The Key Laboratory of Geriatrics, Beijing Hospital, National Center of Gerontology, Institute of Geriatric Medicine, Chinese Academy of Medical Sciences, Beijing, People’s Republic of China
Correspondence: Hui Liu
Department of Hematology, Beijing Hospital, National Center of Gerontology, Institute of Geriatric Medicine, Chinese Academy of Medical Sciences, No. 1 Dahua Road, Dongcheng District, Beijing, 100730, People’s Republic of China
Email [email protected]
Purpose: Diffuse large B-cell lymphoma (DLBCL) is the most common B-cell malignancy. Thirty to forty percent of DLBCL patients still experience relapse or develop refractory disease even with standard immunochemotherapy, leading to a poor prognosis. Currently, although several gene-based classification methods can be used to predict the prognosis of DLBCL, some patients are still unable to be classified. This study was performed to identify a novel prognostic biomarker for DLBCL.
Patients and Methods: A total of 1850 B-cell non-Hodgkin lymphoma (B-NHL) patients in 8 independent datasets with microarray gene expression profiles were retrieved from the Gene Expression Omnibus (GEO) database and Lymphoma/Leukemia Molecular Profiling Project (LLMPP). The candidate genes were selected through three filters in a strict pipeline. Survival analysis was performed in two independent datasets of patients with both gene expression data and clinical information. Gene set enrichment analysis (GSEA) and the CIBERSORT algorithm were used to explore the biological functions of the genes.
Results: We identified 6 candidate genes associated with the clinical outcome of DLBCL patients: CHN1, CD3D, CLU, ICOS, KLRB1 and LAT. Unlike the other five genes, CHN1 has not been previously reported to be implicated in lymphoma. We also observed that CHN1 had prognostic significance in important clinical subgroups; in particular, high CHN1 expression was significantly related to good outcomes in DLBCL patients with the germinal center B-cell-like (GCB) subtype, stage III–IV, or an International Prognostic Index (IPI) score > 2. Multivariate Cox regression analysis of the two datasets showed that CHN1 was an independent prognostic factor for DLBCL. Additionally, GSEA and CIBERSORT indicated that CHN1 was correlated with cell adhesion and T cell immune infiltration.
Conclusion: Our data indicate for the first time that high CHN1 expression is associated with favorable outcomes in DLBCL patients, suggesting its potential utility as a prognostic marker in DLBCL.
Keywords: CHN1, diffuse large B-cell lymphoma, prognosis, biomarker
Introduction
Diffuse large B-cell lymphoma (DLBCL) is the most common B-cell malignancy and accounts for 30%–40% of all non-Hodgkin’s lymphomas (NHLs).1 Although R-CHOP (rituximab, cyclophosphamide, doxorubicin, vincristine, and prednisone) improves the outcome of DLBCL, 30%–40% of patients will eventually relapse and develop refractory disease, with inferior prognoses.2–4 Therefore, an accurate evaluation of prognosis in advance is important to guide appropriate treatment.
The International Prognostic Index (IPI) is a popular tool for predicting survival in patients with DLBCL and includes five clinical indicators: age, Ann Arbor stage, serum lactate dehydrogenase, performance status, and a number of extranodal disease sites.5 However, the IPI cannot be used to accurately predict the clinical outcome of many patients6,7 or reflect the molecular heterogeneity of DLBCL.
Recently, researchers have attempted to explore genetic alterations and molecular heterogeneity for risk stratification and prognosis prediction in patients with DLBCL. Alizadeh et al first divided DLBCL into germinal center B-cell-like (GCB) and activated B-cell-like (ABC) subtypes by analyzing gene expression profiles, with a small unclassified group (10–15%).8 Patients with the ABC subtype had more unfavorable outcome than those with the GCB subtype following R-CHOP treatment, with a 5-year survival rate of 56% for patients with the ABC subtype and 78% for patients with the GCB subtype.9 Chapuy et al discovered five subsets of DLBCL (Cluster 1–5) with different coordinated genetic signatures and prognoses, but 4% of tumors were undefined.10 The coordinated genetic signature was an independent prognostic factor, of which C1 and C4 DLBCL had a better prognosis than C3 and C5. Wright et al developed the LymphGen algorithm to categorize DLBCL into seven genetic subtypes including MCD (MYD88L265P and CD79B mutations), N1 (NOTCH1 mutations), A53 (aneuploid with TP53 inactivation), BN2 (BCL6 translocations and NOTCH2 mutations), ST2 (SGK1 and TET2 mutations), EZB-MYC+ (EZB, EZH2 mutations and BCL2 translocations), and EZB-MYC−, and the remaining cases were classified as “other”. Patients with MCD had a poor prognosis, and patients with BN2 had a favorable prognosis.11,12 However, a proportion of patients still failed to be classified into a specific subtype according to the aforementioned classification, and it was difficult to predict prognosis in these patients. Overall, there remains a strong need to identify novel and easy-to-use prognostic markers for DLBCL.
In the present study, we comprehensively analyzed the gene expression profiles of B-cell non-Hodgkin lymphoma (B-NHL) patients from the Gene Expression Omnibus (GEO) database and Lymphoma/Leukemia Molecular Profiling Project (LLMPP). By applying three filters in a strict pipeline, we found that high CHN1 expression was associated with good overall survival in DLBCL, and thus characterized its clinical features and significance.
Patients and Methods
Data Collection
The microarray gene expression profiles of 1850 B-NHL patients in total were retrieved from the GEO database (http://www.ncbi.nlm.nih.gov/geo/) and LLMPP (http://llmpp.nih.gov). The GSE132929 dataset, which includes tumor tissue samples of follicular lymphoma (FL, n = 65), DLBCL (n = 95) and Burkitt lymphoma (BL, n = 59), was used as the discovery cohort to identify differentially expressed genes (DEGs). Five independent datasets of DLBCL (GSE34171, n = 91; GSE25638, n = 26), FL (GSE65135, n = 14; GSE93261, n = 147), and BL (LLMPP, n = 33) were used as testing cohorts to confirm the reproducibility of the DEGs. In addition, a total of 1332 DLBCL patients were included in the survival analysis and gene set enrichment analysis (GSEA) after excluding patients with no clinical data, including 414 patients from GSE10846 and 928 patients from GSE117556. All datasets except GSE117556, which was performed on the Illumina HumanHT-12 WG-DASL V4.0 R2 expression Beadchip, were performed on the Affymetrix Human Genome U133 Plus 2.0 Array. The details of all datasets are shown in Supplementary Table S1.
Data Processing
The raw data of the Affymetrix microarray were processed into clean data by using the “affy” R package. Data processing included RMA background correction, quantile normalization, log2 transformation, and median polishing algorithm summarization. The Series Matrix File format data of Illumina were normalized using the “lumi” R package. The data were annotated by converting the different probe IDs to gene IDs based on the platform annotation files. The batch effect of multiple microarrays in the integrated analysis was identified and removed using ComBat function in the “sva” R package. DEGs were identified using the “limma” R package.
The final candidate genes were selected by applying three filters of the strict pipeline (Figure 1). According to the ranking of aggressiveness of B-NHL, which from low to high is FL, DLBCL, and BL, the expression trends of the DEGs in the discovery cohort that were consistent or opposite to disease aggressiveness were screened out (Filter 1). The cutoff criteria for identifying DEGs were |log2fold change (FC)| > 1 and p < 0.05. Afterward, these DEG values were extracted in the testing cohorts to validate the reproducibility. Only the genes that displayed consistent trends in the discovery and testing cohorts were chosen for the next step (Filter 2), and the cutoff criteria were |log2FC| > 0.8 and p < 0.05.
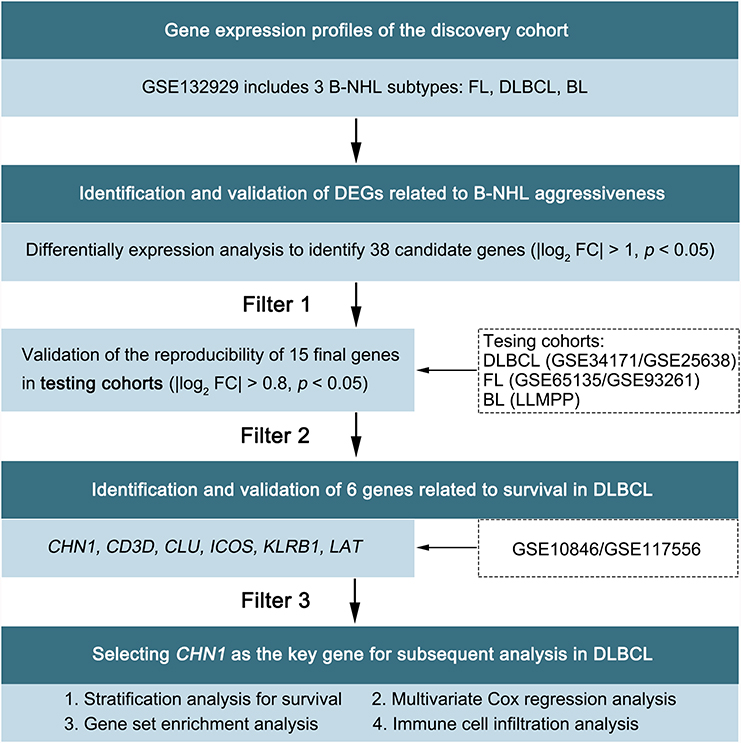 |
Figure 1 Study workflow. DEGs, differentially expressed genes; FC, fold change. |
Survival Analysis
Survival analysis was conducted to test the ability of the genes to predict the prognosis of DLBCL by using both the GSE10846 and GSE117556 datasets (Filter 3). Patients were categorized into high and low expression group based on the median value of gene expression. We utilized the “survival” R package to draw Kaplan–Meier survival curves and compared them using the Log rank test.
Gene Set Enrichment Analysis
GSEA (version 4.0.3) was used to analyze the enrichment of GO terms and KEGG pathways between the high and low CHN1 expression groups to investigate potential biological functions and enriched pathways. The c2.cp.kegg.v7.0.symbols and c5.bp.v7.0.symbols molecular signatures were used as the reference gene sets for analysis. The nominal p-value and normalized enrichment score (NES) were calculated to depict the enriched GO terms and KEGG pathways. The cutoff criteria were nominal p-value < 5% and |NES| > 1.
Immune Cell Infiltration Analysis
CIBERSORT, a deconvolution algorithm, is utilized to calculate the proportion of immune cells in tumors based on gene expression profiles. The LM6 gene signature was set as the reference profile for immune infiltration analysis. We compared the distribution of each immune cell between the high and low CHN1 expression groups using the Wilcoxon test.
Statistical Analysis
Multivariate Cox regression analyses were conducted to evaluate independent prognostic factors. Continuous variables were analyzed using Student’s t-test or the Mann–Whitney U-test. Categorical variables were analyzed using Fisher’s exact test. All statistical analyses were performed via SPSS version 25 (IBMCorp., Armonk, N.Y., USA) and R software version 3.6.1 (R core Team, Vienna, Austria). A value of p < 0.05 was considered statistically significant.
Results
Identification and Validation of DEGs Related to B-NHL Aggressiveness
B-NHL mainly encompasses indolent FL, aggressive DLBCL, and highly aggressive BL according to the clinical course of disease. Given that aggressive lymphoma characteristics typically indicate a poor prognosis,13–18 we analyzed the gene expression profiles of FL (n = 65), DLBCL (n = 95), and BL (n = 59) patients from the GSE132929 dataset as a discovery cohort to identify DEGs. A total of 38 DEGs were obtained (Figure 2A), and we further confirmed the reproducibility of these DEGs in the additional five testing cohorts, including 311 B-NHL patients from the GSE34171, GSE25638, GSE65135, GSE93261 and LLMPP. Only 15 of the 38 genes displayed a trend consistent with the results of the discovery cohort (Figure 2B, Supplementary Table S2), of which 14 were gradually increased in highly aggressive BL, aggressive DLBCL and indolent FL, and 1 exhibited the opposite trend.
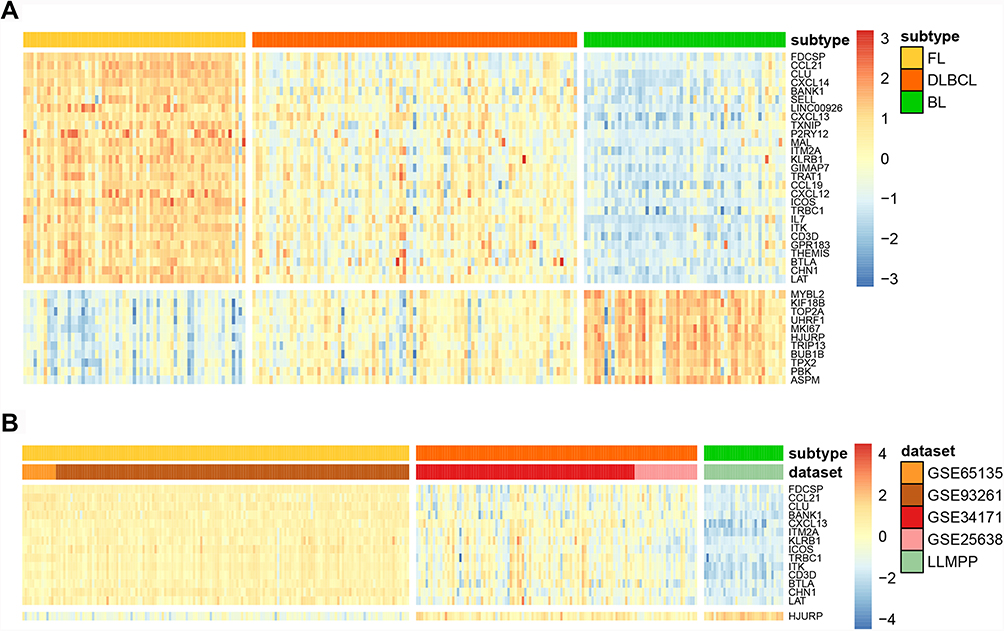 |
Figure 2 Identification and validation of DEGs related to lymphoma aggressiveness. (A) Heatmap of 38 DEGs in the discovery cohort (GSE132929). (B) Heatmap of 15 DEGs in the testing cohorts. Each column represents a sample, and each row represents the gene expression level. Low expression is marked in blue, and high expression is marked in red. |
Identification and Validation of 6 Genes Related to Survival in DLBCL Patients
Then, we conducted survival analysis to explore the prognostic value of the 15 genes in DLBCL patients. The clinical information of 414 patients from GSE10846 and 928 patients from GSE117556 are summarized in Supplementary Table S3. Six genes, namely, CHN1, CD3D, CLU, ICOS, KLRB1 and LAT, were identified to be associated with overall survival (OS). Kaplan–Meier curves showed that the high expression of these genes was correlated with a prolonged survival time in both GSE10846 (Figure 3A–F, p < 0.05) and GSE117556 (Figure 3G–L, p < 0.05).
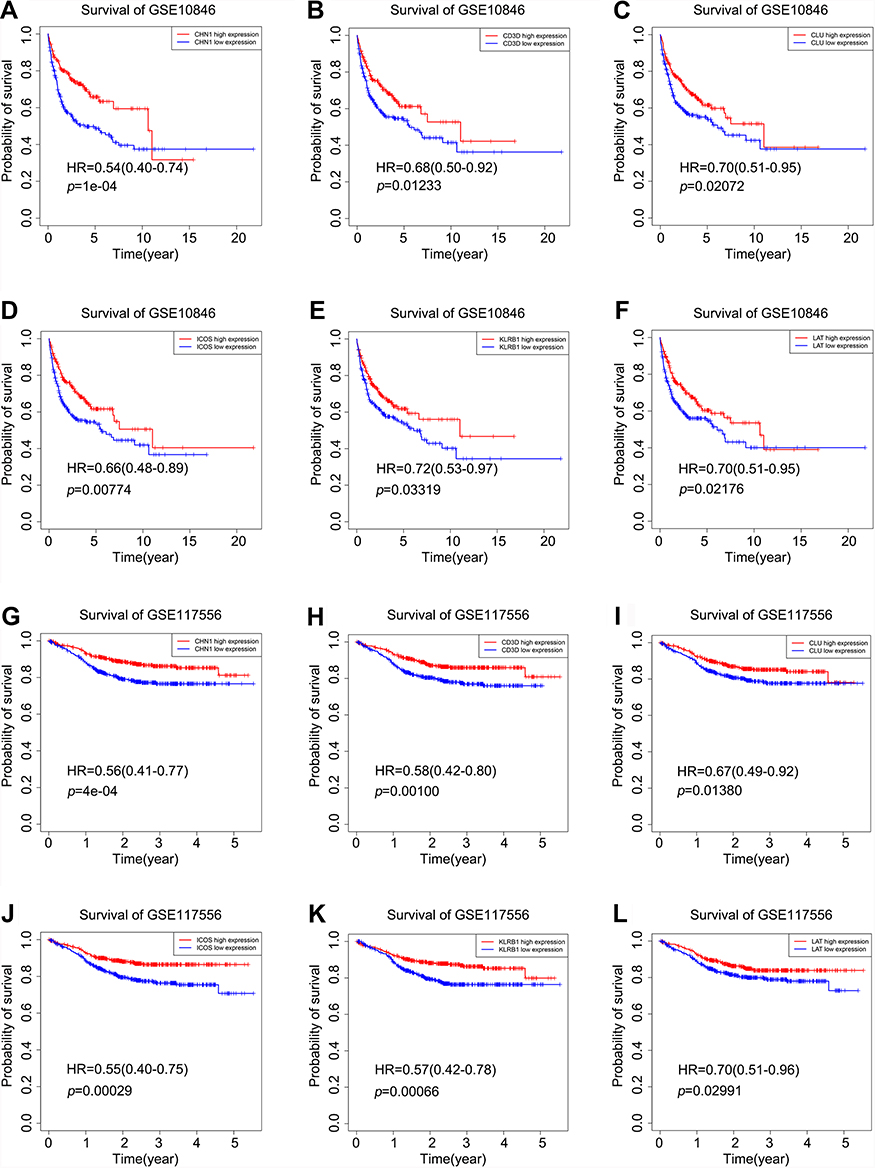 |
Figure 3 The prognostic significance of CHN1, CD3D, CLU, ICOS, KLRB1 and LAT in DLBCL. Kaplan–Meier curves of OS between the high and low expression groups in GSE10846 and GSE117556 stratified by 6 genes: (A, G) stratified by CHN1, (B, H) stratified by CD3D, (C, I) stratified by CLU, (D, J) stratified by ICOS, (E, K) stratified by KLRB1, and (F, L) stratified by LAT. Low expression is marked in blue, and high expression is marked in red. The p-values were calculated using the Log rank test. |
CD3D, CLU, ICOS, KLRB1 and LAT appear to be prognostic factors in a range of malignancies, such as B-NHL,19,20 colorectal cancer,21,22 ovarian cancer,23 bladder cancer,24 breast cancer,25,26 cervical cancer,27 and lung cancer,28–31 and play important roles in lymphoma development.32–36 Of note, the role and prognostic value of CHN1 in B-NHL have never been reported before, so we focused our attention on CHN1 in this study.
Correlations Between CHN1 Expression and Clinical Characteristics of DLBCL
We investigated the difference in the distribution of clinical characteristics between the high and low CHN1 expression groups. There were obvious differences in the distribution of molecular subtype and Eastern Cooperative Oncology Group (ECOG) performance status in the GSE10846 dataset (Figure 4A); 99 (63.1%) and 130 (82.8%) patients with high CHN1 expression were assigned to the GCB subtype and had a good ECOG performance status (ECOG < 1), respectively (Figure 4B–C, p < 0.05, and Supplementary Table S4). However, there were no significant differences between CHN1 expression and clinical features stratified by age, stage, or the IPI (p > 0.05). We also confirmed that the majority of patients with CHN1 overexpression in GSE117556 had the GCB subtype and an ECOG score less than 1 (Supplementary Figure S1 and Table S4). These results revealed that CHN1 expression was significantly correlated with the molecular subtype and performance status in DLBCL patients.
 |
Figure 4 The correlation between CHN1 expression and clinical features in GSE10846. (A) Association between clinical features and CHN1 expression. (B, C) Distribution of CHN1 expression in patients stratified by the molecular subtype and ECOG performance status. |
Evaluation of CHN1 Expression in Important Clinical Subgroups of DLBCL
DLBCL is divided into two important molecular subtypes: GCB and ABC. Patients with different subtypes have distinct prognoses. Therefore, we evaluated the prognostic value of CHN1 in different molecular subtypes of DLBCL. The results revealed that a high expression level of CHN1 was significantly related to good outcomes in patients with the GCB subtype in GSE10846 (Figure 5A, HR = 0.46 [0.26–0.80], p < 0.01) and GSE117556 (Figure 5C, HR = 0.37 [0.23–0.59], p < 0.001). Similarly, there was a trend toward favorable prognosis for those with the ABC subtype (Figure 5B and D), but the difference was not statistically significant.
 |
Figure 5 The prognostic significance of CHN1 in important clinical subgroups of DLBCL. Kaplan–Meier curves of overall survival (OS) in the high CHN1 expression and low expression groups in GSE10846 and GSE117556 with different DLBCL subtypes (A–D), different stages (F–H), and different IPI scores (I–J). |
The prognosis of patients with advanced tumor stages is different from that of patients with early stages. The Kaplan–Meier curve showed a clear distinction between good and poor outcomes in stage I–II patients according to the expression level of CHN1 (Figure 5E and G). Furthermore, elevated expression of CHN1 was significantly associated with a prolonged survival time of stage III–IV patients in GSE10846 (Figure 5F, HR = 0.47 [0.32–0.69], p < 0.001) and GSE117556 (Figure 5H, HR = 0.55 [0.38–0.78], p < 0.01).
We additionally investigated the prognostic value of CHN1 in subgroups stratified by the International Prognostic Index (IPI) score, which is a routine prognostic tool for DLBCL. It was also found that the overexpression of CHN1 contributed to a favorable survival time in patients with an IPI > 2 (Figure 5I and J).
Taken together, these results indicate that CHN1 expression-based classification could aid in predicting the outcomes of DLBCL patients regardless of the molecular subtype, tumor stage and IPI.
CHN1 Expression is an Independent Prognostic Factor for DLBCL Patients
Multivariate Cox regression analysis in GSE10846 showed that the expression of CHN1 was independently correlated with OS (Table 1, HR = 0.643 [0.518–0.798], p < 0.0001). Consistent with these findings, CHN1 expression was also validated as an independent factor in GSE117556 (Table 1, HR = 0.541 [0.409–0.716], p < 0.0001). This finding implies the potential ability of CHN1 to predict the outcomes of patients independently.
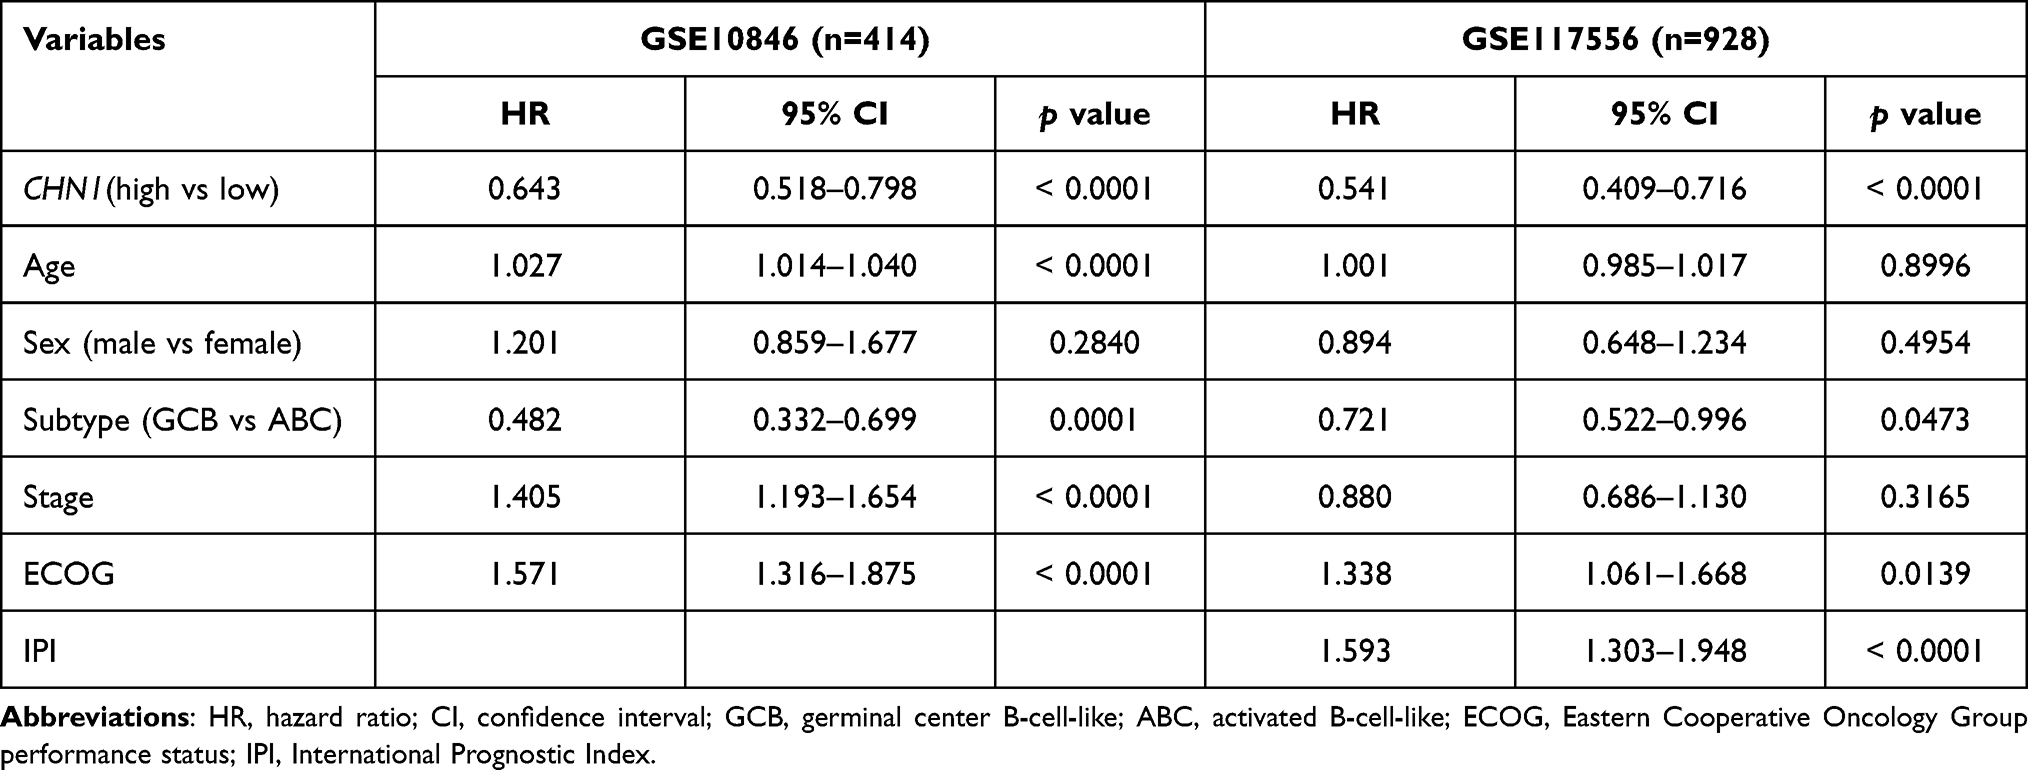 |
Table 1 Multivariable Cox Regression Analyses of CHN1 in GSE10846 and GSE117556 |
Exploration of the Potential Biological Functions of CHN1
To better understand the biological functions of CHN1, we performed GSEA to identify significantly enriched GO terms and KEGG pathways (nominal p-value < 0.05). The high CHN1 expression phenotype was significantly enriched in GO terms including the positive regulation of T cell cytokine production and positive regulation of T helper 1 type immune response (Figure 6A and B) and KEGG pathways including cell adhesion molecules (CAMs) and the hematopoietic cell lineage (Figure 6C and D, and Supplementary Figure S2). Therefore, we speculate that CHN1 expression is closely related to T cell immunity and cell adhesion in DLBCL.
 |
Figure 6 The potential biological functions of CHN1. (A–D) Enrichment plots from GSEA in GSE10846. Significantly enriched GO terms (A, B) and KEGG pathways (C, D) in the high CHN1 expression group. (E, F) The proportion of immune infiltrating cells in the high CHN1 expression and low expression groups in GSE10846 (E) and GSE117556 (F). |
Accordingly, we explored whether CHN1 expression was related to immune cell infiltration by using CIBERSORT and the LM6 signature reference profile. Interestingly, we found that the proportion of CD4+ T cells was increased in patients with high CHN1 expression, and CD8+ T cells followed the same trend in both GSE10846 and GSE117556 (Figure 6E and F).
Discussion
We compared the gene expression profiles of FL, DLBCL and BL patients longitudinally to identify DEGs and found for the first time that high CHN1 expression is correlated with a prolonged survival time in DLBCL. CHN1 is located on chromosome 2q31 and encodes the protein α2-chimerin,37–39 which is a rac guanosine triphosphatase activating protein (racGAP) that is predominantly expressed in neurons, especially in the cerebral cortex, and plays an important role in axon guidance.40 Recent research on CHN1 has mainly focused on Duane syndrome,41,42 and few studies on tumors, especially lymphoma, have been reported.43
Here, we observed that the expression of CHN1 gradually increased from highly aggressive BL to indolent FL and was inversely correlated with the aggressiveness of B-NHL. Then, we explored the difference in the distribution of clinical characteristics between the high and low CHN1 expression groups and found that the majority of patients with CHN1 overexpression were assigned to the GCB subtype rather than ABC subtype. ABC subtype is characterized by mutations in the B cell receptor and Toll-like receptor pathways, as well as NF-κB pathway.44,45 As for GCB subtype, oncogenic PI3K/AKT activation is a mutational pathway.46 Interestingly, the findings of GSEA revealed that high CHN1 expression phenotype was significantly enriched in PI3K pathway in both GSE10846 and GSE117556 (Supplementary Figure S3). Accordingly, these results suggest that high CHN1 expression is involved in PI3K/AKT pathway in GCB subtype of DLBCL. However, further experiments are needed to directly test this hypothesis.
Furthermore, our data showed that the high expression phenotype of CHN1 was significantly enriched in the regulation of cell adhesion and the immune response, as well as with high infiltrating levels of CD8+ and CD4+ T cells. Combined with previous analyses, we speculate that the overexpression of CHN1 acts as a protective factor and might be associated with a high degree of infiltration by CD8+ and CD4+ T cells. Some studies have suggested that the paucity of CD4+ T and CD8+ T cell infiltration is related to poor survival in B-NHL patients,47–49 which is in accordance with our findings. However, we also acquired a contradictory result: the expression of CHN1 was positively correlated with monocyte infiltration, which should be inferred as a predictor of a favorable outcome, but several studies have shown that increased monocyte/macrophage infiltration correlates with a poor prognosis.50–53 This inconsistent issue has yet to be interpreted deeply, and further research is needed.
In our study, several limitations await to be addressed. First, this was a retrospective study, and more prospective studies are needed to confirm our results. Second, the prognostic value of CHN1 must be validated in real clinical samples. Third, further experiments exploring the role of CHN1 in the proliferation and invasion of lymphoma cells remain to be conducted.
Conclusion
In conclusion, we found that CHN1 expression was an independent prognostic factor and had prognostic ability in important clinical subgroups. We believe that CHN1 can be a convincing marker to predict the prognosis of DLBCL.
Abbreviations
GSEA, Gene Set Expression Analysis; NHL, Non-Hodgkin lymphoma; B-NHL, B-cell non-Hodgkin lymphoma; FL, follicular lymphoma; DLBCL, diffuse large B-cell lymphoma; BL, burkitt lymphoma; GEO, Gene Expression Omnibus; LLMPP, Lymphoma/Leukemia Molecular Profiling Project; DEGs, differentially expressed genes; ECOG, Eastern Cooperative Oncology Group performance status; GCB, germinal center B-cell-like; ABC, activated B-cell-like; IPI, International Prognostic Index.
Data Sharing Statement
The datasets analyzed in this study are available in the GEO database (http://www.ncbi.nlm.nih.gov/geo/) and LLMPP (http://llmpp.nih.gov).
Funding
This work was supported by grants from the Beijing Committee of Science and Technology (No. Z181100001718162).
Disclosure
The authors declare that they have no competing interests.
References
1. Swerdlow SH, Campo E, Pileri SA, et al. The 2016 revision of the World Health Organization classification of lymphoid neoplasms. Blood. 2016;127(20):2375–2390. doi:10.1182/blood-2016-01-643569
2. Zhang J, Grubor V, Love CL, et al. Genetic heterogeneity of diffuse large B-cell lymphoma. Proc Natl Acad Sci U S A. 2013;110(4):1398–1403. doi:10.1073/pnas.1205299110
3. Wang Y, Farooq U, Link BK, et al. Late relapses in patients with diffuse large B-cell lymphoma treated with immunochemotherapy. J Clin Oncol. 2019;37(21):1819–1827. doi:10.1200/JCO.19.00014
4. Tanimura A, Hirai R, Nakamura M, Takeshita M, Hagiwara S, Miwa A. The prognostic impact of dose-attenuated R-CHOP therapy for elderly patients with diffuse large B-cell Lymphoma. Intern Med. 2018;57(24):3521–3528. doi:10.2169/internalmedicine.0990-18
5. International Non-Hodgkin’s Lymphoma Prognostic Factors P. A predictive model for aggressive non-Hodgkin’s lymphoma. N Engl J Med. 1993;329(14):987–994. doi:10.1056/NEJM199309303291402
6. Vallet N, Ertault M, Delaye JB, et al. Hypercalcemia is associated with a poor prognosis in lymphoma a retrospective monocentric matched-control study and extensive review of published reported cases. Ann Hematol. 2020;99(2):229–239. doi:10.1007/s00277-019-03890-w
7. Sehn LH, Scott DW, Chhanabhai M, et al. Impact of concordant and discordant bone marrow involvement on outcome in diffuse large B-cell lymphoma treated with R-CHOP. J Clin Oncol. 2011;29(11):1452–1457. doi:10.1200/JCO.2010.33.3419
8. Alizadeh AA, Eisen MB, Davis RE, et al. Distinct types of diffuse large B-cell lymphoma identified by gene expression profiling. Nature. 2000;403(6769):503–511. doi:10.1038/35000501
9. Scott DW, Mottok A, Ennishi D, et al. Prognostic significance of diffuse large b-cell lymphoma cell of origin determined by digital gene expression in formalin-fixed paraffin-embedded tissue biopsies. J Clin Oncol. 2015;33(26):2848–2856. doi:10.1200/JCO.2014.60.2383
10. Chapuy B, Stewart C, Dunford AJ, et al. Molecular subtypes of diffuse large B cell lymphoma are associated with distinct pathogenic mechanisms and outcomes. Nat Med. 2018;24(5):679–690. doi:10.1038/s41591-018-0016-8
11. Schmitz R, Wright GW, Huang DW, et al. Genetics and Pathogenesis of Diffuse Large B-Cell Lymphoma. N Engl J Med. 2018;378(15):1396–1407. doi:10.1056/NEJMoa1801445
12. Wright GW, Huang DW, Phelan JD, et al. A probabilistic classification tool for genetic subtypes of diffuse large B cell lymphoma with therapeutic implications. Cancer Cell. 2020;37(4):551–568 e514. doi:10.1016/j.ccell.2020.03.015
13. Al-Tourah AJ, Gill KK, Chhanabhai M, et al. Population-based analysis of incidence and outcome of transformed non-Hodgkin’s lymphoma. J Clin Oncol. 2008;26(32):5165–5169. doi:10.1200/JCO.2008.16.0283
14. Bastion Y, Sebban C, Berger F, et al. Incidence, predictive factors, and outcome of lymphoma transformation in follicular lymphoma patients. J Clin Oncol. 1997;15(4):1587–1594. doi:10.1200/JCO.1997.15.4.1587
15. Link BK, Maurer MJ, Nowakowski GS, et al. Rates and outcomes of follicular lymphoma transformation in the immunochemotherapy era: a report from the University of Iowa/mayoclinic specialized program of research excellence molecular epidemiology resource. J Clin Oncol. 2013;31(26):3272–3278. doi:10.1200/JCO.2012.48.3990
16. Montoto S, Davies AJ, Matthews J, et al. Risk and clinical implications of transformation of follicular lymphoma to diffuse large B-cell lymphoma. J Clin Oncol. 2007;25(17):2426–2433. doi:10.1200/JCO.2006.09.3260
17. Sarkozy C, Trneny M, Xerri L, et al. Risk factors and outcomes for patients with follicular lymphoma who had histologic transformation after response to first-line immunochemotherapy in the PRIMA trial. J Clin Oncol. 2016;34(22):2575–2582. doi:10.1200/JCO.2015.65.7163
18. Wagner-Johnston ND, Link BK, Byrtek M, et al. Outcomes of transformed follicular lymphoma in the modern era: a report from the National LymphoCare Study (NLCS). Blood. 2015;126(7):851–857. doi:10.1182/blood-2015-01-621375
19. Gao Y, Sun B, Hu J, et al. Identification of gene modules associated with survival of diffuse large B-cell lymphoma treated with CHOP-based chemotherapy. Pharmacogenomics J. 2020;20(5):705–716. doi:10.1038/s41397-020-0161-6
20. Guo D, Wang H, Sun L, et al. Identification of key gene modules and hub genes of human mantle cell lymphoma by coexpression network analysis. PeerJ. 2020;8:e8843. doi:10.7717/peerj.8843
21. Zhang Y, Luo Y, Qin SL, et al. The clinical impact of ICOS signal in colorectal cancer patients. Oncoimmunology. 2016;5(5):e1141857. doi:10.1080/2162402X.2016.1141857
22. Artemaki PI, Sklirou AD, Kontos CK, et al. High clusterin (CLU) mRNA expression levels in tumors of colorectal cancer patients predict a poor prognostic outcome. Clin Biochem. 2020;75:62–69. doi:10.1016/j.clinbiochem.2019.10.008
23. Yang GF, Li XM, Xie D. Overexpression of clusterin in ovarian cancer is correlated with impaired survival. Int J Gynecol Cancer. 2009;19(8):1342–1346. doi:10.1111/IGC.0b013e3181a83ed9
24. Hazzaa SM, Elashry OM, Afifi IK. Clusterin as a diagnostic and prognostic marker for transitional cell carcinoma of the bladder. Pathol Oncol Res. 2010;16(1):101–109. doi:10.1007/s12253-009-9196-3
25. Gyorffy B, Bottai G, Fleischer T, et al. Aberrant DNA methylation impacts gene expression and prognosis in breast cancer subtypes. Int J Cancer. 2016;138(1):87–97. doi:10.1002/ijc.29684
26. Zhang S, Zhang D, Zhu Y, Guo H, Zhao X, Sun B. Clusterin expression and univariate analysis of overall survival in human breast cancer. Technol Cancer Res Treat. 2006;5(6):573–578. doi:10.1177/153303460600500604
27. Watari H, Kanuma T, Ohta Y, et al. Clusterin expression inversely correlates with chemosensitivity and predicts poor survival in patients with locally advanced cervical cancer treated with cisplatin-based neoadjuvant chemotherapy and radical hysterectomy. Pathol Oncol Res. 2010;16(3):345–352. doi:10.1007/s12253-009-9235-0
28. Albert JM, Gonzalez A, Massion PP, et al. Cytoplasmic clusterin expression is associated with longer survival in patients with resected non small cell lung cancer. Cancer Epidemiol Biomarkers Prev. 2007;16(9):1845–1851. doi:10.1158/1055-9965.EPI-07-0146
29. Braud VM, Biton J, Becht E, et al. Expression of LLT1 and its receptor CD161 in lung cancer is associated with better clinical outcome. Oncoimmunology. 2018;7(5):e1423184. doi:10.1080/2162402X.2017.1423184
30. Gentles AJ, Newman AM, Liu CL, et al. The prognostic landscape of genes and infiltrating immune cells across human cancers. Nat Med. 2015;21(8):938–945. doi:10.1038/nm.3909
31. Liu X, Wu S, Yang Y, Zhao M, Zhu G, Hou Z. The prognostic landscape of tumor-infiltrating immune cell and immunomodulators in lung cancer. Biomed Pharmacother. 2017;95:55–61. doi:10.1016/j.biopha.2017.08.003
32. Ramezani S, Shirdel A, Rafatpanah H, et al. Assessment of HTLV-1 proviral load, LAT, BIM, c-FOS and RAD51 gene expression in adult T cell leukemia/lymphoma. Med Microbiol Immunol. 2017;206(4):327–335. doi:10.1007/s00430-017-0506-1
33. Gilles SR, Yohe SL, Linden MA, Dolan M, Hirsch B, Grzywacz B. CD161 is expressed in a subset of T-cell prolymphocytic leukemia cases and is useful for disease follow-up. Am J Clin Pathol. 2019;152(4):471–478. doi:10.1093/ajcp/aqz060
34. Nascimento AF, Pinkus JL, Pinkus GS. Clusterin, a marker for anaplastic large cell lymphoma immunohistochemical profile in hematopoietic and nonhematopoietic malignant neoplasms. Am J Clin Pathol. 2004;121(5):709–717. doi:10.1309/GQ2RLNDWLB9WY6UU
35. Le KS, Thibult ML, Just-Landi S, et al. Follicular B lymphomas generate regulatory T cells via the ICOS/ICOSL pathway and are susceptible to treatment by anti-ICOS/ICOSL Therapy. Cancer Res. 2016;76(16):4648–4660. doi:10.1158/0008-5472.CAN-15-0589
36. Kanderova V, Kuzilkova D, Stuchly J, et al. High-resolution Antibody Array Analysis of Childhood Acute Leukemia Cells. Mol Cell Proteomics. 2016;15(4):1246–1261. doi:10.1074/mcp.M115.054593
37. Evans JC, Frayling TM, Ellard S, Gutowski NJ. Confirmation of linkage of Duane’s syndrome and refinement of the disease locus to an 8.8-cM interval on chromosome 2q31. Hum Genet. 2000;106(6):636–638. doi:10.1007/s004390000311
38. Appukuttan B, Gillanders E, Juo SH, et al. Localization of a gene for Duane retraction syndrome to chromosome 2q31. Am J Hum Genet. 1999;65(6):1639–1646. doi:10.1086/302656
39. Engle EC, Andrews C, Law K, Demer JL. Two pedigrees segregating Duane’s retraction syndrome as a dominant trait map to the DURS2 genetic locus. Invest Ophthalmol Vis Sci. 2007;48(1):189–193. doi:10.1167/iovs.06-0631
40. Clark C, Austen O, Poparic I, Guthrie S. alpha2-Chimaerin regulates a key axon guidance transition during development of the oculomotor projection. J Neurosci. 2013;33(42):16540–16551. doi:10.1523/JNEUROSCI.1869-13.2013
41. Miyake N, Demer JL, Shaaban S, et al. Expansion of the CHN1 strabismus phenotype. Invest Ophthalmol Vis Sci. 2011;52(9):6321–6328. doi:10.1167/iovs.11-7950
42. Miyake N, Chilton J, Psatha M, et al. Human CHN1 mutations hyperactivate alpha2-chimaerin and cause Duane’s retraction syndrome. Science. 2008;321(5890):839–843. doi:10.1126/science.1156121
43. Couch G, Redman JE, Wernisch L, et al. The discovery and validation of biomarkers for the diagnosis of esophageal squamous dysplasia and squamous cell carcinoma. Cancer Prev Res. 2016;9(7):558–566. doi:10.1158/1940-6207.CAPR-15-0379
44. Miyazaki K, Yamaguchi M, Imai H, et al. Gene expression profiling of diffuse large B-Cell lymphomas supervised by CD5 expression. Int J Hematol. 2015;102(2):188–194. doi:10.1007/s12185-015-1812-2
45. Testoni M, Zucca E, Young KH, Bertoni F. Genetic lesions in diffuse large B-cell lymphomas. Ann Oncol. 2015;26(6):1069–1080. doi:10.1093/annonc/mdv019
46. Pfeifer M, Grau M, Lenze D, et al. PTEN loss defines a PI3K/AKT pathway-dependent germinal center subtype of diffuse large B-cell lymphoma. Proc Natl Acad Sci U S A. 2013;110(30):12420–12425. doi:10.1073/pnas.1305656110
47. Wahlin BE, Sander B, Christensson B, Kimby E. CD8+ T-cell content in diagnostic lymph nodes measured by flow cytometry is a predictor of survival in follicular lymphoma. Clin Cancer Res. 2007;13(2 Pt 1):388–397. doi:10.1158/1078-0432.CCR-06-1734
48. Xu-Monette ZY, Xiao M, Au Q, et al. Immune profiling and quantitative analysis decipher the clinical role of immune-checkpoint expression in the tumor immune microenvironment of DLBCL. Cancer Immunol Res. 2019;7(4):644–657. doi:10.1158/2326-6066.CIR-18-0439
49. Dave SS, Wright G, Tan B, et al. Prediction of survival in follicular lymphoma based on molecular features of tumor-infiltrating immune cells. N Engl J Med. 2004;351(21):2159–2169. doi:10.1056/NEJMoa041869
50. Noyori O, Komohara Y, Nasser H, et al. Expression of IL-34 correlates with macrophage infiltration and prognosis of diffuse large B-cell lymphoma. Clin Transl Immunol. 2019;8(8):e1074. doi:10.1002/cti2.1074
51. Marchesi F, Cirillo M, Bianchi A, et al. High density of CD68+/CD163+ tumour-associated macrophages (M2-TAM) at diagnosis is significantly correlated to unfavorable prognostic factors and to poor clinical outcomes in patients with diffuse large B-cell lymphoma. Hematol Oncol. 2015;33(2):110–112. doi:10.1002/hon.2142
52. Cai QC, Liao H, Lin SX, et al. High expression of tumor-infiltrating macrophages correlates with poor prognosis in patients with diffuse large B-cell lymphoma. Med Oncol. 2012;29(4):2317–2322. doi:10.1007/s12032-011-0123-6
53. Wang J, Gao K, Lei W, et al. Lymphocyte-to-monocyte ratio is associated with prognosis of diffuse large B-cell lymphoma: correlation with CD163 positive M2 type tumor-associated macrophages, not PD-1 positive tumor-infiltrating lymphocytes. Oncotarget. 2017;8(3):5414–5425. doi:10.18632/oncotarget.14289
 © 2021 The Author(s). This work is published and licensed by Dove Medical Press Limited. The
full terms of this license are available at https://www.dovepress.com/terms
and incorporate the Creative Commons Attribution
- Non Commercial (unported, 3.0) License.
By accessing the work you hereby accept the Terms. Non-commercial uses of the work are permitted
without any further permission from Dove Medical Press Limited, provided the work is properly
attributed. For permission for commercial use of this work, please see paragraphs 4.2 and 5 of our Terms.
© 2021 The Author(s). This work is published and licensed by Dove Medical Press Limited. The
full terms of this license are available at https://www.dovepress.com/terms
and incorporate the Creative Commons Attribution
- Non Commercial (unported, 3.0) License.
By accessing the work you hereby accept the Terms. Non-commercial uses of the work are permitted
without any further permission from Dove Medical Press Limited, provided the work is properly
attributed. For permission for commercial use of this work, please see paragraphs 4.2 and 5 of our Terms.