Back to Journals » Cancer Management and Research » Volume 10
Checkpoint molecule PD-1-assisted CD8+ T lymphocyte count in tumor microenvironment predicts overall survival of patients with metastatic renal cell carcinoma treated with tyrosine kinase inhibitors
Authors Yao J, Xi W, Zhu Y, Wang H, Hu X, Guo J
Received 23 April 2018
Accepted for publication 28 June 2018
Published 11 September 2018 Volume 2018:10 Pages 3419—3431
DOI https://doi.org/10.2147/CMAR.S172039
Checked for plagiarism Yes
Review by Single anonymous peer review
Peer reviewer comments 3
Editor who approved publication: Dr Antonella D'Anneo
Jiaxi Yao,* Wei Xi,* Yanjun Zhu, Hang Wang, Xiaoyi Hu, Jianming Guo
Department of Urology, Zhongshan Hospital, Fudan University, Shanghai, China
*These authors contributed equally to this work
Purpose: The aim of this study was to determine whether CD8+ T lymphocyte and its checkpoint-associated module programmed cell death protein 1 (PD-1)/main ligand of PD-1 (PD-L1) pathway impact overall survival (OS) in patients with metastatic renal cell carcinoma (mRCC) treated with tyrosine kinase inhibitors (TKIs).
Materials and methods: A total of 231 mRCC patients, from 2007 to 2017, treated with sunitinib or sorafenib in Zhongshan Hospital, Fudan University were included in the study analyses. CD8, PD-1, and PD-L1 was assessed by immunohistochemistry on continuous paraffin-embedded slides. Kaplan–Meier method and COX regression model were applied in the survival analyses.
Results: Baseline characteristics were comparable between the training (n=118) and validation (n=113) sets. Patients with high CD8+ T lymphocytes infiltration and low PD-1 expression had longer survival in both sets (P=0.0106 and P=0.0047 in training set, P=0.0291 and P=0.0011 in validation set, respectively). However, survival stratified by PD-L1 was only insignificant or marginally significant. Multivariable analyses verified that CD8+ T lymphocytes, together with PD-1, but not tumor infiltrating mononuclear cells or tumor cells PD-L1, were independent prognostic factors (training set [HR 3.202, 95% CI 1.433–7.153, P=0.011] and validation set [HR 4.012, 95% CI 2.354–6.838, P<0.001]). Subsequent analysis revealed that the PD-1 high/CD8 low group had shorter survival (16 months) than PD-1 low/CD8 high group (51 months, P<0.0001). Combining the International Metastatic Renal Cancer Database Consortium system with the PD-1/CD8 model exhibited much better accuracy for the prediction of OS.
Conclusion: Our findings suggest that abundant CD8+ T cells are significantly associated with longer OS in mRCC patients treated with TKIs. The most influential checkpoint-associated molecule, PD-1, assisted CD8+ T cell-stratified patients and could be used as a better predictive and prognostic factor for the mRCC patients.
Keywords: metastatic renal cell carcinoma, tyrosine kinase inhibitors, immune checkpoint, prognostic factor
Introduction
Renal cell carcinoma (RCC) is the second most common malignancy in the urinary system. The incidence and mortality of RCC seem to be rising, resulting in >14,970 deaths every year because of metastatic disease. The morbidity of RCC is twice in men compared with women.1 About 30% of the patients have metastatic disease at the time of diagnosis of RCC which results in poorer overall survival (OS) of the patients.2 The diagnosis of RCC is usually performed by ultrasonography, computed tomography (CT) scan, and MRI.3 Despite recent major progress in therapeutic strategies, including surgery, and targeted molecular therapies, the long-term survival remains poor due to distant metastases. Tyrosine kinase inhibitors (TKIs), targeting vascular endothelial growth factor (VEGF) signaling, are recommended as first-line systemic treatment for metastatic renal cell carcinoma (mRCC) patients, which has shown remarkably prolonged patient survival.4 Few models were developed to assess the prognostic factors for OS in patients with mRCC treated with TKIs.5
Tumor infiltrating lymphocytes (TILs), CD8+ T cells play a major role in tumor immune responses and are considered to have anticancer activity. Furthermore, it has been shown to be the most important prognostic factor in different solid tumors.6,7 A study by Weiss et al reported that CD8+ T cells infiltration was associated with long-term survival in patients with RCC.8 Although Nakano et al for the first time demonstrated a negative impact of CD8+ T cells, they found that Ki67+/CD8+ T cell, representing the proliferative CD8+ T cell, had protective effects.9
Programmed cell death protein 1 (PD-1) is a cell surface receptor molecule on the activated TILs, which interact with tumor cells (TC) and are involved in tumor-specific immune responses.10 PD-L1, the main ligand of PD-1, is expressed in peripheral tissues, including the tumor. In proinflammatory conditions, the molecular interaction between PD-1 and PD-L1 induces a co-inhibitory signal and decreases the level of cytokines, which subsequently results in the apoptosis of the effector T lymphocytes. This function can be translated into resistance to immunotherapy or TKIs.11 Therefore, T cell exhaustion/inhibition greatly impairs antitumor immunity and plays an important role in cancer progression. In the regulation of antitumor cytotoxicity of T cells, checkpoint-associated molecules PD-1 and its ligand (PD-1/PD-L1) pathway was best elaborated. Meanwhile, this pathway also showed significant value in TKI resistance.12,13 Therefore, our study determines whether CD8+ T lymphocyte and its checkpoint-associated module PD-1/PD-L1 pathway impact OS in patients with mRCC treated with TKIs.
Materials and methods
Patient selection
A total of 250 mRCC patients treated with sunitinib or sorafenib at Zhongshan Hospital, Fudan University between 2007 and 2017 were retrospectively reviewed. Of these, 19 patients were excluded for inadequate clinicopathological or follow-up data. The study was officially approved by the Ethics Committee of Zhongshan Hospital and written informed consent was obtained from each patient. The baseline characteristics were acquired from the medical records.
Evaluation
Initial disease stage was ascertained following the eighth Union for International Cancer Control TNM edition classification criteria.14 According to the International Society of Urological Pathology grading system (2016), the archived H&E stained slides were reviewed.15 Furthermore, metastases were determined by CT or MRI. The International Metastatic Renal Cancer Database Consortium (IMDC) model was used to stratify risk after metastasis. The responses to TKI treatment were evaluated according to the Revised Response Evaluation Criteria in Solid Tumors guidelines (version 1.1).16 Expression level of each staining was independently assessed by two senior pathologists, without knowing any clinical or survival information.
Immunohistochemistry for immune checkpoint-associated molecules and TILs
Continuous slides of formalin-fixed, paraffin-embedded tissues were used for immunohistochemical staining. The slides were heated at 60°C for 2 hours, dewaxed in xylene, and dehydrated by a gradient concentration of alcohol. After retrieving and blocking the endogenous peroxidase and nonspecific staining with 3% (v/v) hydrogen peroxide and normal goat serum, the sections were incubated with anti-primary antibody overnight at 4°C. The slides were then incubated with horseradish peroxidase-conjugated goat anti-mouse IgG secondary antibody for 30 minutes at 37°C. Finally, they were visualized by DAB solution (Dako Denmark A/S, Glostrup, Denmark) and counterstained with hematoxylin. The quantity of positively stained cells was measured independently by two pathologists, who were blind to outcomes of the patient. Mouse anti-human CD8 (ab17147; Abcam, Cambridge, UK), mouse anti-human PD-1 (ab52587, Abcam), and rabbit anti-human PD-L1 (ab205921, Abcam) were some of the primary antibodies used for immunohistochemistry. Each full-face tumor section was assessed for TILs within the TC using microscopic examination. Five independent areas, excluding those with necrosis and inflammation, were selected and photographed using a virtual digital slide scanner (Leica Microsystems, Wetzlar, Germany).
The PD-L1 expression was measured on both lymphocytes and TC. The percentages of TC that were stained positive for PD-L1 were assessed according to the extent and intensity of membranous staining on the TC. The staining was scored as 0, no expression or expression in TC <5%; 1, weak expression in TC >5%; 2, moderate expression in TC >5%; and 3, strong expression in TC >5%. The TC samples were subsequently subdivided into TC positive (those with scores of 2–3) and TC negative (those with scores of 0–1). An adjusted score representing lymphocyte PD-L1 expression was calculated as absent (0), focal (1), mild (2), moderate (3), and severe (4). The lymphocytes with scores of 2–4 were considered as lymphocyte PD-L1-positive and lymphocytes with score 0 or 1 were considered as lymphocyte PD-L1-negative. OS was defined as the time interval between TKI treatment initiation and death or censoring at last follow-up. Progression-free survival was defined as the time interval between TKI treatment initiation and disease progression.
Statistical analysis
Chi-squared tests were used to compare categorical variables. Survival curves were generated using the Kaplan–Meier method and a log-rank test was used to test for differences between survival curves. The multivariate Cox proportional hazard regression model was used for survival analyses. Receiver operating characteristic (ROC) analysis was used to assess model accuracy. All analyses were conducted in SPSS (version 21.0; IBM Corporation, Armonk, NY, USA). All P-values were two-sided and those <0.05 were considered statistically significant.
Results
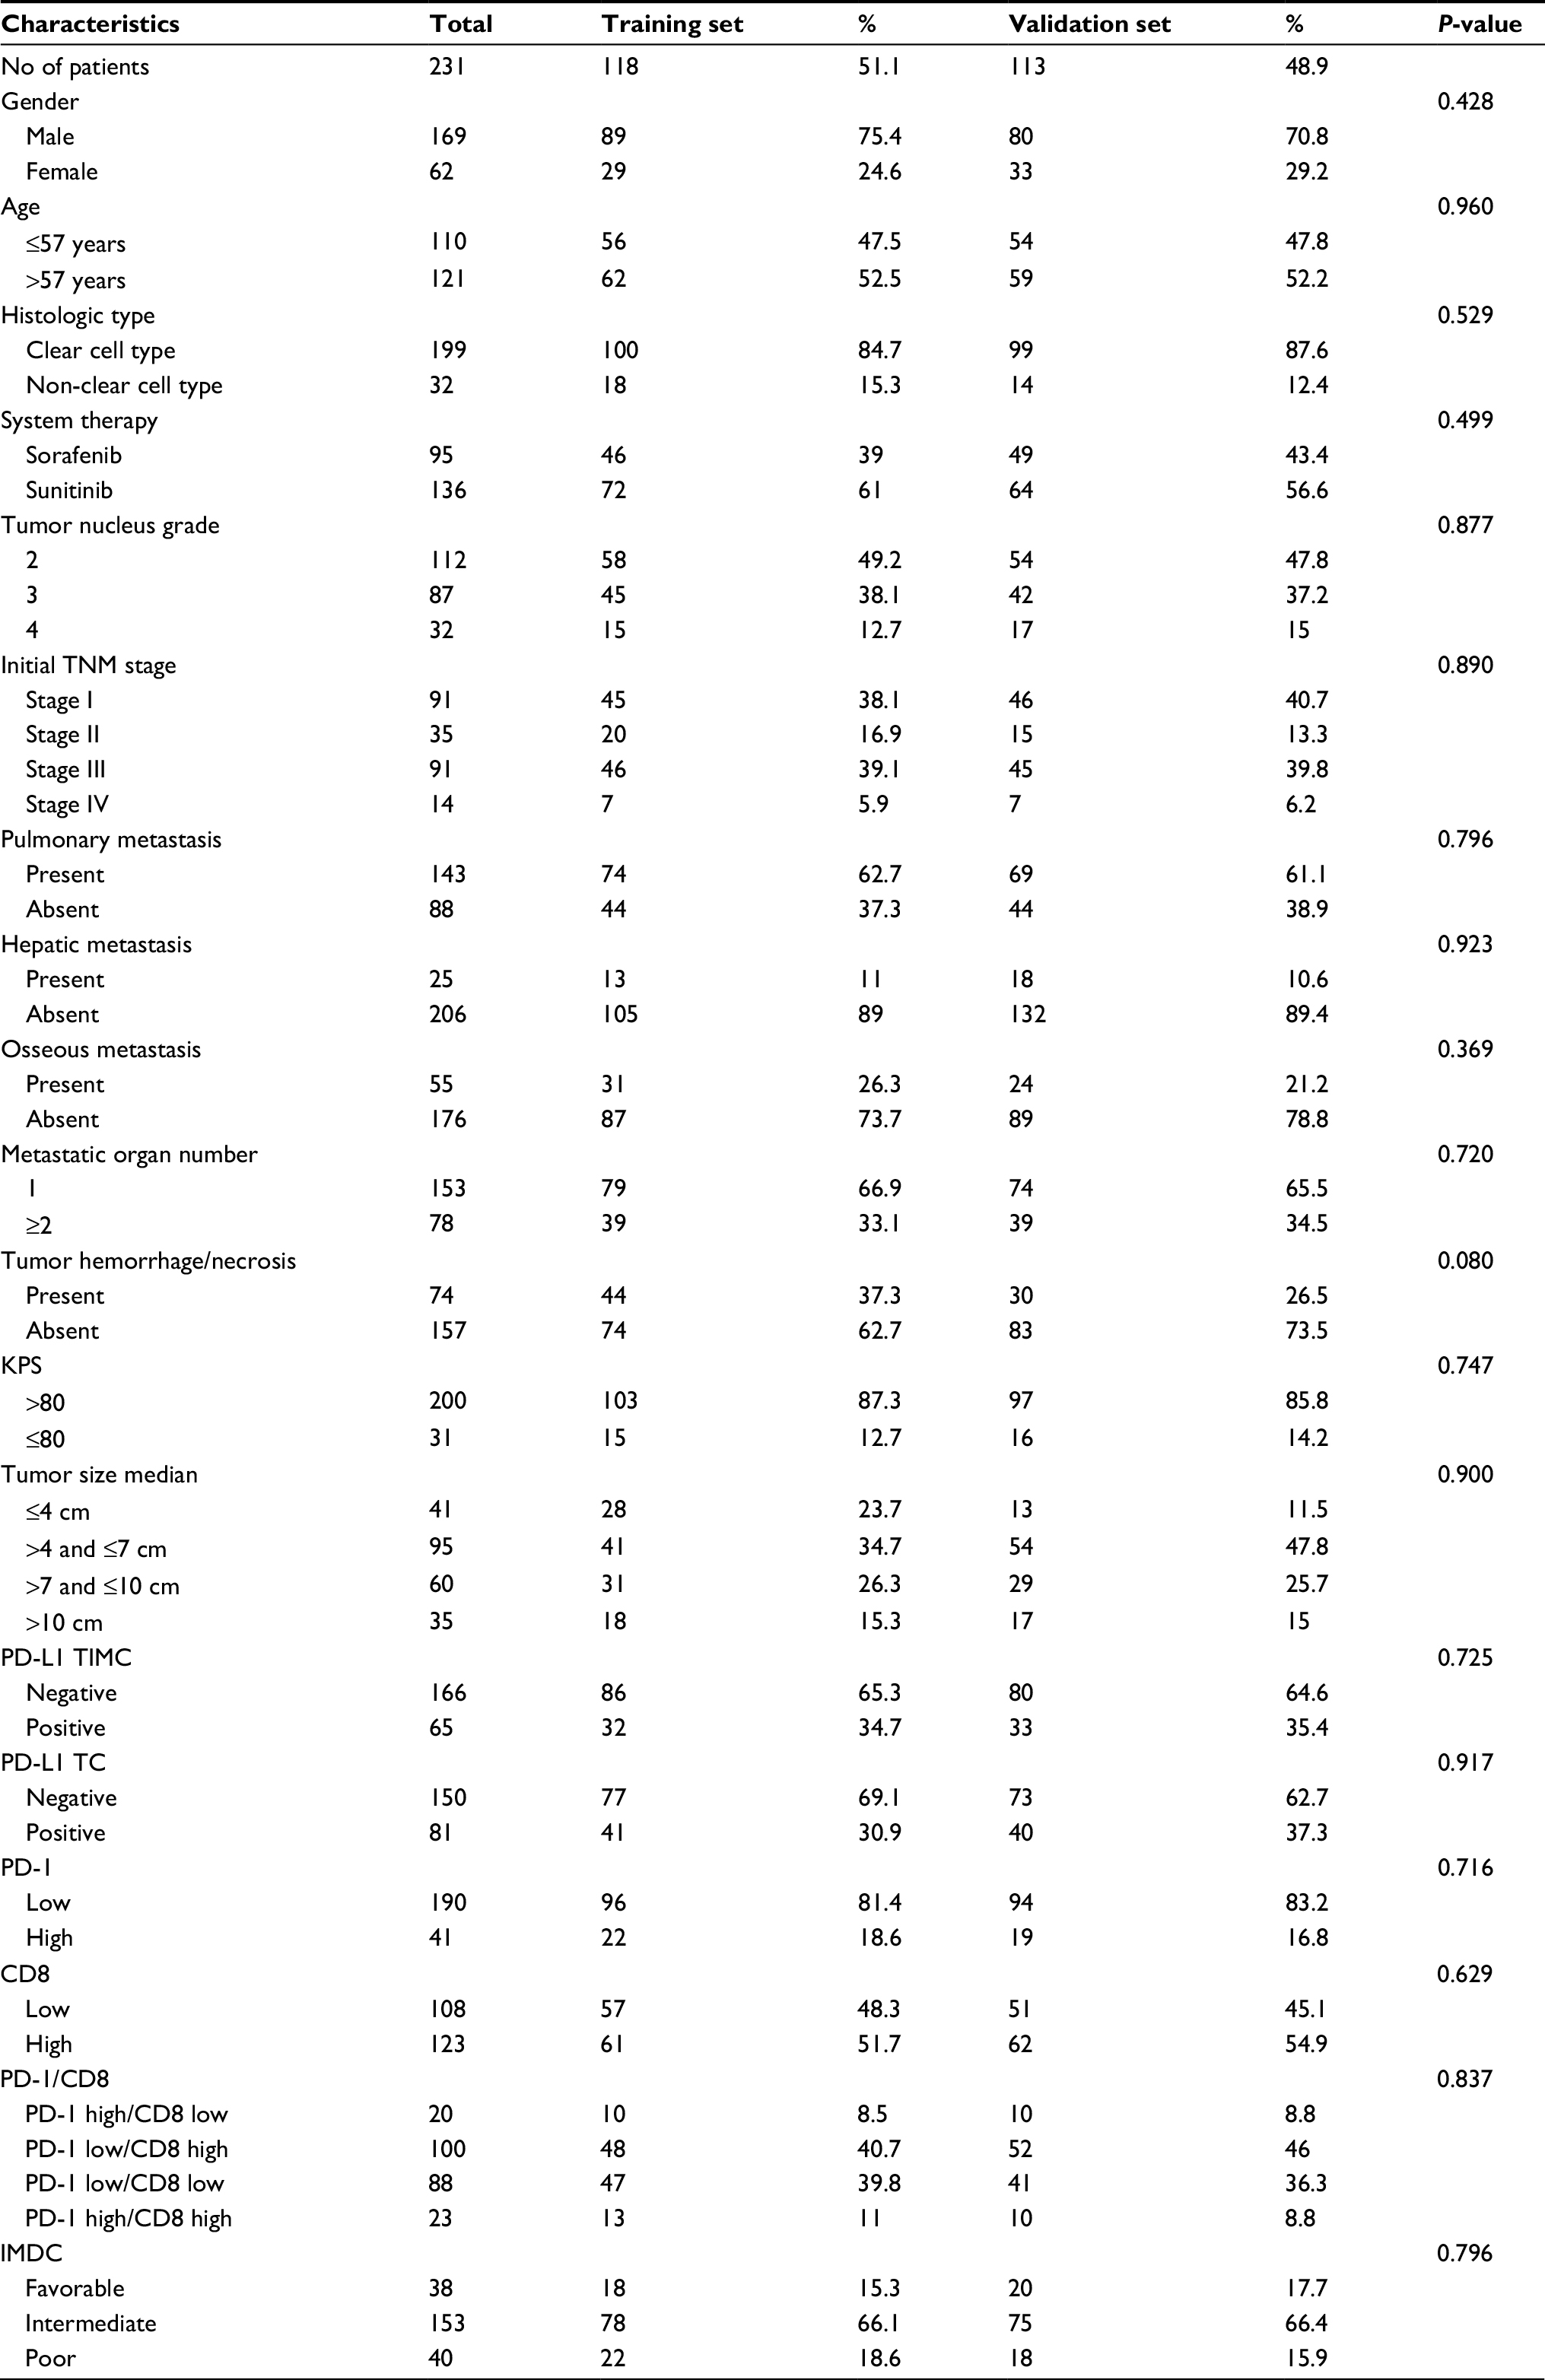
A total of 231 patients were included for analyses, of which 118 patients were from the training set and 113 patients were from the validation set. The two sets were comparable for clinical and pathological parameters (Table S1). Only 14 were identified as M1 stage at the first diagnosis. The median follow-up was 17.5 months (range: 3–111 months) across all patients, and more than half the metastases originated from initial localized disease (54.5%).
The TIL and immune checkpoint expression in mRCC tissues are represented in Figure S1. Furthermore, PD-L1 was expressed not only on tumor infiltrating mononuclear cells (TIMC PD-L1) of inflammatory areas, but also on TC (TC PD-L1) (Figure S1). The CD8 and PD-1 staining in mRCC tissues were exclusively located in inflammatory areas (Figure S2). Across all the patients, distribution of PD-L1 was higher in Fuhrman grade 3 and 4 when compared to Fuhrman grade 2 (Figure S3). Patients with high initial stage or pathological grade had more TC PD-L1 density (45.71% in TNM III+IV vs 36.51% in TNM I+II, P=0.156; 47.90% in grade 3+4 vs 21.43% in grade 2, P<0.001) as well as TIMC PD-L1 (34.29% in TNM III+IV vs 26.19% in TNM I+II, P=0.181; 34.45% in grade 3+4 vs 21.43% in grade 2, P=0.022). In addition, three checkpoint-associated molecules were remarkably detected in patients with poorer physical status (Figure S3, Table 1).
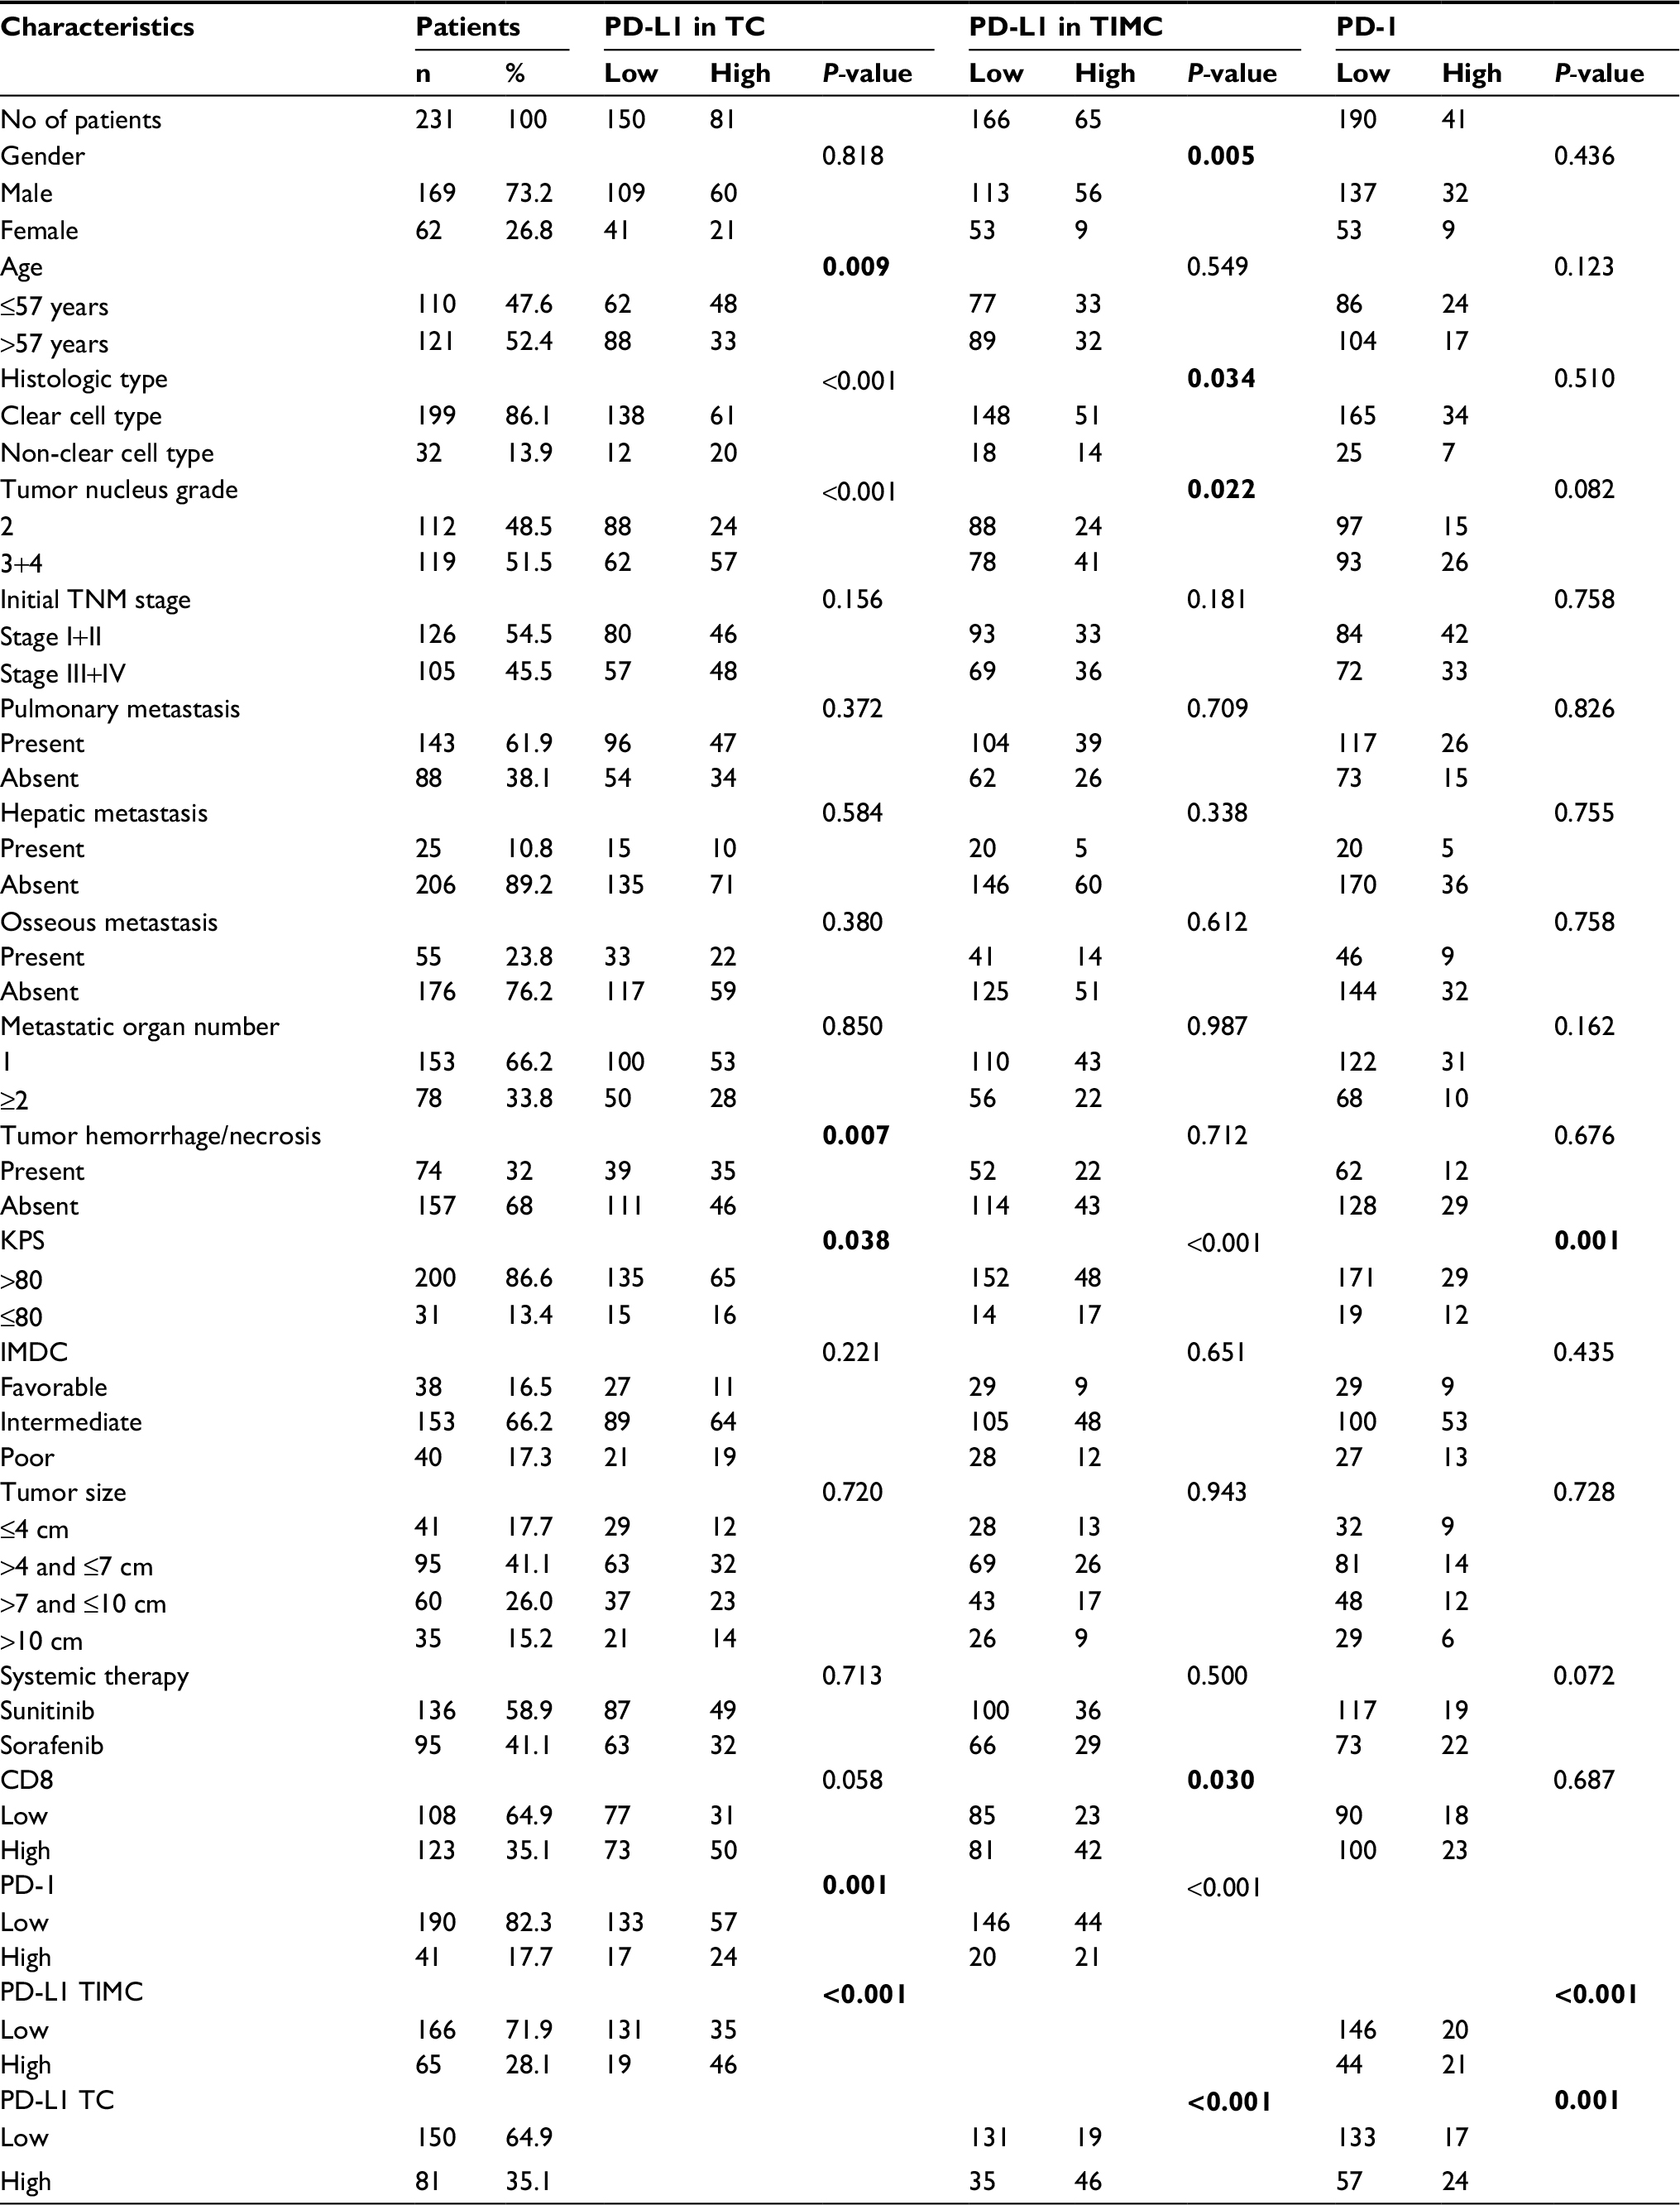 | Table 1 Clinical and pathologic characteristics of patients according to immune checkpoint expression Note: Data in bold indicates P<0.05. Abbreviations: IMDC, International Metastatic Renal Cancer Database Consortium; TC, tumor cells; TIMC, tumor infiltrating mononuclear cells; PD-1, programmed cell death protein 1; PD-L1, ligand of PD-1; KPS, Karnofsky Performance Status. |
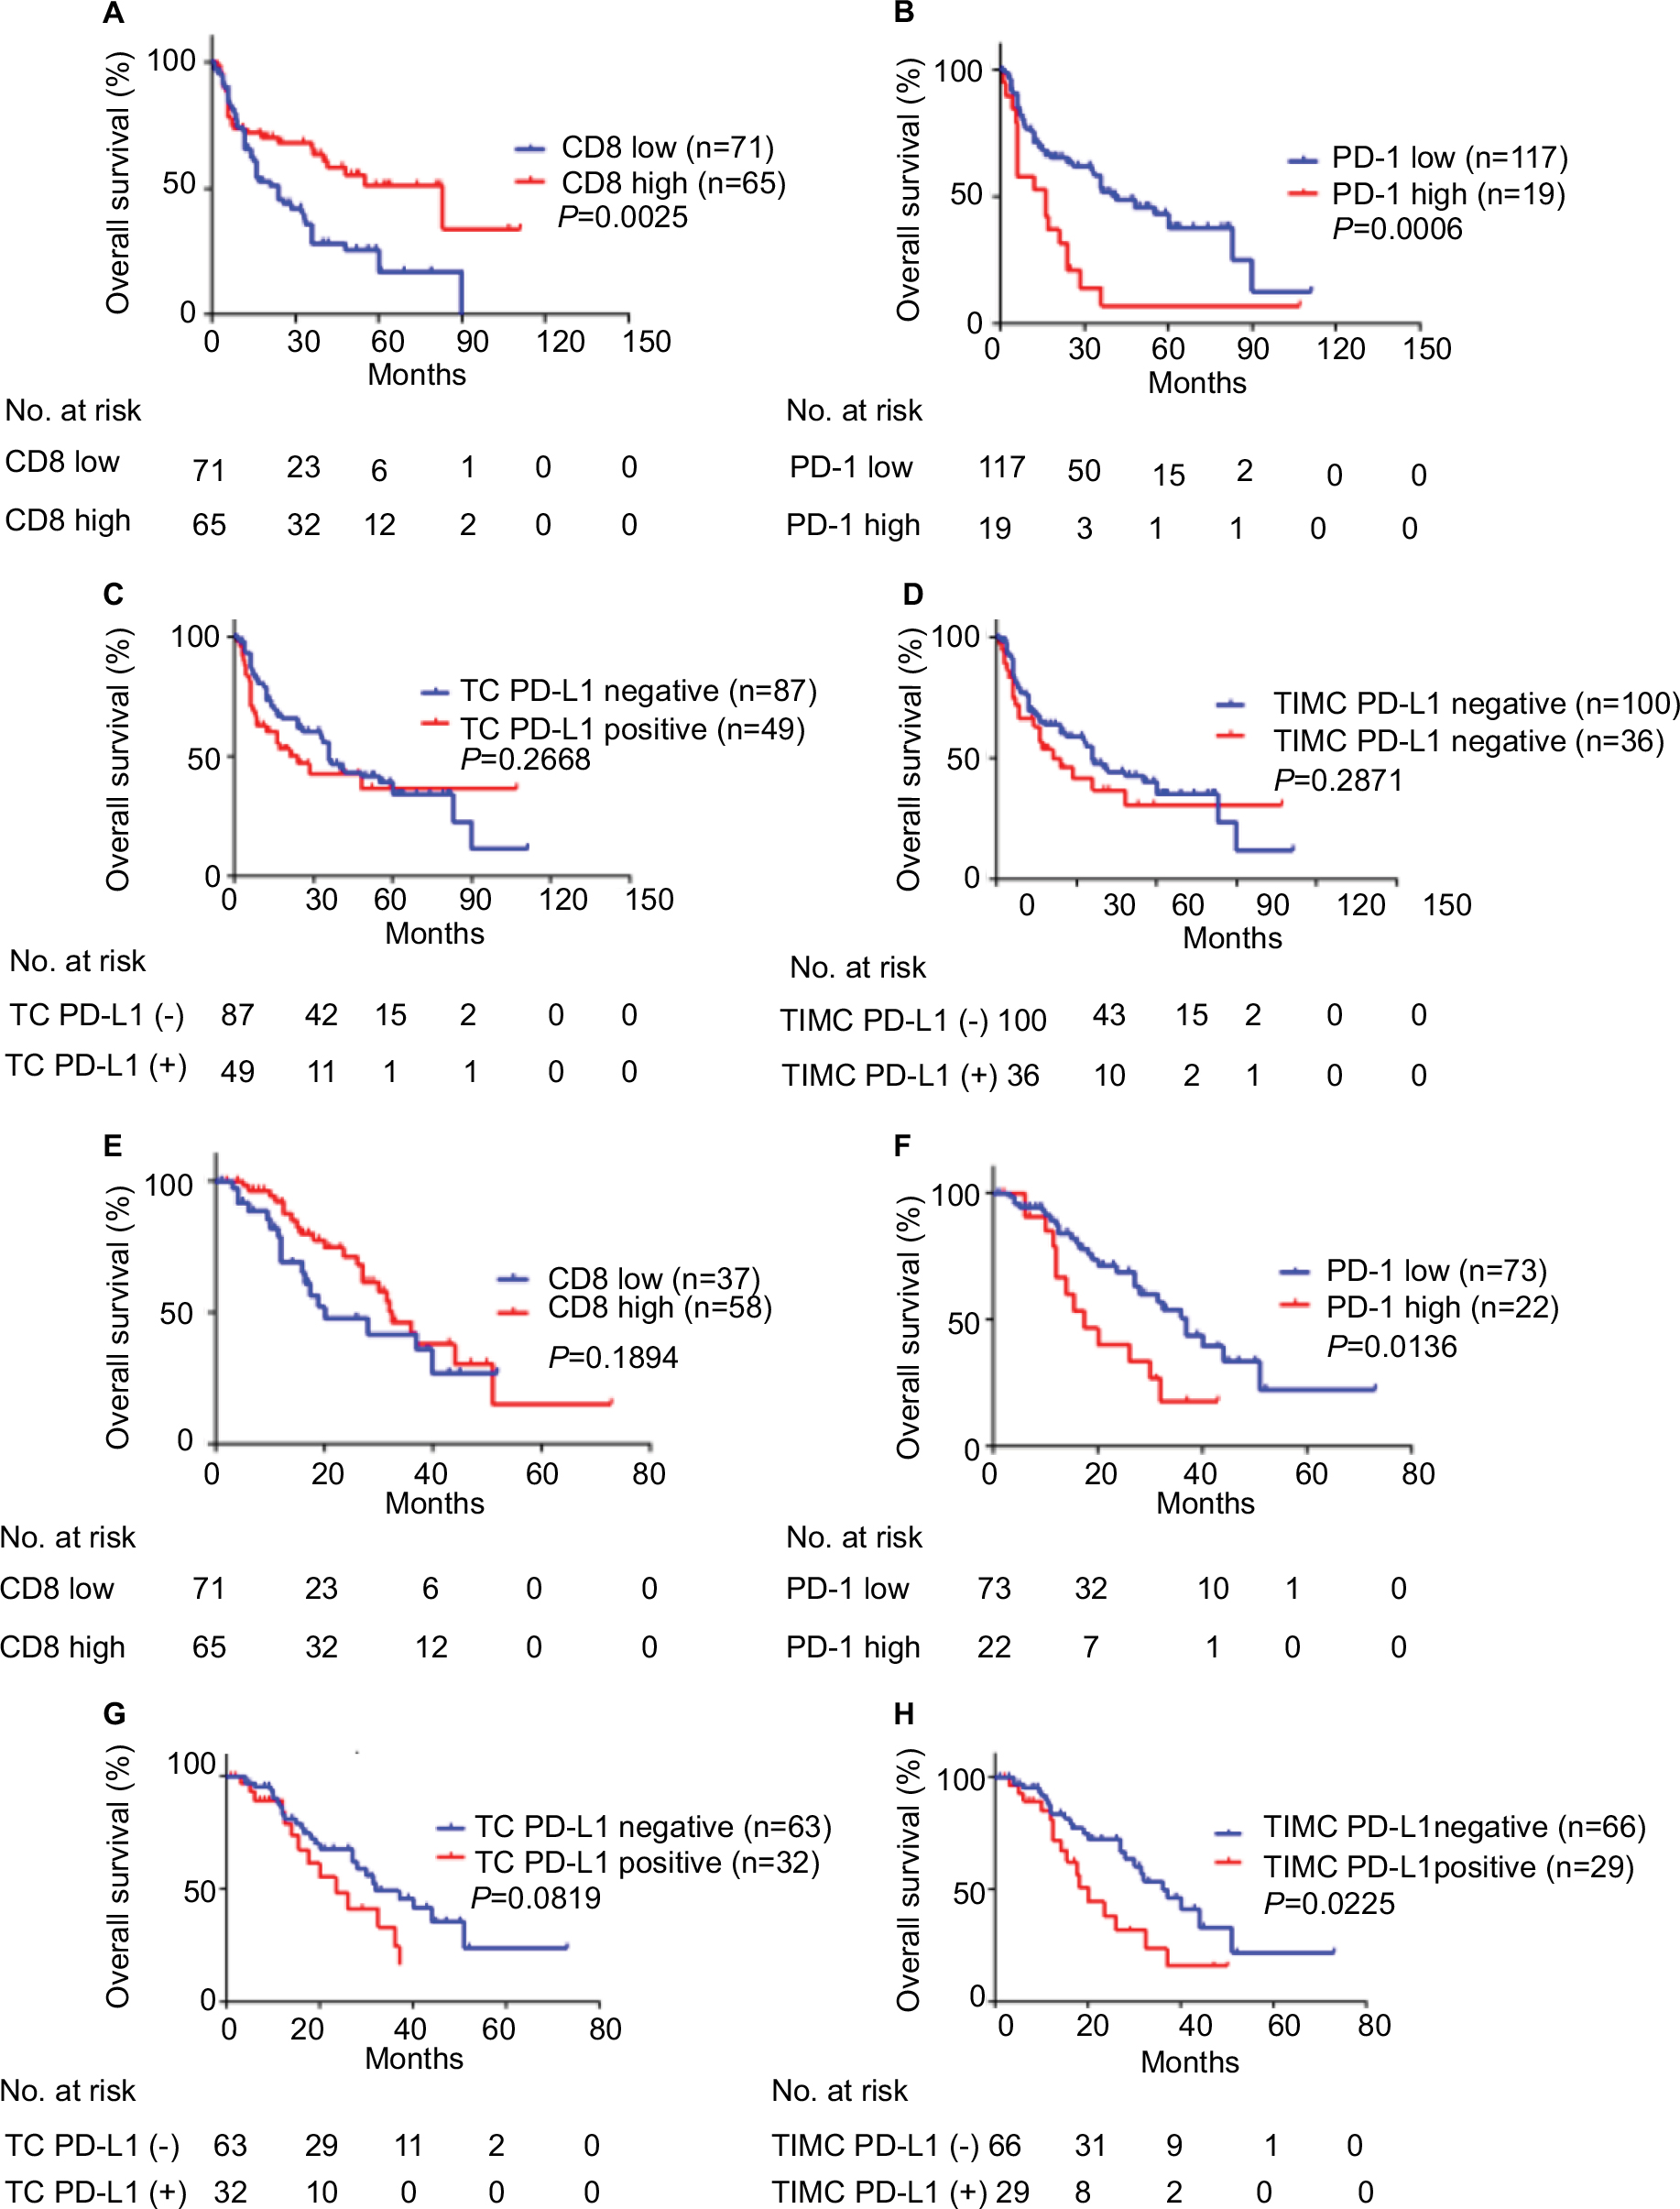
In the training and validation sets, abundant CD8 staining was remarkably associated with better OS. Median OS was 21 and 15 months longer in patients with abundant CD8 infiltration in the training and validation sets, respectively (Figure 1). On the contrary, checkpoint-related molecules generally were associated with poor survival, with PD-1 owing the best separation capability, and PD-L1 being marginally significant in the validation set (Figure 1). After adjusting to other parameters, abundant molecular CD8 density decreased 44% and 58% of the risk of death in the corresponding training and validation sets (training: HR =0.561, 95% CI 0.324–0.972, P=0.039; validation: HR =0.425, 95% CI 0.238–0.758, P=0.004). Checkpoint-related PD-L1 did not show any independent association with survival, but PD-1 density significantly affected OS both in the training and validation set (HR =2.189, 95% CI 1.097–4.370, P=0.026; validation: HR =2.178, 95% CI 1.070–4.433, P=0.032). It demonstrated an outstanding influential ability of PD-1 compared with other checkpoint molecules. In PD-1-assisted CD8-stratified populations, patients with PD-1 high/CD8 low staining had the worst OS, three times increased risk of death compared with PD-1 low/CD8 high subgroup, when adjusted to other parameters (Table 2).
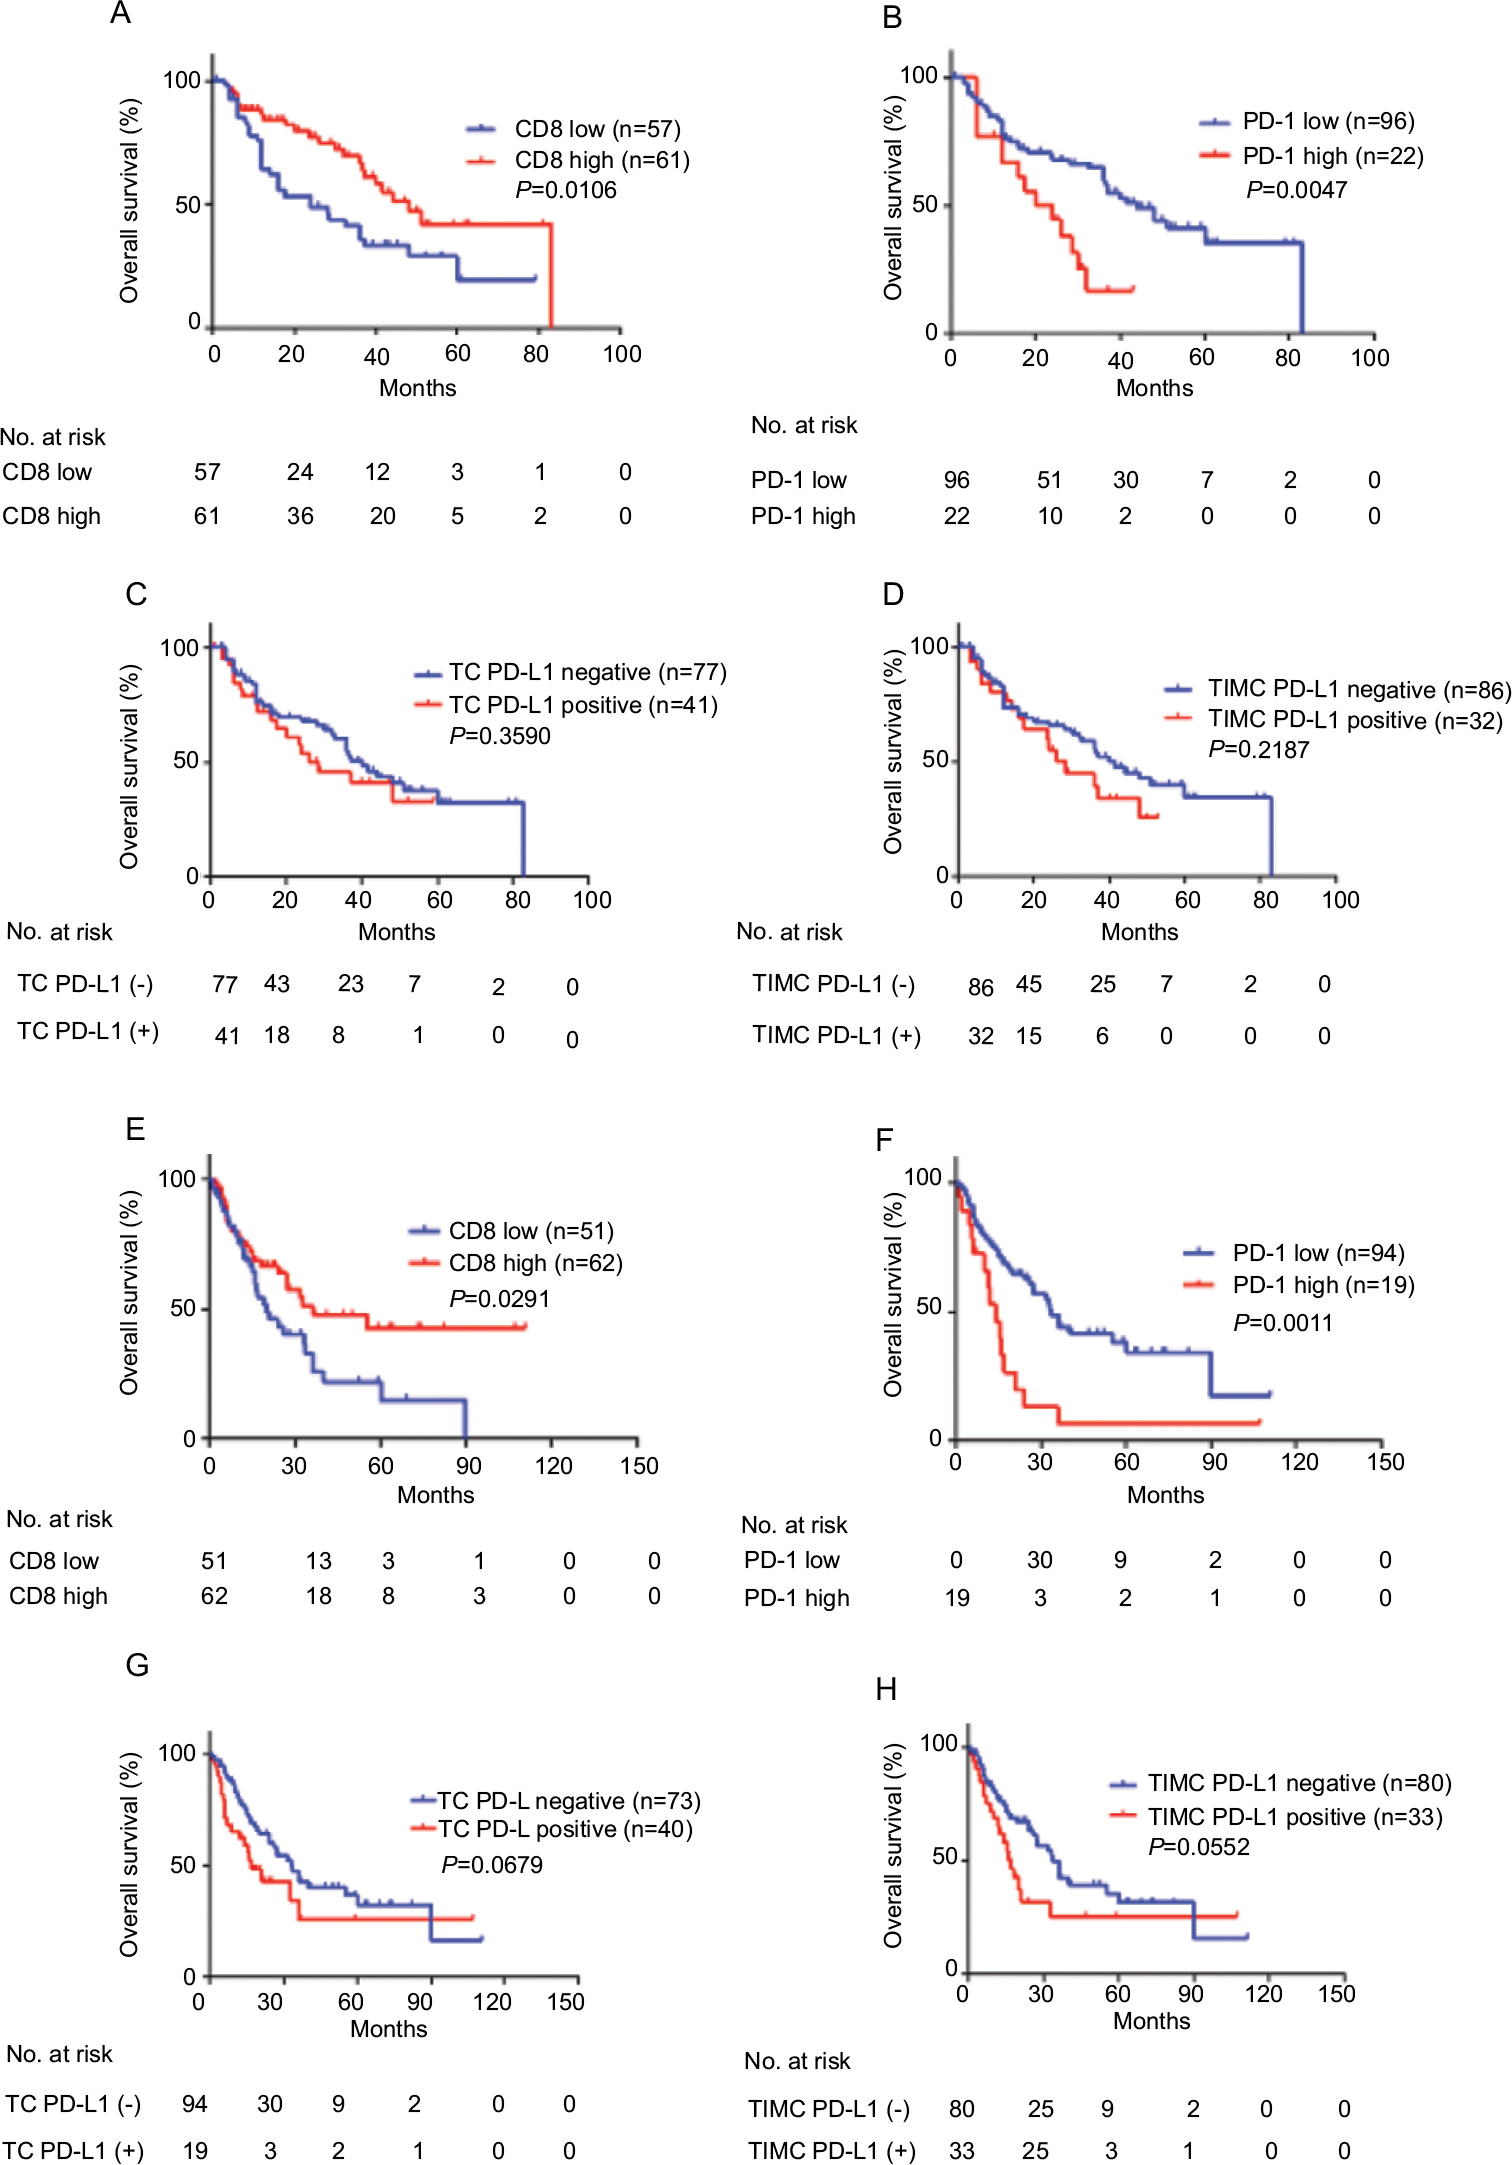 | Figure 1 Kaplan–Meier curves according to CD8 and PD-1/PD-L1 level in the training and validation sets. Notes: Kaplan–Meier analysis of OS according to CD8 in patients with training set (A) and validation set (E), PD-1 in patients with training set (B) and validation set (F), TC PD-L1 in patients with training set (C) and validation set (G), TIMC PD-L1 in patients with training set (D) and validation set (H). P-value was calculated by log-rank test. Abbreviations: PD-1, programmed cell death protein 1; PD-L1, ligand of PD-1; OS, overall survival; TC, tumor cells; TIMC, tumor infiltrating mononuclear cells. |
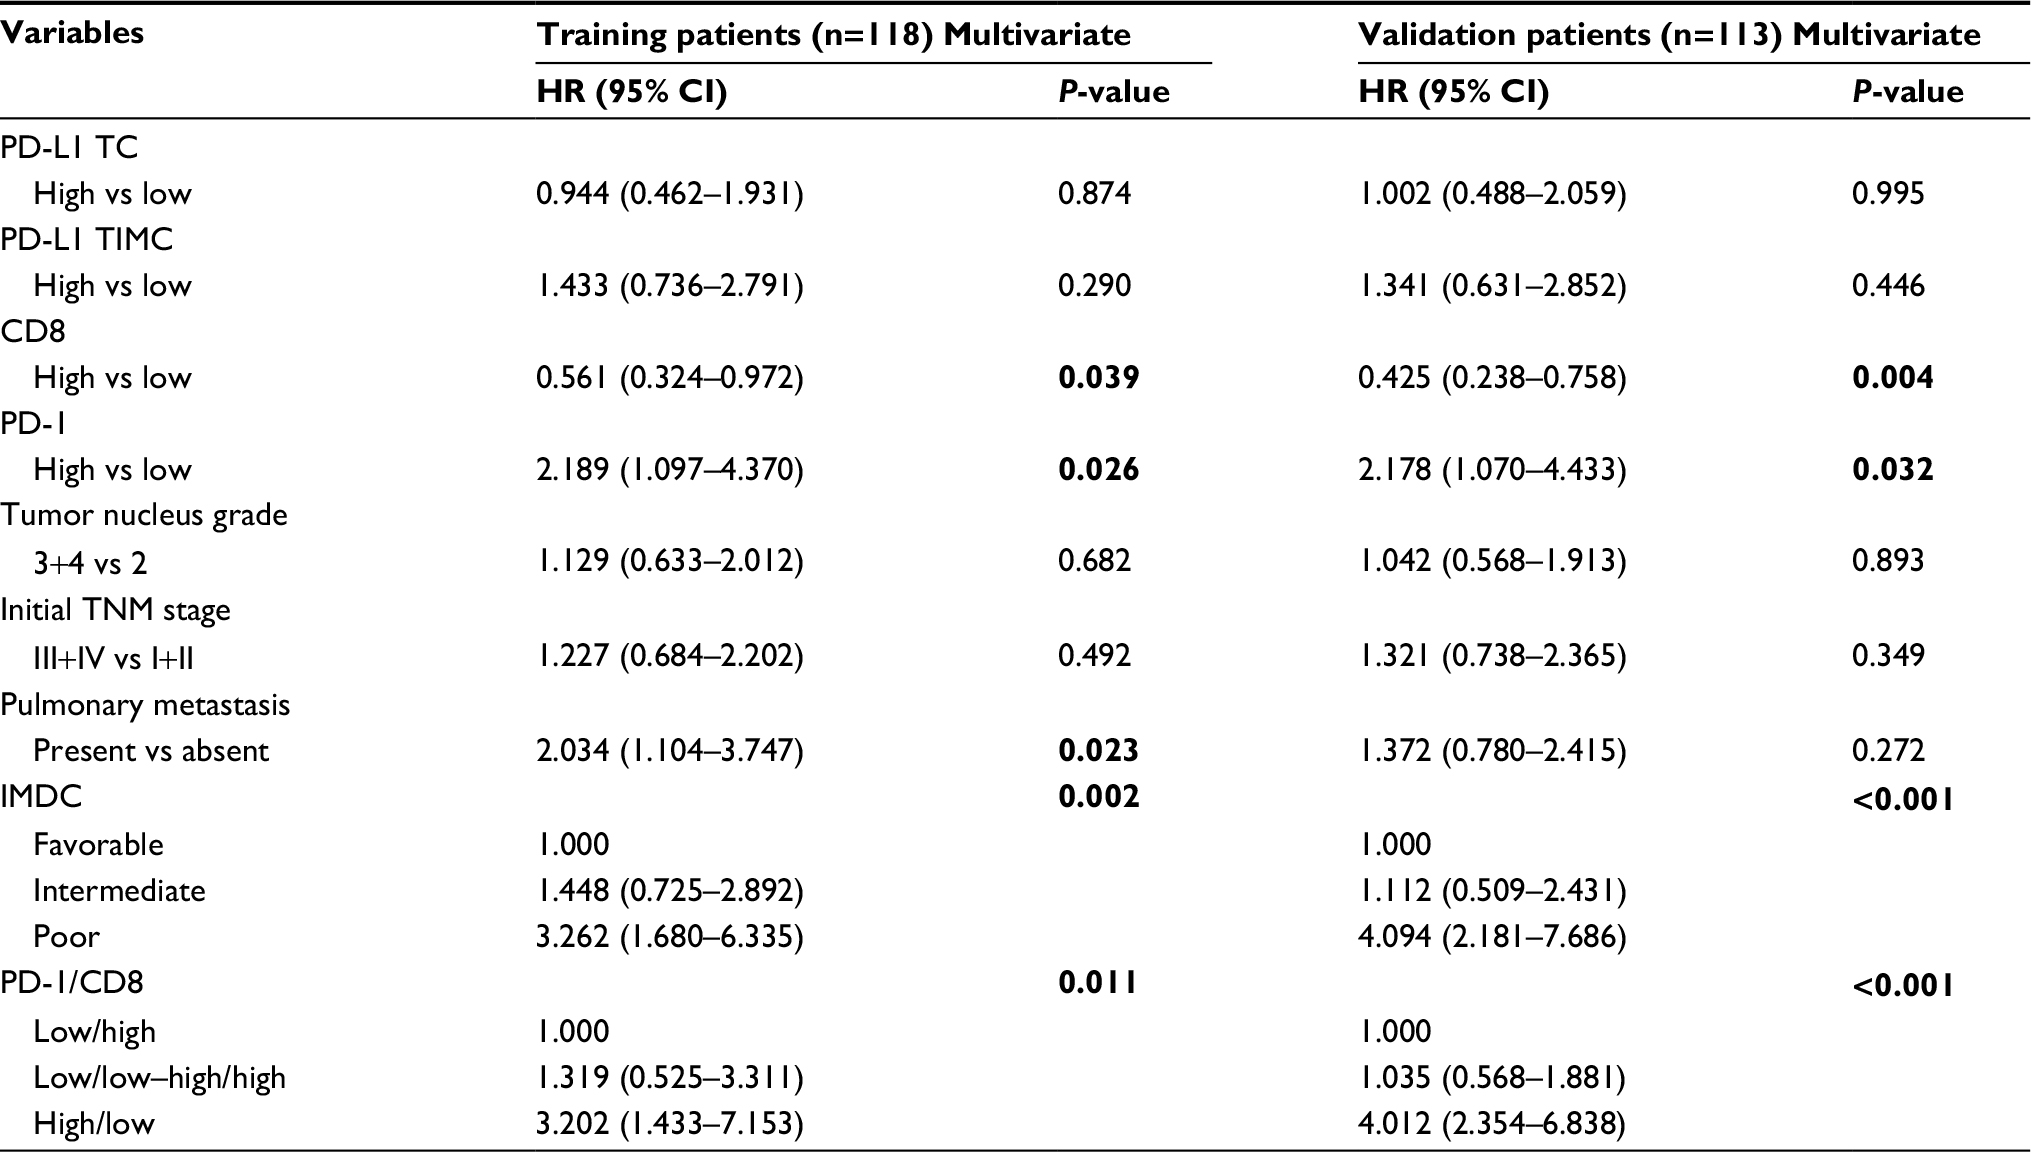 | Table 2 Multivariate Cox regression analyses for OS of training and validation patients Note: Data in bold indicates P<0.05. Abbreviations: IMDC, International Metastatic Renal Cancer Database Consortium; TC, tumor cells; TIMC, tumor infiltrating mononuclear cells; PD-1, programmed cell death protein 1; PD-L1, ligand of PD-1; OS, overall survival. |
We performed ROC analysis at the time of 12-month and 36-month follow-ups, and the combination of PD-1 and CD8 expression level to the IMDC showed better prognostic value than using IMDC alone (Figure 2). The IMDC plus PD-1/CD8 expression (area under the curve [AUC] =0.812, 95% CI 0.752–0.862) performed better than the IMDC (AUC =0.755, 95% CI 0.691–0.812) (P=0.0035) at the 12-month follow-up, while at the 36-month follow-up the IMDC together with PD-1/CD8 expression (AUC =0.853, 95% CI 0.789–0.904) also revealed better prognostic value compared with the IMDC (AUC =0.763, 95% CI 0.689–0.826) (P<0.0001) (Figure 2A, B), indicating the advantage of using molecular biomarkers in mRCC assessment.
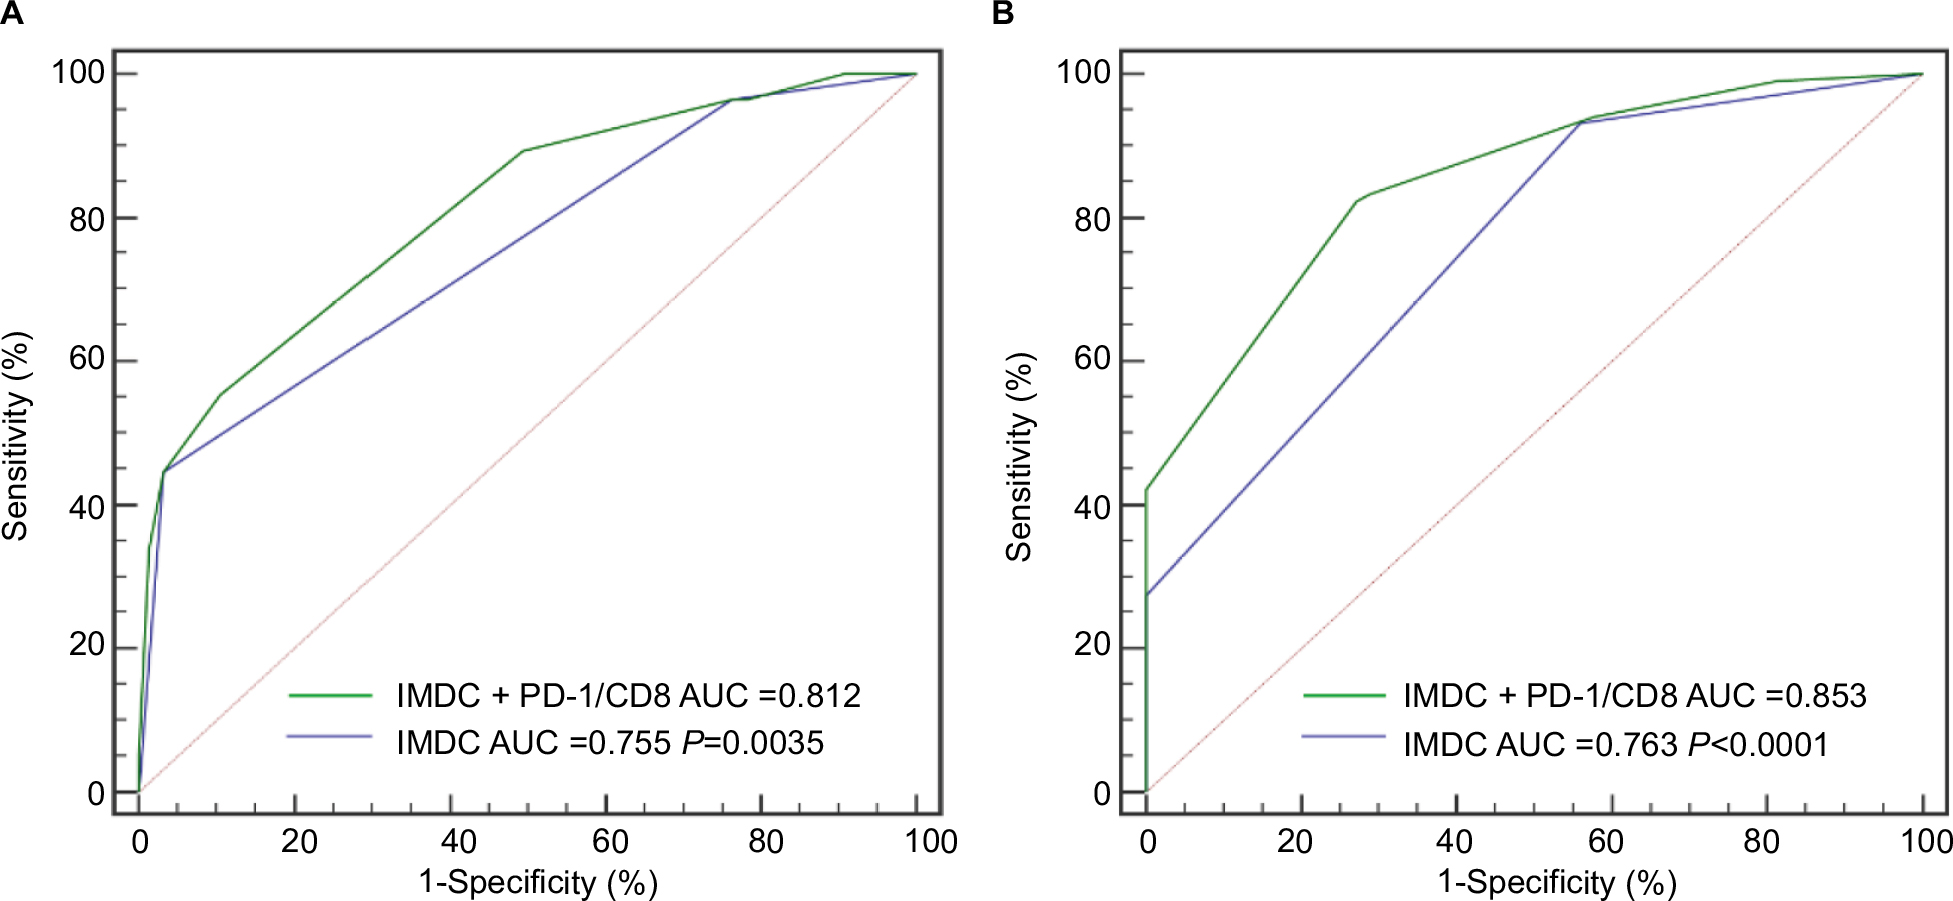 | Figure 2 ROC analysis for predictive accuracy of IMDC combined with PD-1/CD8 model for OS and IMDC alone. Note: All subtypes at 12 months (A) and 36 months (B). Abbreviations: PD-1, programmed cell death protein 1; IMDC, International Metastatic Renal Cancer Database Consortium; OS, overall survival; ROC, receiver operating characteristic; AUC, area under the curve. |
Furthermore, the impact of CD8 and PD-1, as well as PD-1-assisted CD8, on patient survival in different subgroups receiving TKI agents was assessed. Interestingly, CD8-positive density-stratified patients had better OS in the sunitinib group but not in the sorafenib group (Figure S4). Using PD-1-assisted CD8, we could obtain a more efficient and balanced prediction among mRCC patients for OS (Figure 3).
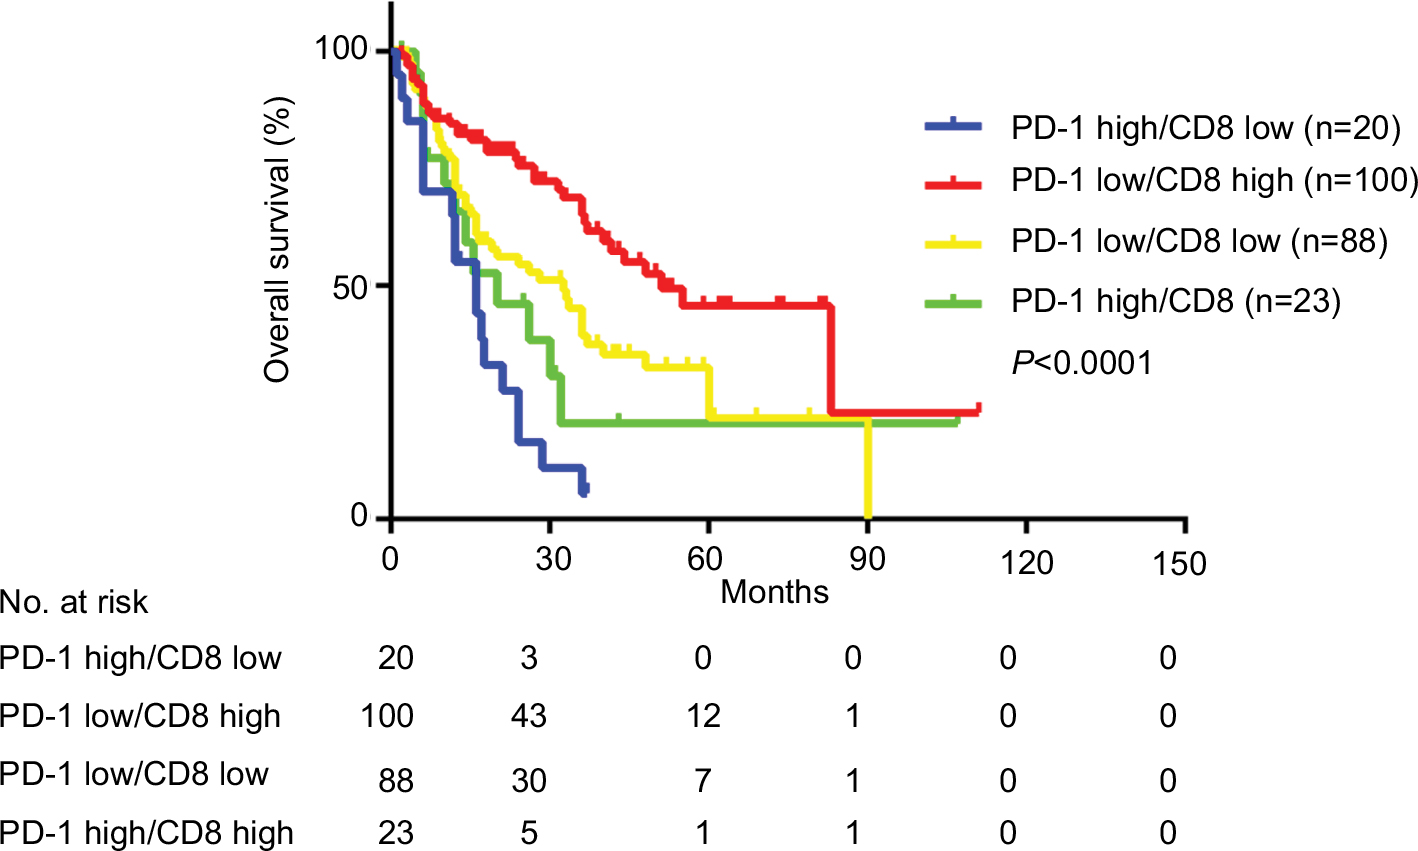 | Figure 3 Kaplan–Meier curves according to PD-1-assisted CD8 level. Abbreviation: PD-1, programmed cell death protein 1. |
Discussion
In this study, we found that CD8+ T cell is an independent indicator for longer survival of mRCC patients treated with TKIs. Our results are concordant with previous studies in which higher CD8 expression was associated with prolonged survival and better outcomes in patients with mRCC and other solid tumors.9,17 Weiss et al demonstrated that a significant increase in the number of CD8+ T cells was observed in tumors from long-term surviving (>8 years) patients than short-term surviving (<4 years) patients.8 Also, George et al found that greater CD8+ T lymphocytes density in tumor tissue was associated with longer disease-free survival with adjuvant sunitinib in high-risk locoregional RCC. However, the prognostic value of PD-L1 expression in high-risk locoregional RCC had no significance.18 A meta-analysis indicates that a higher level of PD-L1 expression is a negative prognostic factor in RCC.19
In our present study, we focused on mRCC patients, PD-L1 and PD-1 affected patient outcomes in different levels. PD-L1 expressed on TC is not associated with survival, and PD-L1 expressed on TIMC only had a marginal influence in one set. They were not independent factors for OS when adjusted by other parameters. PD-1 was the only significant checkpoint-associated molecule in the multivariable analyses. High PD-1 level in inflammatory zone had 1.5-fold increased risk of death, indicating a powerful prognostic value. Meanwhile, PD-1 was different with PD-L1 in their association with other parameters. Patients with TC PD-L1-positive expression tend to have tumor necrosis.
Moreover, the regulative role of PD-1 in anticancer immunity, and assisted CD8+ T lymphocytes were reported to predict OS of mRCC patients treated with TKIs. Granier et al found that overexpression of PD-1 and Tim-3 had a higher risk of relapse and a poorer OS.20 Our data showed that PD-1 high/CD8 low patients had the shortest OS; median OS was 16 in this subgroup, while median OS was 50 in the PD-1 low/CD8 high subgroup. A study by Giraldo et al reported that high expression of immune checkpoints was associated with increased risk of disease progression whereas low expression of immune checkpoints was associated with good prognosis.13 Interestingly, predictive difference was found between sunitinib and sorafenib patients. The stratification capability of CD8 count was significant only in sunitinib patients, but not in sorafenib patients. This phenomenon implied a potential means of prediction in patients receiving sunitinib treatment. Why this happens and the final conclusion still need large-scale research for confirmation. It may be related to their different drug effects mechanisms on immune cells in the mRCC response to VEGF receptor-TKIs.21
The major limitations of this study are its retrospective design and relatively small number of patients. Meanwhile, recommendations on sorafenib in China were different from National Comprehensive Cancer Network and European Association of Urology guidelines. These reasons contribute to the higher percentage of sorafenib application. Future research should be performed in patients receiving other TKIs treatments.
In conclusion, our findings suggest that abundant CD8+ T lymphocytes were significantly associated with longer OS in mRCC patients treated with TKIs. Moreover, PD-1 was the most influential checkpoint-associated molecule. PD-1-assisted CD8+ T cell better stratified patients and could cooperate with the present IMDC model to obtain better prediction.
Acknowledgments
We thank Ms Jun Hou and Ms Haiying Zeng (Department of Pathology, Zhongshan Hospital, Fudan University) for the pathologic review, immunohistochemical staining evaluation, and technical assistance. This study was funded by grants from National Natural Science Foundation of China (31100629). All the study sponsors have no roles in the study design, in the collection, analysis, and interpretation of data.
Disclosure
The authors report no conflicts of interest in this work.
References
Siegel RL, Miller KD, Jemal A. Cancer statistics, 2018. CA Cancer J Clin. 2018;68(1):7–30. | ||
Joshi SS, Handorf EA, Zibelman M, et al. Treatment facility volume and survival in patients with metastatic renal cell carcinoma: a registry-based analysis. Eur Urol. Epub 2018 Jun 4. | ||
Escudier B, Porta C, Schmidinger M, et al. Renal cell carcinoma: ESMO clinical practice guidelines for diagnosis, treatment and follow-up. Ann Oncol. 2014;25(Suppl 3):iii49–iii56. | ||
Wallis CJD, Klaassen Z, Bhindi B, et al. First-line systemic therapy for metastatic renal cell carcinoma: a systematic review and network meta-analysis. Eur Urol. 2018;13(18):30254–30259. | ||
Heng DY, Xie W, Regan MM, et al. Prognostic factors for overall survival in patients with metastatic renal cell carcinoma treated with vascular endothelial growth factor-targeted agents: results from a large, multicenter study. J Clin Oncol. 2009;27(34):5794–5799. | ||
Matsumoto H, Thike AA, Li H, et al. Increased CD4 and CD8-positive T cell infiltrate signifies good prognosis in a subset of triple-negative breast cancer. Breast Cancer Res Treat. 2016;156(2):237–247. | ||
Bhattacharya N, Yuan R, Prestwood TR, et al. Normalizing microbiota-induced retinoic acid deficiency stimulates protective CD8(+) T cell-mediated immunity in colorectal cancer. Immunity. 2016;45(3):641–655. | ||
Weiss JM, Gregory Alvord W, Quiñones OA, Stauffer JK, Wiltrout RH. CD40 expression in renal cell carcinoma is associated with tumor apoptosis, CD8(+) T cell frequency and patient survival. Hum Immunol. 2014;75(7):614–620. | ||
Nakano O, Sato M, Naito Y, et al. Proliferative activity of intratumoral CD8(+) T-lymphocytes as a prognostic factor in human renal cell carcinoma: clinicopathologic demonstration of antitumor immunity. Cancer Res. 2001;61(13):5132–5136. | ||
Topalian SL, Drake CG, Pardoll DM. Immune checkpoint blockade: a common denominator approach to cancer therapy. Cancer Cell. 2015;27(4):450–461. | ||
Pardoll DM. The blockade of immune checkpoints in cancer immunotherapy. Nat Rev Cancer. 2012;12(4):252–264. | ||
Yao S, Zhu Y, Chen L. Advances in targeting cell surface signalling molecules for immune modulation. Nat Rev Drug Discov. 2013;12(2):130–146. | ||
Giraldo NA, Becht E, Pagès F, et al. Orchestration and prognostic significance of immune checkpoints in the microenvironment of primary and metastatic renal cell cancer. Clin Cancer Res. 2015;21(13):3031–3040. | ||
Paner GP, Stadler WM, Hansel DE, Montironi R, Lin DW, Amin MB. Updates in the eighth edition of the tumor-node-metastasis staging classification for urologic cancers. Eur Urol. 2018;73(4):560–569. | ||
Compérat EM, Burger M, Gontero P, et al. Grading of urothelial carcinoma and the new “World Health Organisation classification of tumours of the urinary system and male genital organs 2016”. Eur Urol Focus. Epub 2018 Jan 20. | ||
Eisenhauer EA, Therasse P, Bogaerts J, et al. New response evaluation criteria in solid tumours: revised RECIST guideline (version 1.1). Eur J Cancer. 2009;45(2):228–247. | ||
Ling A, Edin S, Wikberg ML, Öberg Å, Palmqvist R. The intratumoural subsite and relation of CD8(+) and FOXP3(+) T lymphocytes in colorectal cancer provide important prognostic clues. Br J Cancer. 2014;110(10):2551–2559. | ||
George DJ, Martini JF, Staehler M, et al. Immune biomarkers predictive for disease-free survival with adjuvant sunitinib in high-risk locoregional renal cell carcinoma: from randomized phase III S-TRAC study. Clin Cancer Res. 2018;24(7):1554–1561. | ||
Iacovelli R, Nolè F, Verri E, et al. Prognostic role of PD-L1 expression in renal cell carcinoma. A systematic review and meta-analysis. Target Oncol. 2016;11(2):143–148. | ||
Granier C, Dariane C, Combe P, et al. Tim-3 expression on tumor-infiltrating PD-1(+)CD8(+) T cells correlates with poor clinical outcome in renal cell carcinoma. Cancer Res. 2017;77(5):1075–1082. | ||
Santoni M, Berardi R, Amantini C, et al. Role of natural and adaptive immunity in renal cell carcinoma response to VEGFR-TKIs and mTOR inhibitor. Int J Cancer. 2014;134(12):2772–2777. |
Supplementary materials
 | Table S1 Clinical and pathologic characteristics of patients according to training and validation sets Abbreviations: IMDC, International Metastatic Renal Cancer Database Consortium; TC, tumor cells; TIMC, tumor infiltrating mononuclear cells; PD-1, programmed cell death protein 1; PD-L1, ligand of PD-1; KPS, Karnofsky Performance Status. |
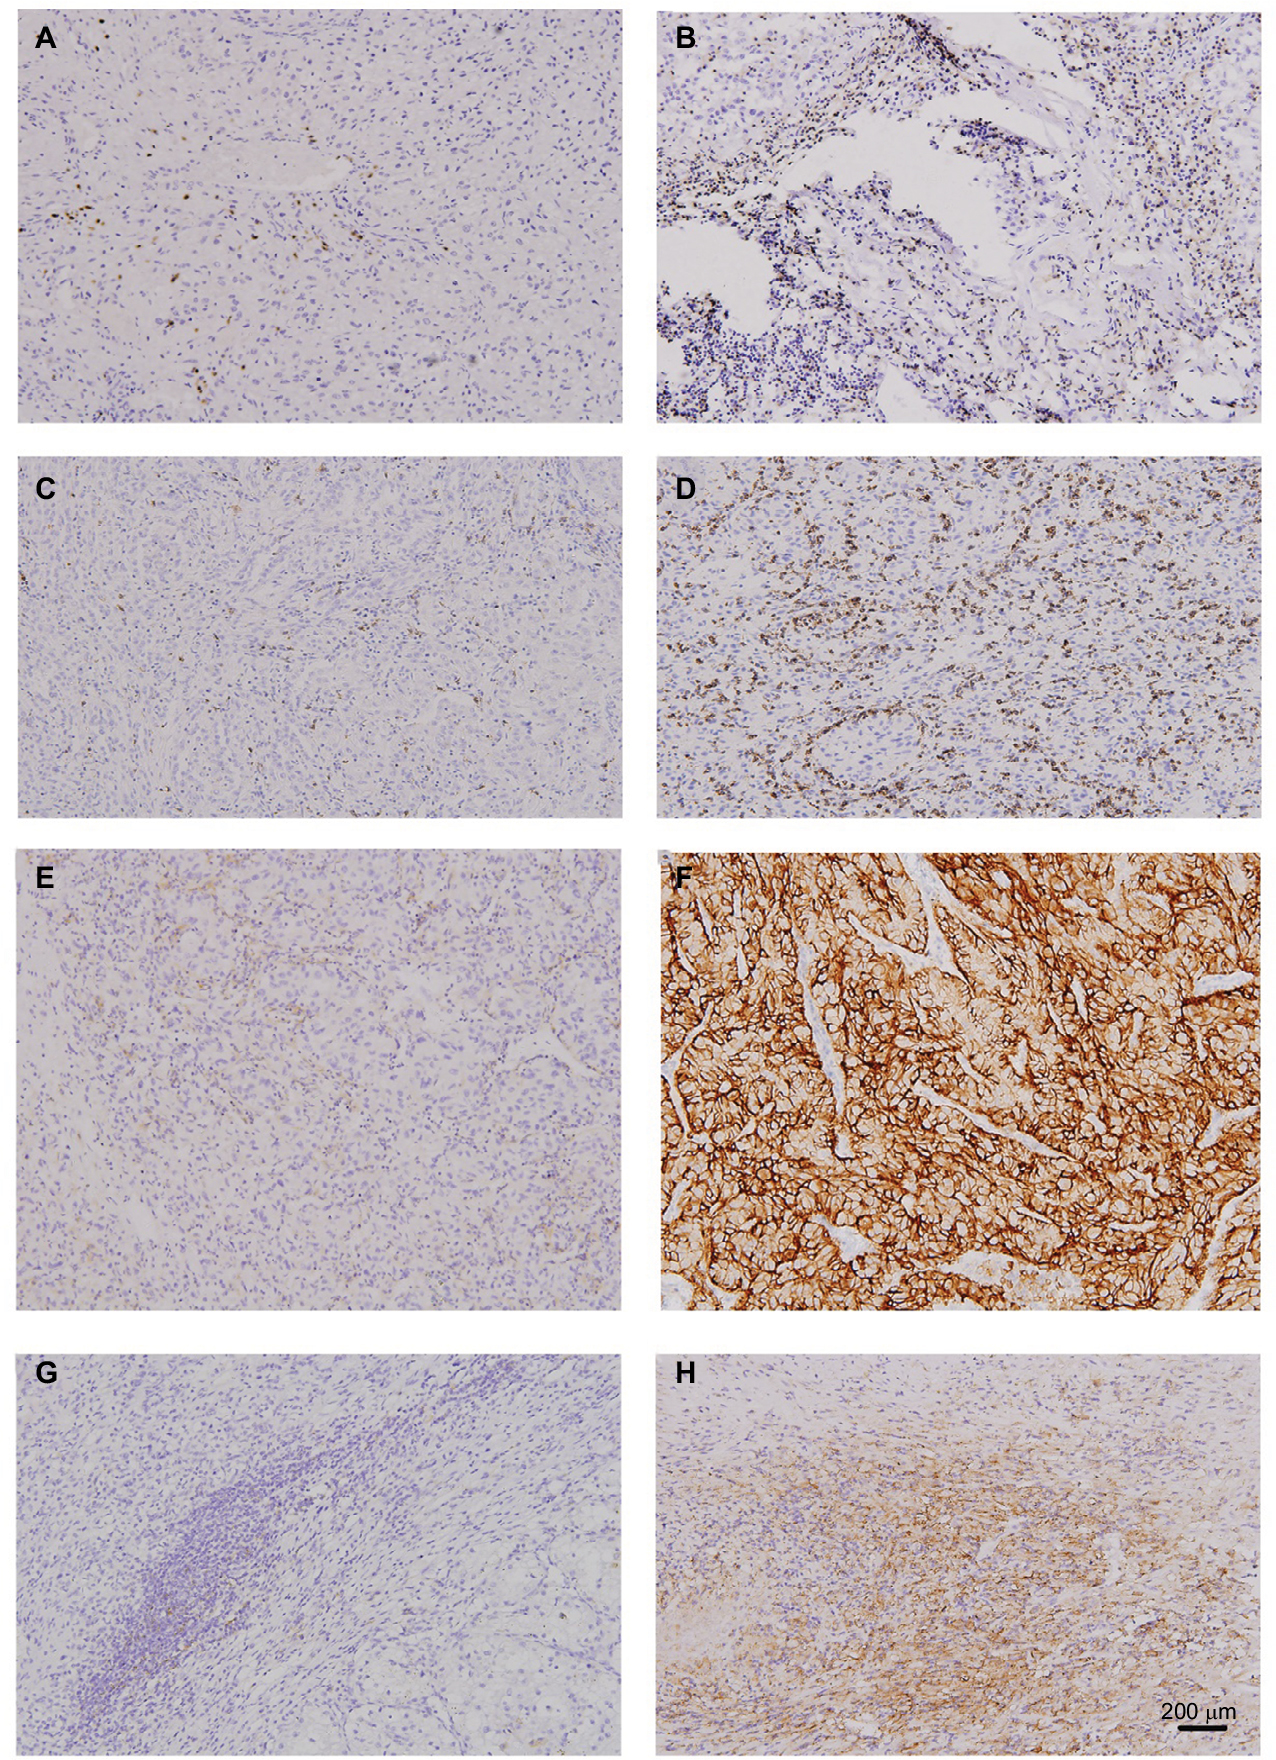 | Figure S1 TIL and immune checkpoint expression in mRCC tissues. Notes: CD8 low (A), CD8 high (B), PD-1 low (C), PD-1 high (D), TC PD-L1 negative (E), TC PD-L1 positive (F), TIMC PD-L1 negative (G), TIMC PD-L1 positive (H) in mRCC tissues. Original magnification: ×100. Abbreviations: PD-1, programmed cell death protein 1; PD-L1, ligand of PD-1; mRCC, metastatic renal cell carcinoma; TC, tumor cells; TIMC, tumor infiltrating mononuclear cells; TIL, tumor infiltrating lymphocyte. |
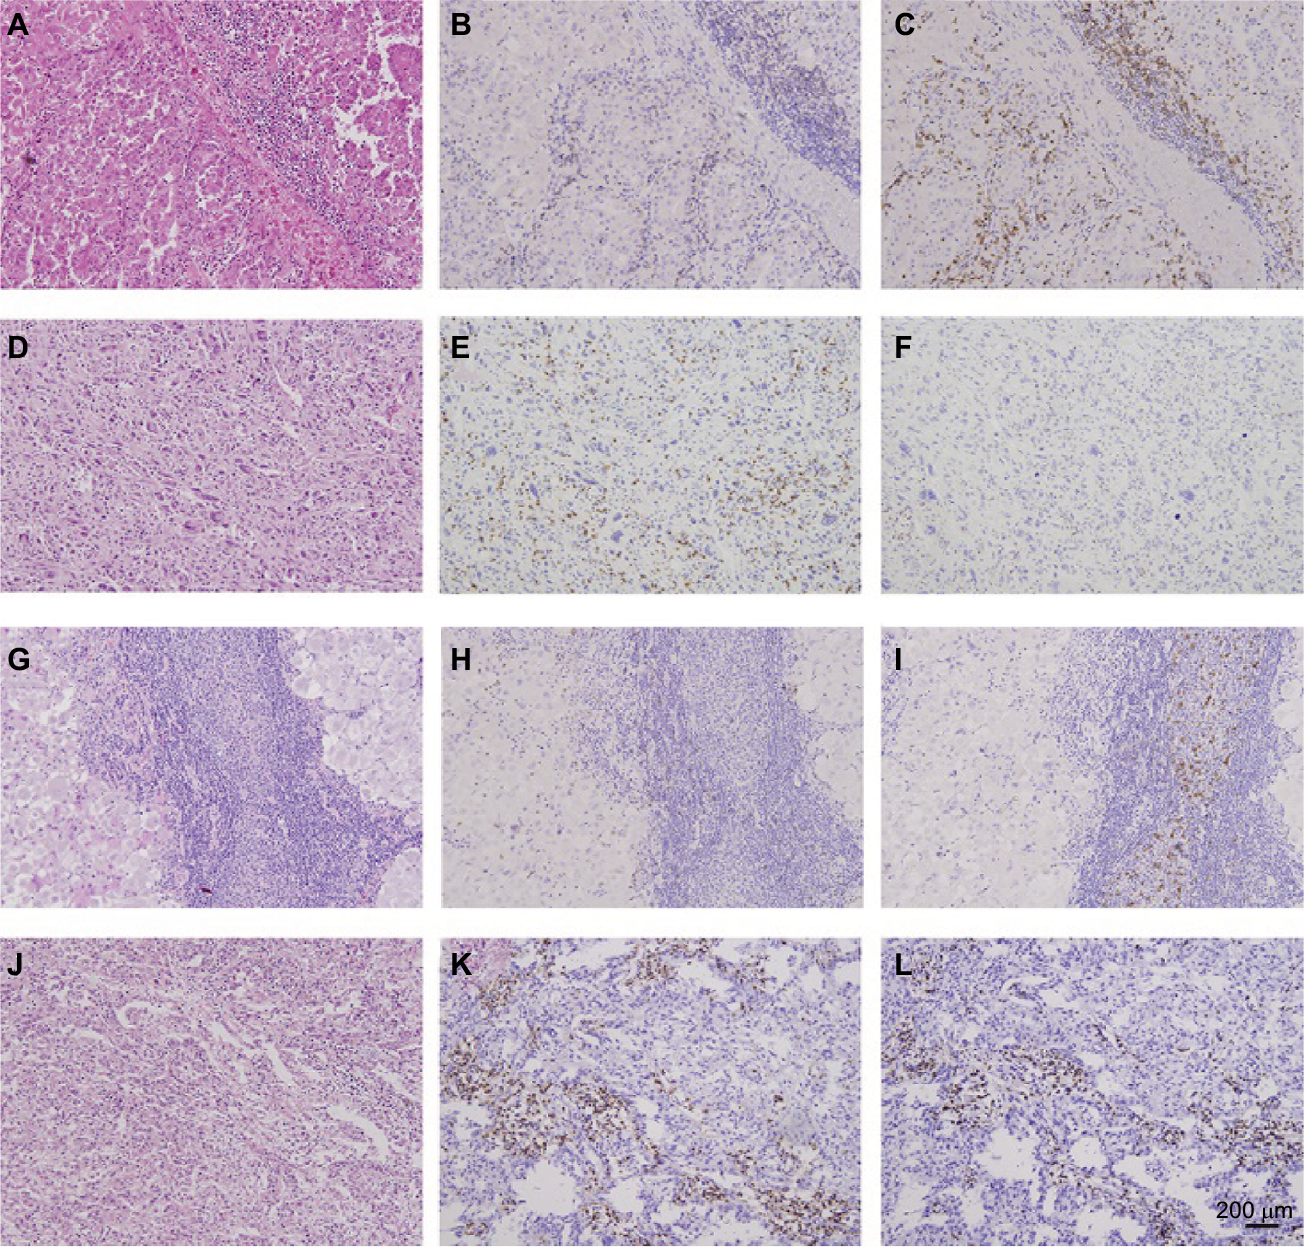 | Figure S2 PD-1/CD8 expression in mRCC tissues. Notes: Hematoxylin-eosin staining (A), CD8 low (B), PD-1 high (C), hematoxylin-eosin staining (D), CD8 high (E), PD-1 low (F), hematoxylin-eosin staining (G), CD8 low (H), PD-1 low (I), hematoxylin-eosin staining (J), CD8 high (K), PD-1 high (L) in mRCC tissues. Original magnification: ×100. Abbreviations: PD-1, programmed cell death protein 1; mRCC, metastatic renal cell carcinoma. |
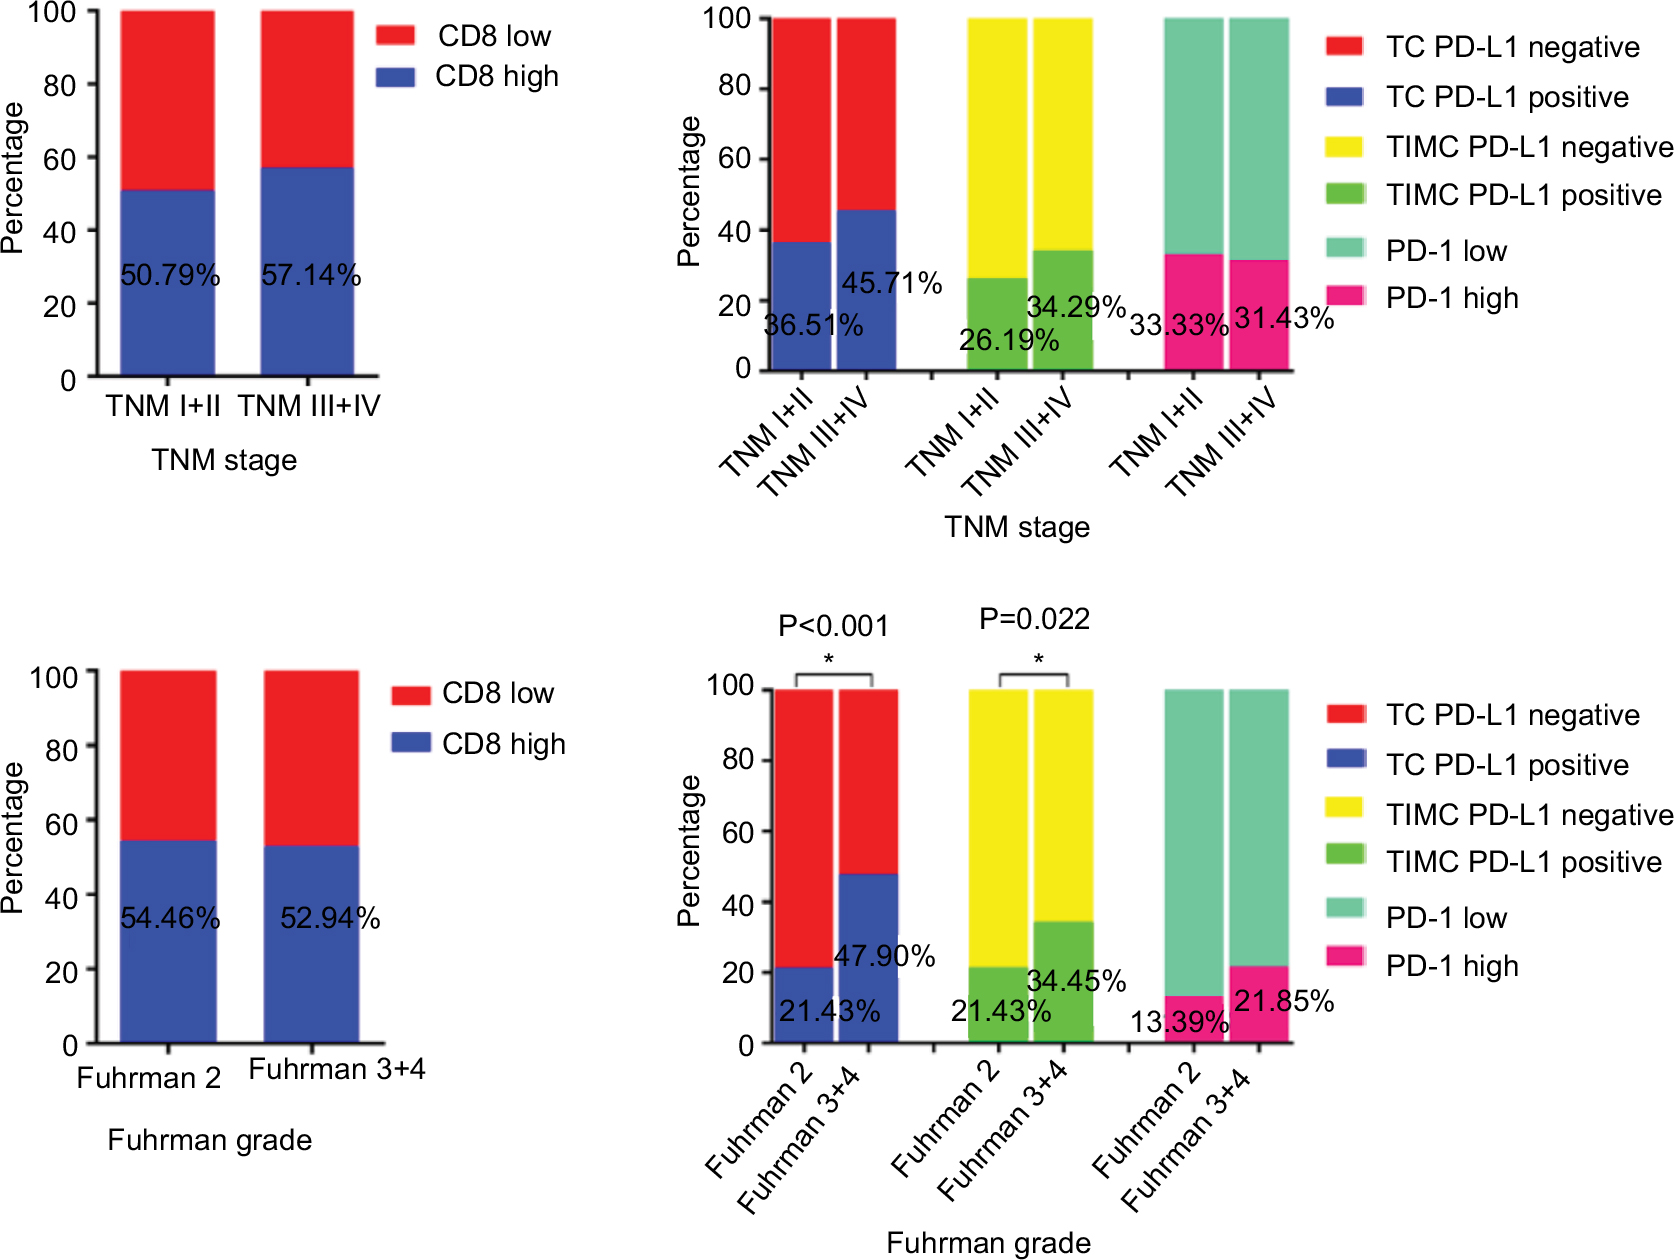 | Figure S3 Association of CD8 and checkpoint-associated molecules with initial TNM stage and Fuhrman grade. Abbreviations: PD-1, programmed cell death protein 1; PD-L1, ligand of PD-1; TC, tumor cells; TIMC, tumor infiltrating mononuclear cells. |
 | Figure S4 Kaplan-Meier curves according to CD8 and PD-1/PD-L1 level in mRCC patients treated with sunitinib or sorafenib. Notes: Kaplan–Meier analysis of OS according to CD8 in patients with sunitinib (A) and sorafenib (E), PD-1 in patients with sunitinib (B) and sorafenib (F), TC PD-L1 in patients with sunitinib (C) and sorafenib (G), TIMC PD-L1 in patients with sunitinib (D) and sorafenib (H). P-value was calculated by log-rank test. Abbreviations: PD-1, programmed cell death protein 1; PD-L1, ligand of PD-1; mRCC, metastatic renal cell carcinoma; OS, overall survival; TC, tumor cells; TIMC, tumor infiltrating mononuclear cells. |
 © 2018 The Author(s). This work is published and licensed by Dove Medical Press Limited. The
full terms of this license are available at https://www.dovepress.com/terms
and incorporate the Creative Commons Attribution
- Non Commercial (unported, 3.0) License.
By accessing the work you hereby accept the Terms. Non-commercial uses of the work are permitted
without any further permission from Dove Medical Press Limited, provided the work is properly
attributed. For permission for commercial use of this work, please see paragraphs 4.2 and 5 of our Terms.
© 2018 The Author(s). This work is published and licensed by Dove Medical Press Limited. The
full terms of this license are available at https://www.dovepress.com/terms
and incorporate the Creative Commons Attribution
- Non Commercial (unported, 3.0) License.
By accessing the work you hereby accept the Terms. Non-commercial uses of the work are permitted
without any further permission from Dove Medical Press Limited, provided the work is properly
attributed. For permission for commercial use of this work, please see paragraphs 4.2 and 5 of our Terms.